
 Open Access Article
 This Open Access Article is licensed under a Creative Commons Attribution-Non Commercial 3.0 Unported Licence
Synthesis of mesoporous zeolite Y using Sapindus rarak extract as natural organic surfactant for deoxygenation of Reutealis trisperma oil to biofuel
Abdul Aziz ab,
Berliana Gricelda Andini Putria,
Didik Prasetyoko*a,
Reva Edra Nugraha*c,
Holilah Holilahd,
Hasliza Bahrujie,
Aishah Abdul Jalilfg,
Suprapto Supraptoa,
Hartati Hartatih and
Nurul Asikin-Mijani
ab,
Berliana Gricelda Andini Putria,
Didik Prasetyoko*a,
Reva Edra Nugraha*c,
Holilah Holilahd,
Hasliza Bahrujie,
Aishah Abdul Jalilfg,
Suprapto Supraptoa,
Hartati Hartatih and
Nurul Asikin-Mijani
aDepartment of Chemistry, Faculty of Science and Data Analytics, Institut Teknologi Sepuluh Nopember, Keputih, Sukolilo, Surabaya 60111, Indonesia. E-mail: didikp@chem.its.ac.id
bDepartment of Pharmacy, Universitas Kader Bangsa, Palembang, South Sumatera 30253, Indonesia
cDepartment of Chemical Engineering, Faculty of Engineering, Universitas Pembangunan Nasional “Veteran” Jawa Timur, Surabaya, East Java 60294, Indonesia. E-mail: reva.edra.tk@upnjatim.ac.id
dResearch Center for Biomass and Bioproducts, National Research and Innovation Agency of Indonesia (BRIN), Cibinong, 16911, Indonesia
eCentre of Advanced Material and Energy Sciences, Universiti Brunei Darussalam, Jalan Tungku Link, BE 1410, Brunei
fCentre of Hydrogen Energy, Institute of Future Energy, Universiti Teknologi Malaysia, 81310, Skudai, Johor Bahru, Johor, Malaysia
gDepartment of Chemical Engineering, Faculty of Chemical and Energy Engineering, Universiti Teknologi Malaysia, 81310, Skudai, Johor Bahru, Johor, Malaysia
hDepartment of Chemistry, Faculty of Science and Technology, Universitas Airlangga, Surabaya, 60115, Indonesia
iDepartment of Chemical Sciences, Faculty of Science and Technology, Universiti Kebangsaan Malaysia, 43600 UKM Bangi, Selangor, Malaysia
First published on 6th November 2023
Abstract
Saponin is a plant-derived chemical with an amphiphilic glycoconjugate structure extracted from sapindaceae plants like Sapindus rarak. This study investigated saponin extract of Sapindus rarak as a natural template for formation of mesoporous zeolite Y. Surface area and mesoporosity of zeolite Y were improved with optimization of Sapindus rarak extract (SRE) concentration (Y-Ln; n = 2, 5, 10 or 15 mL), reaching 216.26 m2 mesoporous area and 0.214 cm3 g−1 mesoporous volume for Y-L10 samples. A different loading of Ni was impregnated onto Y-L10 zeolite to improve Lewis/Brønsted acidity as catalysts in the deoxygenation of Reutealis trisperma oil (RTO) into hydrocarbon fuels. Impregnating 15% Ni on NaY zeolite enhanced Lewis acidity to 0.4556 mmol g−1, producing 48.8% liquid oil with 85.43% degree of deoxygenation. A high selectivity towards C15 and C17 hydrocarbon was analyzed from liquid yield, indicating the contributing factor from Lewis acidity and mesoporosity to enhance deoxygenation and prevent the hydrocracking reaction.
Introduction
The global climate change and oil price volatility have revived interest in biofuel production as renewable energy. Feedstock selection is critical in forming a high-quality biofuel and ensuring the sustainability of the process. Non-edible plant oil is a preferable feedstock since it excludes the competing interest in the food sector. Since biomass is abundant in tropical countries, conversion into biofuel is projected as a way forward to achieve sustainable energy.1,2 Reutealis trisperma oil is produced in Indonesia and identified as a suitable non-edible oil for conversion to biofuel.3 The tree can grow in harsh conditions with a long production age,4 yielding seeds with up to 52% triglycerides.5 Reutealis trisperma oil conversion into biofuel requires highly selective catalysts to form liquid hydrocarbon and prevent further cracking to uncondensed gases. Metal nanoparticles on highly porous support are the essential key and play an indispensable role in heterogeneous catalytic reactions.6 Impregnation of porous acid support with Ni metal increased the number of acid sites for decarbonylation/decarboxylation of bio-oil.7 Ni exhibited a higher catalytic deoxygenation activity than Zn, Cu, Co and Fe.8 Ni20La20/AC catalyst was efficient for the deCOx reaction to produce n-(C15 + C17) hydrocarbon fractions due to the moderate density of strong acid and the low density of strong base sites.9 The binary Ni oxide and CaO created acid–base catalysts that synergically catalysed triolein deoxygenation into diesel hydrocarbons.10 Zeolite Y impregnated with Ni for deoxygenation of triolein achieved a high conversion of 76.21%, compared to Co, Cu, Mn, or Zn metals.11 However, high Ni loading caused particle agglomeration that blocked the pores, increased the cracking reaction and reduced the production of long-chain hydrocarbon.12,13 Therefore, synthesizing a highly stable mesoporous catalyst is important to achieve high Ni dispersion while preserving the mesopore structure.Zeolite Y is a crystalline aluminosilicate with faujasite (FAU) aluminosilicate structure, high surface area, and 0.9–1.2 nm micropore size. Zeolite Y has a very stable crystal framework with the distinctive three-dimensional pores of sodalite. The micropore structure provides a large surface area and high acidity, which is excellent for performing a selective chemical reaction.14 The hydrothermal process is still the primary synthesis route for many zeolites due to several benefits, such as high reactant reactivity, low energy consumption, low air pollution, simple solution control, formation of a metastable phase, and a distinctive condensation phase.15–17 Numerous attempts to synthesize mesoporous zeolite with high thermal stability have been conducted, mainly to improve the diffusion in the microporous channels.18 Micropores restrict the diffusion of large reactants and products, which lowers the catalytic activity and reduces catalytic stability. Mesoporous zeolite Y with strong acid sites has been investigated in the catalytic cracking of heavy oil. The large mesopores provide better access to highly dispersed acid sites, improving catalytic activity and stability than microporous zeolite Y. In addition to the porosity, the distribution and density of acid sites also have significant roles in deoxygenation for bio-oil production.25
The formation of mesopores in zeolite Y can be achieved via top-down (non-template) and bottom-up (template) methods (Table 1). Non-template synthesis requires post-treatment of microporous Y via desilication and dealumination using acid or thermal treatment and alkaline solutions, which produces low crystalline zeolite and large pore distribution.19,20,26 Template synthesis employed large organic molecule surfactant to create cavities during aluminosilicate arrangement. Calcination at high temperatures decomposed the organic template, resulting in the formation of large mesopores. However, an optimum concentration of mesoporous template is needed to prevent disordered mesopore structure of underdeveloped zeolite Y crystal.23 Cetyltrimethyl ammonium bromide (CTAB), organosilanes compounds like [3-(trimethoxysilyl)propyl]hexadecyl dimethyl ammonium chloride (TPHAC), polydiallyldimethyl ammonium chloride (PDDA), dimethyl-octadecyl[3-(trimethoxysilyl)propyl]ammonium chloride (TPOAC) and Pluronic F127 were frequently used to form mesopores in zeolite Y.14,22,23,27,28 The main property of mesopore template is hydrophilic tails for interacting with SiO– or AlO–, with a long hydrophobic chain to induce mesoporosity. Research is continuously searching for alternative green synthetic templates that are inexpensive, have low environmental impacts, and can be extracted from nature.29
| No. | Si and Al source | Method | Mesoporous template/reagent | Smeso (m2 g−1) | Vmeso (cm3 g−1) | Dmeso (nm) | Ref. |
|---|---|---|---|---|---|---|---|
| a Ethylenediaminetetraacetic acid.b Tetrabutylammonium hydroxide.c Polydiallyldimethyl ammonium chloride.d Dimethyl-octadecyl[3-(trimethoxysilyl)propyl] ammonium chloride. | |||||||
| 1 | Commercial NaY | Dealumination–desilication | EDTAa, NaOH | 110 | 0.18 | 15–30 | 19 |
| 2 | Commercial NaY | Desilication–dealumination | Steam 927 K, 2 h; NaOH | 23 | 0.12 | 10–100 | 20 |
| 3 | Commercial NaY | Desilication | TBAOHb | 250 | 0.22 | 5.3 | 21 |
| 4 | NaAlO2, Ludox | Commercial template | PDDAc | — | 0.13 | 3.84 | 22 |
| 5 | NaAlO2, water glass | Commercial template | TPOACd | 75 | 0.18 | 3–9 | 23 |
| 6 | NaAlO2, water glass | Commercial template | Pluronic F127 | — | 0.2 | 3.8; 6.5; 35 | 14 |
| 7 | NaAlO2, Na2SiO3 | Commercial template | TPOACd | 68 | 0.15 | 3.4 | 24 |
| 8 | Metakaolin, Ludox | Natural template | Sapindus rarak extract | 216 | 0.214 | 3.70; 6.49 | This study |
Saponin extract from Sapindus rarak fruit, locally grown in Indonesia, was traditionally used as a natural detergent for delicate fabrics. The saponin contains alkaloid compounds to function as a surfactant and reduce surface pressure by generating foam.30,31 Generally, saponin consists of amphiphilic glycoconjugate with a lipophilic tail and one or two hydrophilic glycoside chains attached to the aglycone backbone (Fig. 1a).32 The aglycone, also known as sapogenins, consists of lipophilic parts of the molecule with a steroidal or triterpene backbone. The sugar chain is commonly linked to the aglycone at C-3.33 The glucose and aglycone amphiphilic chains can be potentially used as a non-ionic template for synthesizing zeolite Y. The structure of TPOAC synthetic surfactant (Fig. 1b) shows the lipophilic and hydrophilic molecular components, similar to a mixture of non-polar lipophilic sapogenin and hydrophilic sugar chain in saponin. This study investigates Sapindus rarak extract (SRE) as an abundant, biodegradable, environmentally friendly green mesopore template.34 Optimizing SRE concentration increased the mesoporosity of zeolite Y, which is beneficial for the deoxygenation of Reutealis trisperma oil to biofuel. Modifying the synthesized mesoporous zeolite Y with Ni enhanced biofuel yield by increasing Lewis acidity.
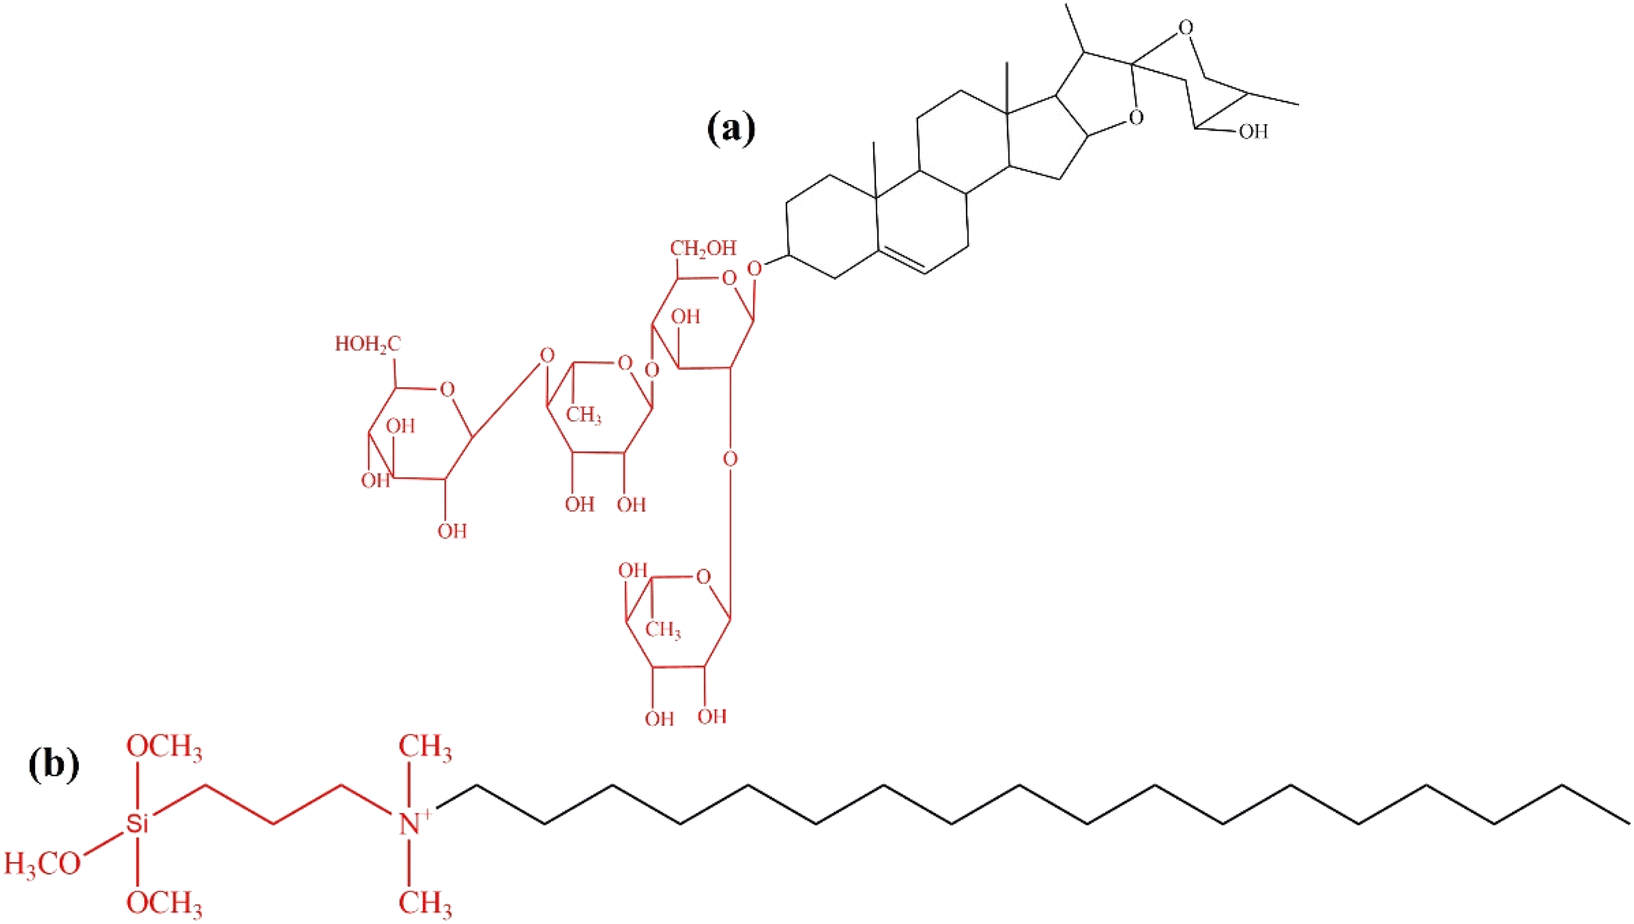 | ||
| Fig. 1 Basic molecular structure of (a) saponin and (b) dimethyl-octadecyl[3-(trimethoxysilyl)propyl]ammonium chloride (TPOAC). Hydrophilic molecular components are indicated in red, whereas lipophilic ones are displayed in black. | ||
Experimental
Materials
Kaolin Al4(OH)8(Si4O10) from Bangka island, Indonesia contained 57% of SiO2 and 22% of Al2O3, Reutealis trisperma oil (RTO) as feedstock and Sapindus rarak was acquired from a local market, NaOH (>99%) was purchased from Merck, Germany, LUDOX® HS-30 colloidal silica (30% Si in water), ammonium acetate, and nickel(II) nitrate hexahydrate (99%) were purchased from Sigma Aldrich, Germany.Extraction of Sapindus rarak
Saponin extraction from Sapindus rarak fruit was modified from the previous method.30 Sapindus rarak fruit was ground into a fine powder and dried at 60 °C overnight. The saponin was extracted by maceration method using ethanol as a solvent for two days. The ratio of the Sapindus rarak powder to ethanol is 1![[thin space (1/6-em)]](https://www.rsc.org/images/entities/char_2009.gif) :10 (10 g:100 mL). The maceration liquid was then filtered and evaporated to obtain a concentrated extract labeled as SRE (Sapindus rarak extract).
:10 (10 g:100 mL). The maceration liquid was then filtered and evaporated to obtain a concentrated extract labeled as SRE (Sapindus rarak extract).
Synthesis of mesoporous zeolite Y catalysts
Mesoporous zeolite Y was synthesized following the previously reported method with slight modification.35 The molar composition of the initial mixtures was 6 Na2O:10 SiO2:1 Al2O3:180 H2O; and an additional of SRE in mL. In the typical synthesis of zeolite Y, 4.63 g metakaolin and 4.8 g NaOH were dissolved in 24.54 mL demineralized water at room temperature and stirred until a clear solution was obtained. Different volume of SRE (2, 5, 10, and 15 mL) was added to the mixture and stirred vigorously. Then, 11.22 g Ludox (HS 30% colloidal silica) was added dropwise into the stirred solution to enhance silica concentration. The aluminosilicate gel was stirred continuously for 15 minutes before the solution was left to age for 24 h at room temperature. The resulting gel was heated at 100 °C for 24 h, washed with deionized water until the pH reached 7, and dried overnight at 80 °C. The samples were calcined at 550 °C for 5 h in the air to remove organic templates after drying. The as-synthesized zeolite Y was ion-exchanged using 1.0 M ammonium acetate solution at 1:30 of solid to liquid ratio. The powder was added into ammonium acetate solution and refluxed at 70 °C for 4 h. The zeolite was filtered, washed with deionized water, and dried at 100 °C overnight. Finally, NH4Y was calcined in static air at 550 °C for 3 h. Zeolite Y synthesized using SRE at different concentrations is denoted as Y-L2, Y-L5, Y-L10 and Y-L15.
Synthesis NiY catalyst
NiY zeolite was synthesized using the incipient wetness impregnation method on Y-L10 as support. Ni(NO3)2·6H2O at the variation of Ni loading of 5, 10, 15, and 20% was weighed and dissolved in 10 mL of distilled water (Table 2). The Y-L10 were mixed into the metal salt solution and stirred at 80 °C until it became a paste. The paste was dried at 60 °C for 12 hours, followed by calcination at 550 °C (2 °C min−1) for 1 hour under a nitrogen atmosphere and another 3 h under air. Samples impregnated with Ni are denoted as 5-NiY, 10-NiY, 15-NiY, and 20-NiY.| Ni% | Mass (g) | |
|---|---|---|
| Ni(NO3)2·6H2O | Y-L10 | |
| 5 | 0.2477 | 0.95 |
| 10 | 0.4955 | 0.9 |
| 15 | 0.7344 | 0.85 |
| 20 | 0.9910 | 0.8 |
Characterization catalysts
Catalysts were characterized using X-ray diffraction (XRD) with powder diffractometer (PHILIPS-binary X'Pert MPD, 30 mA, 40 kV). The radiation of Cu-Kα ranging 2θ = 5–50°, 0.0170° step size, and at room temperature. The Fourier Transform Infrared (FTIR) was used to analyse the functional group of the material. Before FTIR analysis, the pellets were prepared by mixing dried KBr with catalyst at ∼1 wt%, followed by grinding and pressing the powder into a disk. Meanwhile, the FTIR analysis of SRE was determined by dropping the SRE liquid into KBr disk. FTIR measurement was recorded using FTIR Shimadzu Instrument Spectrum One 8400S in the wavenumber range 4000–400 cm−1. The acidity of NiY catalysts were determined using pyridine-FTIR. The catalyst was pelleted (15 mg) and placed in tubular glass equipped with CaF2 window. The samples were heated at 400 °C for 4 h under N2 flow to remove impurities and cooled down to room temperature. The pellet was exposed to pyridine vapour until saturation. The sample was then heated at 150 °C for 3 h to remove the physisorbed pyridine and then analysed using FTIR at 1600–1400 cm−1. The morphology of the catalyst was observed using SEM (Scanning Electron Microscope FlexSEM 1000, Hitachi, Japan) at 10–15 kV. The sample was coated with Au for 15 minutes at a 6 × 10⁻² mBar pressure on a carbon tape base (ZEISS EVO MA 10, Carl Zeiss Microscopy GmbH, Jena, Germany). The SEM images were examined using ImageJ software to determine particle size distribution (40 particles were quantified from different parts of the image). The magnification of 5000× was used for each sample. The high transmission electron microscope (TEM) analysis of all catalysts was recorded using Hitachi HT-7700 TEM with 100 kV acceleration voltage. The sample was dispersed in isopropyl alcohol solution for 30 min sonication, dropped in TEM grid and dried before TEM measurement. The textural properties were determined using N2 adsorption–desorption of Quantachrome Touchwin v1.11 instrument. Quantachrome ASiQwin instrument was used to calculate the pore size distribution by Barrett–Joyner–Halenda (BJH) method. Around 0.2 g of samples was placed in tube and pretreated under vacuum at 300 °C for 1 h.Deoxygenation reaction
The catalytic deoxygenation was performed under solvent-free conditions and without external H2. The semi-batch reactor consists of 100 mL three-necked flask connected to a distillation step-up and equipped with a stirred heating mantle. Prior to the reaction, 10 g of RTO was mixed with 3% wt/wt (0.3 g) of catalyst. The mixture was purged with N2 gas to create an inert environment. The mixture was heated at 350 °C under stirring for 4 h with a constant flow of N2 at a 20 mL min−1 rate.GCMS analysis of oil and liquid products
The fatty acid composition of RTO was quantified by gas chromatography-mass spectroscopy (GC-MS). However, before GCMS analysis, RTO must be converted to fatty acid methyl ether via stoichiometric esterification reaction with methanol. RTO was mixed with an excess amount of methanol at 1:2 of oil to methanol weight ratio, and NaOH (0.1 g) in a round bottom flask connected with a reflux condenser. The mixture was stirred and heated at 65 °C for one hour to transform fatty acid into methyl ether fatty acid. The mixture was cooled down, neutralized with HCl solution, and separated using a funnel. The organic product layer containing fatty acid methyl ester was washed with distilled water and diluted with hexane. 1-Bromohexane was added as an internal standard before GCMS analysis. Similar procedures were conducted to analyse the liquid product from the deoxygenation reaction. The liquid yield was diluted with hexane and injected with 1-bromohexane as an internal standard.
For GCMS analysis, the liquid product (0.2 μL) was injected into HP 6890 GCMS with HP-5MS capillary column (30 m length; 0.25 mm inner diameter; 0.25 m film thickness). Helium was used as a carrier gas at 1.2 mL min−1 flow rate. Split injection mode was used with a split ratio of 139.0. The injection temperature was 250 °C with a heating rate of 4 °C min−1.
The product selectivity was quantified based on the GC peak area of the desired product over the total peak area according to eqn (1). Note that the selectivity is an approximation only based on product identification using mass spectroscopy.
 | (1) |
The quantity of oxygenated compound in RTO and the liquid product was used to calculate the degree of deoxygenation (DOD), as shown in eqn (2).
 | (2) |
The efficiency of deoxygenation reaction was determined by the percentage of liquid yield obtained after 4 h of reaction, relative to the initial weight of RTO oil (eqn (3)).
 | (3) |
Results and discussion
FTIR analysis of Sapindus rarak extract (SRE) and zeolite Y
The FTIR analysis from SRE provides information on the saponin functional group, which consisted of an aglycone unit linked to one or more carbohydrate chains (Fig. 2).36,37 The broad band at 3441 cm−1 was assigned to –OH stretching vibration. A low intense peak at 2922 cm−1, 1400 cm−1 and 1234 cm−1 were assigned to C–H stretching vibration, –CH3/–CH2 alkane and C–O–H bending vibration from sugar chain (glycone) in saponin structure. The absorption band at 1643 cm−1 and 1049 cm−1 attributed to C![[double bond, length as m-dash]](https://www.rsc.org/images/entities/char_e001.gif) C and C–O–C stretching vibration from aglycone in saponin.38 Low molecular weight carbohydrates, polyols, and monosaccharides are responsible for the absorption peaks at 1300–600 cm−1.39,40 Identification of glycones and aglycones functional groups in the infrared spectra of SRE indicates that the maceration method successfully extracted saponin from the Sapindus rarak fruit.
C and C–O–C stretching vibration from aglycone in saponin.38 Low molecular weight carbohydrates, polyols, and monosaccharides are responsible for the absorption peaks at 1300–600 cm−1.39,40 Identification of glycones and aglycones functional groups in the infrared spectra of SRE indicates that the maceration method successfully extracted saponin from the Sapindus rarak fruit.
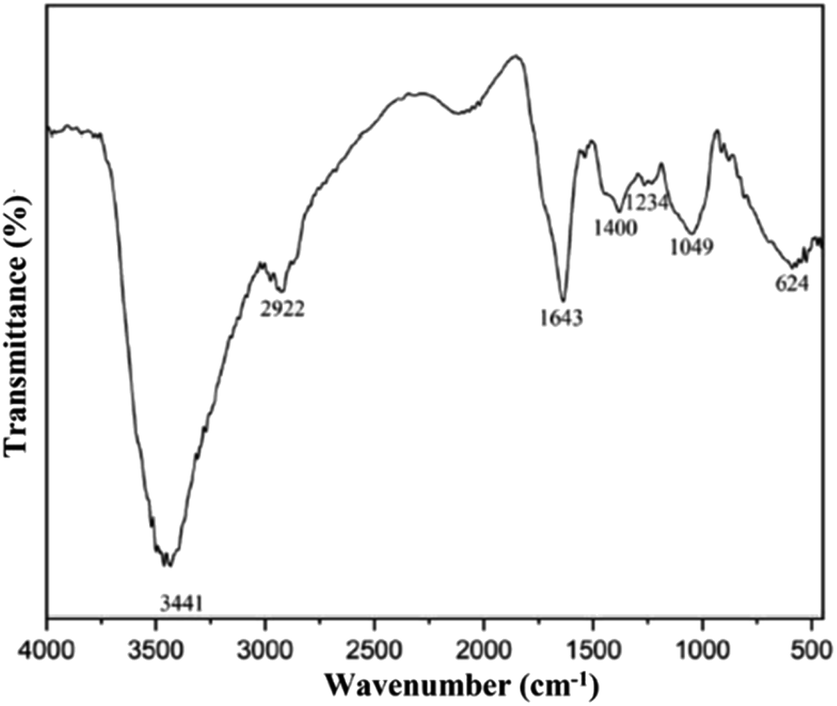 | ||
| Fig. 2 FTIR spectra of Sapindus rarak extract (SRE). | ||
FTIR analysis of mesoporous zeolite Y (Fig. 3a) revealed O–H vibration at 1640 cm−1. The band at 1020 cm−1 and 696 cm−1 were assigned to the asymmetric and asymmetric stretching vibrations of the inner TO4 structure (T = Si, Al).41 The asymmetric and symmetrical stretching vibrations of the external TO4 structure (T = Si, Al) were observed at 1135 and 776 cm−1, respectively. The structure-sensitive band of double six-ring (D6R) associated with FAU structure was observed at 576 cm−1 (Fig. 3b).14 The band 461 cm−1 is connected to the T–O bending type, which is insensitive to the TO4 tetrahedral structure (T = Si, Al). The band at 3446 cm−1 shows the stretching vibration of the O–H functional group from the adsorbed water.42 All of the mesoporous zeolite Y that has been synthesized using the SRE natural template exhibits the distinctive absorption peaks of the FAU structure, indicating that the formation of mesopores does not compromise the FAU framework.
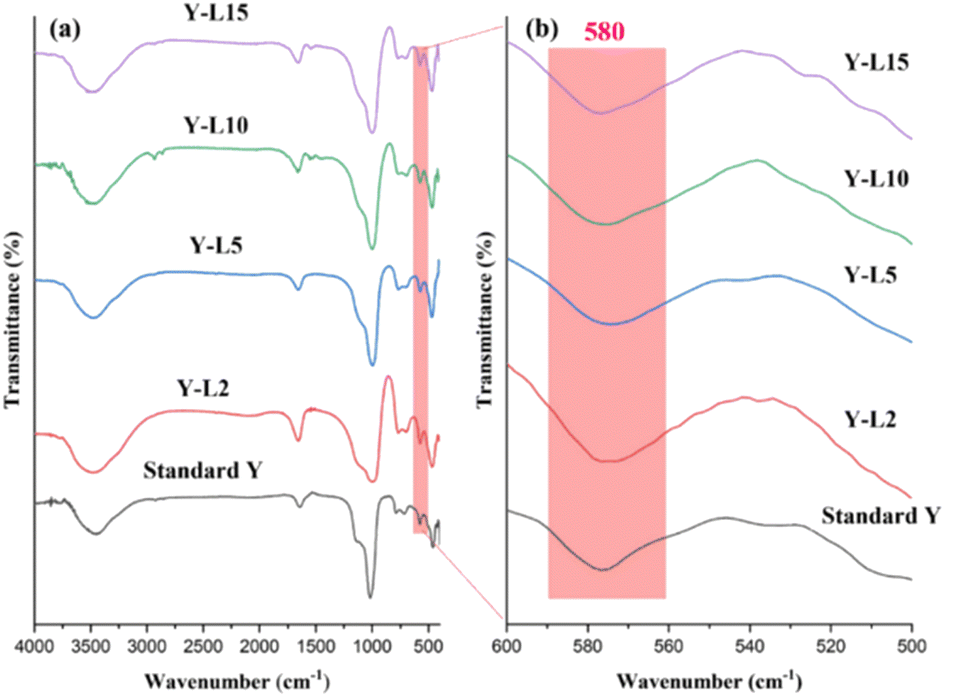 | ||
| Fig. 3 FTIR spectra of NaY framework using SRE as surfactant in different wavenumber ranges from (a) 400–4000 cm−1 and (b) 500–600 cm−1. | ||
XRD analysis of zeolite Y
The characteristic of zeolite Y crystalline structure was observed at 2θ = 6.17°; 9.97°; 12.44°; 17.64°; 21.61°; 28.02°; 33.30°; 34.84°; 37.96°; 44.11° based on JCPDS card no. 01-076-0108 (Fig. 4). However, the peak intensity reduced when a high concentration of SRE was used in the synthesis mixture, attributed to the decrease of zeolite Y crystallinity. The crystallinity of synthesized zeolite Y was compared to the standard zeolite Y, which indicated only 55.22% crystallinity for Y-L15 (Table 3). SRE mesoporous template has reduced the crystallinity of the zeolite Y, which is commonly reported on hierarchical zeolite. The crystallinity is typically not exceeding 70% in most hierarchical zeolites, including zeolite Y.43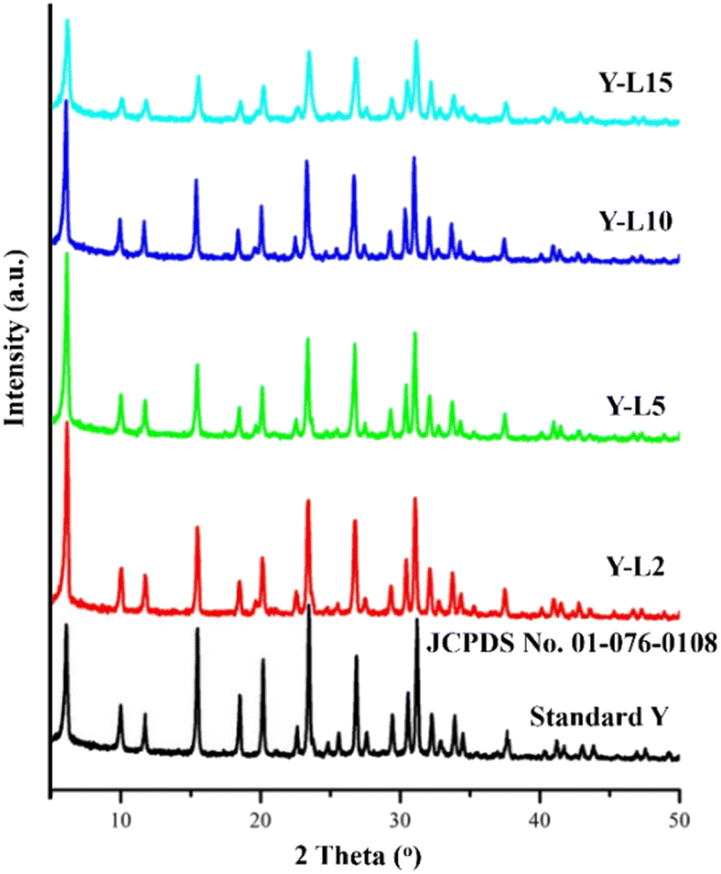 | ||
| Fig. 4 XRD analysis of commercial zeolite Y as standard zeolite, and zeolite Y synthesized using SRE at different concentration. | ||
| Catalyst | Crystallinity (%) | SBET (m2 g−1) | Smicro (m2 g−1) | Smeso (m2 g−1) | Pore volume (cm3 g−1) | D (nm) | ||
|---|---|---|---|---|---|---|---|---|
| Vmicro | Vmeso | Vtotal | ||||||
| Y standard | 100 | 371.32 | 367.68 | 3.64 | 0.191 | 0.015 | 0.206 | 3.81 |
| Y-L2 | 89.12 | 14.17 | 0.48 | 13.92 | 0.002 | 0.021 | 0.023 | 3.25 |
| Y-L5 | 81.19 | 240.56 | 118.85 | 121.71 | 0.078 | 0.124 | 0.202 | 3.72 |
| Y-L10 | 77.32 | 469.22 | 252.96 | 216.26 | 0.166 | 0.214 | 0.380 | 3.70; 6.49 |
| Y-L15 | 55.22 | 453.09 | 249.89 | 203.19 | 0.164 | 0.209 | 0.373 | 3.71; 6.48 |
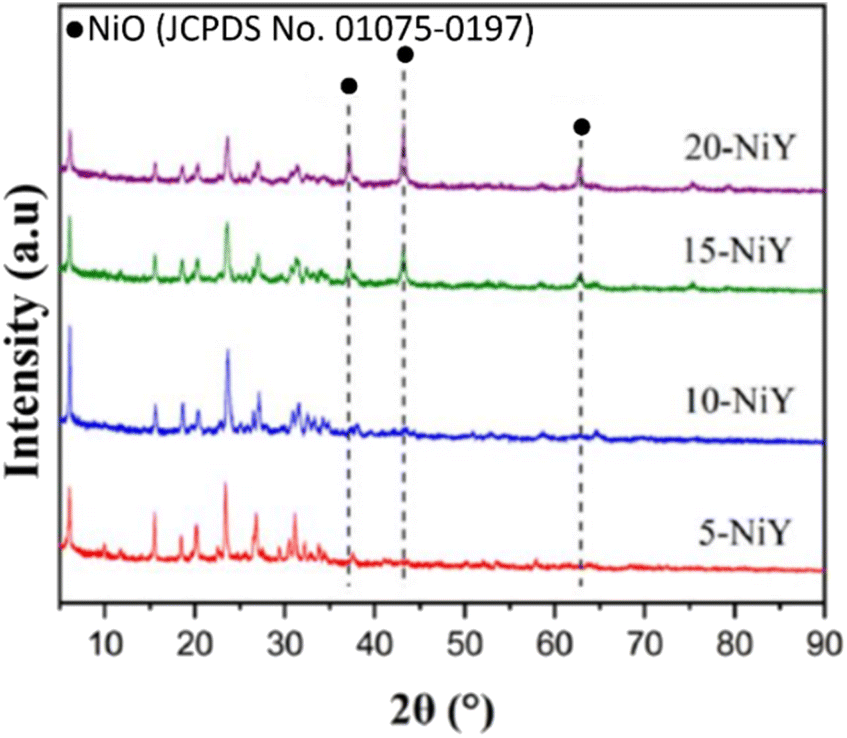
The structure and crystallinity of zeolite Y-L10 impregnated with 10% Ni (NiY-L10) were analysed by X-ray diffraction from 2θ = 5°–90° (Fig. 5). Despite the zeolite Y was undergone triple calcination stages, i.e. removal of the template, conversion to acidic zeolite and impregnation with Ni, the catalysts showed similar intensity as zeolite Y at 2θ = 6°, 10°, 12°, 15°, 17°, 21°, 24°, 31°, 27°, 30°, 34°, 37°, 44°.44 The addition of Ni metal at different weight loadings (5, 10, 15, 20%) did not significantly modify the zeolite Y structures. The characteristic peak of face centered cubic NiO was observed at 2θ = 37.25°; 43.17°; and 62.78° based on JCPDS card no. 01-075-0197. The NiO peak intensity increased at higher Ni loading.
 | ||
| Fig. 5 X-ray diffraction of 5-NiY, 10-NiY, 15-NiY, and 20-NiY. | ||
N2 adsorption–desorption analysis
The N2 adsorption–desorption isotherms and textural properties are shown in Fig. 6a and Table 3. The standard zeolite Y showed the type I isotherm typical for microporous zeolite. All zeolite Y synthesized using SRE at 2, 5, 10 and 15 mL showed type IV isotherm and hysteresis loop at P/P0 > 0.4, indicating the formation of interparticle mesoporosity. The zeolite Y-L2 showed the lowest mesoporosity with a small hysteresis loop. The surface area was higher when the synthesis was carried out using a high concentration of SRE. The mesopore area was significantly improved from 13.92 m2 g−1 in zeolite Y-L2, to reach the maximum mesopore area of 252.96 m2 g−1 in zeolite Y-L10. The formation of mesoporosity with increasing SRE concentration also inadvertently improved the micropore area to give a total SBET of 469.22 m2 g−1 for zeolite Y-L10. The mesoporous surface area is directly proportional to the mesoporous volume, which shows enhancement with the addition of SRE. The mesoporous ratio can be adjusted by varying the amount of template.23 The highest mesopore structure of zeolite Y was achieved when using 10 mL SRE, resulting in the mesopore surface area of 216.26 m2 g−1 and mesopore volume of 0.214 cm3 g−1.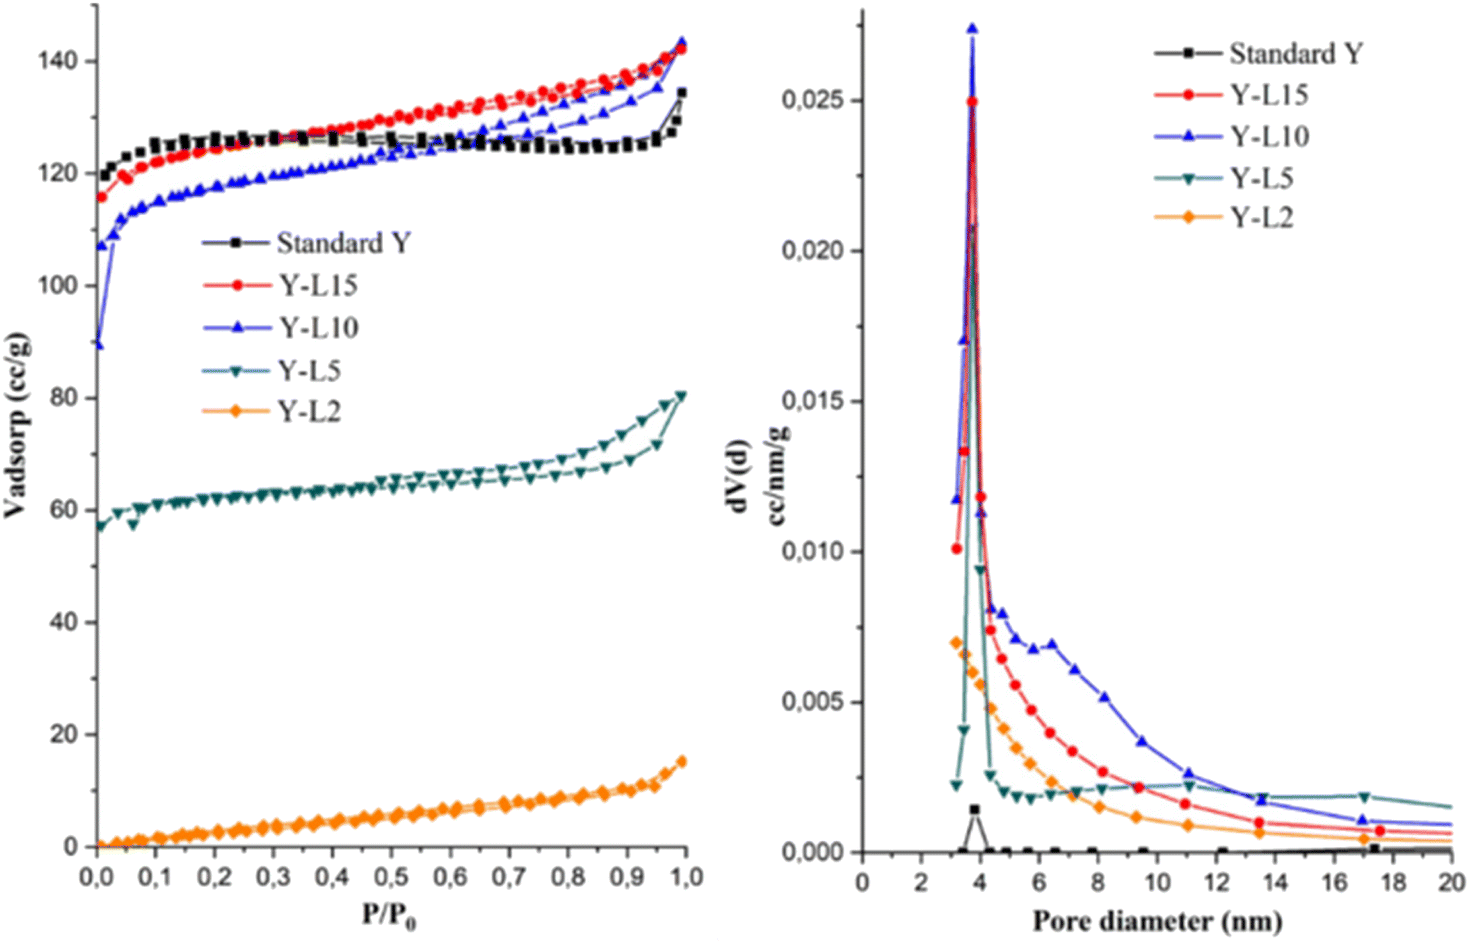 | ||
| Fig. 6 N2 adsorption–desorption isotherm (a) and pore size distribution (b) of zeolite Y synthesized using different SRE concentration. | ||
The pore size distribution of zeolite Y synthesized using SRE showed a higher pore volume than the commercial zeolite Y (Fig. 6b). According to the BJH method, the average pore diameter of commercial zeolite Y is 3.8 nm with a low pore volume since the zeolite mainly consisted of microporous structure. Following the addition of SRE, the average pore diameter of 3.25–6.48 nm was obtained on mesoporous zeolite Y. The role of surfactants on the physical properties of zeolite Y is based on its effect during micelles formation. A large number of micelles were formed in the presence of surfactant, significantly decreasing the Micelle Aggregation Number (MAN) to enhance the mesoporous surface area.27
Morphology analysis of zeolite Y using SEM and TEM
The morphology of zeolite Y synthesized at different SRE ratios and Ni–Y was analysed using SEM (Fig. 7). All zeolite Y showed similar crystal structures of non-uniform spherical crystallites. However, increasing the SRE from 2 to 15 mL significantly reduced the crystallite sizes. The SEM analysis was compared to the XRD data, which suggested that the reduced intensity of zeolite Y XRD peaks is due to the reduction of crystallite size. The particle sizes of zeolite Y and NiY catalysts were calculated using imageJ software from the SEM images with the range of 2.25 to 2.68 μm (Table 4). Similar studies were reported on zeolite Y synthesized using nanocrystalline cellulose as organic templates, resulting in a spherical morphology and particle sizes of 200–500 nm.45 The SEM and particle size distribution of NiY in Fig. 7e–h shows all the Ni–Y zeolites have similar morphology with zeolite Y, consisting of non-uniform spherical crystallites with size at 2–3 μm. The SEM-EDX elemental mapping exhibits the homogeneous distribution of Ni on the zeolite surface (Fig. 7i–l). A higher density of NiO particles were observed with the increase of Ni loading, but the catalysts maintained a high NiO dispersion with no appearance of large aggregates.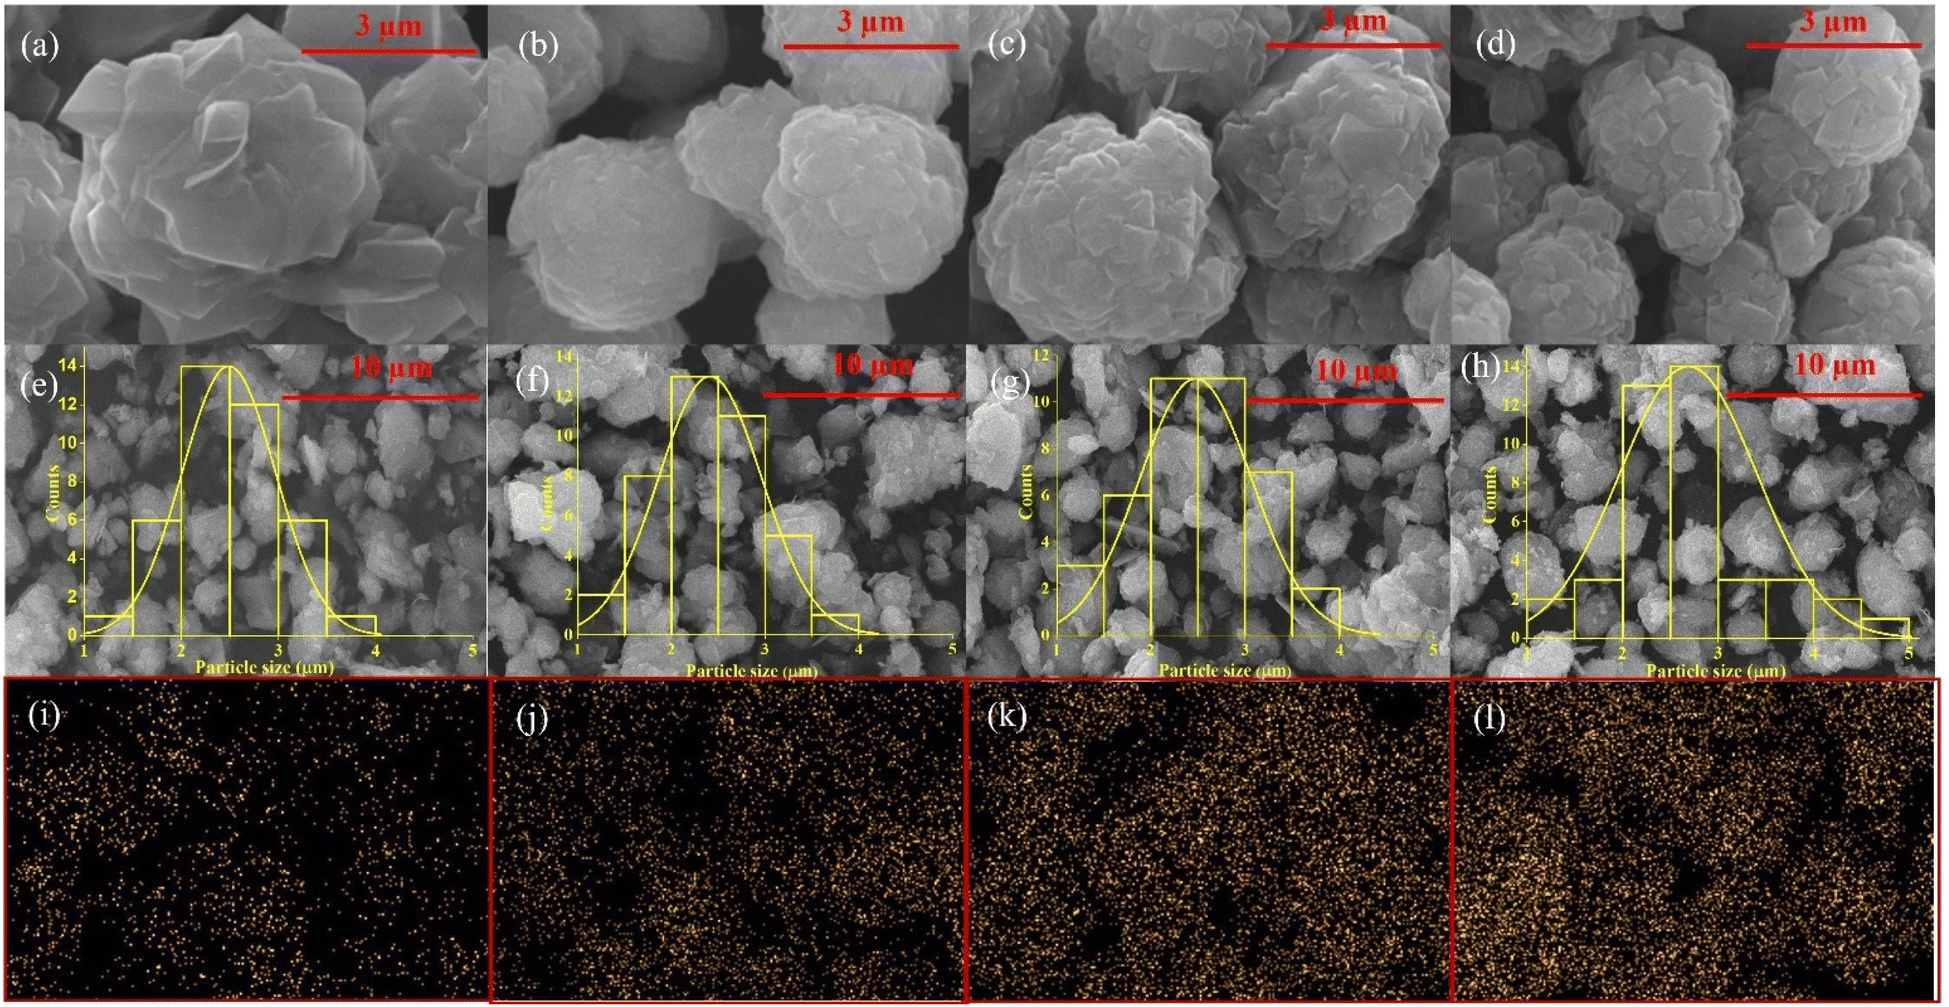 | ||
| Fig. 7 SEM analysis of (a) Y-L2, (b) Y-L5, (c) Y-L10, (d) Y-L15, and EDX analysis of (e) and (i) 5-NiY, (f) and (j) 10-NiY, (g) and (k) 15-NiY and (h) and (l) 20-NiY. | ||
| Catalyst | Particle sizea (μm) | Ni loadingb (%) | Number of acid sitesc (mmol g−1) | ||
|---|---|---|---|---|---|
| Lewis (L) | Brønsted (B) | B + L | |||
| a Calculated by ImageJ software from SEM images.b SEM-EDX analysis.c Calculated from pyridine-FTIR analysis. | |||||
| Y | 2.25 | 0 | 0.0202 | 0.0165 | 0.0367 |
| 5-NiY | 2.48 | 6.06 | 0.0599 | 0.0155 | 0.0754 |
| 10-NiY | 2.41 | 12.46 | 0.1959 | 0.0083 | 0.2042 |
| 15-NiY | 2.47 | 23.20 | 0.4556 | 0.0126 | 0.4682 |
| 20-NiY | 2.68 | 35.96 | 0.2460 | 0.0122 | 0.2582 |
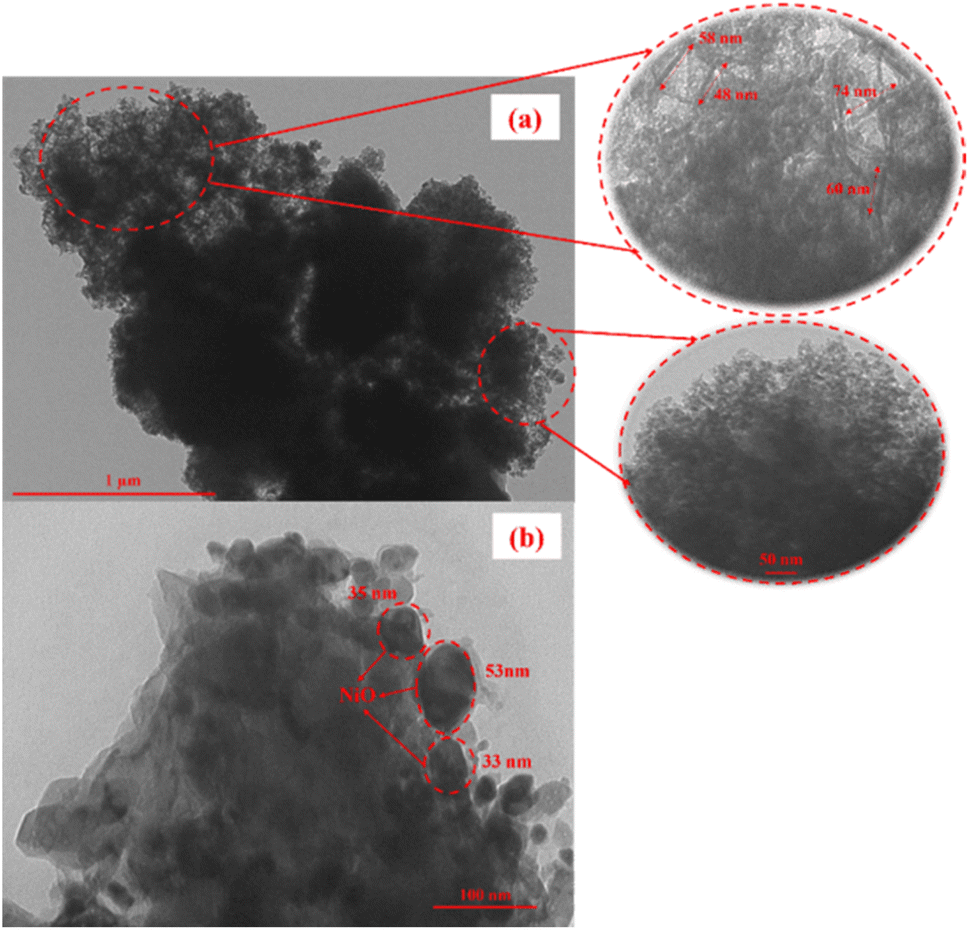
In contrast to SEM images, which show a 3-D image of the sample by capturing the original shape of the solid surfaces, TEM images construct a 2-D projection of the sample from the deep structure.46 The TEM image of the Y-L10 zeolite (Fig. 8a) displays a non-uniform shape consisting of crystalline and amorphous phases. Nanocrystalline fibers with 50–80 nm length are identified as the crystalline structures of zeolite Y. The Y-L10 zeolite also contains non-uniform clusters that form mesopores in zeolite Y. These results are in accordance with the previous study on the synthesis of zeolite with dual-porogenic surfactants which produced randomly agglomerated nanocrystals interconnected by mesopores.47 The 15-NiY zeolite (Fig. 8b) exhibits non-uniform NiO particles on mesoporous zeolite Y with a broad distribution of particle sizes. NiO was impregnated on the external surface of the support because the size of NiO crystallites exceeded the mesopore size of zeolite Y.48
 | ||
| Fig. 8 TEM analysis of (a) zeolite Y-L10 and (b) zeolite 15-NiY. | ||
Acidity of Ni/Y-L10 catalyst
Fig. 9 shows the FTIR-pyridine spectra of zeolite Y-L10 after impregnation with Ni. The calculated acidity is summarised in Table 4. The absorption band at 1450 cm−1 corresponds to the interaction of nitrogen atoms in pyridine with Lewis acid sites in the zeolite. The absorption band of pyridinium ions with Brønsted acid sites appeared at 1545 cm−1.49 Meanwhile, the absorption band at 1490 cm−1 shows the Lewis and Brønsted acid sites coordinated with pyridine. The interaction of nitrogen atoms from pyridine with Lewis acid sites from zeolite occurs due to the formation of coordinated complex bonds between the lone pair of pyridine and empty orbitals from the zeolite surface. Pyridinium ions form when pyridine binds to protons in zeolite hydroxyl groups.50 The peak intensity of the Brønsted acid site tends to be lower than that of the Lewis acid site for all synthesized zeolites. The number of Lewis acid sites increased at higher Ni loading up to 15% but was slightly reduced at 20%, presumably due to NiO agglomeration. Large NiO particles reduce pyridine interaction with acidic sites.7 Impregnation with 15% on zeolite Y generates 0.4556 mmol g−1, significantly higher than 20-NiY, 10-NiY, 5-NiY, and zeolite Y itself.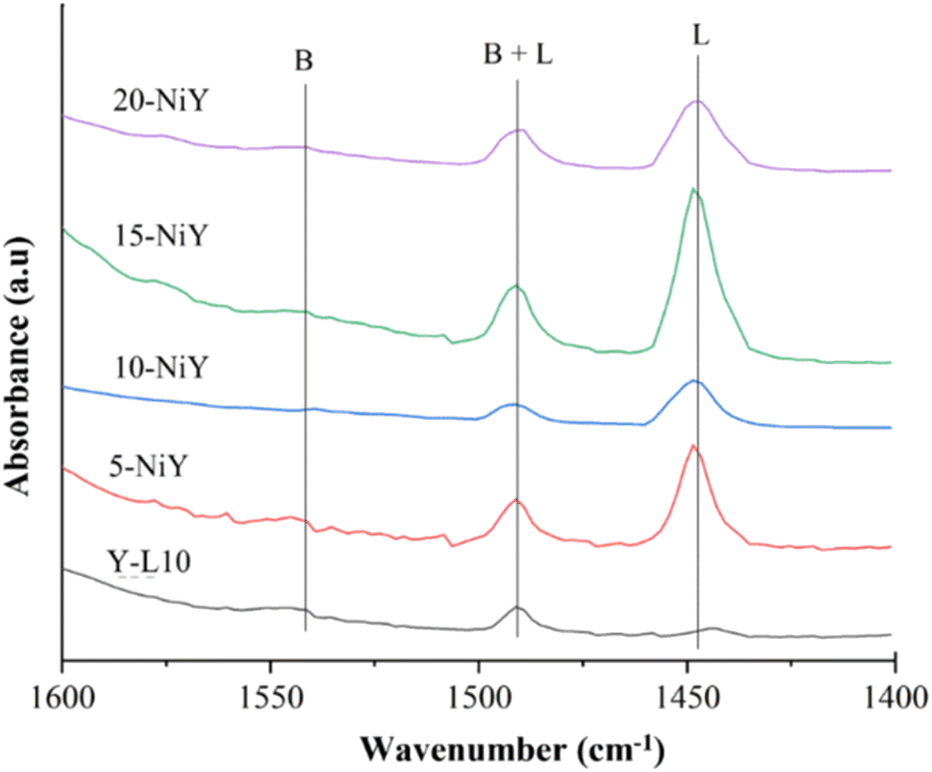 | ||
| Fig. 9 FTIR-pyridine spectra of zeolite Y-L10 and after impregnation with different wt% of Ni; 5-NiY, 10-NiY, 15-NiY, and 20-NiY. | ||
In contrast to Lewis acidity, NiO tends to reduce Brønsted acidity, presumably due to the exchange of protons in the Si–O–Al framework with Ni2+ ions. 10-NiY has the lowest number of Brønsted acid sites at 0.0083 mmol g−1. The impregnation of 15% nickel did not reduce Brønsted acid sites, indicating that the ion exchange process had exceeded saturation.51 Because NiO only increases the number of Lewis acid sites, the catalytic activity will be correlated with the effect of Lewis acidity rather than Brønsted acidity.52
Catalytic deoxygenation of RTO
RTO used in deoxygenation reaction consists of palmitic acid (C16:0; 40.35%), oleic acid (C18:1; 44.42%) and linoleic acid (C18:0; 11.84%). Theoretically, the deoxygenation reaction removes the carboxyl/carbonyl group fragments from fatty acids to form long and straight-chain hydrocarbons through a decarboxylation/decarbonylation (deCOx) mechanism.53 RTO was deoxygenated for 4 h at 350 °C under N2 flow employing a semi-batch flow reactor. The catalytic activity of RTO using Y-Ln zeolite is shown in Table 5. Blank experiment was performed without catalysts under similar reaction conditions, in which 8.95% of liquid yield was achieved. The activity was also investigated based on the degree of deoxygenation (DOD). DOD was described as the decrement of oxygenated compound concentration in the liquid products relative to the oxygenated concentration in the RTO oil. Y-L2 catalyst significantly improves DDO to 75.36% with 69.65% hydrocarbon selectivity, indicating enhancement of deoxygenation activity to remove oxygen content from parent triglyceride RTO. Zeolite Y-L10 achieved the highest performance with hydrocarbon selectivity of 77.38% and DDO of 84.37%. The results were associated with the high mesoporosity of Y-L10 that was responsible for improving the formation of long and straight-chain hydrocarbon. The presence of mesopores with diameters of 3.70 nm and 6.49 nm is beneficial to enhance the diffusion rate of reactant/product and to improve the targeted product formation.54,55 Zeolite Y-L10 catalyst appears to be effective in producing the highest hydrocarbon-like biofuel and DDO under H2-free conditions. However, the liquid yield is still relatively low, presumably due to a low number of Lewis acid sites. Therefore, Y-L10 was impregnated with Ni nanoparticles at different loading to increase catalytic activity for deoxygenation under similar conditions.| Samples | Liquid yield (%) | Shydrocarbon | DDO (%) |
|---|---|---|---|
| Blank | 8.95 | 8.24 | 47.31 |
| Y-L2 | 6.66 | 69.35 | 75.36 |
| Y-L5 | 9.19 | 76.38 | 80.06 |
| Y-L10 | 10.69 | 77.38 | 84.37 |
| Y-L15 | 17.08 | 59.99 | 72.31 |
The liquid yield increased following Ni impregnation to 48.8% at 20% Ni loading, indicating the Ni role in providing Lewis acidity in the deoxygenation of RTO to liquid products (Fig. 10).7 Lewis acidity improves the dissociation of the C–C bond in triglyceride and promotes the decarboxylation/decarbonylation (deCOx) reaction.56,57 The lowering gas and char production suggest the Ni addition enhanced stability as a result of quicker product removal and lesser coke formation owing to shorter diffusion path lengths.58
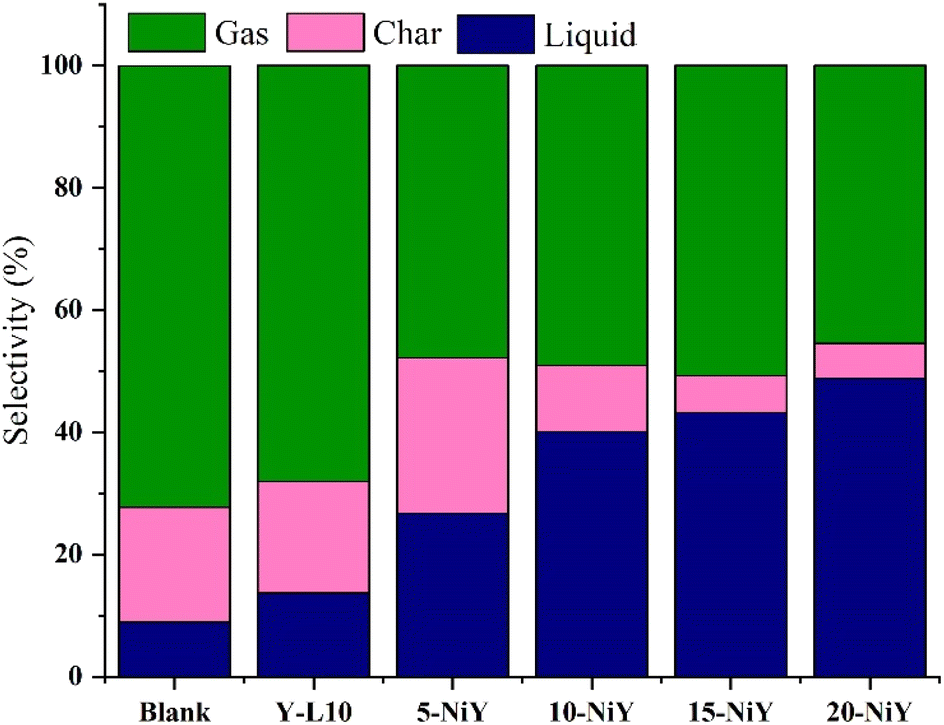 | ||
| Fig. 10 Catalytic deoxygenation of RTO using Y-L10 and Ni–Y. | ||
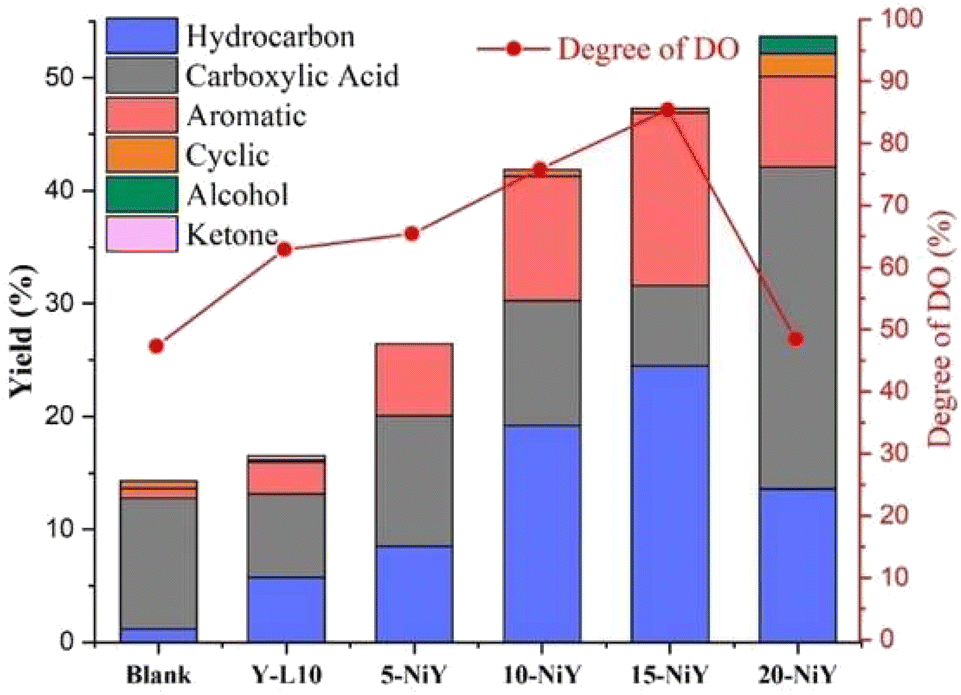
The liquid deoxygenated product was classified based on its functional group into hydrocarbon, carboxylic acid, aromatic, cyclic, alcohol and ketone (Fig. 11).
 | ||
| Fig. 11 The liquid distribution and degree of deoxygenation (DO) on using zeolite Y-L10 and Ni/Y catalysts. | ||
Ideally, in order to preserve the long chain hydrocarbon structures, the catalysts in the deoxygenation reaction should remove the oxygenated carbon in FA while blocking the hydrocracking reaction.7 The composition of liquid products obtained from 10NiY and 15NiY catalysts were dominated by hydrocarbon and aromatic compounds as the primary products. Meanwhile, the carboxylic acid was formed as a secondary product, suggesting that the deoxygenation pathway dominated the reaction. Cyclic, alcohol and ketone present at very low concentration as a tertiary product. Cyclic compounds may be formed by the cyclization of unsaturated molecules, which results in the formation of n-cycloalkanes.59,60 Some aldehydes formed as intermediate molecules can be further hydrogenated to ketone and alcohol.61 Conversely, carboxylic acid becomes the primary product when the RTO undergoes thermal cracking into short-chain carboxylic acids. Competition between hydrocarbon formation and carboxylic acid can be seen during the reaction.
Impregnation of NiO onto zeolite Y-L10 significantly increased the liquid yield and degree of deoxygenation. However, a low percentage of DOD was obtained on 20NiY due to the decrease of Lewis acidity that favoured the formation of alcohol (Fig. 9). Although 20NiY achieved a similar liquid yield as 15NiY, the high NiO loading may have resulted in particle agglomeration. The highest DOD of 85.44% was achieved on 15NiY, with less than 1% of oxygenated compound (carboxylic acid, ketone and alcohol) analysed in liquid yield.
Fig. 12 illustrates the distribution of hydrocarbon chain number and alkane/alkene composition of the liquid yield. The C15 and C17 hydrocarbon yields were significantly enhanced with increasing the Ni loading, implying that the deCOx reaction pathway is the primary reaction. Hydrocarbons C15 and C17 were produced from the removal of oxygenated carbon from the initial fatty acids of palmitic acid (C16:0), oleic acid (C18:1), and linoleic acid (C18:0). Most of the resulting hydrocarbons were saturated hydrocarbon chains (alkanes) at 75–100% selectivity. However, 20NiY showed 61.62% selectivity to unsaturated hydrocarbon (alkenes). The saturated hydrocarbon is formed through a decarboxylation reaction in which the carbonyl group is removed to generate CO2 gas. Meanwhile, the saturated hydrocarbon (alkenes) range from 0–24.7% is contributed by the decarbonylation reaction of triglyceride/fatty acids where the carbonyl group is removed to form CO gas.62
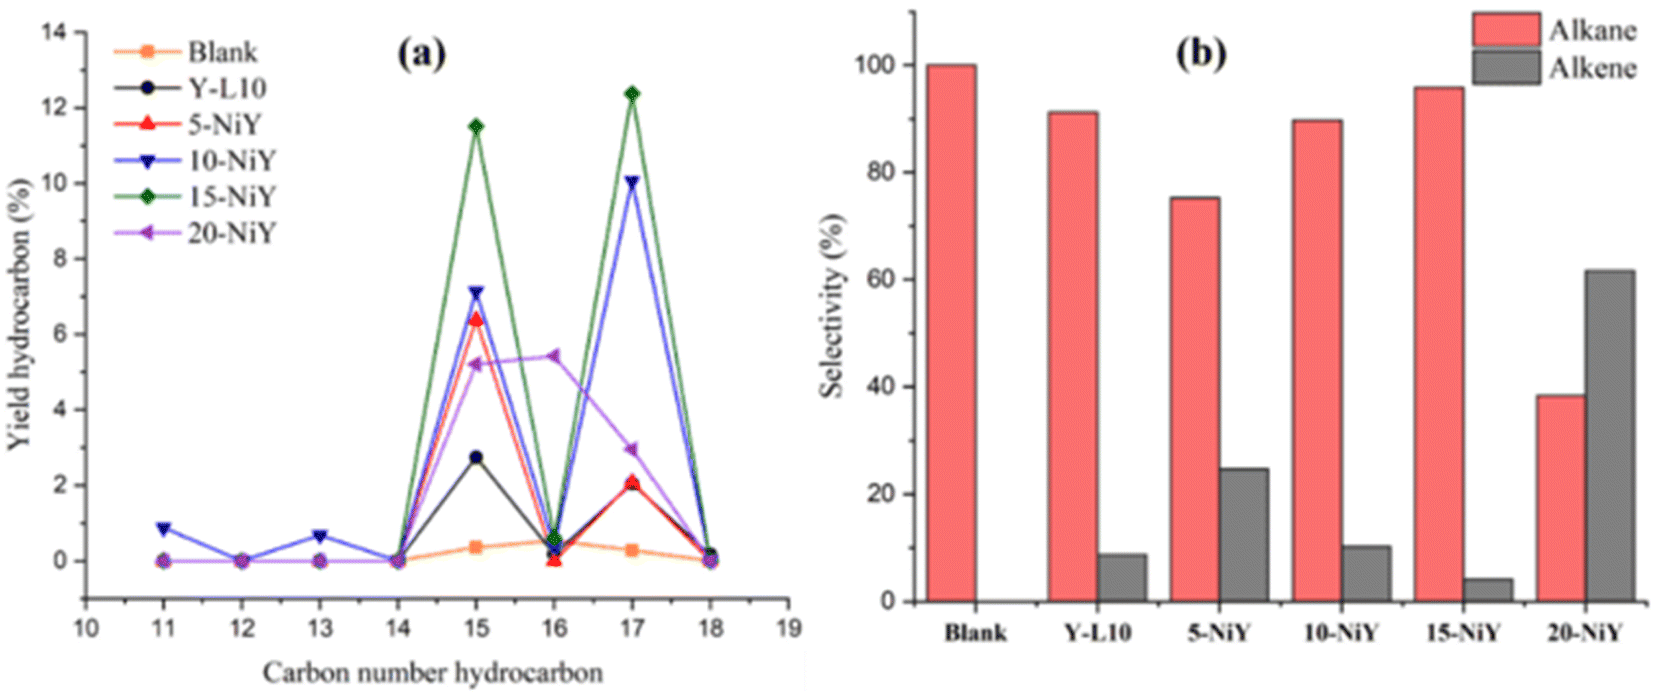 | ||
| Fig. 12 Hydrocarbon distribution (a) and alkane/alkene composition (b) of deoxygenated liquid product. | ||
Fig. 13 illustrates the proposed mechanism of RTO deoxygenation using NiY catalysts. Vegetable oil is composed of triglyceride chains of saturated and unsaturated fatty acids. The mechanism of the deoxygenation reaction can be described by the termination of C–C bonds in triglycerides through β-elimination of hydrogen to form 1 unit of oleic acid.63 Lewis acidity has a more significant role in the abstraction of hydride ions than Brønsted acid.64 The resulting oleic acid undergoes a cracking reaction on the terminal carbon (–CH2), leading to a shorter saturated carboxylic acid.65 These steps become dominant at 20% Ni loading, presumably the saturation of mesopore area with Ni particles that prevent efficient diffusion of oleic acid. More extended residence in the clogged mesopores due to slower product diffusion leads to the thermal cracking of oleic acid into shorter-chain carboxylic acids. The decarboxylation/decarbonylation (deCOx) reaction of oleic acid removes the carbonyl group as CO2 or CO gases, resulting in hydrocarbon with one less carbon chain from the oleic acid.
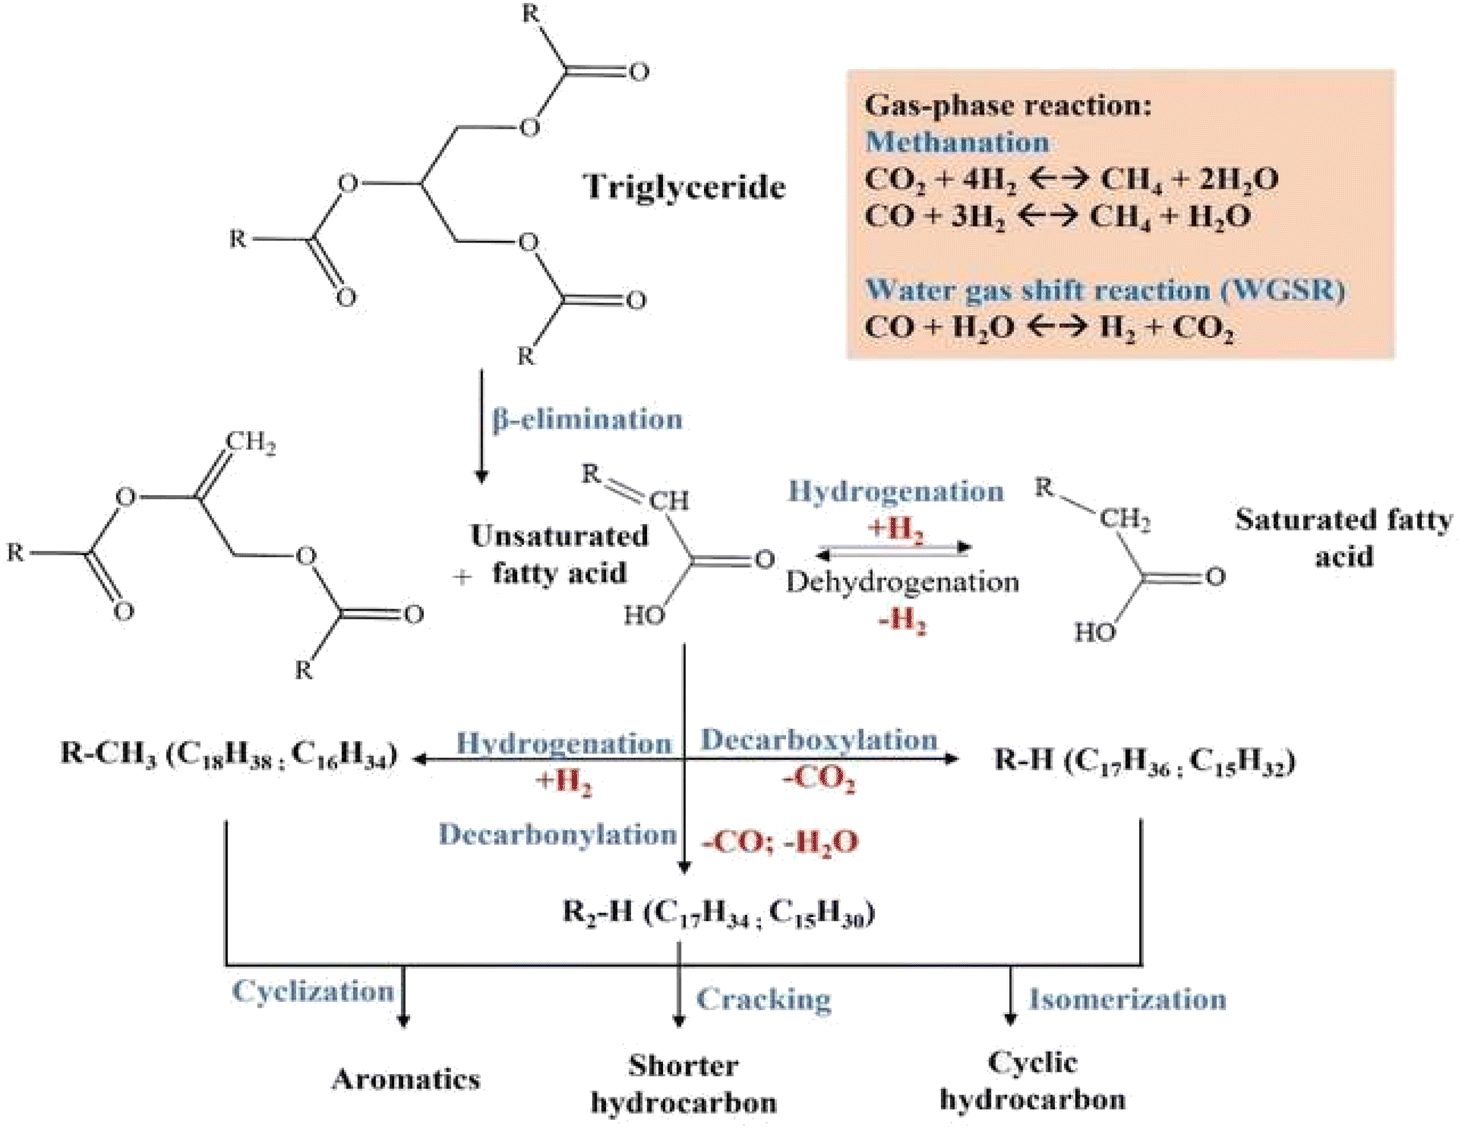 | ||
| Fig. 13 Proposed reaction mechanism of RTO deoxygenation using NiY catalyst. | ||
Hydrogen promotes the hydrogenation of unsaturated fatty acid to the saturated fatty acid. Hydrogenation is a reversible process in which dehydrogenation of saturated fatty acid forms unsaturated fatty acid, releasing H2 gas.66 The selectivity of alkane and alkene is influenced by the properties of the catalyst and the reaction conditions.67 The CO2, CO, hydrogen, and water produced by liquid phase decarboxylation/decarbonylation will be subjected to gas phase reactions such as methanation or water-gas shift reactions. Cyclic and aromatic compounds were produced in liquid deoxygenation products but at a low composition. Cyclization reactions of unsaturated compounds formed n-cycloalkanes.59,60 The formation of mono-aromatic compounds involves the dehydrogenation of cycloalkane compounds. Meanwhile, polyaromatics are formed through polymerization and dehydrogenation reactions of mono-aromatic compounds or intramolecular radical cyclization mechanisms.68,69
Conclusions
Saponin extract from Sapindus rarak fruit was utilized as a natural surfactant for mesopores formation in zeolite Y. The amphiphilic structure of glycone and aglycone in saponin generates strong interaction with SiO– or AlO–, while the hydrophobic chain induces mesoporosity. The increase in SRE concentration improves zeolite Y mesoporosity, achieving 216.26 m2 g−1 of mesoporous surface area and 0.214 cm3 g−1 of mesoporous volume. High mesoporosity enhanced hydrocarbon selectivity from the deoxygenation of RTO. Impregnation of NiO further increased the catalytic deoxygenation of RTO to liquid biofuel due to the elevated Lewis acidity that enhanced the catalytic conversion of RTO into long-chain hydrocarbon via decarboxylation–decarbonylation routes.Author contributions
Abdul Aziz: data curation, formal analysis, investigation, writing – original draft; Berliana Gricelda Andini Putri: data curation, investigation; Didik Prasetyoko: conceptualization, supervision, validation, funding acquisition, writing – review & editing; Reva Edra Nugraha: formal analysis, visualization, writing – review & editing; Holilah Holilah: validation, visualization; Hasliza Bahruji: validation, writing – review & editing; Aishah Abdul Jalil: supervision, writing – review & editing; Suprapto Suprapto: supervision, validation, writing – review & editing; Hartati Hartati: writing – review & editing; Nurul Asikin Mijan: writing – review & editing.Conflicts of interest
There are no reported financial or personal conflicts of interest by the authors of this study.Acknowledgements
The authors would like to acknowledge the National Research and Innovation Agency of Republic Indonesia (BRIN) and the Educational Fund Management Institution (LPDP) of Republic Indonesia for the financial support under Riset dan Inovasi untuk Indonesia Maju (RIIM) research grant with contract number of 82/II.7/HK/2022 and ITS - Outbound Researcher Mobility.Notes and references
- M.-Y. Choo, L. E. Oi, T. C. Ling, E.-P. Ng, Y.-C. Lin, G. Centi and J. C. Juan, J. Anal. Appl. Pyrolysis, 2020, 147, 104797 CrossRef CAS.
- M. Li, S. Xing, L. Yang, J. Fu, P. Lv, Z. Wang and Z. Yuan, Appl. Catal., A, 2019, 587, 117112 CrossRef CAS.
- T. M. I. Riayatsyah, H. C. Ong, W. T. Chong, L. Aditya, H. Hermansyah and T. M. I. Mahlia, Energies, 2017, 10, 1–21 CrossRef.
- K. Kusmiyati, D. Prasetyoko, S. Murwani, M. N. Fadhilah, T. P. Oetami, H. Hadiyanto, W. Widayat, A. Budiman and A. Roesyadi, Energies, 2019, 12, 2–11 CrossRef.
- H. Holilah, D. Prasetyoko, T. P. Oetami, E. B. Santosa, Y. M. Zein, H. Bahruji, H. Fansuri, R. Ediati and J. Juwari, Biomass Convers. Biorefin., 2014, 5, 347–353 CrossRef.
- A. Kumar and Q. Xu, ChemNanoMat, 2018, 4, 28–40 CrossRef CAS.
- R. E. Nugraha, D. Prasetyoko, H. Bahruji, S. Suprapto, N. Asikin-Mijan, T. P. Oetami, A. A. Jalil, D.-V. N. Vo and T.-Y. Yun Hin, RSC Adv., 2021, 11, 21885–21896 RSC.
- R. S. R. M. Hafriz, I. Nor Shafizah, A. Salmiaton, N. A. Arifin, R. Yunus, Y. H. Taufiq Yap and S. Abd Halim, Arabian J. Chem., 2020, 13, 8146–8159 CrossRef CAS.
- W. N. Adira Wan Khalit, T. S. Marliza, N. Asikin-Mijan, M. S. Gamal, M. I. Saiman, M. L. Ibrahim and Y. H. Taufiq-Yap, RSC Adv., 2020, 10, 37218–37232 RSC.
- N. Asikin-Mijan, H. V Lee, J. C. Juan and A. R. Noorsaadah, RSC Adv., 2017, 46445–46460 RSC.
- M. Y. Choo, L. E. Oi, T. C. Ling, E. P. Ng, Y. C. Lin, G. Centi and J. C. Juan, J. Anal. Appl. Pyrolysis, 2020, 147, 104797 CrossRef CAS.
- J. Han, J. Cho, J. C. Kim and R. Ryoo, ACS Catal., 2018, 8, 876–879 CrossRef CAS.
- N. Asikin-Mijan, J. M. Ooi, G. AbdulKareem-Alsultan, H. V. Lee, M. S. Mastuli, N. Mansir, F. A. Alharthi, A. A. Alghamdi and Y. H. Taufiq-Yap, J. Cleaner Prod., 2020, 249, 119381 CrossRef CAS.
- J. Zhao, Y. Yin, Y. Li, W. Chen and B. Liu, Chem. Eng. J., 2016, 284, 405–411 CrossRef CAS.
- J. Bae, J. Cho, J. H. Lee, S. M. Seo and S. B. Hong, Angew. Chem., Int. Ed., 2016, 55, 7369–7373 CrossRef CAS PubMed.
- T. Abdullahi, Z. Harun and M. H. D. Othman, Adv. Powder Technol., 2017, 28, 1827–1840 CrossRef CAS.
- A. Khaleque, M. M. Alam, M. Hoque, S. Mondal, J. Bin Haider, B. Xu, M. A. H. Johir, A. K. Karmakar, J. L. Zhou, M. B. Ahmed and M. A. Moni, Environ. Adv., 2020, 2, 100019–100040 CrossRef.
- J. Zhao, G. Wang, L. Qin, H. Li, Y. Chen and B. Liu, Catal. Commun., 2016, 73, 98–102 CrossRef CAS.
- F. Tian, Q. Shen, Z. Fu, Y. Wu and C. Jia, Fuel Process. Technol., 2014, 128, 176–182 CrossRef CAS.
- Z. Qin, B. Shen, Z. Yu, F. Deng, L. Zhao, S. Zhou, D. Yuan, X. Gao, B. Wang, H. Zhao and H. Liu, J. Catal., 2013, 298, 102–111 CrossRef CAS.
- M. Gackowski, K. Tarach, Ł. Kuterasi, J. Podobi, S. Jarczewski, P. Ku and J. Datka, Micropo, 2018, 263, 282–288 CAS.
- A. A. Dabbawala, I. Ismail, B. V. Vaithilingam, K. Polychronopoulou, G. Singaravel, S. Morin, M. Berthod and Y. Al Wahedi, Microporous Mesoporous Mater., 2020, 303, 110261 CrossRef CAS.
- J. Jin, C. Peng, J. Wang, H. Liu, X. Gao, H. Liu and C. Xu, Ind. Eng. Chem. Res., 2014, 53, 3406–3411 CrossRef CAS.
- M. Y. Choo, L. Eng Oi, Y. C. Lin, T. Chuan Ling, E. P. Ng, W. H. Chen, C. Kui Cheng and J. Ching Juan, Fuel, 2022, 322, 124208 CrossRef CAS.
- A. Veses, B. Puértolas, J. M. López, M. S. Callén, B. Solsona and T. García, ACS Sustain. Chem. Eng., 2016, 4, 1653–1660 CrossRef CAS.
- A. Maghfirah, M. M. Ilmi, A. T. N. Fajar and G. T. M. Kadja, Mater. Today Chem., 2020, 17, 100348–100368 CrossRef.
- J. Q. Wang, Y. X. Huang, Y. Pan and J. X. Mi, Microporous Mesoporous Mater., 2016, 232, 77–85 CrossRef CAS.
- V. J. Inglezakis, S. G. Poulopoulos and H. Kazemian, Microporous Mesoporous Mater., 2018, 272, 166–176 CrossRef CAS.
- J. Cheng, Z. Zhang, X. Zhang, J. Liu, J. Zhou and K. Cen, Int. J. Hydrogen Energy, 2019, 44, 1650–1658 CrossRef CAS.
- Y. Silviani, Bioteknologi, 2017, 14, 16–18 Search PubMed.
- J. Wisetkomolmat, P. Suppakittpaisarn and S. R. Sommano, Resources, 2019, 8, 1–14 CrossRef.
- A. Nafiunisa, N. Aryanti and D. H. Wardhani, Bull. Chem. React. Eng. Catal., 2019, 14, 468–477 CrossRef CAS.
- M. Kjellin and I. Johansson, Surfactants from Renewable Resources, 2010 Search PubMed.
- N. Aryanti, A. Nafiunisa, T. D. Kusworo and D. H. Wardhani, Environ. Technol. Innovation, 2021, 22, 101450 CrossRef CAS.
- N. A. Sholeha, L. Jannah, H. N. Rohma, N. Widiastuti, D. Prasetyoko, A. A. Jalil and H. Bahruji, Clays Clay Miner., 2020, 68, 513–523 CrossRef.
- A. I. Aqib, K. Atta, A. Muneer, M. Arslan, M. Shafeeq and K. Rahim, in Application of Natural Products in SARS-CoV-2, Academic Press Inc., 2023, pp. 25–46 Search PubMed.
- G. P. Savage, in Saponins, Academic Press Inc., 1993, pp. 5095–5098 Search PubMed.
- M. S. Almutairi and M. Ali, Nat. Prod. Res., 2015, 29, 1271–1275 CrossRef CAS PubMed.
- Z. Cao, Z. Wang, Z. Shang and J. Zhao, PLoS One, 2017, 12, 1–14 Search PubMed.
- C. Yuan, Y. Li, Q. Li, R. Jin and L. Ren, Open Life Sci., 2018, 13, 56–63 CAS.
- J. Zhao, Y. Yin, Y. Li, W. Chen and B. Liu, Chem. Eng. J., 2016, 284, 405–411 CrossRef CAS.
- N. A. Sholeha, S. Mohamad, H. Bahruji, D. Prasetyoko, N. Widiastuti, N. A. Abdul Fatah, A. A. Jalil and Y. H. Taufiq-Yap, RSC Adv., 2021, 11, 16376–16387 RSC.
- O. S. Travkina, M. R. Agliullin, N. A. Filippova, A. N. Khazipova, I. G. Danilova, N. G. Grigor'Eva, N. Narender, M. L. Pavlov and B. I. Kutepov, RSC Adv., 2017, 7, 32581–32590 RSC.
- F. B. Derekaya and G. Yaşar, Catal. Commun., 2011, 13, 73–77 CrossRef CAS.
- S. Abdulridha, Y. Jiao, S. Xu, R. Zhang, Z. Ren, A. A. Garforth and X. Fan, Appl. Catal., A, 2021, 612, 117986 CrossRef CAS.
- J. Zhao and X. Liu, in Encyclopedia of Soils in the Environment, Elsevier, 2nd edn, 2023, pp. 575–588 Search PubMed.
- K. Moukahhal, L. Josien, H. Nouali, J. Toufaily, T. Hamieh, T. J. Daou and B. Lebeau, Crystals, 2020, 10, 1–15 CrossRef.
- M. E. Gálvez, A. Albarazi and P. Da Costa, Appl. Catal., A, 2015, 504, 143–150 CrossRef.
- X. Li, D. Han, H. Wang, G. Liu, B. Wang, Z. Li and J. Wu, Fuel, 2015, 144, 9–14 CrossRef CAS.
- A. Platon and W. J. Thomson, Ind. Eng. Chem. Res., 2003, 42, 5988–5992 CrossRef CAS.
- S. Moussa, P. Concepción, M. A. Arribas and A. Martínez, Appl. Catal., A, 2020, 608, 117831 CrossRef CAS.
- A. Martínez, M. A. Arribas, P. Concepción and S. Moussa, Appl. Catal., A, 2013, 467, 509–518 CrossRef.
- G. A. Alsultan, N. Asikin-Mijan, H. V. Lee, A. S. Albazzaz and Y. H. Taufiq-Yap, Energy Convers. Manage., 2017, 151, 311–323 CrossRef CAS.
- M. Bertero, J. R. García, M. Falco and U. Sedran, BioEnergy Res., 2022, 15, 1327–1341 CrossRef CAS.
- S. Xue, Z. Luo, H. Sun and W. Zhu, Bioresour. Technol., 2022, 364, 128081 CrossRef CAS PubMed.
- S. Wang, C. Yuan, S. Esakkimuthu, L. Xu, B. Cao, A. El-Fatah Abomohra, L. Qian, L. Liu and Y. Hu, J. Anal. Appl. Pyrolysis, 2019, 141, 104633 CrossRef CAS.
- K. W. Jeon, H. S. Na, Y. L. Lee, S. Y. Ahn, K. J. Kim, J. O. Shim, W. J. Jang, D. W. Jeong, I. W. Nah and H. S. Roh, Fuel, 2019, 258, 116179 CrossRef CAS.
- A. A. Rownaghi, F. Rezaei and J. Hedlund, Microporous Mesoporous Mater., 2012, 151, 26–33 CrossRef CAS.
- A. Vasseur, J. Bruffaerts and I. Marek, Nat. Chem., 2016, 8, 209–219 CrossRef CAS PubMed.
- S. Fegade, B. Tande, A. Kubátová, W. Seames and E. Kozliak, Ind. Eng. Chem. Res., 2015, 54, 9657–9665 CrossRef CAS.
- L. Hermida, A. Zuhairi and A. Rahman, Renewable Sustainable Energy Rev., 2015, 42, 1223–1233 CrossRef CAS.
- X. Y. Ooi, L. E. Oi, M. Y. Choo, H. C. Ong, H. V. Lee, P. L. Show, Y. C. Lin and J. C. Juan, Fuel Process. Technol., 2019, 194, 106120 CrossRef CAS.
- S. Zulkepli, J. C. Juan, H. V. Lee, N. S. A. Rahman, P. L. Show and E. P. Ng, Energy Convers. Manage., 2018, 165, 495–508 CrossRef CAS.
- B. Wang, C. Han, Q. Zhang, C. Li, C. Yang and H. Shan, Energy Fuels, 2015, 29, 5701–5713 CrossRef CAS.
- V. A. Yakovlev, S. A. Khromova, O. V. Sherstyuk, V. O. Dundich, D. Y. Ermakov, V. M. Novopashina, M. Y. Lebedev, O. Bulavchenko and V. N. Parmon, Catal. Today, 2009, 144, 362–366 CrossRef CAS.
- L. Hermida, A. Z. Abdullah and A. R. Mohamed, Renewable Sustainable Energy Rev., 2015, 42, 1223–1233 CrossRef CAS.
- J. Chen, H. Shi, L. Li and K. Li, Appl. Catal., B, 2014, 144, 870–884 CrossRef CAS.
- A. Kubátová, J. Ŝávová, W. S. Seames, Y. Luo, S. M. Sadrameli, M. J. Linnen, G. V. Baglayeva, I. P. Smoliakova and E. I. Kozliak, Energy Fuels, 2012, 26, 672–685 CrossRef.
- J. Asomaning, P. Mussone and D. C. Bressler, J. Anal. Appl. Pyrolysis, 2014, 105, 1–7 CrossRef CAS.
| This journal is © The Royal Society of Chemistry 2023 |