 Open Access Article
Synergistic effect of a Bi2Zr2O7 and hydroxyapatite composite: organic pollutant remediation, antibacterial and electrochemical sensing applications†
K. Pompapathiab,
K. S. Anantharaju*ac,
B. S. Surendrac,
S. Meenac,
B. Umac,
Arpita Paul Chowdhury*c and
H. C. Ananda Murthy *de
*de
aDr. D. Premachandra Sagar Centre for Advanced Materials, Dayananda Sagar College of Engineering, Shavige Malleshwara Hills, Kumaraswamy Layout, Bengaluru 560111, India. E-mail: iamananth4477@gmail.com
bDepartment of Material Science, Mangalore University, Mangalagangotri, Mangalore 574199, Karnataka, India
cDepartment of Chemistry, Dayananda Sagar College of Engineering, Shavige Malleshwara Hills, Kumaraswamy Layout, Bengaluru 560111, India. E-mail: chemarpitachowdhury@gmail.com
dDepartment of Applied Chemistry, School of Applied Natural Science, Adama Science and Technology University, Adama, P O Box 1888, Ethiopia. E-mail: anandkps350@gmail.com
eDepartment of Prosthodontics, Saveetha Dental College & Hospital, Saveetha Institute of Medical and Technical Science (SIMATS), Saveetha University, Chennai 600077, Tamil Nadu, India
First published on 25th September 2023
Abstract
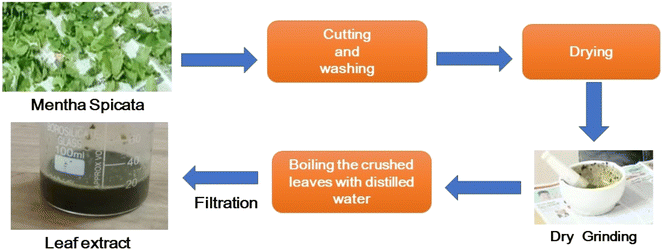
Global concern regarding the energy crisis and environmental pollution is increasing. The fabrication of efficient catalysts remains a long-term goal. Recently, green synthesis methods for catalyst fabrication have attracted the scientific community. Herein, a simple approach to synthesize bismuth zirconate-hydroxyapatite (BZO-HA) nanocomposites using Mentha spicata (mint) leaves as a reducing agent via a combustion method has been reported. The use of a green reducing agent provided economic attributes to this work. Among the prepared samples, the BZO-HA (20%) composite exhibited superior photocatalytic activity. The photodegradation efficiency of the composite reached 90.3% and 98.4% for methylene blue (MB) and rose Bengal (RB) dyes, respectively. The results showed the excellent optical performance of the prepared composites. The constructed sensor (BZO-HA 20%) for the very first time showed outstanding selectivity and performance towards sensing lead nitrate and dextrose compared to bare bismuth zirconate (BZO) and hydroxyapatite (HA). A three-electrode system using 0.1 M KCl was used for the study. The synthesized composite BZO-HA (20%) can sense lead nitrate and dextrose over the concentration range of 1–5 mM in the potential range from −1.0 V to +1.0 V. The BZO-HA composite was also investigated against Gram-negative (S. typhi) and Gram-positive (S. aureus) bacteria for antibacterial activity studies. Enhanced antibacterial activity was observed compared to bare BZO and HA catalysts. Thus, the prepared BZO-HA nanocomposite exhibited multifunctional applications.
1 Introduction
Recently, energy shortages, and environmental pollution have become major concerns for sustainable environmental development. The research community is fascinated by the unique properties of nanomaterials. Hence, there has been a rapid increase in the synthesis of nanomaterials and their applications in electronics, environmental remediation, medicine, clothing, pesticides, and fertilizers are being explored.1 Water streams from industrial waste containing organic dyes, pharmaceutical compounds, and pesticides are considered an environmental hazard.2 The organic solutions, especially dyes, affect the aquatic environment due to reduced penetration of light in the water stream. Among the industrial dyes, rose bengal (anionic dye) and methylene blue (cationic dye) are carcinogenic organic molecules used in various industries.3,4 So far, various nanomaterials have been explored for potential application.Bismuth-based oxides with formula A2B2O7 belong to the pyrochlore structural family and have shown potentiality for photocatalytic reactions under visible light. The crystal has a cubic lattice with an Fd![[3 with combining macron]](https://www.rsc.org/images/entities/char_0033_0304.gif) m space group and
m space group and ![[3 with combining macron]](https://www.rsc.org/images/entities/char_0033_0304.gif) m symmetry. The ‘A’ cations are eight-coordinated and the ‘B’ cations are six-coordinated occupying 16d and 16c sites. The 48f sites are occupied by oxygen ions with 2 mm symmetry and can respond to visible light.5,6 The pyrochlore structure is shown in Fig. 1.
m symmetry. The ‘A’ cations are eight-coordinated and the ‘B’ cations are six-coordinated occupying 16d and 16c sites. The 48f sites are occupied by oxygen ions with 2 mm symmetry and can respond to visible light.5,6 The pyrochlore structure is shown in Fig. 1.
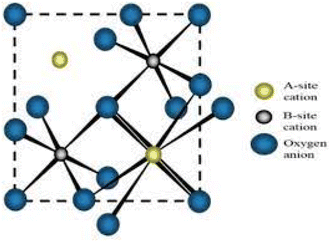 | ||
| Fig. 1 Pictorial representation of pyrochlore structure (reproduced with permission from ref. 6. Copyright ACS 2019). | ||
The scientific community worldwide has synthesized Bi2Zr2O7 photocatalysts by various routes. Wu et al. synthesized Bi2Zr2O7 by a facile sedimentation–calcination method and showed the degradation of methyl orange (MO).7 Liu et al. prepared Bi2Zr2O7 by sol–gel method using citric acid and applied it for the photodegradation of tetracycline.8 Luo et al. reported the coprecipitation method of synthesis of Bi2Zr2O7 photocatalyst for Cr(VI) reduction.9 Rajashekharaiah et al. synthesized Dy3+-doped Bi2Zr2O7 by hydrothermal route for antibacterial and anti-cancer applications.10
Materials at the nano level have enhanced antibacterial activity. Nanomaterials interact with bacterial cell membranes due to the surface-to-volume ratio of nanomaterials.11 Silver nanoparticles (Ag NPs) have been effectively utilized as antibacterial agents, however, the application of Ag ions is restricted due to their high cytotoxicity and release rate.12 For this reason, there is continuous research on alternative approaches and in this regard, bismuth zirconate is a good choice.
Currently, the consumption of toxic heavy metals by humans is high, either directly or indirectly through food, water, and skin.13 The detection of trace heavy metals is usually achieved through various spectroscopic techniques, where the most commonly used are X-ray fluorescence (XRF) and neutron activation analysis (NAA). X-ray fluorescence (XRF) is a rapid, non-destructive screening method for samples containing high concentrations of major elements. However, it has poor detection limits for most trace elements.14 Neutron activation analysis (NAA) is a non-destructive method and it is used as a reference method to test the accuracy of other analytical methods.15 This method is based on the conversion of stable isotopes of chemical elements to unstable radioactive isotopes by irradiation with thermal neutrons within a nuclear reactor.16 Thus elements having abundant isotopes with a high cross-section for thermal neutrons are of interest. On the contrary, NAA has extremely low sensitivity for lead.17 Nowadays electrochemistry represents an interesting alternative technique. The fabricated electrochemical devices are of low cost, have minimal sample preparation requirements, and have simple, user-friendly operation procedures. Thus, contamination by reagents or losses by adsorption on containers is drastically decreased. Thus, due to the advantages of electrochemical devices, metal oxide-based semiconductors are extensively employed in sensing techniques. Bi2Zr2O7 is a potential candidate but for practical applications the high recombination rate of photogenerated e−–h+ pairs restricts its broader application.18 Thus, the synthesis of heterostructured photocatalysts, with characteristics of high e−–h+ separation efficiency has recently caught great attention.19 To date, numerous catalysts have been reported for decontamination and water splitting. Nevertheless, photoactivity in the visible region is limited due to the wide band gap, making them inefficient for solar light applications. Thus, the continuous development of novel heterojunction visible-light-driven (VLD) photocatalysts is a challenge.20
In this framework, ceramic-based biomaterial hydroxyapatite (HA) has earned the utmost importance and shows a resemblance to the human skeleton and tooth enamel.21 Owing to the excellent biocompatible properties of HA, it is widely used in chemistry, biology, and medicinal fields and its derived products have received wide attention.22 A few works were reported in the literature where HA is coupled to form a composite for the photocatalytic degradation of dyes, for instance a-Fe2O3-HAp,23 CS/HA,24 CS/HA/Fe3O4,25 HA/gold,26 and HA/Fe3O4 NPs.27
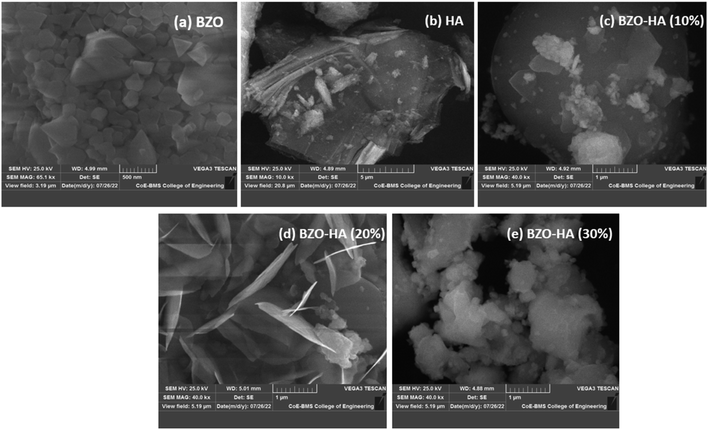
Heterostructure composites of Bi2Zr2O7 have been far less explored for various applications; a very limited body of literature is available for the coupling of Bi2Zr2O7 with other semiconductors. Qu et al. synthesized Bi2Zr2O7/g-C3N4/Ag3PO4, a dual Z-scheme photocatalyst, via the facile coprecipitation method.18 Herein, for the first time, Mentha spicata was applied as a stabilizing agent to prepare the composite. In this study, Bi2Zr2O7-hydroxyapatite (BZO-HA) composites with 10, 20, and 30 wt% HA were synthesized by the solution combustion method for the sensing of dextrose and Pb2+, as well as for antibacterial and photocatalytic study. The synthesized BZO-HA nanocomposite was characterized by X-ray diffraction (XRD), scanning electron microscopy (SEM), Fourier-transform infrared spectroscopy (FT-IR), electrochemical impedance spectroscopy (EIS), and UV-visible spectroscopy (UV-vis DRS). The present work provides a good example for the modification of BZO-based materials for efficient catalytic activity.
2 Experimental
2.1 Materials
Bismuth nitrate pentahydrate (Bi(NO3)3·5H2O, 98%) and zirconyl(IV) nitrate hydrate [ZrO(NO3)2·H2O, 99%], were procured from Sigma-Aldrich Chemicals, India. Isopropyl alcohol (IPA, 99%) and ammonium oxalate (AO, 99%) were obtained from Merck, India. Ascorbic acid (AA, 99%), methylene blue (MB, 82%), rose Bengal (RB, 85%), lead(II) nitrate (Pb(NO3)2, 99%), potassium chloride (KCl, 99%), and dextrose were purchased from Loba chemical company. Analytical (AR) grade reagents and distilled water were used throughout the reactions.2.2 Synthesis
2.3 Characterization
X-ray diffraction patterns of the phase structures of the prepared samples were examined using a Bruker X-ray powder diffractometer with CuKα radiation and λ = 1.54187 Å in the range of 20–80°. Fourier-transform infrared spectroscopy (FTIR) was applied for functional group detection using a Thermo Fischer Scientific instrument. Field-emission scanning electron microscopy (FE-SEM) was carried out using a Model Mira3 - XMU, TESCAN. UV-Vis diffuse reflectance spectroscopy (UV-vis DRS) was used to analyze the optical absorption properties of the samples (Lambda 365 UV-visible Spectrophotometer). An electrochemical analyzer (CHI 608E potentiostat) was used to perform the electrochemical studies.2.4 Antibacterial testing
The synthesized sample BZO-HA (20%) with the best morphology, crystallinity, shape and size from XRD and SEM analysis was selected for the antibacterial test using the well diffusion method. S. typhi and S. aureus inoculums measuring 200 μL each, were evenly distributed using a plate spreader on sterilized agar plates. Each plate was prepared with five 0.6 cm-diameter wells using a borer. The wells were filled with 50 μL of sample containing 100 μg, 200 μg, 300 μg, and 400 μg. The middle well was filled with 50 μL of DMSO as a negative control. The bacterial plates were kept at 37 °C during incubation for 24 h and the zone of inhibition was measured in mm.2.5 Photocatalytic experiments
The catalytic experiments was conducted under the direct sunlight irradiation on a sunny day in the month of May in the DSCE college campus, Bangalore from 11:00 am to 1:00 pm. In this study, the prepared catalyst (100 mg) was dispersed in 250 mL of 20 ppm methylene blue dye solution. Then to ensure adsorption–desorption equilibrium between the catalyst and MB dye, the solution was constantly stirred for a period of 15 min in the dark. At regular time intervals, 5 mL of suspension is taken and the absorbance of the supernatant solution is recorded in a UV-vis spectrophotometer at 664 nm. Based on the Beer–Lambert law,29 the percentage degradation of the dye was determined using eqn (1):| % of degradation = (C0 − Ct)C0 × 100% | (1) |
2.6 Electrochemical measurements
The electrodes were prepared by mixing the synthesized samples, graphite, and silicon oil in a ratio of 1![[thin space (1/6-em)]](https://www.rsc.org/images/entities/char_2009.gif) :
:![[thin space (1/6-em)]](https://www.rsc.org/images/entities/char_2009.gif) 3
3![[thin space (1/6-em)]](https://www.rsc.org/images/entities/char_2009.gif) :
:![[thin space (1/6-em)]](https://www.rsc.org/images/entities/char_2009.gif) 1 to obtain a paste. The paste was filled in a Teflon tube and the Teflon tube was smoothed over wax paper. A copper wire was used for the electrical contact with the three-electrode system for the electrochemical measurements.30
1 to obtain a paste. The paste was filled in a Teflon tube and the Teflon tube was smoothed over wax paper. A copper wire was used for the electrical contact with the three-electrode system for the electrochemical measurements.30
3 Results and discussion
3.1 Characterization of samples
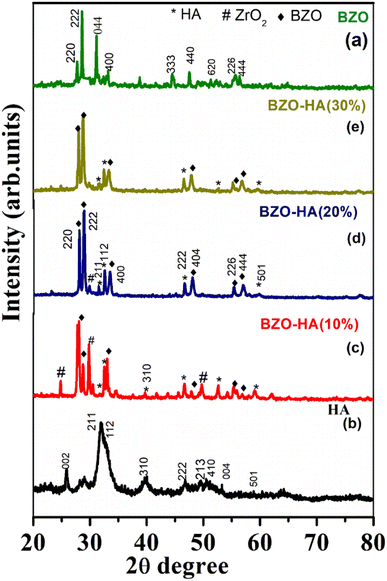 | ||
| Fig. 3 XRD patterns of the prepared samples: BZO (a), HA (b), BZO-HA (10%), BZO-HA (20%) and BZO-HA (30%) (c–e). | ||
The crystallite sizes of the BZO, HA, and composites were calculated by means of the Debye–Scherrer equation. The crystallite sizes for BZO, HA, BZO-HA (10%), BZO-HA (20%), and BZO-HA (30%) were deduced to be 13.71 nm, 19.72 nm, 16.11 nm, 25.29 nm, and 23.55 nm respectively. Thus, XRD results revealed that the obtained samples are of high crystallinity.
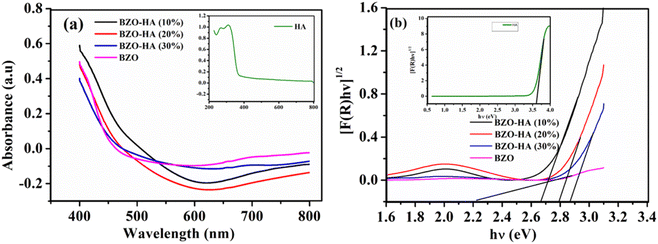 | ||
| Fig. 5 (a) UV-vis diffuse reflectance spectra (DRS) and (b) band gap versus photon energy plots of the as-synthesized BZO, HA and BZO-HA composites. | ||
The Eg values of 2.26, 3.61 2.67, 2.79, and 2.86 eV for BZO, HA, BZO-HA (10%), BZO-HA (20%), and BZO-HA (30%), respectively, were obtained from the intercept of the tangent to the absorption curves and are listed in Table 2. The calculated band gap of HA is consistent with the reported literature indicating the presence of oxygen vacancies in the phosphate group.36,37 The band gap of the BZO-HA composites increased upon incorporation of HA, which might be due to the interaction between the chemical constituents of HA and BZO. Furthermore, the optical phonon energy of the composites was enhanced compared to that of bare BZO, which can be assigned to the Burstein–Moss effect. Similar results were reported by Guo et al.38 Thus the catalytic performance not only depends on the light absorption phenomenon but on other factors, as reported in the previous literature.39
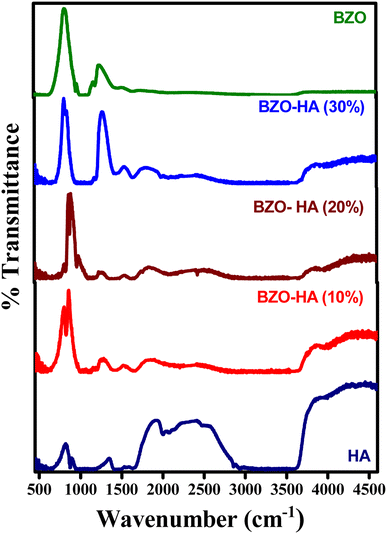
![[double bond, length as m-dash]](https://www.rsc.org/images/entities/char_e001.gif) C) carbons of aromatic compounds present in Mentha spicata leaf extract. In the spectra for HA and the composites of HA with BZO, the peak around 870 cm−1 was found to be due to ν2(CO3)2− stretching, the region at 1350–1470 cm−1 belongs to ν3(CO3)2−.40 The ν3 and ν4 bands around 1260 cm−1 and 650 cm−1 are from PO42− and PO4 groups, respectively. The broad band found at 2500 cm−1 corresponds to the C–H stretching of the aromatic ring. The band at 3750 cm−1 indicates the OH group stretching vibrations.41
C) carbons of aromatic compounds present in Mentha spicata leaf extract. In the spectra for HA and the composites of HA with BZO, the peak around 870 cm−1 was found to be due to ν2(CO3)2− stretching, the region at 1350–1470 cm−1 belongs to ν3(CO3)2−.40 The ν3 and ν4 bands around 1260 cm−1 and 650 cm−1 are from PO42− and PO4 groups, respectively. The broad band found at 2500 cm−1 corresponds to the C–H stretching of the aromatic ring. The band at 3750 cm−1 indicates the OH group stretching vibrations.41
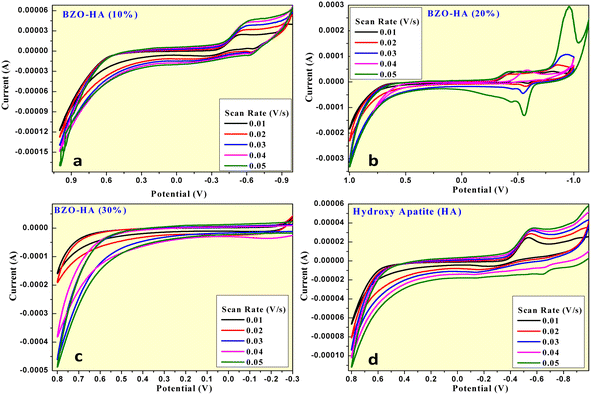 | ||
| Fig. 7 CV curves at various scan rates for HA and the BZO-HA (10%, 20% and 30%) nanocomposites (a–d). | ||
The specific capacitance (SPcv) was evaluated from the CV plots using eqn (2), as depicted in Table 1.
 | (2) |
| Specific capacitance (×10−2 F g−1) | ||||
|---|---|---|---|---|
| Scan rate | BZO-HA (10%) | BZO-HA (20%) | BZO-HA (30%) | HA |
| 0.01 | 19.9 | 13.5 | 10.7 | 6.7 |
| 0.02 | 15.3 | 8.0 | 9.2 | 4.3 |
| 0.03 | 13.1 | 6.2 | 7.2 | 4.0 |
| 0.04 | 10 | 5.1 | 6.6 | 3.6 |
| 0.05 | 9.2 | 4.2 | 5.7 | 3.3 |
It is clear from Table 1 that the BZO-HA (10%)-modified graphite electrode exhibited the highest specific capacitance with high exposure area as compared to other electrodes. This observation revealed that the BZO-HA (10%) modified graphite electrode has excellent electrochemical behaviour. The stability of the nanomaterial was confirmed by CV at different scan rates (0.01 mV s−1–0.05 mV s−1) for the BZO-HA (10%)-modified graphite electrode, as depicted in Fig. 7a. It was predicted that the shift in the cathodic and anodic peak areas of CV curves when the scan rate was increased from 0.01 mV s−1 to 0.05 mV s−1 due to an internal resistance over the electrode surface.45–48 All the CV curves retained their redox peaks at different scan rates, confirming the pseudocapacitance behaviour of the nanomaterial. As can be seen in Table 1, there is a decreasing trend in SPcv values with increasing scan rates owing to a comparatively insufficient faradaic redox process at higher scan rates.45,49
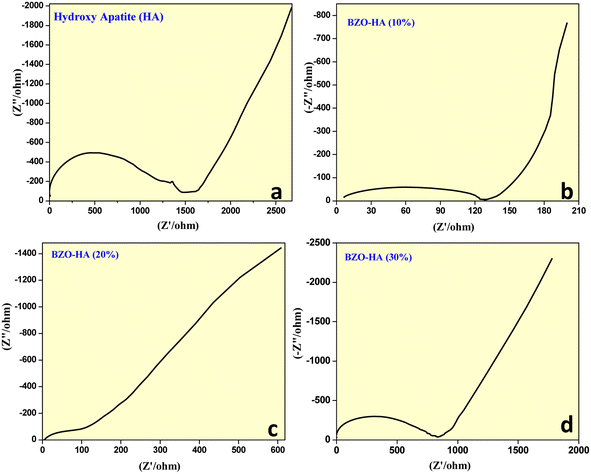
Fig. 8a–d show the EIS spectra of HA and the BZO-HA (10%, 20% and 30%) nanocomposite-modified graphite electrodes. The high-frequency regions displayed by the respective electrodes comprise a semicircle while a straight line was displayed for the lower frequency regions. Using the diameter of the semicircle, the charge transfer resistance (Rct) values of the electrode and electrolyte interface can be obtained. The calculated Rct values of the HA and BZO-HA (10%, 20%, 30%) nanocomposite-modified graphite electrodes were found to be 1500 Ω, 120 Ω, 100 Ω and 900 Ω, respectively. There was a slight appearance of a semicircle for BZO-HA (20%). The slope from the straight line in the low-frequency region for BZO-HA (10%) tended slightly towards 90° as compared to the other modified electrodes, which confirms the capacitive nature. The BZO-HA (20%) nanocomposite-modified electrode exhibited a low Rct value, which revealed that the material can be utilized as a semiconducting material for enhancing photocatalytic applications.50–52
3.2 Photocatalytic evaluation of the BZO, HA and BZO-HA composites
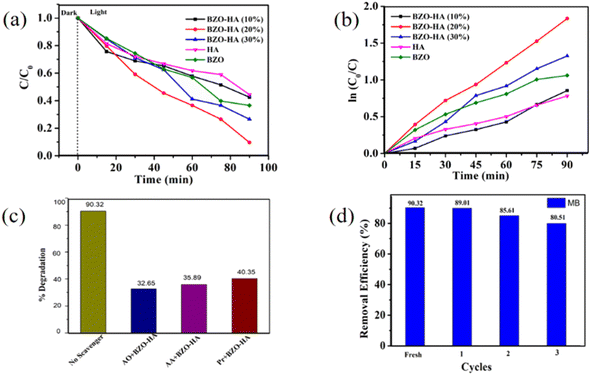
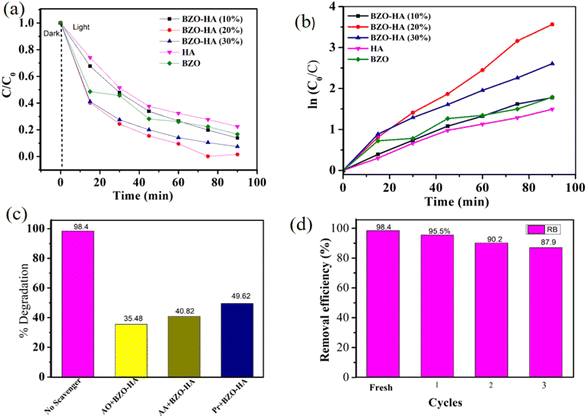
To evaluate the photocatalytic properties, a series of experiments were carried out with the BZO-HA composites under visible light irradiation. The degradation profiles for MB and RB are presented in Fig. S1 and S2.† The characteristic absorbance peaks of MB and RB at wavelengths of 664 nm and 540 nm, respectively, gradually decreased within the 90 min irradiation time. It is clear from the obtained absorbance plot that the BZO-HA (20%) composite could effectively decompose the dyes compared to bare BZO and HA. The photocatalytic activity performance is enhanced compared to that BZO because the recombination of electron and hole pairs decreases due to the greater charge separation in the composites. Fig. 9a and 10a present the MB and RB degradation efficiency of the different photocatalysts over time.The degradation efficiency for MB was found to be in the sequence BZO-HA (20%) > BZO-HA (30%) > BZO > BZO-HA (10%) > HA while the degradation efficiency for RB follows the order BZO-HA (20%) > BZO-HA (30%) > BZO-HA (10%)> BZO > HA. The removal efficiencies of MB and RB with BZO-HA (20%) were found to be 90.32% and 98.44%, respectively. To better understand the photocatalytic efficiency, a pseudo-first-order model was established for the experimental data to obtain the kinetic results. The plots of ln C0/C as a function of time for BZO, HA, and BZO-HA composites are shown in Fig. 9b and 10b. The rate constants for BZO-HA (20%) for MB and RB dye were estimated to be 0.020 min−1 and 0.04 min−1, respectively. The percentage degradation efficiencies and rate constants for pure BZO, HA, and the nanocomposites for MB and RB dye are summarized in Table 2. The superior performance by the composite BZO-HA (20%) is possibly due to the aggregated morphology and the synergistic effect between BZO and HA, which further hinders photogenerated electron and hole recombination. Thus, the MB and RB dye degradation efficiency with the composite photocatalyst was improved markedly compared to the bare catalyst. For comparison, other reported catalysts for the degradation of RB and MB dye are shown in Table 3.
| Photocatalyst | Degradation efficiency (%) | K (min−1) | Conduction band potential (CB) (eV) | Valence band potential (VB) (eV) | Band gap energy (Eg) | ||
|---|---|---|---|---|---|---|---|
| MB | RB | MB | RB | ||||
| BZO | 65.4 | 83.3 | 0.013 | 0.022 | 0.43 | 2.69 | 2.26 |
| HA | 55.6 | 77.5 | 0.009 | 0.017 | −0.415 | 3.19 | 3.61 |
| BZO-HA (10%) | 57.4 | 86.1 | 0.008 | 0.021 | 2.67 | ||
| BZO-HA (20%) | 90.3 | 98.4 | 0.020 | 0.041 | 2.79 | ||
| BZO-HA (30%) | 73.5 | 92.6 | 0.015 | 0.031 | 2.86 | ||
| Sample | Dye | Concentration | Degradation efficiency (%) | Time | Ref. |
|---|---|---|---|---|---|
| BaTiO3/GO | MB | 5 mg L−1 | 95 | 3 h | 57 |
| g-C3N4/ZnO | MB | 10 ppm | 90 | 120 min | 58 |
| SnO2/TiO2 | MB | 5 ppm | 95 | 25 min | 59 |
| Ag/CeO2/graphene | MB | 20 mg L−1 | 75 | 120 min | 60 |
| Sn-doped CeO2–Fe2O3 | MB | 10 mg L−1 | 94.6 | 2 h | 61 |
| CuO–Pb2O3 | RB | — | 99 | 90 min | 62 |
| α-Fe2O3@CeO2 | RB | 5 ppm | 93 | 75 min | 63 |
| Ag/CeO2 | RB | 0.2 g L−1 | 96 | 3 h | 64 |
| WO2/α-ZnMoO4 | RB | 1 μM | 96 | 180 min | 65 |
| Sm-doped CeO2 | RB | 5 ppm | 90 | 90 min | 66 |
| Fe–NiO | RB | 5 ppm | 86 | 60 min | 67 |
| MB | 5 ppm | 85 | 60 min | ||
| BZO-HA (20%) | RB | 20 ppm | 98.4 | 90 min | Present work |
| MB | 20 ppm | 90.3 | 90 min |
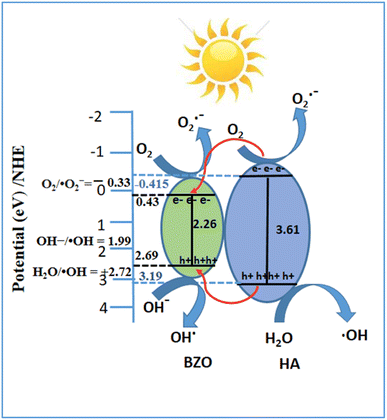
To analyze the active radical responsible for the photocatalytic degradation mechanism, radical-trapping experiments were performed. The scavengers ammonium oxalate (AO), ascorbic acid (AA), and isopropanol (Pr) were employed to trap photogenerated holes, superoxide anion (O2˙−) and hydroxyl radicals (OH˙), respectively.53 The degradation efficiency for MB dye with BZO-HA (20%) composite decreased to 35.4%, 40.82%, and 49.62% while for RB dye the degradation efficiency is only 32.65%, 35.89% and 40.35% with the addition of AO, AA, and Pr, respectively (Fig. 9c and 10c). This data reveals that all three radicals actively participated in the catalytic mechanism. From a practical application view, repeated cycles of MB and RB removal were carried out with BZO-HA (20%). After each cycle, the catalyst was centrifuged and washed with deionized water. A slight decrease in the degradation efficiency was observed from the 1st to the 3rd cycle. The catalyst showed good degradation efficiency (80.5% and 87.9%, respectively) for MB and RB dye even after the 3rd repeated cycle (Fig. 9d and 10d).
| EVB = X − Ee + 0.5Eg | (3) |
| ECB = EVB − Eg | (4) |
3.3 Sensor studies of graphite-BZO-HA composite electrode
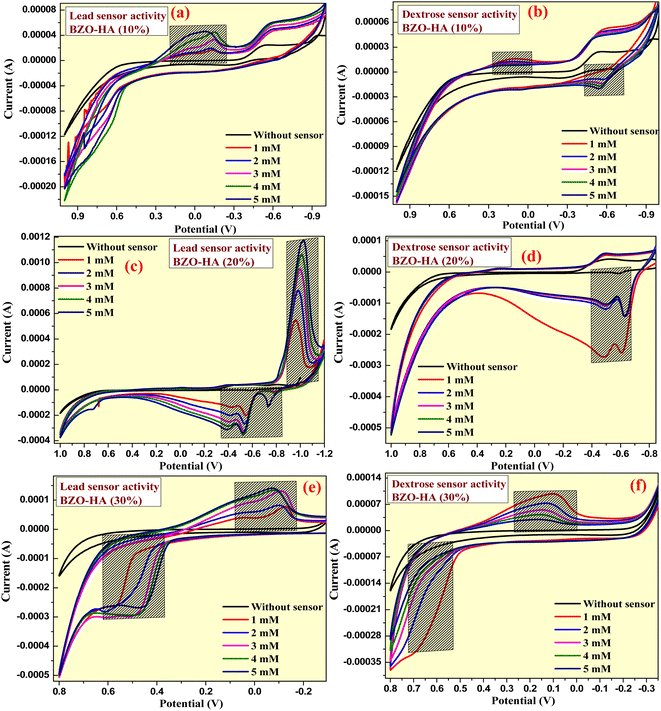
The prepared graphite-BZO-HA (10–30%) electrodes were extended toward sensor applications by electrochemical characterization. In the sensor examinations, we utilized prepared electrodes for sensing dextrose and lead metal in 0.1 M KCl electrolyte. The CV analysis of the prepared graphite-HA bare electrode was examined in the potential range of −0.8 V to +1.0 V, which confirmed little or no sensing ability for dextrose and lead nitrate (concentration 1–5 mM) (Fig. 12a and b). However, the prepared composite nanomaterials with different percentages of HA showed excellent sensing properties for lead nitrate and dextrose. As presented in Fig. 13, the sensing of the prepared graphite-BZO-HA (10%) electrode for lead nitrate in 0.1 M KCl electrolyte was confirmed by the presence of a redox potential peak at −0.24 V (Fig. 13a) and for dextrose at 0.18 and −0.58 V (Fig. 13b). The redox peaks appeared at varied potential positions with respect to CV of BZO-HA (10–30%) in the bare electrolyte, which confirmed the sensibility of the electrode for lead.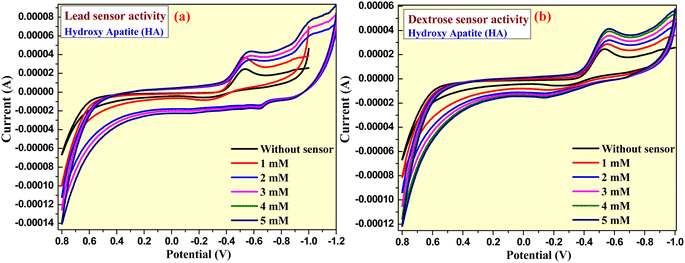 | ||
| Fig. 12 CV plot of HA electrode for sensing lead nitrate and dextrose molecule at a concentration ranging from 1 to 5 mM (a and b). | ||
Strong redox peaks were observed for dextrose as well as for lead nitrate using the prepared graphite-BZO-HA (20%) electrode in the potential range of −1.0 V to +1.0 V. The appearance of redox peaks at varied potential positions of −1.02, −0.38, −0.52 and −0.78 V with respect to the bare electrolyte indicates the sensing capacity for lead nitrate and redox peak potentials at −0.48 and −0.60 V for dextrose, as shown in the Fig. 13c and d, respectively. Similarly, the increased HA concentration in the BZO-HA (30%) composite material shows less sensing property towards lead nitrate and dextrose compared to graphite-BZO-HA (20%). Strong redox peaks for dextrose and lead nitrate were observed for the prepared graphite-BZO-HA (20%) electrode in the potential range of −1.0 V to +1.0 V.
The presence of redox peaks at potential positions of −0.07 and 0.48 V indicates the sensing capacity for lead nitrate and redox peak potentials at 0.09 and 0.69 V for dextrose as shown in Fig. 13e and f, respectively. Hence, the obtained data reveal that the BZO-HA (20%) electrode sensing properties towards lead nitrate and dextrose are better than those of BZO-HA (bare HA, 10% and 30%), which confirms that the synthesized BZO-HA (20%) nanocomposite can be used as a better candidate for the sensor applications.
3.4 Antibacterial activity
The synthesized BZO-HA (20%) was analyzed for antibacterial activity against both Gram-positive and Gram-negative bacteria, S. aureus and S. typhi, with DMSO as a negative control. The potential activity of the sample is directly proportional to the zone of inhibition, as shown in Fig. 14 and Table 4. Past studies revealed several mechanisms for growth inhibition. The positively charged ions, like Ca2+ and Na+, are drawn to the surface of the bacteria whose cellular membranes have negative charges because they contain phosphate and carboxyl groups.68 The resultant electrostatic interactions may alter the cellular membrane physically, resulting in cell damage and increasing the penetration of the ions.69 The positive metal ions from BZO-HA can result in significant quantities of reactive oxygen species that lead to denaturation of the proteins inside the cell, particularly those of the ribosomes. These substances, when present in excess, limit cellular respiration, disrupt lipids and nucleic acids, and also trigger a reaction akin to apoptosis.70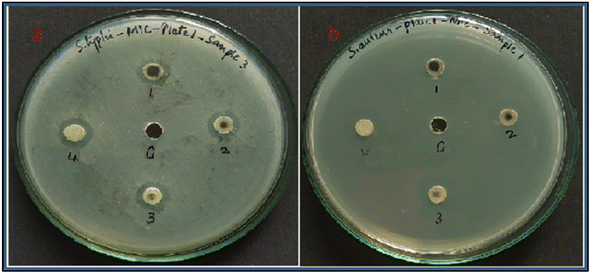 | ||
| Fig. 14 Inhibition zones of (a) S. typhi (b) S. aureus for the BZO-HA (20%) sample with concentrations of 1. 100 μg, 2. 200 μg, 3. 300 μg, 4. 400 μg, and C. control. | ||
| Concentrations (μg mL−1) | BZO-HA (20%) | |
|---|---|---|
| S. typhi | S. aureus | |
| 100 | 19 | 15 |
| 200 | 21 | 18 |
| 300 | 24 | 20 |
| 400 | 26 | 23 |
| Control | — | — |
The presence of minerals like Na+ and Ca2+ in the as-synthesized BZO-HA gives it antibacterial properties. The antibacterial efficacy of BZO-HA was discovered to increase with concentration. This is explicable by the fact that BZO-HA (400 μg) has the highest concentration of Ca2+ and Na+, and the presence of TCP (tricalcium phosphate) which improves Mg2+ and Na+ solubility and bioresorbability and so enhances the antibacterial activity.71
4 Conclusion
In the present work, BZO-HA composites were successfully synthesized by a simple combustion method and SEM-EDS, FTIR, XRD, electrochemical, and UV-vis techniques were employed to characterize the composites. The catalyst efficiency was assessed in the presence of sunlight for degradation of MB and RB dyes under optimum conditions. The BZO-HA (20%) catalyst was proved to be the most efficient one as compared to the other as-prepared photocatalysts. The photogenerated holes, hydroxyl radical, and superoxide anion are responsible for the excellent photocatalytic degradation of MB and RB dyes. In addition, the as-prepared BZO-HA (20%) composite exhibited better antibacterial activity against S. aureus and S. typhi bacterial pathogens owing to the synergistic effect between BZO and HA particles, and the generation of reactive oxygen species. Moreover, the BZO-HA (20%) composite-modified electrode showed high selectivity for the determination of dextrose and lead nitrate in 0.1 M KCl as an electrolyte over the applied potential range from −0.8 V to +1.0 V for 1–5 mM concentrations of analytes. Finally, these results may be a promising route to prepare new semiconductor-based photocatalysts for a wide spectrum of applications.Author contributions
K. Pompapathi: experimental work; K. S. Anantharaju: conceptualization and supervision, Arpita Paul Chowdhury: formal analysis and writing the original draft; B. S. Surendra: data acqusition and analysis; B Uma and S Meena: contributed towards data curation and formal analysis; H. C. Ananda Murthy: writing, reviewing and editing.Conflicts of interest
The authors declare that they have no known competing financial interests or personal relationships that could have appeared to influence the work reported in this paper.Acknowledgements
The authors are thankful to the Principal and Management for lab facilities and infrastructure.References
- N. Baig, I. Kammakakam and W. Falath, Mater. Adv., 2021, 2, 1821–1871 RSC.
- R. M. Gunnagol and M. H. K. Rabinal, ChemistrySelect, 2019, 4, 6167–6176 CrossRef CAS.
- F. A. Alharthi, A. Ali Alghamdi, H. S. Alanazi, A. A. Alsyahi and N. Ahmad, Catalysts, 2020, 10, 1457 CrossRef CAS.
- S. Sabbahi, L. Ben Ayed and A. Boudabbous, J. Water Health, 2013, 11, 590–599 CrossRef CAS.
- J. Pandey, V. Shrivastava and R. Nagarajan, Inorg. Chem., 2018, 57, 13667–13678 CrossRef CAS.
- S. Bhattar, A. Krishnakumar, S. Kanitkar, A. Abedin, D. Shekhawat, D. J. Haynes and J. J. Spivey, Ind. Eng. Chem. Res., 2019, 58, 19386–19396 CrossRef CAS.
- D. Wu, T. He, J. Xia and Y. Tan, Mater. Lett., 2015, 156, 195–197 CrossRef CAS.
- X. Liu, L. Huang, X. Wu, Z. Wang, G. Dong, C. Wang, Y. Liu and L. Wang, Chemosphere, 2018, 210, 424–432 CrossRef CAS PubMed.
- Y. Luo, L. Cao, L. Feng, J. Huang, L. Yang, C. Yao and Y. Cheng, J. Mater. Sci. Eng. B, 2019, 240, 133–139 CrossRef CAS.
- A. S. Rajashekharaiah, G. P. Darshan, H. B. Premkumar, P. Lalitha, S. C. Sharma and H. Nagabhushana, Mater. Chem. Phys., 2020, 242, 122468 CrossRef CAS.
- L. Wang, C. Hu and L. Shao, Int. J. Nanomed., 2017, 12, 1227–1249 CrossRef CAS.
- C. Liao, Y. Li and S. Tjong, Int. J. Mol. Sci., 2019, 20, 449 CrossRef.
- S. Christidi, A. Chrysostomou, A. Economou, C. Kokkinos, P. R. Fielden, S. J. Baldock and N. J. Goddard, Sensors, 2019, 19, 4809 CrossRef PubMed.
- S. Nasrazadani and S. Hassani, in Handbook of Materials Failure Analysis with Case Studies from the Oil and Gas Industry, Elsevier, 2016, pp. 39–54 Search PubMed.
- N. J. Miller-Ihli, Chapter 13 - Chromium, in Techniques and Instrumentation in Analytical Chemistry, ed. M. Stoeppler, Elsevier, 1992, pp. 373–404 Search PubMed.
- L. Minc, in Encyclopedia of Archaeology, Elsevier, 2008, pp. 1669–1683 Search PubMed.
- K. M. Pitts and S. W. Lewis, in Reference Module in Chemistry, Molecular Sciences and Chemical Engineering, Elsevier, 2018 Search PubMed.
- Z. Qu, Z. Jing, X. Chen, Z. Wang, H. Ren and L. Huang, J. Environ. Sci., 2023, 125, 349–361 CrossRef.
- X. He, T. Kai and P. Ding, Environ. Chem. Lett., 2021, 19, 4563–4601 CrossRef CAS PubMed.
- B. Liu, X. Han, Y. Wang, X. Fan, Z. Wang, J. Zhang and H. Shi, J. Mater. Sci.: Mater. Electron., 2018, 29, 14300–14310 CrossRef CAS.
- S. Das Lala, E. Barua, P. Deb and A. B. Deoghare, Mater. Today Commun., 2021, 27, 102443 CrossRef CAS.
- B. Nayak and P. K. Misra, Mater. Chem. Phys., 2019, 230, 187–196 CrossRef CAS.
- G. Bharath and N. Ponpandian, RSC Adv., 2015, 5, 84685–84693 RSC.
- C. Shi, C. Lv, L. Wu and X. Hou, J. Hazard. Mater., 2017, 338, 241–249 CrossRef CAS PubMed.
- P. Hou, C. Shi, L. Wu and X. Hou, Microchem. J., 2016, 128, 218–225 CrossRef CAS.
- K. Sharma, S. Sharma, V. Sharma, P. K. Mishra, A. Ekielski, V. Sharma and V. Kumar, Nanomaterials, 2021, 11, 1403 CrossRef CAS PubMed.
- S. Pai, M. S. Kini, R. Mythili and R. Selvaraj, Environ. Res., 2022, 210, 112951 CrossRef CAS PubMed.
- P. Acharya, M. Kupendra, A. Fasim, K. S. Anantharaju, N. Kottam, V. K. Murthy and S. S. More, Biotechnol. Lett., 2022, 44, 1175–1188 CrossRef CAS PubMed.
- C. Anupama, A. Kaphle, Udayabhanu and G. Nagaraju, J. Mater. Sci.: Mater. Electron., 2018, 29, 4238–4249 CrossRef CAS.
- B. Uma, K. S. Anantharaju, B. S. Surendra, K. Gurushantha, S. S. More, S. Meena, B. Hemavathi and H. C. A. Murthy, ACS Omega, 2023, 8, 9947–9961 CrossRef CAS PubMed.
- V. Jayaraman, C. Ayappan, B. Palanivel and A. Mani, RSC Adv., 2020, 10, 8880–8894 RSC.
- A. S. Rajashekharaiah, G. P. Darshan, R. B. Basavaraj, Y. V. Naik, D. Kavyashree, S. C. Sharma and H. Nagabhushana, Opt. Mater., 2019, 95, 109237 CrossRef CAS.
- J. Pandey, V. Shrivastava and R. Nagarajan, Inorg. Chem., 2018, 57, 13667–13678 CrossRef CAS PubMed.
- L. Chen, S. Al-Bayatee, Z. Khurshid, A. Shavandi, P. Brunton and J. Ratnayake, Materials, 2021, 14, 4865 CrossRef CAS.
- M. Fuentes-Pérez, M. Sotelo-Lerma, J. L. Fuentes-Ríos, E. G. Morales-Espinoza, M. Serrano and M. E. Nicho, J. Mater. Sci.: Mater. Electron., 2021, 32, 16786–16799 CrossRef.
- V. S. Bystrov, C. Piccirillo, D. M. Tobaldi, P. M. L. Castro, J. Coutinho, S. Kopyl and R. C. Pullar, Appl. Catal., B, 2016, 196, 100–107 CrossRef CAS.
- S. Sha, L. Zhang, H. Liu, J. Chen, Y. Che, F. Zhang and C. Song, RSC Adv., 2021, 11, 15598–15607 RSC.
- H. Guo, B. Devakumar, R. Vijayakumar, P. Du and X. Huang, RSC Adv., 2018, 8, 33403–33413 RSC.
- A. P. Chowdhury, K. S. Anantharaju, S. S. Umare and S. S. Dhar, Colloids Surf., A, 2022, 652, 129841 CrossRef CAS.
- S. Saber-Samandari, S. Saber-Samandari, M. Gazi, F. Ç. Cebeci and E. Talasaz, J. Macromol. Sci., Part A, 2013, 50, 1133–1141 CrossRef CAS.
- C. de C. A. Lopes, P. H. J. O. Limirio, V. R. Novais and P. Dechichi, Appl. Spectrosc. Rev., 2018, 53, 747–769 CrossRef CAS.
- B. S. Surendra, H. P. Nagaswarupa, M. U. Hemashree and J. Khanum, Chem. Phys. Lett., 2020, 739, 136980 CrossRef CAS.
- S. S. Hegde, B. S. Surendra, V. Talapatadur, P. Murahari and K. Ramesh, Chem. Phys. Lett., 2020, 754, 137665 CrossRef CAS.
- M. Swamy M, B. S. Surendra, C. Mallikarjunaswamy, S. Pramila and N. D. Rekha, Environ. Nanotechnol., Monit. Manage., 2021, 15, 100442 CAS.
- S. Meena, K. S. Anantharaju, S. Malini, A. Dey, L. Renuka, S. C. Prashantha and Y. S. Vidya, Ceram. Int., 2021, 47, 14723–14740 CrossRef CAS.
- B. S. Surendra, K. Gurushantha, K. S. Anantharaju, M. Rudresh, N. Basavaraju, N. Raghavendra, A. A. Jahagirdar, H. M. Somashekar and H. C. A. Murthy, New J. Chem., 2023, 47, 3978–3992 RSC.
- B. S. Surendra, T. Kiran, M. V. Chethana, H. S. Savitha and M. S. Paramesh, J. Mater. Sci.: Mater. Electron., 2021, 32, 25234–25246 CrossRef CAS.
- N. Raghavendra, H. P. Nagaswarupa, T. R. S. Shekhar, M. Mylarappa, B. S. Surendra, S. C. Prashantha, C. R. Ravikumar, M. R. A. Kumar and N. Basavaraju, Appl. Surf. Sci. Adv., 2021, 5, 100103 CrossRef.
- K. Mao, Y. Zhu, J. Rong, F. Qiu, H. Chen, J. Xu, D. Yang, T. Zhang and L. Zhong, Colloids Surf., A, 2021, 611, 125888 CrossRef CAS.
- G. Meenakshi, B. C. Manjunath, S. C. Prashantha, T. Prashanth and B. S. Surendra, Sens. Int., 2023, 4, 100237 CrossRef.
- K. Gurushantha, K. S. Anantharaju, N. Kottam, K. Keshavamurthy, C. R. Ravikumar, B. S. Surendra, A. Murugan and H. C. A. Murthy, Adsorpt. Sci. Technol., 2022, 2022, 1–13 CrossRef.
- M. Dinamani, B. S. Surendra, H. C. Ananda Murthy, N. Basavaraju and V. V. Shanbhag, Environ. Nanotechnol., Monit. Manage., 2023, 20, 100822 CAS.
- B. Wang, P. Li, C. Du, Y. Wang, D. Gao, S. Li, L. Zhang and F. Wen, RSC Adv., 2019, 9, 41977–41983 RSC.
- P. Govindasamy, B. Kandasamy, P. Thangavelu, S. Barathi, M. Thandavarayan, M. Shkir and J. Lee, Sci. Rep., 2022, 12, 11572 CrossRef CAS PubMed.
- Y. Deng, M. Xu, X. Jiang, J. Wang, P.-L. Tremblay and T. Zhang, Environ. Res., 2023, 216, 114808 CrossRef CAS PubMed.
- T. Liu, F. Yang, L. Wang, L. Pei, Y. Hu, R. Li, K. Hou and T. Ren, Toxics, 2022, 10, 555 CrossRef CAS.
- Z. Mengting, T. A. Kurniawan, S. Fei, T. Ouyang, M. H. D. Othman, M. Rezakazemi and S. Shirazian, Environ. Pollut., 2019, 255, 113182 CrossRef.
- D. R. Paul, S. Gautam, P. Panchal, S. P. Nehra, P. Choudhary and A. Sharma, ACS Omega, 2020, 5, 3828–3838 CrossRef CAS PubMed.
- T. A. Dontsova, A. S. Kutuzova, K. O. Bila, S. O. Kyrii, I. V. Kosogina and D. O. Nechyporuk, J. Nanomater., 2020, 2020, 1–13 CrossRef.
- C. Mardani, M. Y. Rizal, R. Saleh, A. Taufik and S. Yin, Appl. Surf. Sci., 2020, 530, 147297 CrossRef CAS.
- A. Krishnan, P. V. Vishwanathan, A. C. Mohan, R. Panchami, S. Viswanath and A. V. Krishnan, Surf. Interfaces, 2021, 22, 100808 CrossRef CAS.
- E. Kamaraj, S. Somasundaram, K. Balasubramani, M. P. Eswaran, R. Muthuramalingam and S. Park, Appl. Surf. Sci., 2018, 433, 206–212 CrossRef CAS.
- G. Murugadoss, D. D. Kumar, M. R. Kumar, N. Venkatesh and P. Sakthivel, Sci. Rep., 2021, 11, 1080 CrossRef CAS PubMed.
- S. S. Singh, A. Kumar, N. Kataria, S. Kumar and P. Kumar, J. Environ. Chem. Eng., 2021, 9, 106266 CrossRef.
- C. Sudhakar, R. Devi, S. Nikhil, P. Kalyani, A. Suganthi and M. Rajarajan, Orient. J. Chem., 2022, 38, 144–150 CAS.
- S. Chahal, N. Rani, A. Kumar and P. Kumar, Vacuum, 2020, 172, 109075 CrossRef CAS.
- A. Khatri and P. S. Rana, Phys. B, 2020, 579, 411905 CrossRef CAS.
- M. Wang, M. Li, Y. Wang, Y. Shao, Y. Zhu and S. Yang, J. Mater. Chem. B, 2021, 9, 3401–3411 RSC.
- D. Predoi, S. Iconaru, M. Predoi, M. Motelica-Heino, R. Guegan and N. Buton, Nanomaterials, 2019, 9, 515 CrossRef CAS PubMed.
- V. Sanyal and C. R. Raja, Appl. Phys. A, 2016, 122, 132 CrossRef.
- P. Phatai, C. M. Futalan, S. Kamonwannasit and P. Khemthong, J. Sol-Gel Sci. Technol., 2019, 89, 764–775 CrossRef CAS.
Footnote |
| † Electronic supplementary information (ESI) available. See DOI: https://doi.org/10.1039/d3ra05222b |
| This journal is © The Royal Society of Chemistry 2023 |

