 Open Access Article
Retama monosperma chemical profile, green synthesis of silver nanoparticles, and antimicrobial potential: a study supported by network pharmacology and molecular docking
Mohammad H. Alyamia,
Amal M. Fakhryb,
Nancy M. El Halfawy b,
Soliman M. Totob,
Nada K. Sedky
 c,
Heba A. Yassind,
Sherif Ashraf Fahmy
 *e and
Fatma A. Mokhtarf
aDepartment of Pharmaceutics, College of Pharmacy, Najran University, Najran 66462, Saudi Arabia
bDepartment of Botany & Microbiology, Faculty of Science, Alexandria University, Alexandria 21511, Egypt
cDepartment of Biochemistry, School of Life and Medical Sciences, University of Hertfordshire Hosted By Global Academic Foundation, R5 New Garden City, New Capital, Cairo 11835, Egypt
dSchool of Pharmacy, Pharmaceutics Department, Badr University in Cairo (BUC), Egypt
eDepartment of Chemistry, School of Life and Medical Sciences, University of Hertfordshire Hosted By Global Academic Foundation, R5 New Garden City, New Capital, Cairo 11835, Egypt. E-mail: sheriffahmy@aucegypt.edu
fDepartment of Pharmacognosy, Faculty of Pharmacy, El Saleheya El Gadida University, El Saleheya El Gadida, Sharkia, 44813, Egypt
First published on 4th September 2023
Abstract
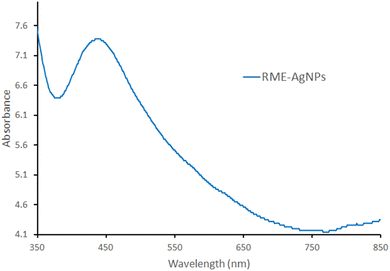
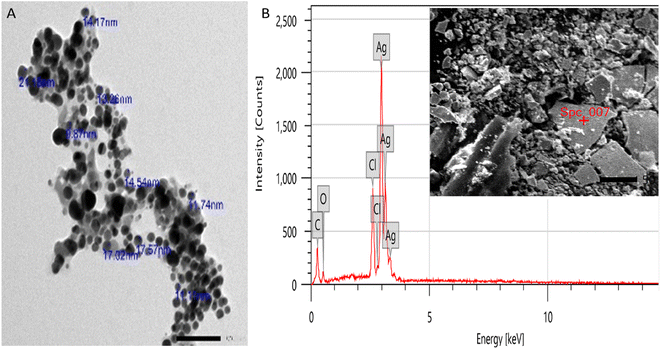
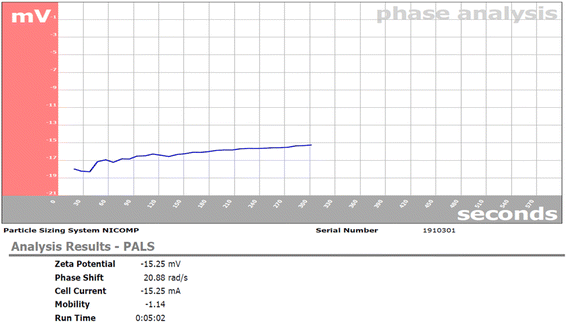
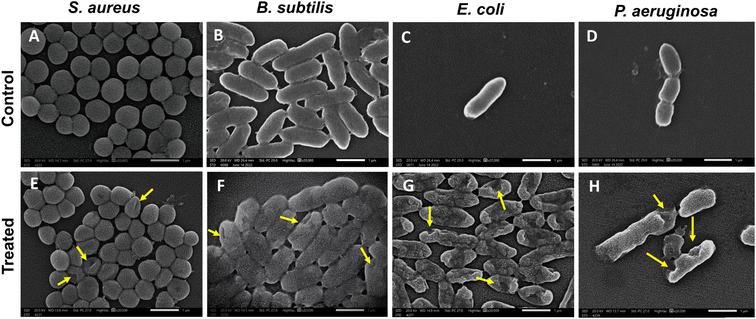
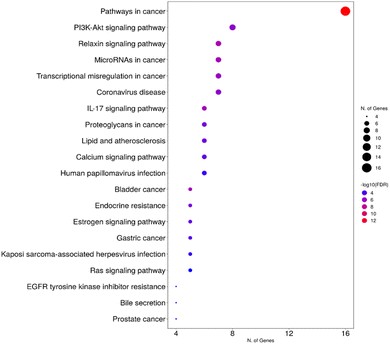
In this study, Retama monosperma extract (RME) was used for the green synthesis of silver nanoparticles (RME-AgNPs). RME's phenolic profile was identified by liquid chromatography coupled to mass spectroscopy (LC-ESI/MS/MS) technique. A tentative identification of 21 phenolic metabolites from the extract was performed. The produced RME-AgNPs showed UV absorbance at 443 nm. FTIR spectroscopy confirmed the presence of RME functional groups. In addition, XRD analysis confirmed the crystallography of RME-AgNPs via exhibiting peaks with 2θ values at 38.34°, 44.29°, and 64.65°. RME-AgNPs were spherical with particle sizes ranging from 9.87 to 21.16 nm, as determined by SEM and HR-TEM techniques. The zeta potential determined the particle's charge value as −15.25 mv. RME-AgNPs exhibited significantly higher antibacterial activity against Gram-negative (Escherichia coli, Pseudomonas aeruginosa, Serratia marcescens, and Klebsiella pneumoniae) and Gram-positive bacteria (Bacillus subtilis and Staphylococcus aureus) compared to RME. Moreover, the SEM images of green-synthesized nanoparticles revealed severe damage and deformation in the bacterial cell wall of the different strains subjected to the current investigation. The bioinformatics study identified 266 targets, among which only 41 targets were associated with bacterial infections. The PI3K-Akt and Relaxin signaling pathways were the top KEGG signaling pathways. Molecular docking was also performed for the 21 identified compounds at the TNF-α active site; kaempferol-3-O-robinoside-7-O-rhamnoside had a higher binding energy (−6.8084). The findings of this study warrant the use of green-synthesized AgNPs from Retama monosperma as potential antibacterial agents.
1. Introduction
The emergence of antimicrobial resistance (AMR) is a severe worldwide problem that has led to deterioration in human health and economic development. Poverty, poor sanitation, antibiotic administration abuse, and disregarding clinical practice protocols are among several factors that aid in spreading multidrug-resistant (MDR) microbial strains.1 Thus, a global demand exists to innovate alternative therapies to traditional antibiotics that could tackle the MDR issue.2Chemically synthesized metallic nanoparticles (MNPs), including silver nanoparticles (Ag NPs), have attracted attention as promising therapeutic candidates in various biomedical applications However, their biomedical applications are hindered by their toxicity and highly persistent nature in the environment. Accordingly, medicinal plants are exploited for the green synthesis of MNPs, becoming an eco-friendly and benign source of therapeutic MNPs.3 Medicinal plants contain various phytochemicals such as polyphenols, flavonoids, alkaloids, coumarins, and terpenoids that serve as natural reductants and capping agents, facilitating the nano-sizing of NPs, diminishing their high surface energy and inhibiting their aggregation.4,5 In addition, many of these phytochemicals are biologically active compounds that possess bactericidal activities against MDR pathogenic bacteria.6,7
Retama monosperma (L.) Boiss. is a branched shrub that grows in the Mediterranean regions (belongs to the Fabaceae family), which has been used in traditional medicine to treat various diseases, including diabetes, abortion, rheumatism, and hypertension.8,9 In addition, several studies reported the biological activities of R. monosperma, including antibacterial, anti-inflammatory, antioxidant, anti-proliferative, antiulcer, antiviral, and hepatoprotective activities.10,11 Moreover, the roots of R. monosperma are reported to contain natural antioxidants, including flavonoids and phenolic compounds, making them promising candidates for the green synthesis of MNPs, including AgNPs.10
Silver nanoparticles (AgNPs) are attracting attention as potential antibacterial agents due to their intriguing physicochemical features and innate ability to penetrate bacterial cell walls, altering the construction of cell membranes and even leading to cell death. In addition, their nanoscale sizes and large surface area-to-volume ratio improve their capability to cross cell membranes, releasing silver ions intracellularly, leading to the generation of reactive oxygen species and interfering with deoxyribonucleic acid replication.12–14
In this study, a facile and environment-friendly method was utilized to synthesize AGNPs using the root extract of R. monosperma. The green-synthesized nanoparticles were investigated for antibacterial activities against different human pathogens. In addition, network pharmacology and in silico molecular docking studies were conducted to explore the possible genes responsible for the antimicrobial activity and the signaling pathways in a computational bioinformatics manner.
2. Materials and methods
2.1. Chemicals
AgNO3, chemicals, and solvents were purchased from Sigma-Aldrich (St. Louis, MO).2.2. Plant material
The roots of R. monosperma were collected from the northern coast of Egypt in January 2022. The plant was identified by Selim Z. Heneidy, professor of Flora and Ecology, Department of Botany and Microbiology, Faculty of Science, Alexandria University. A voucher specimen was deposited at the Herbarium of the Botanic Garden (Heneidy et al. Collection, serial no. 6505).2.3. Plant extraction
The roots of Retama monosperma were thoroughly washed several times with distilled water, sliced, shade-dried, and grounded to a fine powder. Then, 100 g powder was extracted in 80% ethanol/H2O (1 L) in triplicate, each time for two days, the extracted solution was evaporated under vacuum at 45 °C to yield 13.2 g dry weight extract.2.4. LC-ESI-MS/MS
Liquid chromatography-electrospray ionization-tandem mass spectrometry (LC-ESI-MS/MS) analysis was performed in the Proteomics and Metabolomics Research Program CCHE 57357. The sample was prepared in a reconstitution solvent composed of water![[thin space (1/6-em)]](https://www.rsc.org/images/entities/char_2009.gif) :
:![[thin space (1/6-em)]](https://www.rsc.org/images/entities/char_2009.gif) methanol
methanol![[thin space (1/6-em)]](https://www.rsc.org/images/entities/char_2009.gif) :
:![[thin space (1/6-em)]](https://www.rsc.org/images/entities/char_2009.gif) acetonitrile in a ratio of 50
acetonitrile in a ratio of 50![[thin space (1/6-em)]](https://www.rsc.org/images/entities/char_2009.gif) :
:![[thin space (1/6-em)]](https://www.rsc.org/images/entities/char_2009.gif) 25
25![[thin space (1/6-em)]](https://www.rsc.org/images/entities/char_2009.gif) :
:![[thin space (1/6-em)]](https://www.rsc.org/images/entities/char_2009.gif) 25, V/V, 50 mg of the sample was dissolved in 1 mL of the reconstitution solvent, vortexed for 2 min, ultrasonicated for 10 min, and then centrifuged at 10
25, V/V, 50 mg of the sample was dissolved in 1 mL of the reconstitution solvent, vortexed for 2 min, ultrasonicated for 10 min, and then centrifuged at 10![[thin space (1/6-em)]](https://www.rsc.org/images/entities/char_2009.gif) 000 rpm for 10 min. The injected concentration was 2.5 μg μL−1, and the sample was injected in negative mode and again injected in positive mode. Data were processed using MS-DIAL 4.8, and the used reference databases were: ReSpect negative and ReSpect positive. The MasterView software was used for feature (peaks) extraction from total ion chromatogram (TIC).
000 rpm for 10 min. The injected concentration was 2.5 μg μL−1, and the sample was injected in negative mode and again injected in positive mode. Data were processed using MS-DIAL 4.8, and the used reference databases were: ReSpect negative and ReSpect positive. The MasterView software was used for feature (peaks) extraction from total ion chromatogram (TIC).
2.5. Green synthesis of AgNPs
A solution of 0.1 M AgNO3 was freshly prepared and preserved in an ambient closed glass container, then, 100 mL of aqueous solution of the R. monosperma extract (RME, 10 g L−1) was added to a freshly prepared AgNO3 solution (0.1 M), mixed well, and kept in a dark place. The mixed solution was observed for physical appearance changes every 15 minutes to check the end of the reaction. After the reaction was complete, the resulting mixture was centrifuged at 3000 rpm for 30 min and then washed 3 times with deionized water, followed by washing with absolute ethanol for three times. The formed nanoparticles were immediately dried at room temperature.2.6. Characterization of the formed nanoparticles
2.7. Microbiological study
2.8. Bioinformatics study
2.9. Molecular docking study
For ligands, the chemical structures of Retama monosperma extract were extracted from the PubChem database in the SDF format and then converted into the PDBQT format using the Open Babel software24 while being prepared using prepare_ligand4.py command in AutoDockTools (ADT, v1.5.6).25
3. Results and discussion
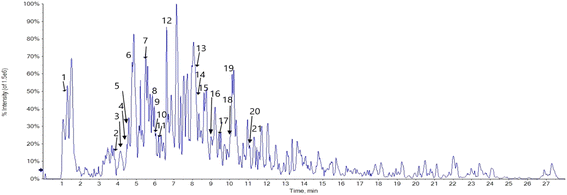
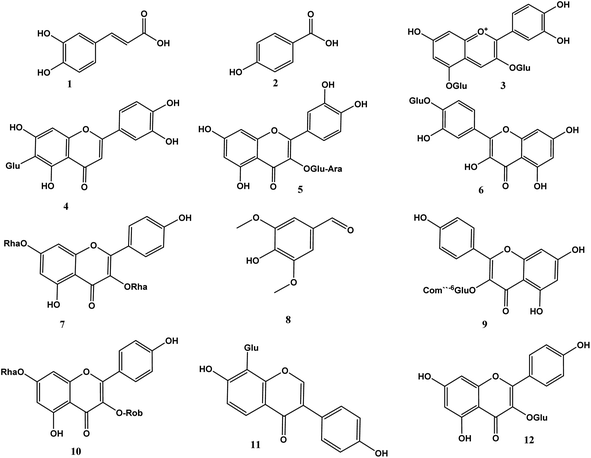
3.1. LC-ESI/MS/MS analysis
Phenolic profiling of RME was investigated tentatively by LC-ESI/MS/MS analysis in the negative ion mode, based on [M–H] of the compounds and fragmentation pattern of each compound. The LC-ESI-MS/MS analysis tentatively identified 21 phenolic compounds; 17 flavonoids, 2 phenolic acids, 1 anthraquinone and 1 aldehyde. Caffeic acid and p-hydroxybenzoic acid were identified at m/z [M–H]− 179.05 and 137.02, respectively. Syringaldehyde was identified at [M–H]− 181.05, and the identified anthraquinone was cyanidin-3,5-di-O-glucoside at m/z [M–H]− 609.15. The identified flavonoids are 5 aglycones and 12 flavonoid glycosides. The flavonoid glycosides are mainly kaempferol derivatives and quercetin derivatives, luteolin-6-C-glucoside and daidzein-8-C-glucoside, myricitrin, and acacetin-7-O-rutinoside. The identified kaempferol derivatives at m/z [M–H]− 577.16, 593.15, 739.21, 477.09, 593.05, and 431.10 corresponding to kaempferol-3,7-O-bis-alpha-L-rhamnoside, kaempferol-3-O-(6′′′′-p-coumaroyl)-glucoside, kaempferol-3-O-robinoside-7-O-rhamnoside, kaempferol-3-O-glucoside, kaempferol-7-neohesperidoside, and kaempferol-3-O-alpha-L-rhamnoside in the same order. Quercetin derivatives were quercetin-3-O-arabinoglucoside and quercetin-4′-glucoside at m/z [M–H]− 595.02 and 463.12, respectively. The identified aglycones are quercetin at m/z [M–H]− 301.01, luteolin at m/z [M–H]− 285.04, apigenin at m/z [M–H]− 269.04, acacetin at m/z [M–H]− 283.02, and naringenin at m/z [M–H]− 271.06 (Fig. 1, 2 and Table 1).| No. | Compound | RT (min) | Precursor m/z | Product ions Ms/Ms | Molecular formula | Ref. |
|---|---|---|---|---|---|---|
| 1 | Caffeic acid | 1.29 | 179.05 | 153.02, 135.11 | C9H8O4 | 28 |
| 2 | p-Hydroxybenzoic acid | 3.98 | 137.02 | 93.04 | C7H6O3 | 29 |
| 3 | Cyanidin-3,5-di-O-glucoside | 4.41 | 609.15 | 447.01, 285.33 | C27H31O16 | 30 |
| 4 | Luteolin-6-C-glucoside | 4.60 | 447.05 | 285.42 | C21H20O11 | 31 |
| 5 | Quercetin-3-O-arabinoglucoside | 4.61 | 595.02 | 433.01, 301.05 | C26H28O16 | 30 |
| 6 | Quercetin-4′-glucoside | 4.82 | 463.12 | 301.07 | C21H20O12 | 30 |
| 7 | Kaempferol-3,7-O-bis-alpha-L-rhamnoside | 5.72 | 577.16 | 431.13, 285.06 | C27H30O14 | 30 |
| 8 | Syringaldehyde | 5.98 | 181.05 | 166.73 | C9H10O4 | 32 |
| 9 | Kaempferol-3-O-(6′′′′-p-coumaroyl)-glucoside | 6.03 | 593.15 | 477.11, 285.04 | C30H26O13 | 3 |
| 10 | Kaempferol-3-O-robinoside-7-O-rhamnoside | 6.15 | 739.21 | 593.02, 430.78 | C33H40O19 | 33 |
| 11 | Daidzein-8-C-glucoside | 6.43 | 415.10 | 379.14, 249.03 | C21H20O9 | 34 |
| 12 | Kaempferol-3-O-glucoside | 6.66 | 447.09 | 285.04 | C21H20O11 | 35 |
| 13 | Myricitrin | 8.34 | 463.15 | 271.13, 151.06 | C21H20O12 | 36 |
| 14 | Kaempferol-7-neohesperidoside | 8.45 | 593.05 | 447.0, 284.80 | C27H30O15 | 37 |
| 15 | Acacetin-7-O-rutinoside | 8.57 | 591.15 | 455.08, 249.11 | C28H32O14 | 38 |
| 16 | Kaempferol-3-O-alpha-L-rhamnoside | 9.19 | 431.10 | 285.03, 179.01 | C21H20O10 | 39 |
| 17 | Quercetin | 9.89 | 301.10 | 273.26, 178.95 | C15H10O7 | 40 |
| 18 | Luteolin | 9.92 | 285.04 | 151.03, 133.10 | C15H10O6 | 40 |
| 19 | Apigenin | 10.24 | 269.0462 | 254.05, 225.04 | C15H10O5 | 41 |
| 20 | Acacetin | 11.11 | 283.0247 | 273.09, 257.05 | C16H12O5 | 42 |
| 21 | Naringenin | 11.31 | 271.0604 | 185.09 | C15H12O5 | 43 |
3.2. Characterization of silver nanoparticles synthesized by RME (RME-AgNPs)
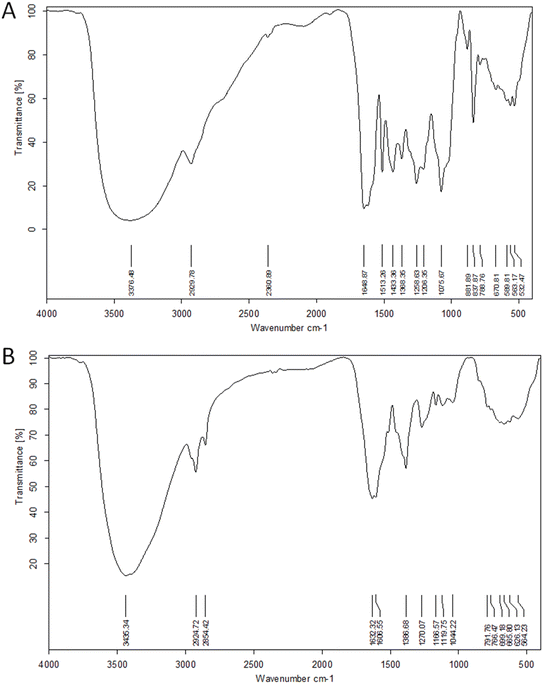
![[double bond, length as m-dash]](https://www.rsc.org/images/entities/char_e001.gif) O of phenolic acids and flavonoids, respectively. The peak at 1075 cm−1 validated the RME's secondary OH groups. The spectrum of RME-AgNPs showed the same peaks indicating that the compounds in the extract capped the AgNPs, but with a much lower intensity due to the involvement of the extract's functional groups in the bio-reduction process.12
O of phenolic acids and flavonoids, respectively. The peak at 1075 cm−1 validated the RME's secondary OH groups. The spectrum of RME-AgNPs showed the same peaks indicating that the compounds in the extract capped the AgNPs, but with a much lower intensity due to the involvement of the extract's functional groups in the bio-reduction process.12
3.3. Microbiology study
| Bacterial strains | R. monosperma extract | R. monosperma AgNPs | Positive control | |||||
|---|---|---|---|---|---|---|---|---|
| Diameter of inhibition zone (mm) ± SD | MIC (μg mL−1) | MBC (μg mL−1) | Diameter of inhibition zone (mm) ± SD | MIC (μg mL−1) | MBC (μg mL−1) | Diameter of inhibition zone (mm) ± SD | MIC (μg mL−1) | |
| a MIC: minimum inhibitory concentration; MBC: minimum bactericidal concentration. Ampicillin (10 mg mL−1) was used as a positive control. The values represent the mean of the inhibition zone diameter (mm) ± standard deviation (SD). | ||||||||
| Gram-positive | ||||||||
| Pseudomonas aeruginosa | 17.0 ± 0.0 | 512 | 512 | 26.0 ± 0.0 | 64 | 64 | 24.0 ± 0.0 | 128 |
| Escherichia coli | 18.0 ± 0.5 | 512 | 1024 | 24.0 ± 0.0 | 128 | 128 | 28.0 ± 0.0 | 64 |
| Klebsiella pneumoniae | 15.0 ± 0.0 | 1024 | 1024 | 20.0 ± 0.0 | 512 | 512 | 22.0 ± 0.0 | 256 |
| Serratia marcescens | 15.0 ± 0.0 | 1024 | 1024 | 19.0 ± 0.0 | 512 | 512 | 22.0 ± 0.0 | 256 |
![[thin space (1/6-em)]](https://www.rsc.org/images/entities/char_2009.gif) |
||||||||
| Gram-negative | ||||||||
| Staphylococcus aureus | 12.0 ± 0.0 | 2048 | 2048 | 20.0 ± 0.0 | 512 | 512 | 22.0 ± 0.0 | 256 |
| Bacillus subtilis | 14.0 ± 0.0 | 1024 | 1024 | 22.0 ± 0.0 | 512 | 512 | 25.0 ± 0.0 | 128 |
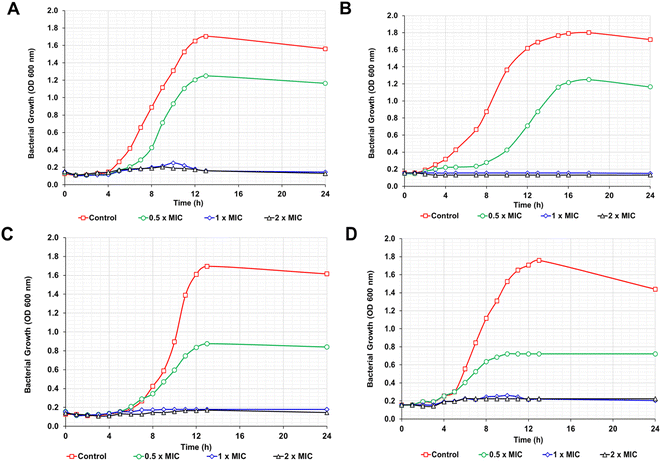
Further investigation of the antibacterial activity was performed by MIC and MBC assays. The RME-AgNPs revealed the best antibacterial properties against all bacterial strains under investigation, with the MIC and MBC values ranging from 64 to 512 μg mL−1. The corresponding values for the RME range from 512 to 2048 μg mL−1.
3.4. Network pharmacology studies
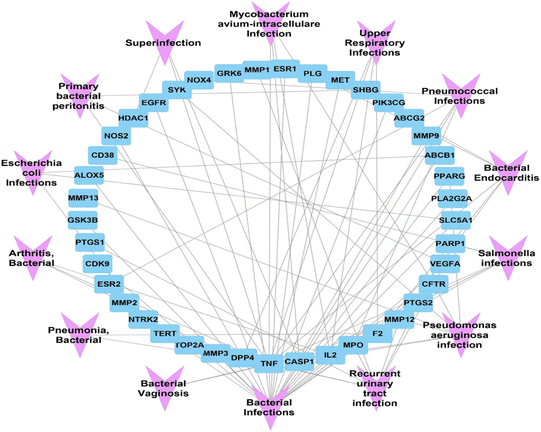
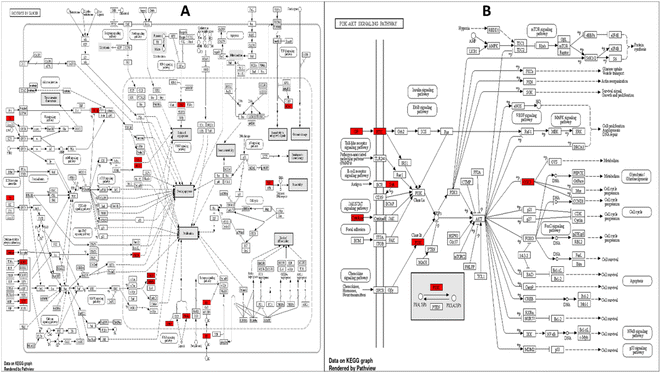
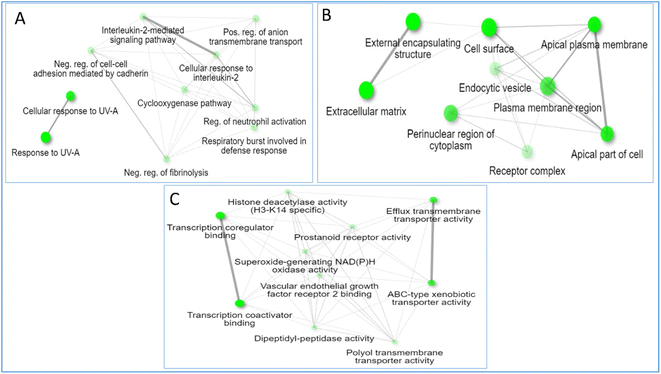
![[thin space (1/6-em)]](https://www.rsc.org/images/entities/char_2009.gif) 328 gene-disease associations was obtained. Upon filtration of the results, to focus on bacterial infections, 41 genes were found to be associated with 14 unique bacterial infections. The formed gene-bacterial infection network comprised 55 nodes and 81 edges. The top gene in the identified gene set was TNF, with 13 associations with different bacterial infections, followed by CASP1, IL2, MPO, and F2, with 6, 5, 4, and 4 associations, respectively (Fig. 11).
328 gene-disease associations was obtained. Upon filtration of the results, to focus on bacterial infections, 41 genes were found to be associated with 14 unique bacterial infections. The formed gene-bacterial infection network comprised 55 nodes and 81 edges. The top gene in the identified gene set was TNF, with 13 associations with different bacterial infections, followed by CASP1, IL2, MPO, and F2, with 6, 5, 4, and 4 associations, respectively (Fig. 11).
3.5. Molecular docking of co-crystallized ligands and Retama monosperma extract 21 compounds
To validate the docking protocol, self-docking of the co-crystallized ligand (TNF-α small-molecule inhibitor co-crystallized with PDB ID: 2AZ5) was performed. As shown in Table 3, self-docking of the co-crystallized ligand scores ΔG of −6.7248 kcal mol−1 shows similar interactions to the reported ones where four H-bonds are formed with 3 amino acids: Gln61, Tyr119, and Gly121 in addition to a pi-cation and pi–pi interactions with Tyr119 (Table 4).| Compound | ΔG (kcal mol−1) |
|---|---|
| Native | −6.7248 |
| CAFFEIC ACID | −4.0349 |
| p-Hydroxybenzoic acid | −3.7009 |
| Cyanidin-3,5-di-O-glucoside | −6.0489 |
| Luteolin-6-C-glucoside | −5.3844 |
| Quercetin-3-O-arabinoglucoside | −6.5907 |
| Quercetin-4′-glucoside | −5.2593 |
| Kaempferol-3,7-O-bis-alpha-L-rhamnoside | −6.0369 |
| Syringaldehyde | −4.3179 |
| Kaempferol-3-O-(6′′′′-p-coumaroyl)-glucoside | −5.8349 |
| Kaempferol-3-O-robinoside-7-O-rhamnoside | −6.8084 |
| Daidzein-8-C-glucoside | −5.1642 |
| Kaempferol-3-O-glucoside | −5.2014 |
| Myricitrin | −5.3469 |
| Kaempferol-7-neohesperidoside | −6.0532 |
| Acacetin-7-O-rutinoside | −6.2491 |
| Kaempferol-3-O-alpha-L-rhamnoside | −5.1377 |
| Quercetin | −4.7668 |
| Luteolin | −4.5788 |
| Apigenin | −4.7450 |
| Acacetin | −4.6155 |
| Naringenin | −4.4981 |
Molecular docking of the 21 compounds in the test set showed good binding affinities against TNF-α receptors (−3.7009 < ΔG < −6.8084 kcal mol−1) (Table 3).
Table 4 displays the 2D structure and 2D interaction of the best six scoring compounds: kaempferol-3-O-robinoside-7-O-rhamnoside, quercetin-3-O-arabinoglucoside, acacetin-7-O-rutinoside, kaempferol-7-neohesperidoside, cyanidin-3,5-di-O-glucoside and kaempferol-3,7-O-bis-alpha-L-rhamnoside with binding free energies of −6.8084, −6.5907, −6.2491, −6.0532, −6.0489 and −6.0369 kcal mol−1, respectively. All ligands showed at least one pi–pi interaction with the pocket's binding site, mainly with Tyr59 or Tyr119 or with both of them. Quercetin-3-O-arabinoglucoside was able to form a third pi–pi interaction with His15. This main type of interaction is suggested to be responsible for the antimicrobial activity, as it is also reported in the inhibitor co-crystallized with TNF-α. Another suggested important interaction is maintaining at least one H-bond with any of the pocket's sidechains.
Although kaempferol-3-O-robinoside-7-O-rhamnoside showed the highest binding affinity towards TNF-α, we cannot consider it the main component responsible for the extract antimicrobial activity as it shows non-favorable interactions; only 2 H-bonds with no pi–pi interactions. However, although kaempferol-3,7-O-bis-alpha-L-rhamnoside is the least scored hit compared to the other 5 highest scored ones, it possesses the best interactions showing 2H-bonds with Leu120 and Tyr151 and a pi–pi interaction with Tyr59. Similarly, cyanidin-3,5-di-O-glucoside was able to maintain 2H-bonds with Leu120 and Gln149 in addition to pi–pi and pi-cation interactions with Tyr119. Another hit that shows very good interaction with a high binding score is Quercetin-3-O-arabinoglucoside, which interacts with the receptor via an H-bond with Tyr151, 3 pi–pi interactions with His15 and Tyr59 and a pi–sigma interaction with Tyr119.
4. Discussion
Due to the need for eco-friendly antimicrobial agents, green-synthesized silver nanoparticles are considered advantageous over the other methods. AgNPs are characterized with their large surface area, which is significant in therapeutic applications.44A green synthesis route of nanosilver metal formation through RME led to the formation of eco-friendly, clean, safe silver nanoparticles with no application of hazardous chemical agents. The formed RME-AgNPs, upon characterization, were revealed to have a uniform spherical shape with a particle size ranging from 9.87 to 21.16 nm and the average particle size of 13.22 nm in crystalline form, as evidenced by XRD analysis. The stability of the formed RME-AgNPs was evidenced by a negative charge measured zeta potential of −15.25 mV.
The current study assessed novel green-synthesized AgNPs and RME root extract regarding their antibacterial activity. The results revealed that green-synthesized AgNPs had a higher antibacterial activity than that of the RME root extract. This is because AgNPs possess a positive charge that could attach better and penetrate through the cell wall membrane.45 Furthermore, the binding of AgNPs to the bacterial cell wall proteins causes a reduction in the membrane's permeability and leakage of intracellular components, which finally leads to bacterial death.46 In addition to the cell membrane damage, nanoparticles alter the cell function by interacting with amino acids and enzymes, causing the generation of reactive oxygen species (ROS) and misfolding of bacterial DNA.47,48
Disc diffusion assay revealed that Gram-positive bacteria were more resistant to AgNPs than Gram-negative bacteria. Previous research has reported this due to the different cell wall structures.49,50 In Gram-negative bacteria, a 1–3 μm-thick layer of lipopolysaccharides and a 8 nm-thick layer of peptidoglycan cover the cells, facilitating the diffusion of AgNP ions into the cells. However, Gram-positive bacteria have a thicker protective peptidoglycan layer that stretches over 80 nm. Thus, the damage in Gram-negative bacteria upon the interaction of AgNPs with cell walls becomes more harmful than Gram-positive strains due to the absence of the thick protective layer of peptidoglycan.7
SEM investigated the bactericidal mechanism of RME-AgNPs. The visualization of bacterial cell walls of B. subtilis, E. coli, and P. aeruginosa revealed severe damage and deformation. Moreover, the S. aureus cell wall exhibited small pores. The SEM micrographs confirmed that green-synthesized AgNPs penetrate the bacterial cells, resulting in membrane disruption, which may shrink the cell and result in cell lysis.51
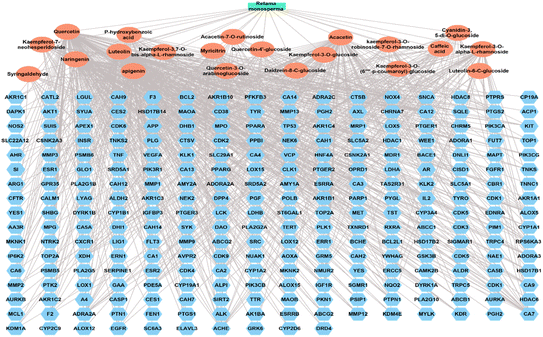
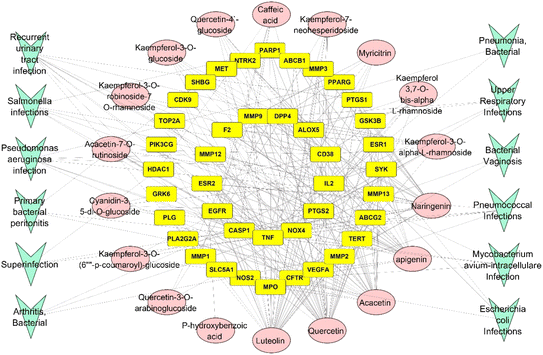
The natural green source used for synthesizing metal nanoparticles contributes to controlling the formed nanometal physicochemical characteristics and their medical applications.14 Thus, the bioinformatic study was employed to find out the top genes of the whole gene set, which is responsible for the antimicrobial activities and the top genes were determined as TNF genes. For explanation of the exact compounds among all the 21 identified compounds from RME responsible for antimicrobial potential, a network pharmacology design was constructed in a backward way, and the top compounds contributing to antimicrobial infections were defined as luteolin, quercetin, acacetin, and apigenin with 30, 29, 24 and 22 edges, respectively.
Molecular docking study identified 6 out of 21 compounds of Retama monosperma extract that scored the highest binding affinities with similar ΔG scores to those of co-crystallized inhibitors. Such compounds were kaempferol-3-O-robinoside-7-O-rhamnoside, quercetin-3-O-arabinoglucoside, acacetin-7-O-rutinoside, kaempferol-7-neohesperidoside, cyanidin-3,5-di-O-glucoside and kaempferol-3,7-O-bis-alpha-L-rhamnoside, and they were so much likely to be responsible for the biological activity (antimicrobial activity) of Retama monosperma extract.
5. Conclusion
Retama monosperma roots are natural excellent bio-reductants and capping agents for the green synthesis of silver nanoparticles with outstanding physicochemical features. The formed AgNPs exhibited a remarkably high antibacterial activity towards Gram-positive and Gram-negative bacteria and could be introduced as promising bactericidal agents in topical antimicrobial pharmaceutical preparations.Conflicts of interest
There are no conflicts to declare.Acknowledgements
The authors are thankful to the Deanship of Scientific Research at Najran University for funding this work, under the General Research Funding program grant code (NU/DRP/MRC/12/40).References
- D. Byarugaba, Antimicrobial resistance in developing countries and responsible risk factors, Int. J. Antimicrob. Agents, 2004, 24(2), 105–110 CrossRef CAS PubMed
.
- M. A. Cooper and D. Shlaes, Fix the antibiotics pipeline, Nature, 2011, 472(7341), 32 CrossRef CAS PubMed
.
- B. Alotaibi, et al., Antimicrobial activity of Brassica rapa L. flowers extract on gastrointestinal tract infections and antiulcer potential against indomethacin-induced gastric ulcer in rats supported by metabolomics profiling, J. Inflammation Res., 2021, 14, 7411 CrossRef CAS PubMed
.
- H. M. E.-S. Azzazy, A. M. Sawy, A. Abdelnaser, M. R. Meselhy, T. Shoeib and S. A. Fahmy, Peganum harmala Alkaloids and Tannic Acid Encapsulated in PAMAM Dendrimers: Improved Anticancer Activities as Compared to Doxorubicin, ACS Appl. Polym. Mater., 2022, 4, 7228–7239 CrossRef CAS
.
- N. K. Sedky, N. M. Abdel-Kader, M. Y. Issa, M. M. M. Abdelhady, S. N. Shamma, U. Bakowsky and S. A. Fahmy, Co-Delivery of Ylang Ylang Oil of Cananga odorata and Oxaliplatin Using Intelligent pH-Sensitive Lipid-Based Nanovesicles for the Effective Treatment of Triple-Negative Breast Cancer, Int. J. Mol. Sci., 2023, 24, 8392, DOI:10.3390/ijms24098392
.
- S. A. Fahmy, K. A. Nematallah, N. K. Mahdy, H. I. El-Askary, M. R. Meselhy and H. M. El-Said Azzazy, Enhanced antioxidant, antiviral, and anticancer activities of the extract of fermented Egyptian rice bran complexed with hydroxypropyl-β-cyclodextrin, ACS Omega, 2022, 7, 19545–19554 CrossRef CAS PubMed
.
- O. T. Fanoro and O. S. Oluwafemi, Bactericidal antibacterial mechanism of plant synthesized silver, gold and bimetallic nanoparticles, Pharmaceutics, 2020, 12(11), 1044 CrossRef CAS PubMed
.
- L. Boulos, Flora of Egypt, Al Hadara Publishing, Cairo, 1999, pp. 1–419 Search PubMed
.
- R. B. Garden and P. Kew, Plants of the world online, Obtenido de Royal Botanic Garden, 2022, https://www.plantsoftheworldonline.org/taxon/urn:lsid:ipni Search PubMed
.
- A. León-González, et al., Genus Retama: A review on traditional uses, phytochemistry, and pharmacological activities, Phytochem. Rev., 2018, 17, 701–731 CrossRef
.
- F. Z. Benkhouili, et al., Retama monosperma (L.) Boiss: A review of its uses in traditional medicine, chemical constituents, and pharmacologic activities. Phytomedicine Plus, 2022, p. 100349 Search PubMed
.
- S. A. Fahmy, I. M. Fawzy, B. M. Saleh, M. Y. Issa, U. Bakowsky and H. M. E.-S. Azzazy, Green Synthesis of Platinum and Palladium Nanoparticles Using Peganum harmala L. Seed Alkaloids: Biological and Computational Studies, Nanomaterials, 2021, 11, 965, DOI:10.3390/nano1104096513
.
- B. Alotaibi, et al., Antibacterial activity of nano zinc oxide green-synthesised from Gardenia thailandica triveng. Leaves against Pseudomonas aeruginosa clinical isolates: In vitro and in vivo study, Artif. Cells, Nanomed., Biotechnol., 2022, 50(1), 96–106 CrossRef CAS PubMed
.
- F. A. Mokhtar, et al., Green Biosynthesis of Silver Nanoparticles Using Annona glabra and Annona squamosa Extracts with Antimicrobial, Anticancer, Apoptosis Potentials, Assisted by In Silico Modeling, and Metabolic Profiling, Pharmaceuticals, 2022, 15(11), 1354 CrossRef CAS PubMed
.
- S. A. Fahmy, A. Ramzy, A. A. Mandour, S. Nasr, A. Abdelnaser, U. Bakowsky and H. M. E.-S. Azzazy, PEGylated Chitosan Nanoparticles Encapsulating Ascorbic Acid and Oxaliplatin Exhibit Dramatic Apoptotic Effects against Breast Cancer Cells, Pharmaceutics, 2022, 14, 407, DOI:10.3390/pharmaceutics14020407
.
- S. A. Fahmy, N. K. Mahdy, H. Al Mulla, A. N. ElMeshad, M. Y. Issa and H. M. E.-S. Azzazy, PLGA/PEG Nanoparticles Loaded with Cyclodextrin-Peganum harmala Alkaloid Complex and Ascorbic Acid with Promising Antimicrobial Activities, Pharmaceutics, 2022, 14, 142, DOI:10.3390/pharmaceutics14010142
.
- A. Bauer and M. Turck, et al., Antibiotic susceptibility testing by a standardized single disk method, Am. J. Clin. Pathol., 1966, 45(4), 493 CrossRef CAS PubMed
.
- CLSI, Performance Standards for Antimicrobial Susceptibility Testing, CLSI supplement M100, Clinical and Laboratory Standards Institute, Wayne, PA, 28th edn, vol. 38, 2018 Search PubMed
.
- S. Kim, et al., PubChem substance and compound databases, Nucleic Acids Res., 2016, 44(D1), D1202–D1213 CrossRef CAS PubMed
.
- U. Consortium, UniProt: a hub for protein information, Nucleic Acids Res., 2015, 43(D1), D204–D212 CrossRef PubMed
.
- D. Gfeller, et al., SwissTargetPrediction: a web server for target prediction of bioactive small molecules, Nucleic Acids Res., 2014, 42(W1), W32–W38 CrossRef CAS PubMed
.
- J. Piñero, et al., The DisGeNET knowledge platform for disease genomics: 2019 update, Nucleic Acids Res., 2020, 48(D1), D845–D855 Search PubMed
.
- S. X. Ge, D. Jung and R. Yao, ShinyGO: a graphical gene-set enrichment tool for animals and plants, Bioinformatics, 2020, 36(8), 2628–2629 CrossRef CAS PubMed
.
- N. M. O'Boyle, et al., Open Babel: An open chemical toolbox, J. Cheminf., 2011, 3(1), 1–14 Search PubMed
.
- R. Huey and G. M. Morris, Using AutoDock 4 with AutoDocktools: a tutorial, The Scripps Research Institute, USA, 2008, vol. 54, p. 56 Search PubMed
.
- I. Kufareva and R. Abagyan, Methods of protein structure comparison. Homology Modeling: Methods and Protocols, 2012, pp. 231–257 Search PubMed
.
- J. Fuhrmann, et al., A new Lamarckian genetic algorithm for flexible ligand-receptor docking, J. Comput. Chem., 2010, 31(9), 1911–1918 CAS
.
- X. Wang, et al., Simultaneous determination of caffeic acid and its major pharmacologically active metabolites in rat plasma by LC-MS/MS and its application in pharmacokinetic study, Biomed. Chromatogr., 2015, 29(4), 552–559 CrossRef CAS PubMed
.
- S. Tsuruda, T. Sakamoto and K. Akaki, Simultaneous determination of twelve sweeteners and nine preservatives in foods by solid-phase extraction and LC-MS/MS, Shokuhin Eiseigaku Zasshi, 2013, 54(3), 204–212 CrossRef CAS PubMed
.
- E. E. Eltamany, et al., Chemical profiling, antioxidant, cytotoxic activities and molecular docking simulation of Carrichtera annua DC.(Cruciferae), Antioxidants, 2020, 9(12), 1286 CrossRef CAS PubMed
.
- P. Geng, et al., Comprehensive characterization of C-glycosyl flavones in wheat (Triticum aestivum L.) germ using UPLC-PDA-ESI/HRMSn and mass defect filtering, J. Mass Spectrom., 2016, 51(10), 914–930 CrossRef CAS PubMed
.
- J. Prothmann, et al., Ultra-high-performance supercritical fluid chromatography with quadrupole-time-of-flight mass spectrometry (UHPSFC/QTOF-MS) for analysis of lignin-derived monomeric compounds in processed lignin samples, Anal. Bioanal. Chem., 2017, 409, 7049–7061 CrossRef CAS PubMed
.
- R. E. March, X. S. Miao and C. D. Metcalfe, A fragmentation study of a flavone triglycoside, kaempferol-3-O-robinoside-7-O-rhamnoside, Rapid Commun. Mass Spectrom., 2004, 18(9), 931–934 CrossRef CAS PubMed
.
- A. A. Carvalho, et al., First report of flavonoids from leaves of Machaerium acutifolium by DI-ESI-MS/MS, Arabian J. Chem., 2022, 15(5), 103765 CrossRef CAS
.
- S. S. El-Hawary, et al., Jasminum azoricum L. leaves: HPLC-PDA/MS/MS profiling and in-vitro cytotoxicity supported by molecular docking, Nat. Prod. Res., 2021, 35(23), 5518–5520 CrossRef CAS PubMed
.
- N. A. Latiff, et al., Liquid chromatography tandem mass spectrometry for the detection and validation of quercetin-3-O-rutinoside and myricetin from fractionated Labisia pumila var. Alata, Malaysian J. Anal. Sci., 2018, 22(5), 817–827 Search PubMed
.
- Y. Chen, et al., Characterization and quantification by LC-MS/MS of the chemical components of the heating products of the flavonoids extract in pollen typhae for transformation rule exploration, Molecules, 2015, 20(10), 18352–18366 CrossRef CAS PubMed
.
- F. S. M. Mahrous, H. Mohammed and R. Sabour, LC-ESI-QTOF-MS/MS of Holoptelea integrifolia (Roxb.) Planch. leaves and In silico study of phenolic compounds' antiviral activity against the HSV1 virus, Azhar International Journal of Pharmaceutical and Medical Sciences, 2021, 1(3), 91–101 CrossRef
.
- L. F. Ibrahim, et al., Flavonoid investigation, LC–ESIMS profile and cytotoxic activity of Raphanus raphanistrum L.(Brassicaceae), J. Chem. Pharm. Res., 2016, 8(7), 786–793 CAS
.
- A. A. Chernonosov, E. A. Karpova and E. M. Lyakh, Identification of phenolic compounds in Myricaria bracteata leaves by high-performance liquid chromatography with a diode array detector and liquid chromatography with tandem mass spectrometry, Rev. Bras. Farmacogn., 2017, 27, 576–579 CrossRef CAS
.
- N. G. Attallah, et al., Mechanistic insights on the in vitro antibacterial activity and in vivo hepatoprotective effects of salvinia auriculata aubl against methotrexate-induced liver injury, Pharmaceuticals, 2022, 15(5), 549 CrossRef CAS PubMed
.
- C. Cortés, et al., Phenolic profile, antioxidant and enzyme inhibition properties of the chilean endemic plant Ovidia pillopillo (Gay) meissner (Thymelaeaceae), Metabolites, 2022, 12(2), 90 CrossRef PubMed
.
- X. Xiong, et al., Development and Validation of a Sensitive Liquid Chromatography–Tandem Mass Spectrometry Method for the Determination of Naringin and Its Metabolite, Naringenin, in Human Plasma, J. Chromatogr. Sci., 2014, 52(7), 654–660 CAS
.
- M. Ovais, et al., Wound healing applications of biogenic colloidal silver and gold nanoparticles: recent trends and future prospects, Appl. Microbiol. Biotechnol., 2018, 102, 4305–4318 CrossRef CAS PubMed
.
- F. Monedeiro, et al., Monitoring of bactericidal effects of silver nanoparticles based on protein signatures and VOC emissions from Escherichia coli and selected salivary bacteria, J. Clin. Med., 2019, 8(11), 2024 CrossRef CAS PubMed
.
- M. Seong and D. G. Lee, Silver nanoparticles against Salmonella enterica serotype typhimurium: role of inner membrane dysfunction, Curr. Microbiol., 2017, 74, 661–670 CrossRef CAS PubMed
.
- C. Liao, Y. Li and S. C. Tjong, Bactericidal and cytotoxic properties of silver nanoparticles, Int. J. Mol. Sci., 2019, 20(2), 449 CrossRef PubMed
.
- A. Rónavári, et al., Biological activity of green-synthesized silver nanoparticles depends on the applied natural extracts: a comprehensive study, Int. J. Nanomed., 2017, 12, 871 CrossRef PubMed
.
- Q. L. Feng, et al., A mechanistic study of the antibacterial effect of silver ions on Escherichia coli and Staphylococcus aureus, J. Biomed. Mater. Res., 2000, 52(4), 662–668 CrossRef CAS PubMed
.
- E. D. Cavassin, et al., Comparison of methods to detect the in vitro activity of silver nanoparticles (AgNP) against multidrug resistant bacteria, J. Nanobiotechnol., 2015, 13(1), 1–16 CrossRef PubMed
.
- M. Yasir, D. Dutta and M. D. Willcox, Mode of action of the antimicrobial peptide Mel4 is independent of Staphylococcus aureus cell membrane permeability, PLoS One, 2019, 14(7), e0215703 CrossRef CAS PubMed
.
| This journal is © The Royal Society of Chemistry 2023 |

