
 Open Access Article
 This Open Access Article is licensed under a Creative Commons Attribution-Non Commercial 3.0 Unported Licence
TD-DFT calculations, dipole moments, and solvatochromic properties of 2-aminochromone-3-carboxaldehyde and its hydrazone derivatives†
Omima M. I. Adly *,
Ali Taha,
Shery A. Fahmy and
Magdy A. Ibrahim
*,
Ali Taha,
Shery A. Fahmy and
Magdy A. Ibrahim
Department of Chemistry, Faculty of Education, Ain Shams University, Roxy, Cairo, Egypt. E-mail: omima_adly@edu.asu.edu.eg
First published on 5th September 2023
Abstract
2-Aminochromone-3-carboxaldehyde (ACC) and its hydrazones (ACMHCA and ACMNPHTCA) with semicarbazide hydrochloride and N-phenylthiosemicarbazide were synthesized and characterized by elemental analysis and spectral studies. The solvatochromic behavior of the title compounds in various solvents showed distinct bathochromic shifts on going from nonpolar to polar solvents, suggesting intramolecular-charge-transfer (ICT) solute–solvent interactions. The ground and excited state dipole moments of ACC, ACMHCA, and ACMNPHTCA were determined experimentally by the solvatochromic shift method using the Bilot–Kawski, Lippert–Mataga, Bakhshiev, Kawski–Chamma–Viallet functions, and a microscopic Reichardt's solvent polarity parameter (ENT). All the investigated molecules showed a substantial increase in the dipole moment upon excitation to the emitting state. The experimental results were generally consistent with the values obtained by the TD-DFT, B3LYP/6-311G++(d,p) method. Molecular electrostatic potential (MEP) mapping and natural charge and natural bonding orbital (NBO) analysis were performed and the results were discussed. The 1H NMR chemical shifts of the prepared compounds were simulated by the gage independent atomic orbital (GIAO) method and compared with their experimental chemical shift values. The biological activity data were correlated with the frontier molecular orbitals. The photovoltaic behavior of the title compounds showed there was sufficient electron injection.
1. Introduction
Chromones have a wide range of biological applications,1 including recently for the treatment of COVID-19 disease.2 Owing to their abundance in plants and their low mammalian toxicity, chromone derivatives are present in large amounts in the diets of humans.3,4 The chromone moiety is an essential pharmacophore of a large number of bioactive molecules.5–7 Hydrazones are a class of compounds that are well-known to possess various kinds of biological activities,8 and are utilized as an intermediate for the preparation of various different heterocyclic compounds9,10. It is well known that the spectral behavior of an organic molecule is strongly related to its structure in both the ground and excited states. The solvent effect on absorption and fluorescence spectra is of particular importance.11 Changing the solvent is accompanied by a change in polarity of the surrounding medium, thus affecting the ground and excited states in different ways. So, a systematic analysis of the solvent effect would be useful for studying the excited state behavior of the molecules.11–13Dipole moments for short-lived species provide important information about the excited states, also providing useful information on their emission energy as a function of solvent polarity.11 Various methods have been reported for the determination of the dipole moments of fluorescent molecules.14–18 Among these, the solvatochromic shift method has been widely accepted for the determination of ground and singlet excited dipole moments because of the linear correlation between the spectral parameters and solvent polarity functions.19–21 Since, not many literature reports can be found based on the determination of the ground and singlet excited state dipole moments for the titled molecules (Scheme 1), the present study focused on the solvatochromic shift for the determination of the ground and singlet excited state dipole moments of the synthesized molecules, namely 2-aminochromone-3-carboxaldehyde (ACC) and its hydrazones, with semicarbazide hydrochloride and N-phenylthiosemicarbazide yielding 2-[(2-aminochromon-3-yl)methylidene]hydrazine carboxamide (ACMHCA) and 2-[(2-aminochromon-3-yl)methylidene]-N-phenylhydrazine carbothioamide (ACMNPHTCA) (Scheme 1).22,23 The specific and nonspecific interactions between the solvent polarity parameters and solute molecules were studied with the current molecules based on the linear solvation free energy relationship (LSFER).24 The Gaussian 09 program was used based on TD-DFT calculations at the B3LYP/6-311G++(d,p) level to optimize the present compounds to complement the experimental results.25 In addition, estimations of the effect of the structural parameters data on the antimicrobial activity were performed.
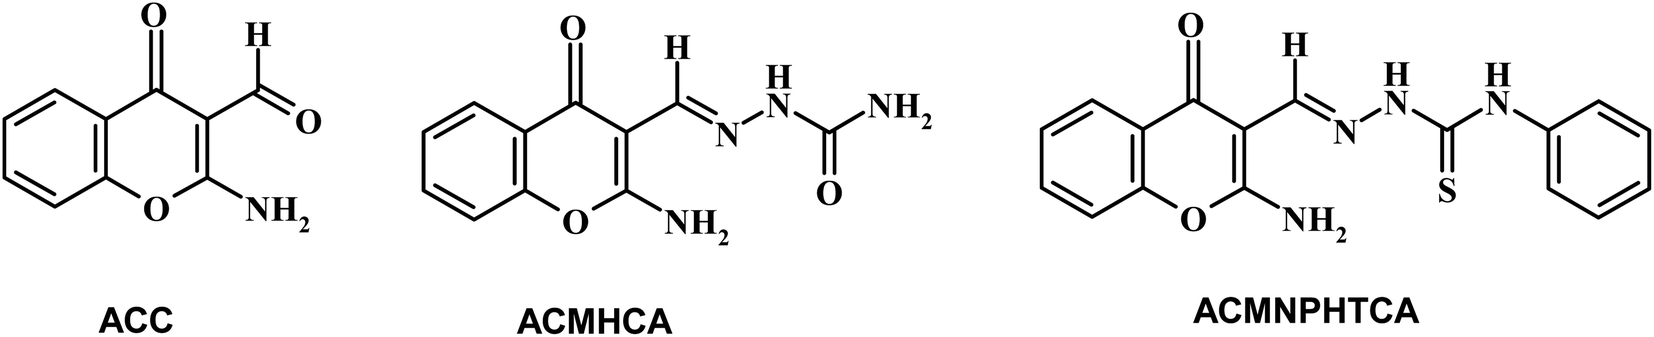 | ||
| Scheme 1 Structural formulas of ACC, ACMHCA, and ACMNPHTCA. | ||
2. Experimental
2.1. Measurements
Elemental analyses (C, H, N, and S) were carried out using a Vario El-Elementar system at the Egyptian Ministry of Defense, Chemical War Department. FTIR spectra were recorded using KBr disks on an FT IR Nicolet IS10 spectrometer. A JASCO V-550 UV-VIS spectrophotometer was used to measure the electronic spectra of the organic compounds (200–400 nm). The fluorescence measurements were recorded at room temperature on a PerkinElmer 650-10S spectrofluorimeter, equipped with a 1 cm quartz cell and 150 W xenon Arc lamp at room temperature. 1H NMR (300 MHZ) measurements were performed on a Mercury-300 BB system, using DMSO-d6 as a solvent and TMS (δ) as an internal reference.2.2. Materials
All the chemicals and solvents were analytical grade and were used without further purification. The common solvents for spectral measurements were obtained from either BDH or Merck products, including methanol (MeOH), absolute ethanol (EtOH), diethylether, dimethylformamide (DMF), dimethylsulfoxide (DMSO), tetrahydrofuran (THF), 1,4-dioxane (1,4-diox), acetone (Me2CO), benzene, chloroform (CHCl3), dichloromethane (DCM), ethyl acetate (Etac), and isopropanol (2-PrOH).2.3. Preparation of the organic compounds
Chromone-3-carboxaldehyde was prepared by the Vilsmeier–Haack (POCl3/DMF) formylation reaction on 2-hydroxyacetophenone.26 The reaction of 3-formylchromone with hydroxylamine hydrochloride produced the corresponding chromone-3-carboxaldehyd-oxime, which rearranged in sodium hydroxide solution giving 2-aminochromone-3-carboxaldehyde (ACC).27 The condensation of ACC with either semicarbazide hydrochloride or N-phenylthiosemicarbazide produced the corresponding hydrazone, ACMHCA or ACMNPHTCA, respectively (Scheme 2).22,23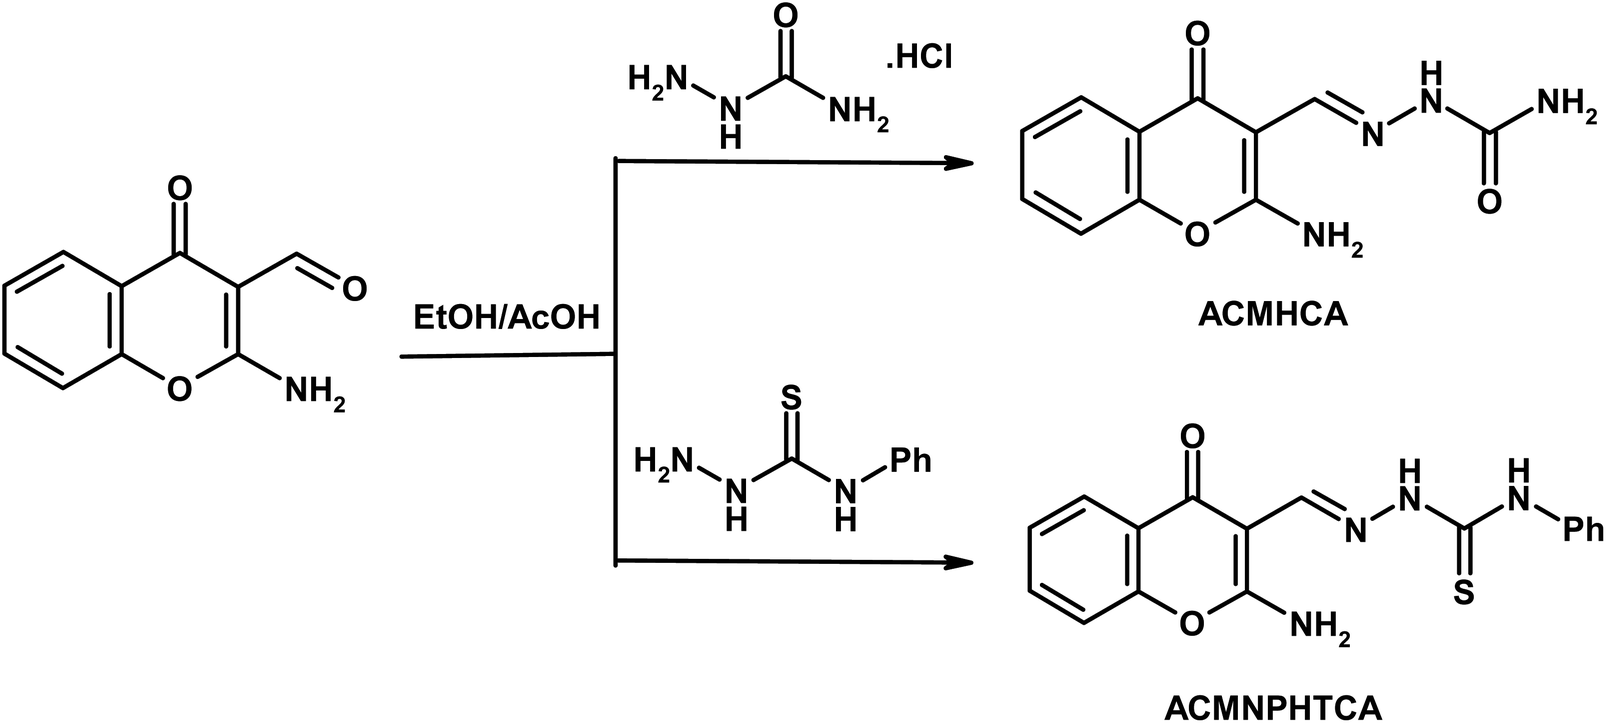 | ||
| Scheme 2 Synthetic routes for the hydrazones ACMHCA and ACMNPHTCA. | ||
The current hydrazones may exist in various tautomeric forms, such as keto–enol forms for ACMHCA and thione-thiol forms for ACMNPHTCA, as shown in Scheme 3 and Scheme 4.
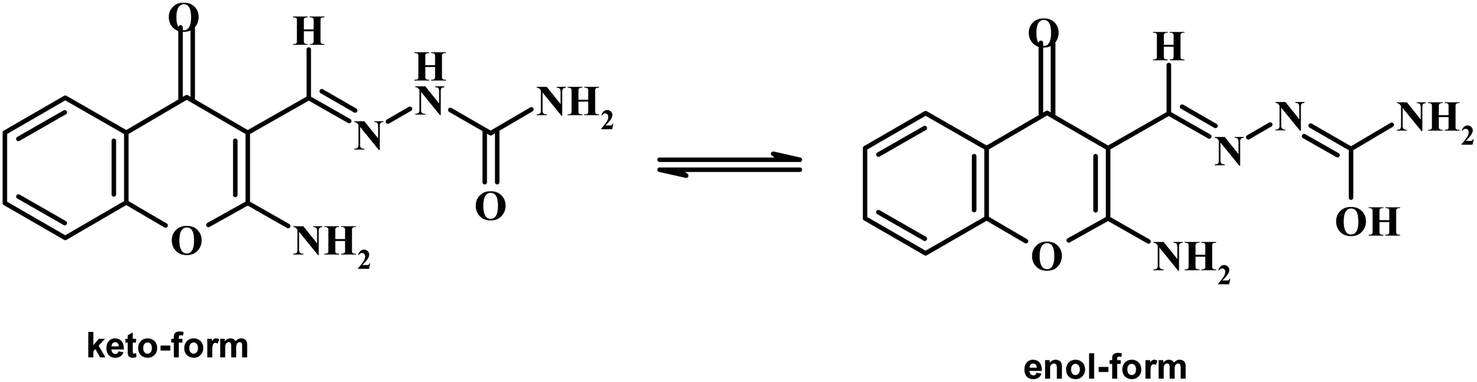 | ||
| Scheme 3 Keto–enol tautomeric form of ACMHCA. | ||
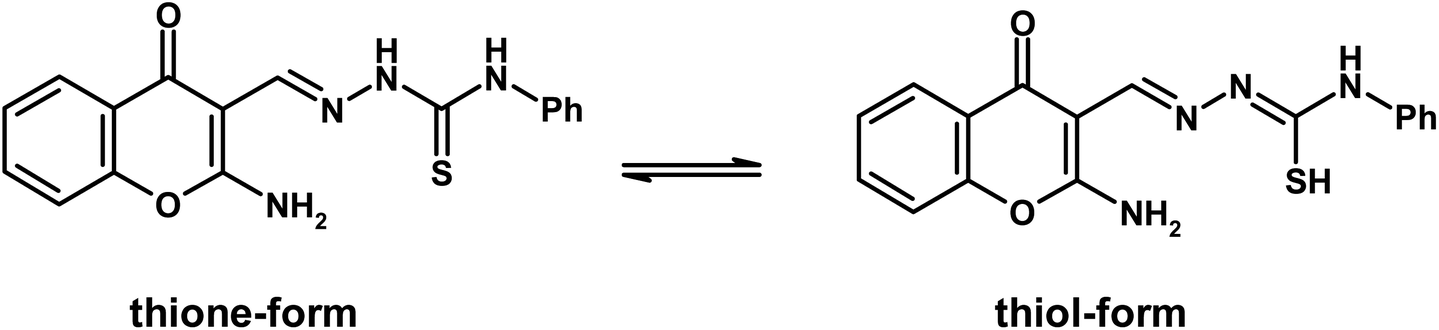 | ||
| Scheme 4 Thione-thiol tautomeric form of ACMNPHTCA. | ||
2.4. Experimental details
Step 1: formation of chromone-3-carboxaldehyd-oxime.
A mixture of chromone-3-carboxaldehyde (1.74 g, 10 mmol) and hydroxylamine hydrochloride (0.77 g, 11 mmol) in 95% ethanol (15 mL) was heated under reflux for 15 min. The white crystals obtained during heating were filtered and recrystallized from DMF/H2O; yield: 1.60 g (85%), m.p.: 209–210 °C.
Step 2: Rearrangement of chromone-3-carboxaldehyd-oxime.
A mixture of the previous oxime (1.87 g, 10 mmol) and 0.05 M sodium hydroxide solution (15 mL) was stirred at 70 °C for 2 h. Water was added (50 mL) and the solid obtained was filtered and recrystallized from AcOH as pale yellow crystals; yield: 1.10 g (58%), m.p.: 252–253 °C.
IR (KBr, ν/cm−1): 3305, 3175 (NH2), 1671 (C![[double bond, length as m-dash]](https://www.rsc.org/images/entities/char_e001.gif) Oaldehyde), 1636 (COγ-pyrone), 1590 (CC). UV/vis (in DMF, λmax/nm): 268, 288, and 302 nm. 1H NMR (DMSO-d6, δ/ppm, 300 MHz): 7.40 (t, 1H, H-6, J = 7.5 Hz), 7.55 (d, 1H, H-6, J = 7.5 Hz), 7.79 (t, 1H, H-7, J = 7.5 Hz), 8.04 (d, 1H, H-5, J = 7.5 Hz), 9.60 (br, 2H, NH2 exchangeable with D2O), 10.14 (s, 1H, CHO). Anal. Found (Calcd.) for C11H9N4O2 (M.Wt): 187.18; % C: 64.38 (64.36); % H: 5.40 (5.35); N: 6.83 (6.80).
Oaldehyde), 1636 (COγ-pyrone), 1590 (CC). UV/vis (in DMF, λmax/nm): 268, 288, and 302 nm. 1H NMR (DMSO-d6, δ/ppm, 300 MHz): 7.40 (t, 1H, H-6, J = 7.5 Hz), 7.55 (d, 1H, H-6, J = 7.5 Hz), 7.79 (t, 1H, H-7, J = 7.5 Hz), 8.04 (d, 1H, H-5, J = 7.5 Hz), 9.60 (br, 2H, NH2 exchangeable with D2O), 10.14 (s, 1H, CHO). Anal. Found (Calcd.) for C11H9N4O2 (M.Wt): 187.18; % C: 64.38 (64.36); % H: 5.40 (5.35); N: 6.83 (6.80).
IR (KBr, ν/cm−1): 3472, 3279, 3146 (NH, NH2), 1721 (COamide), 1659 (COγ-pyrone), 1613 (CN), 1533 (CC). UV/vis (in DMF, λmax/nm): 259, 286, and 316 nm. 1H NMR (DMSO-d6, δ/ppm, 300 MHz): 6.38 (br, 2H, NH2 exchangeable with D2O), 7.36–7.41 (m, 2H, H-6 and H-8), 7.66 (t, 1H, H-7, J = 7.5 Hz), 7.98 (d, 1H, H-5, J = 7.2 Hz), 8.38 (s, 1H, CHN), 8.64 (br, 2H, NH2 exchangeable with D2O), 9.80 (br, 1H, NH, exchangeable with D2O). 13C NMR (DMSO-d6, δ, 75 MHz): 92.6 (C-3), 116.9 (C-8), 122.1 (C-4a), 125.2 (C-7), 125.5 (C-6), 133.2 (C-5), 138.7 (CHN), 152.9 (C-8a), 156.9 (CO as amide), 162.0 (C-2), 173.4 (CO as C-4). MS (m/z); 246. Anal. Found (Calcd.) for C11H10N4O3 (M.Wt): 246.22; % C: 53.35 (53.65); % H: 3.93 (4.09); % N: 22.54 (22.75).
IR (KBr, ν/cm−1): 3343, 3219 (NH, NH2), 1640 (COγ-pyrone), 1605 (CN), 1559 (CC). UV/vis (in DMF, λmax/nm): 289 and 355 nm. 1H NMR (DMSO-d6, δ/ppm, 300 MHz): 7.17 (t, 1H, H-6, J = 7.8 Hz), 7.33–7.47 (m, 6H, Ph–H and H-8), 7.69 (t, 1H, H-7, J = 7.5 Hz), 8.00 (d, 1H, H-5, J = 7.2 Hz), 8.73 (s, 1H, CHN), 8.75 (br, 2H, NH2 exchangeable with D2O), 9.89 (br, 1H, NH, exchangeable with D2O), 11.45 (s, 1H, NH, exchangeable with D2O). 13C NMR (DMSO-d6, δ, 75 MHz): 91.8 (C-3), 116.4 (C-8), 121.4 (C-4a), 123.5 (C-7), 124.8 (Ph–C), 125.2 (C-6), 126.6, 127.9, 128.2, 128.6 (Ph–C), 133.0 (C-5), 139.5 (CHN),142.7 (Ph–C), 152.5 (C-8a), 161.7 (C-2), 173.4 (CO as C-4) 174.9 (CS). MS (m/z); 338. Anal. Found (Calcd.) for C17H14N4O2S (M.Wt); 338.39. % C: 60.30 (60.34); % H: 4.12 (4.17); % N: 16.23 (16.56); % S: 9.50 (9.48).
2.5. Computational method
The Gaussian 09 program with Gauss View 5.0 packages was used to carry out the calculations for the current compounds.25 The ground state geometries of the current molecules were optimized using the TD-DFT functional theory at the B3LYP/6-31G++(d,p) level of theory.28 This function was chosen to give relatively good geometries optimization.29–31 Mulliken's population analysis (MPA) method was chosen because it is the most widely used population analysis method for determining atomic charges.30,322.6. Antimicrobial activity
The antimicrobial activity of the synthesized compounds was determined using the standardized disk-agar diffusion method.33 The used sensitive organisms were: Staphylococcus aureus (ATCC 25923) and Bacillus subtilis (ATCC 6635) as Gram-positive bacteria; Escherichia coli (ATCC 25922) and Salmonella typhimurium (ATCC 14028) as Gram-negative bacteria; yeast as Candida albicans (ATCC 10231), and fungus as A. fumigatus. Three replicates were carried out for each extract against each of the test organisms. The antibiotic chloramphenicol was used as a standard reference in the case of the Gram-negative bacteria, cephalothin for the Gram-positive bacteria, and cycloheximide for the yeasts and fungi.The test for the antimicrobial activity was performed on medium potato dextrose agar (PDA), which contained an infusion of 200 g potatoes, 6 g dextrose, and 15 g agar. Uniform-sized filter paper disks (6 mm diameter, 3 disks per compound) were impregnated by equal volume (10 μl) from the concentrations of 500 and 1000 μg mL−1 of the dissolved compounds in dimethylformamide (DMF) and carefully placed on inoculated agar surface. After incubation for 36 h at 27 °C in the case of the bacteria and for 48 h at 24 °C in the case of the fungi, the obtained results were recorded for each tested compound as the average diameter of inhibition zones of the bacteria and fungus around the disks in mm at the concentrations of 500 and 1000 μg mL−1.33
3. Results and discssion
3.1. IR spectra of the synthesized compounds
The IR spectrum of ACC showed a specific absorption band at 1671 cm−1 attributed to the aldehyde function, which disappeared in the IR spectra of the synthesized hydrazones.34,35 The present compounds exhibited specific IR absorption bands at (3305, 3175), (3472, 3279; 3146), and (3343, 3219) cm−1 attributed to ν(NH2 and NH) for ACC, ACMHCA, and ACMNPHTCA, respectively (ESI Fig. 1–3†). Moreover, the current hydrazones showed an intense band at 1613 and 1605 cm−1 for ACMHCA and ACMNPHTCA, which were assigned to the stretching vibrational frequency of the azomethine and –CN–, group. The higher vibrational stretching frequency of –CN– for the ACMHCA molecule could be clarified by the presence of carbonyl at 1721 cm−1, which has more attraction for the lone pair on the nitrogen atom oriented in the antibonding molecular orbital in comparison with the thione group at 1223 cm−1 for ACMNPHTCA, such as reported for most hydrazones.14,36,37 The appearance of these absorption bands (νCO amide and νCS thioamide) indicated that the keto and thione forms were more favorable in the solid state for ACMHCA and ACMNPHTCA, respectively.14,15,35
Furthermore, the dynamic equilibrium between the various tautomers of the current compounds (Schemes 5–7) was emphasized by the positive slope of the relationship of their νCOγ–pyrone stretching vibrations that appeared at 1636, 1659, and 1640 cm−1 versus their corresponding amino group in position 2 yielding: νNH2/cm−1 = −8326.9 + 7.113 νCOγ–pyrone/cm−1, r = 0.999, n = 3 (ESI Fig. 4†).
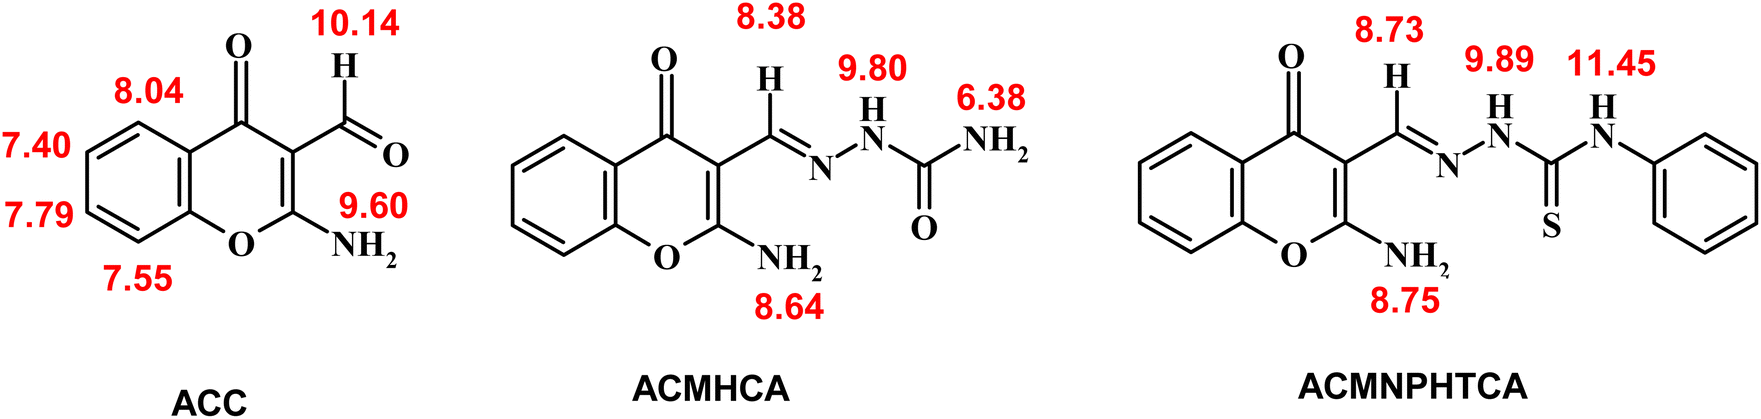 | ||
| Scheme 5 Some 1H-NMR chemical shifts (ppm) of ACC and its hydrazones. | ||
3.2. 1H-NMR spectra of the prepared compounds
The 1H-NMR chemical shifts (δ) of ACC and its hydrazones, ACMHCA and ACMNPHTCA, are shown in Scheme 5 (ESI Fig. 5–7†).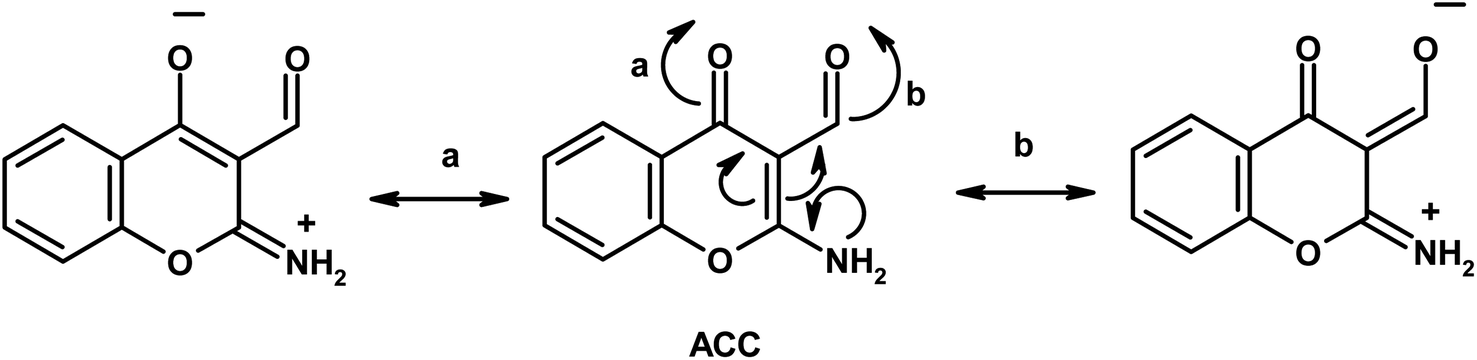 | ||
| Scheme 6 Tautomeric structures of ACC. | ||
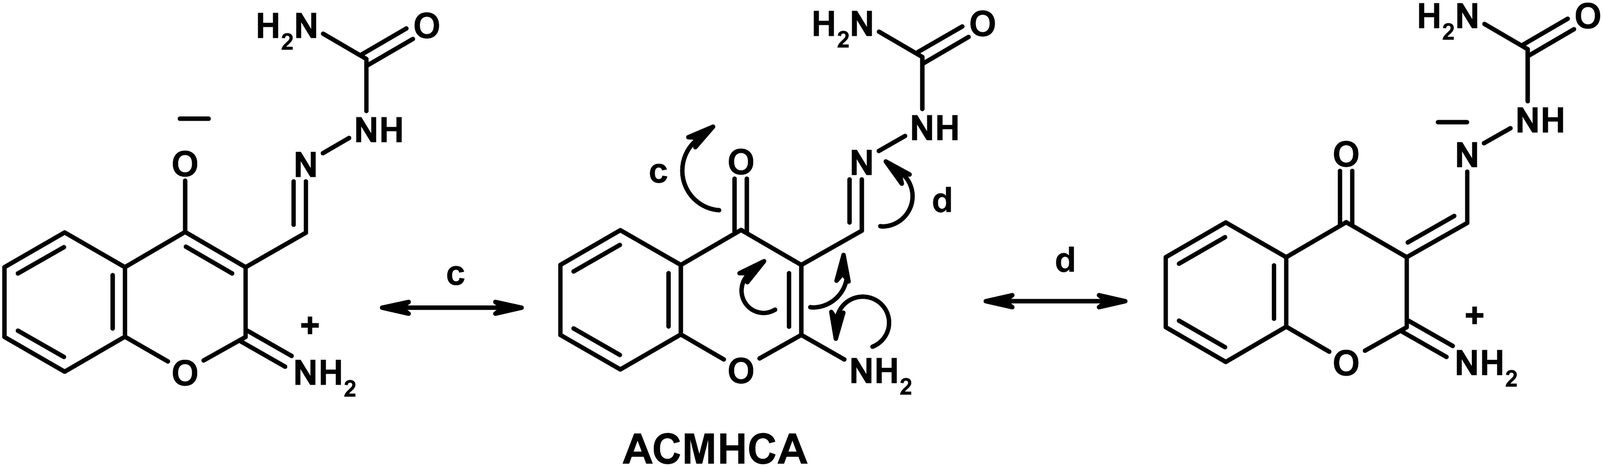 | ||
| Scheme 7 Tautomeric structures of ACMHCA. | ||
The signals observed at δ 9.60, 8.64, and 8.75 ppm for ACC, ACMHCA, and ACMNPHTCA, respectively, were due to the NH2 protons at position 2 of the chromone moiety, while these signals disappeared in the presence of D2O. Subsequently, the NH2 protons of ACMHCA were in a more electron dense environment related to ACC and ACMNPHTCA (ACMHCA > ACMNPHTCA ≫ ACC). This conclusion was supported by the negative slope of the linear relationship of the highest occupied molecular orbital energy (EHOMO) that measures the electron-donating extent of the molecule (vide infra) versus the chemical shift of δNH2 nmr of the current compounds; whereby EHOMO/eV = 4.948–1.1995 δNH2 nmr/ppm, r = 0.99, n = 3. Further evidence could be provided from the chemical shift values of the H-5 signal in the chromone rings that appeared as a characteristic doublet at δ 8.04, 7.98, and 8.00 ppm for ACC, ACMHCA, and ACMNPHTCA, respectively.
Chemical shifts of the azomethine protons of ACMHCA and ACMNPHTCA were observed at δ 8.38 and 8.73 ppm. This difference agreed with the IR spectral data and could be attributed to the higher electronegativity of the carbonyl of ACMHCA compared to that of the thione of ACMNPHTCA. This interpretation was further evidenced by shifts of the amidic protons (NH2 and NH) at δ 6.38, 9.80 for ACMHCA and δ 9.89, 11.45 for ACMNPHTCA. These signals also disappeared in the presence of D2O.
3.3. Electronic spectra of ACC and its hydrazones (ACMHCA and ACMNPHTCA)
2-Aminochromone-3-carboxaldehyde (ACC) and its synthesized hydrazones may exist in various tautomeric forms (Schemes 6–8).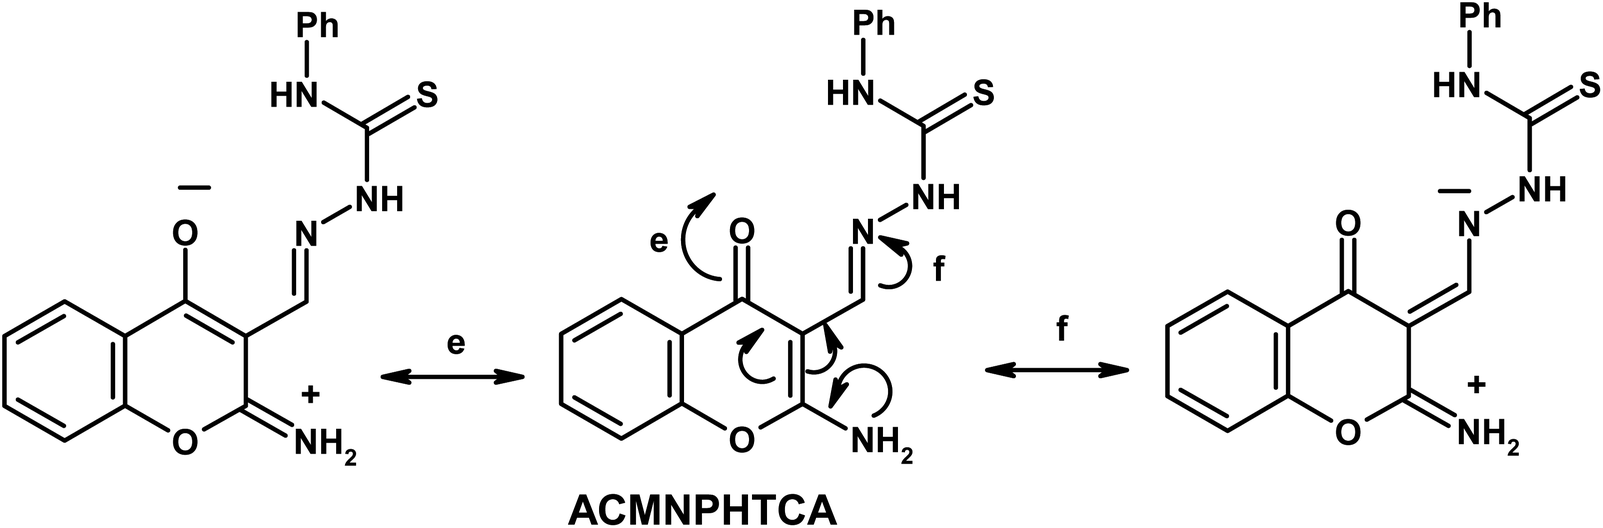 | ||
| Scheme 8 Tautomeric structures of ACMNPHTCA. | ||
Since the tautomeric equilibria strongly depend on the polarity of solvent media, so the emission spectra of 1 × 10⁻⁵ mol dm−3 of the present compounds were recorded in 11 selected solvents with various polarities.
The electronic spectral data, recorded in DMF solutions, showed electron transition bands at 268, 288, 302 nm for ACC, while its organic hydrazones showed electronic bands at 259, 286, 316 nm for ACMHCA and 261, 289, 355 nm for ACMNPHTCA.
Fig. 1 depicts the electronic and emission spectra of the synthesized compounds in DMF (1 × 10⁻⁴ M). The electronic spectra exhibited three main absorption bands, with the first band observed in the range 289–268 nm, which could be attributed to π → π* transition over the whole conjugated system (K-band).16 The second band was observed in the range 355–288 nm and might arise from enhanced n → π* transitions (R-band), resulting from nitrogen, oxygen, and/or sulfur atoms.16 However, the third band revealed the extent of enhancement of the n → π* transition (302, 316, 355 nm) for ACC, ACMHCA, and ACMNPHTCA, respectively, which depended on the ability of the lone pairs to transfer to the π* energy level. This conclusion was further confirmed by the same order of Egap (energy gap) values as those obtained from the theoretical data (Egap/eV: 4.836, 4.295, 3967), thus, vide infra.
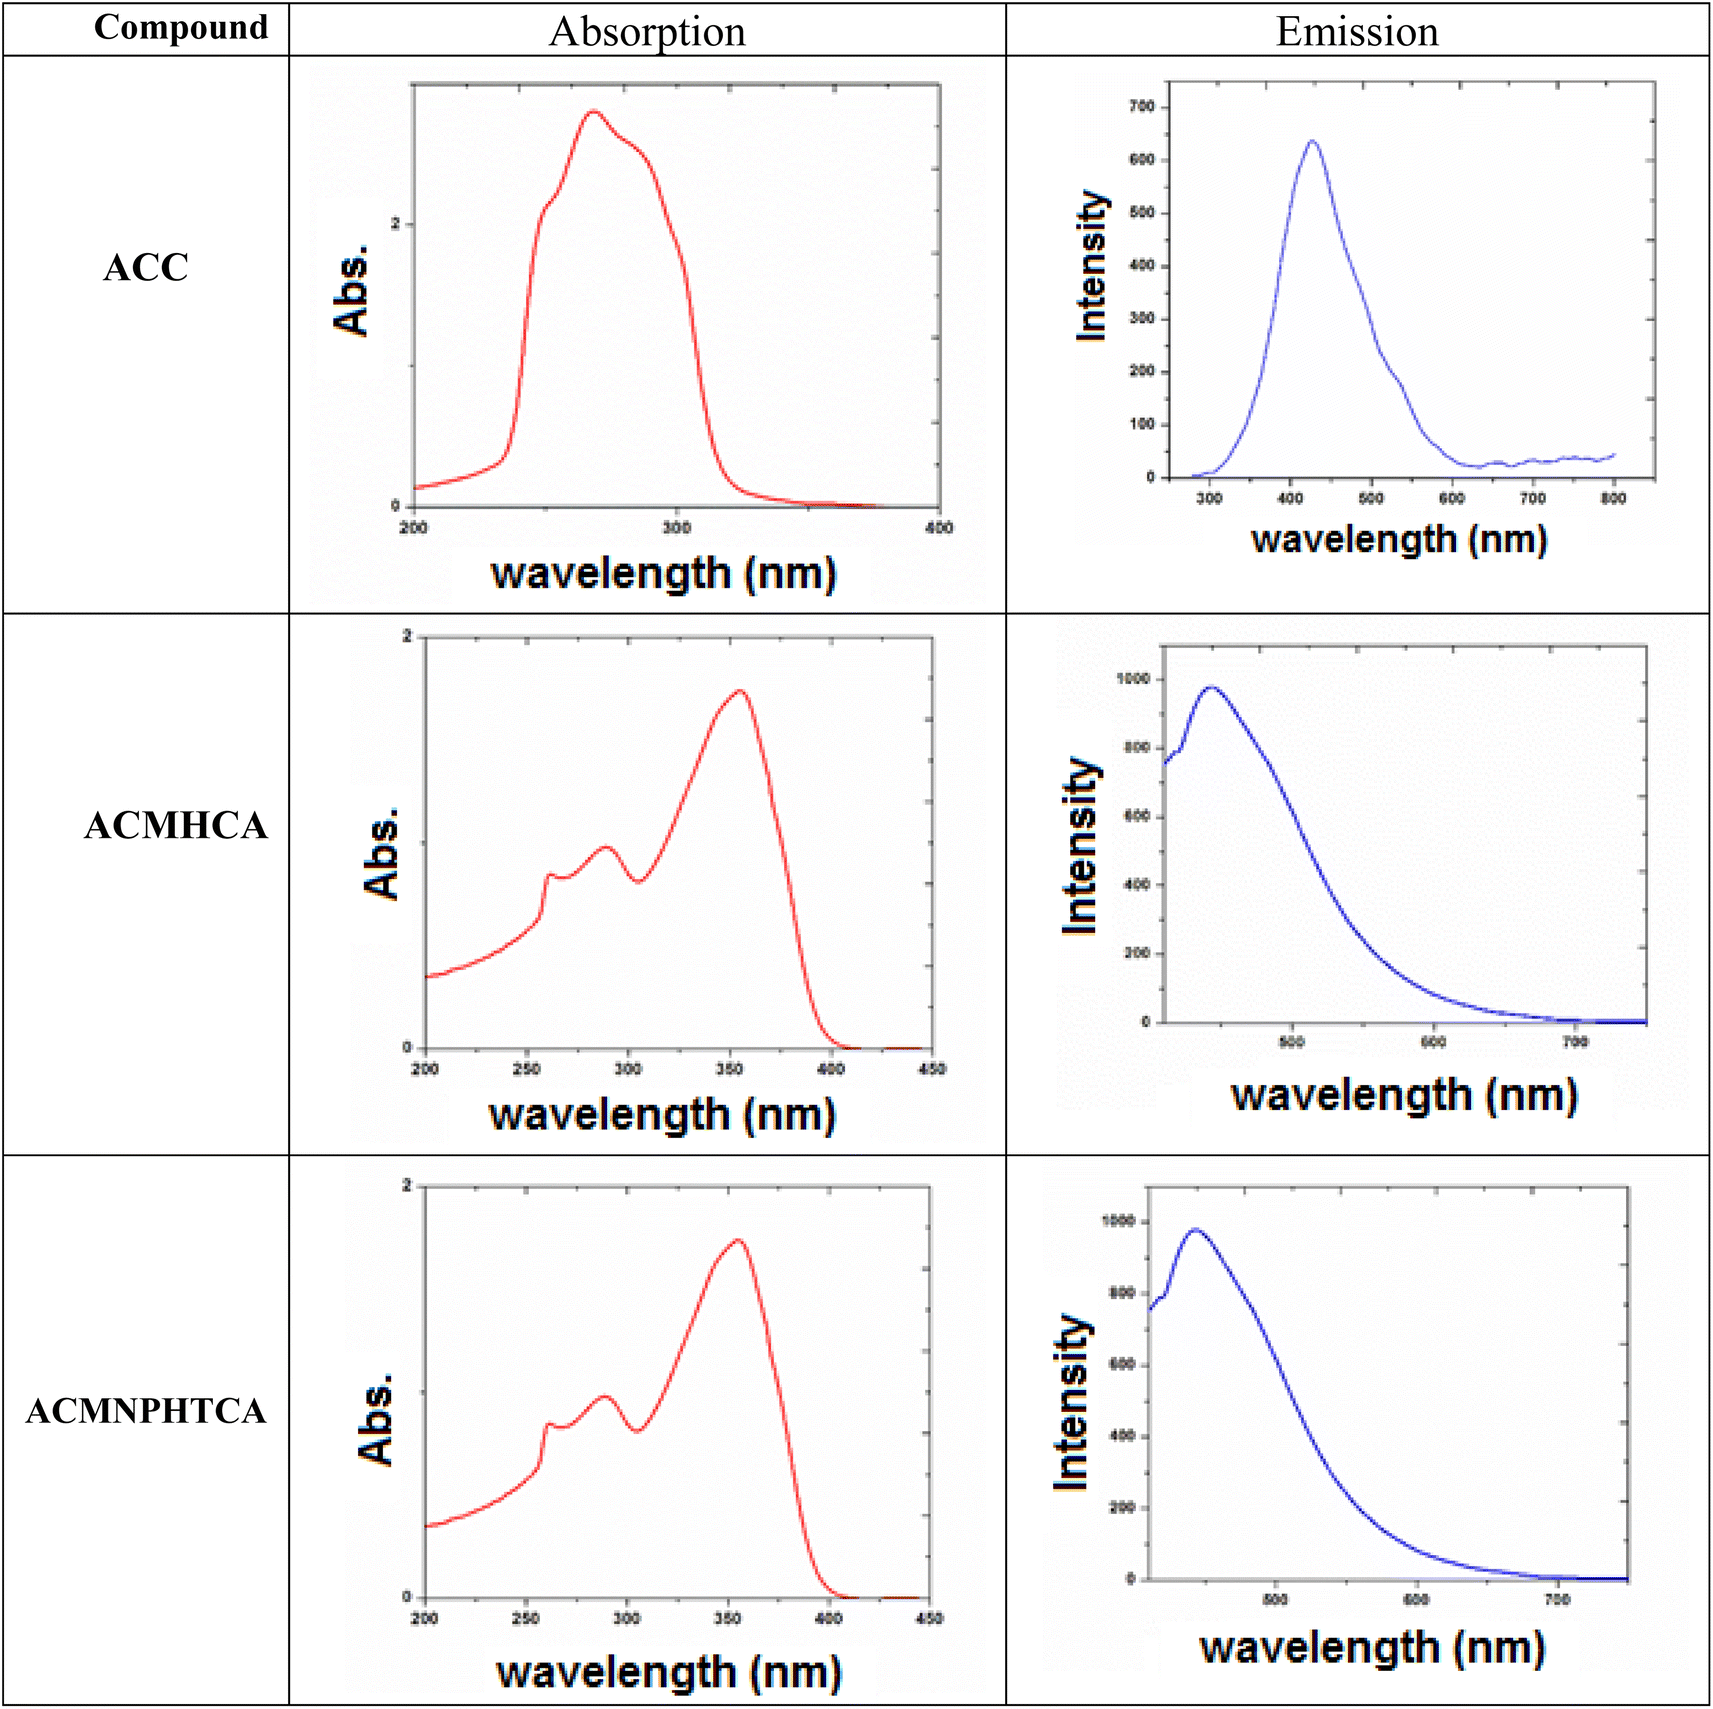 | ||
| Fig. 1 Electronic absorption and emission spectra of ACC, ACMHCA, and ACMNPHTCA. | ||
3.4. Emission spectra
The nature and the energy of the electronically excited state of an organic molecule determine its photophysical properties. When emission spectra are measured in various solvents with different polarities, it is found that not only the position of the emission band but also its intensity and shape can vary, depending on the nature of the solvent.Fluorescence offers additional means for characterizing molecular motions and interactions within an investigated compound, thus offering an estimation of its polarity. The fluorescence spectra of 10−5 M solutions of ACC, ACMHCA, and ACMNPHTCA were recorded in 11 solvents with different polarities at room temperature. Fig. 2(a) and (b) depict the fluorescence spectra for ACC, ACMHCA, and ACMNPHTCA in DMF solution, and their emission peak values in different solvents are listed in Table 1.
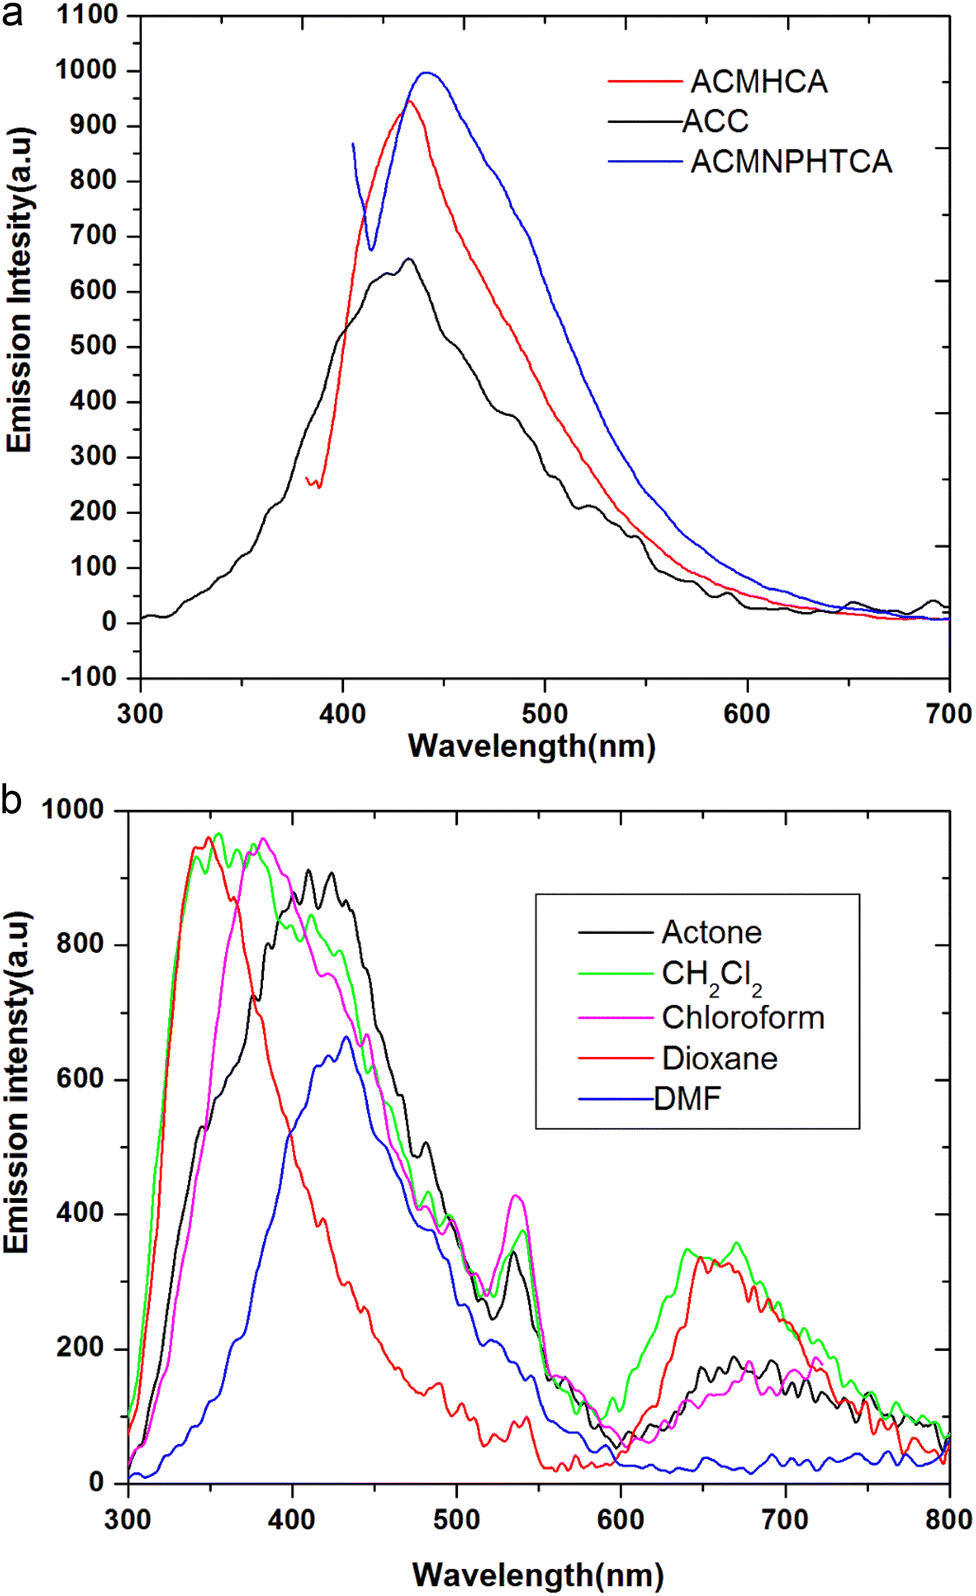 | ||
| Fig. 2 (a). Fluorescence spectra for ACC, ACMHCA, and ACMNPHTCA in DMF. (b) Fluorescence spectra for ACC in different solvents. | ||
| No. | Solvent | ACC, λex = 268 | 2-APy | ϕ ACC | ACMHCA, λex = 370 nm | 2-APy | ϕ ACMHCA | ACMNPHTCA, λex = 395 nm | 2-APy | ϕACMNPHTCA | |||
|---|---|---|---|---|---|---|---|---|---|---|---|---|---|
| λem/nm | ε × 106 | Fst × 106 | λem/nm | ε × 106 | Fst × 106 | λem/nm | ε × 106 | Fst × 106 | |||||
| a Two standards used, namely 2-APy and QBS, to cover the range of emission wavelengths. | |||||||||||||
| 1 | 1,4-Diox | 350.53 | 3.505 | 8.59 | 0.090 | 426.80 | 4.272 | 1.95 | 0.548 (0.128) | 436.70 | 4.411 | 1.32 | 0.153 (0.205) |
| 2 | Benzene | 362.94 | 3.629 | 9.89 | 0.079 | 419.17 | 4.195 | 2.55 | 0.411 (0.199) | 430.40 | 4.347 | 1.68 | 0.119 (0.223) |
| 3 | CHCl3 | 381.43 | 3.814 | 8.15 | 0.109 (0.784)a | 420.12 | 4.205 | 2.49 | 0.419 (0.158) | 436.10 | 4.405 | 1.31 | 0.154 (0.209) |
| 4 | Etac | 380.38 | 3.803 | 8.34 | 0.098 (0.929) | 426.47 | 4.269 | 2.00 | 0.529 (0.130) | 479.60 | 4.845 | 0.24 | 0.859 (0.243) |
| 5 | THF | 432.13 | 4.321 | 1.55 | 0.597 (0.102) | 418.17 | 4.185 | 2.85 | 0.364 (0.181) | 475.60 | 4.804 | 0.28 | 0.786 (0.243) |
| 6 | DCM | 355.82 | 3.558 | 9.53 | 0.080 | 422.82 | 4.232 | 2.29 | 0.458 (0.174) | 445.50 | 4.500 | 0.91 | 0.227 (0.191) |
| 7 | 2-PrOH | 329.37 | 3.294 | 2.39 | 0.295 | 424.48 | 4.249 | 2.00 | 0.527 (0.137) | 446.30 | 4.509 | 0.89 | 0.232 (0.192 |
| 8 | Me2CO | 408.52 | 4.085 | 3.80 | 0.230 (0.275) | 425.14 | 4.255 | 2.04 | 0.517 (0.134) | 495.20 | 5.002 | 0.12 | (0.328) |
| 9 | EtOH | 427.58 | 4.276 | 1.85 | 0.495 (0.106) | 426.47 | 4.269 | 2.00 | 0.529 (0.13) | 495.30 | 5.003 | 0.12 | (0.327) |
| 10 | MeOH | 426.33 | 4.263 | 2.00 | 0.457 (0.114) | 426.47 | 4.269 | 2.00 | 0.529 (0.13) | 468.70 | 4.734 | 0.33 | 0.657 (0.216) |
| 11 | DMF | 432.13 | 4.321 | 1.55 | 0.597 (0.100) | 436.42 | 4.368 | 1.30 | 0.833 (0.11) | 442.63 | 4.471 | 0.99 | 0.207 (0.196) |
Also, the Stokes shifts calculated for the present compounds in diverse polar solvents are listed in Table 2.13,22,23 The magnitude of the Stokes shifts of the current organic compounds showed divergent values in different solvents exposing the ranges 7219.8, 1000.0, and 3045.232 cm−1 for ACC, ACMHCA, and ACMNPHTCA, respectively. The observed Stokes shifts could be due to changes in the polarizability between the excimer and the dissociative ground state. The magnitudes of the shifts in ACC excimer were larger than for its hydrazones, indicating that the ACC excimer was more polarizable.
| No. | Solvent | ACC, ![[small upsilon, Greek, macron]](https://www.rsc.org/images/entities/i_char_e0d5.gif) a = 37 a = 37![[thin space (1/6-em)]](https://www.rsc.org/images/entities/char_2009.gif) 313 cm−1 313 cm−1 |
ACMHCA, a = 26882 cm−1 |
ACMNPHTCA, a = 25317 cm−1 |
|||||||||
|---|---|---|---|---|---|---|---|---|---|---|---|---|---|
| f |
a − f |
a + f |
(a + f)/2 |
f |
a − f |
a + f |
(a + f)/2 |
f |
a − f |
a + f |
(a + f)/2 |
||
| 1 | 1,4-Diox | 28528 |
8785 | 65842 |
32921 |
23431 |
34520 |
50312 |
25156 |
22901 |
24160 |
48217 |
24109 |
| 2 | Benzene | 27552 |
9761 | 64866 |
32433 |
23856 |
30250 |
50738 |
25369 |
23234 |
20820 |
48550 |
24275 |
| 3 | CHCl3 | 26217 |
11096 |
63530 |
31765 |
23802 |
30780 |
50.684 | 25342 |
22933 |
23830 |
48249 |
24124 |
| 4 | Etac | 26289 |
11024 |
63602 |
31801 |
23448 |
34330 |
50330 |
25165 |
20848 |
44670 |
46165 |
23082 |
| 5 | THF | 23141 |
14172 |
60454 |
30227 |
23913 |
29680 |
50795 |
25397 |
21027 |
42880 |
46344 |
23172 |
| 6 | CH2Cl2 | 28104 |
9209 | 65417 |
32708 |
23650 |
32300 |
50532 |
25266 |
22449 |
28670 |
47765 |
23882 |
| 7 | 2-PrOH | 30361 |
6952 | 67674 |
33837 |
23558 |
33230 |
50439 |
25219 |
22404 |
29120 |
47720 |
23860 |
| 8 | Me2CO | 24479 |
12835 |
61792 |
30896 |
23521 |
33600 |
50403 |
25201 |
20193 |
51230 |
45509 |
22754 |
| 9 | EtOH | 23387 |
13926 |
60700 |
30350 |
23448 |
34330 |
50330 |
25165 |
20188 |
51270 |
45505 |
22752 |
| 10 | MeOH | 23456 |
13857 |
60769 |
30384 |
23448 |
34330 |
50330 |
25165 |
21337 |
39790 |
46653 |
23326 |
| 11 | DMF | 23141 |
14172 |
60454 |
30227 |
22913 |
39680 |
49795 |
24897 |
22592 |
27240 |
47080 |
23954 |
However, fluorescence is very sensitive to the polarity of the surrounding environment, showing a clear bathochromic shift in all cases here as the solvent polarity increased. Among the three molecules, ACC showed the maximum red-shift (82 nm) and ACMNPHTCA also exhibited a red-shift (65 nm). On the other hand, ACMHCA had a lower tendency for solvent interactions, resulting in a lesser red-shift of the fluorescence band (18 nm). These results confirmed that the singlet excited state energy level was more stabilized than the ground state energy level. The large fluorescence spectral shifts suggest the titled molecules were more polarized in the singlet excited state than in the ground state.18 The solvent effect will be discussed in detail in the solvatochromic section.
This interpretation was further confirmed by the negative slopes of ΔλStoke/nm versus either the theoretical calculated dipole moments of the ground states (μg D−1) or the stretching frequencies of the carbonyl and amino groups attached with the chromone moiety (νNH2/cm−1): ΔλStoke/nm = 381.28 − 50.999 μg D−1, r 0.997, n = 3, ΔλStoke/nm = 4472.5 − 2.6854 νCO/cm−1, r = 0.995, n = 3, and ΔλStoke/nm = 1331.5 − 0.3784 νNH2/cm−1, r = 0.999, n = 3.
Moreover, the absorption and fluorescence data of the investigated compounds in different solvents are given in Table 2. Upon increasing the solvent polarity, the Stokes shift values were found to vary from 8785.2 to 14172.24, 2968 to 3968, and 2082 to 5127 cm−1 for ACC, ACMHCA, and ACMNPHTCA, respectively. These great differences in Stokes shift values (5387, 1000, and 3045 cm−1) for ACC, ACMHCA, and ACMNPHTCA indicated a bathochromic shift and ICT due to π → π* transition and confirmed the molecules were more stabilized in polar solvents than in nonpolar ones. This arose from the strong interaction of the singlet excited state with polar solvents; thus, there was a large charge distribution between ground and singlet excited state of the solute molecules, i.e., ACC showed a more pronounced red-shift than its hydrazones ACMHCA and ACMNPHTCA. This finding could be deduced as due to the greater electronic delocalization of ACC than its hydrazones.
The quantum yields (ϕ) of ACC, ACMHCA, and ACMNPHTCA were determined using a single point method using 2-aminopyridine as a standard reference, such as in the reported method.38 The quantum yields determined were 0.10, 0.11, and 0.196 in higher polar DMF solution, and 0.08, 0.199, and 0.223 in the least polar benzene solution, for ACC, ACMHCA, and ACMNPHTCA, respectively, as shown in Table 1. These lower quantum yield values revealed the low lifetime of the excited molecules of the current compounds, whereby they could not be fully protected from collisions with quenchers, in addition to the formation of excimers and/or exciplex. This finding is discussed in detail below.
Furthermore, the ICT of the present compounds depended on the type of solute–solvent interactions. Increasing the polarity of the solvent quenched the fluorescence emission, as evidenced by the negative slopes of the quantum yield (ϕ) with the specific solvent parameters, such as DN, AN, and HBA (β). In contrast, the nonspecific interactions, such as π*, enhanced the fluorescence emission, as indicated from the positive slope of (ϕ) with π* (ESI Fig. 8†).
3.5. Solvent effects on the emission spectra
The solvatochromism of the current compounds, which is used to define the pronounced change in position and sometimes intensity of a UV/visible and emission bands resulting from the change in the polarity of the medium, can aid estimating the dipole moments both in the ground and excited states. This progression can be utilized to understand the mechanism of solute–solvent interactions, as well as to predict the chemical reaction pathway.The solvatochromic data of the present compounds were analyzed by the linear solvation energy relationships (LSERs) depending on various solvent parameters, such as DN, AN, ET, refractive index (n), dielectric constant (ε), and Kamlet–Taft parameters (π*, β, and α). The LSER method was carried out using the solvent parameter as the independent variable and Stokes shift as the dependent variable; first correlated individually with each one of the solvent parameters to assess them for their ability to provide a reasonable explanation.
The analysis results of the LSERs for the Stokes shifts data of the investigated compounds with various solvent parameters are summarized in ESI Table 1.†21 The results presented in ESI Table 1† can be evaluated upon the sign of the slopes, the correlation coefficient (r), the number of points that obey the straight line, and the coefficient value of the variables solvent parameter to provide the following information:
1- The linear relationship of νStoke/cm−1 versus DN (Lewis basicity) of the solvents (ESI Fig. 9†) for ACC, ACMHCA, and ACMNPHTCA reveals the acidic character of the investigated compounds at N+H2 (tautomer B) as indicated from the positive slopes. Furthermore, the trend of the coefficient values (162.5 > 27.7 < 91.3) reflected the weakest acidity of ACMHCA, i.e., the degree of acidity of ACC was ∼6 fold that of ACMHCA and 1.8-fold that of ACMNPHTCA.
2- However, the positive slope of νStoke/cm−1 versus (AN + DN), where AN refers to the Lewis acidity (ESI Fig. 10†), indicates the presence of a basic center, such as the lone pairs on nitrogen, oxygen, and sulfur, besides the carbanion (C–O−) in tautomer B, beside the acidic centers. The extent of the basicity could be deduced from their coefficients: 91 > 6.62 <45.12 in the ratio of 14:2:1 for ACC, ACMHCA, and ACMNPHTCA, respectively. This result agreed well with that concluded from their 1H-NMR data and its correlation with EHOMO/eV given above.
3- The relationship of νStoke/cm−1 versus ENT shown in ESI Fig. 11† indicates that ACMHCA had the least polarity of the investigated compounds as designated from their slope's coefficient order: 256.8 > 20.65 < 77.8 for ACC and ACMHCA, and ACMNPHTCA, respectively. The positive slope revealed that the polarity degree as inferred from their coefficients for ACC was ∼12.4 fold that of ACMHCA and 3.3-fold that of ACMNPHTCA.
4- The relationship of νStoke/cm−1 versus α (solvent hydrogen-bond donor, HBD) presented in ESI Fig. 12† illustrates that the HBD was more prominent in ACC and ACMNPHTCA than ACMHCA as indicated from the coefficient of their slopes (3391 ≫ 418.81 ≪ 3155), respectively. The positive slope revealed that the extent of hydrogen-bond-acceptor centers of ACC was about 8 times that of its hydrazone ACMHCA, indicating the consumption of most acceptor centers during the formation of the hydrazones.
5- Whereas, the relationship of νStoke/cm−1 versus β (hydrogen-bond acceptor, HBA) presented in ESI Fig. 13,† shows the effects of two opposite groups for ACC and ACMNPHTCA (- & + slopes) referring to the dual nature of these compounds, and a poor correlation in the case of ACMHCA. The negative slope indicated hypsochromic shifts occurred with increasing the solvent hydrogen bonding effects. The strength of the HBD ability could be deduced from their coefficient values of β (6241.4 > very bad < −4618.5, +4149.1) for ACC, ACMHCA, and ACMNPHTCA, respectively. Thus, the hydrogen-bond-donor property of ACC was ∼1.5-fold that of ACMNPHTCA.
6- Finally, the relationship of νStoke/cm−1 versus π* (dipolarity/polarizability) demonstrated in ESI Fig. 14† verifies the role of nonspecific solute–solvent interactions in the changes of the emission spectra of the current compounds with two opposite groups for ACC and ACMNPHTCA, but the relationship was very bad for ACMHCA. The extent of the role of the nonspecific interactions can be deduced from their coefficients of π* (+13859, −13859 > 2849.7 < −6299.9) for ACC, ACMHCA, and ACMNPHTCA, respectively. The presence of two groups with opposite signs of the slope in the cases of ACC and ACMNPHTCA refers again to the dual nature of these compounds depending on the type of solvent used.
Here, the absorption maximum was almost independent of the nature of the solvent, while the emission maxima were controlled by the solvent polarity. The absolute values of the α, β, and π* coefficients of ACC were 3391, 6241.4, and 13859; (the ratio was nearly 1:2:4), respectively. Consequently, the effect of the dispersion–polarization forces was greater than the effect of the orientation–induction interactions. Also, it was observed that the β coefficient was significantly higher than the α coefficient. Thereby, the H-bond-accepting ability was more powerful than the H-bond-donating ability. The high absolute value of the β coefficient compared to the α coefficient revealed the tendency of a bathochromic effect.39
As mentioned above, most the linear relationships of ACMHCA were bad, which might be attributed to the presence of CO, which is harder than CS in the other hydrazone. So, multilinear regression (MLR) was used instead, yielding: νStoke/cm−1 ACMHCA = 24107 cm−1 + 412 α − 1168 β − 382 π*, r = 0.912, n = 10. The negative slopes for the β (HBA) and π*, and positive for α (HBD), correlations suggest that the HBD (specific interaction) enhances the red-shift, but HBA (specific interaction) acts in the opposite direction (causes a blue-shift) in addition to the effect of the nonspecific interaction (π*). Finally, it could be concluded that ACMHCA has weak solvatochromic behavior in comparison with ACC and ACMNPHTCA.
Furthermore, the weight of each solvent parameter on the solvatochromic behavior could be deduced by considering the MLR yields: νStoke/cm−1 ACMNPHTCA = 23105 cm−1 + 736 α − 4451 β + 187 π*, r = 0.90, n = 8. The positive slopes for α and π*, but negative for β correlations suggest the nonspecific interactions could be measured using the solvent's dielectric parameters, such as π*, whereas specific interactions could be measured using α (hydrogen-bond-donor strength) and β (hydrogen-bond-acceptor strength) in addition to the DN (Lewis basicity, AN (Lewis acidity), and ET parameters.
The ratios between the contributions of the solvatochromic parameters for the current compounds given above show that most of the solvatochromism was due to the solvent dipolarity/polarizability rather than to the solvent acidity and basicity. These results could be explained by the effect of the positive charge on the nitrogen atom in the N+H2 and hydrazone tautomers (ACMHCA and ACMNPHTCA).
Consequently, the effect of the dispersion–polarization forces was greater than the effect of the orientation–induction interactions. However, the H-bond-donating ability dominated over the ability to accept H-bonding, as evidenced from the α coefficient being greater than the β coefficient, indicating a tendency for a bathochromic effect.39 Accordingly, the solvent-dependent shift of the fluorescence spectra of the present compounds could be attributed to various factors, such as:
(1) Dipole–dipole interactions between the solvent and solute.
(2) Change in the nature of the emitting state induced by the solvent.
(3) Specific solvent–solute interactions, such as H-bonding.
3.6. Estimation of the ground and excited state dipole moments
For estimation of the excited state dipole moments, the Stokes shifts were calculated for all the molecules from their absorption and emission band maxima (ESI Tables 2 and 3†) and Fig. 3 (a–d).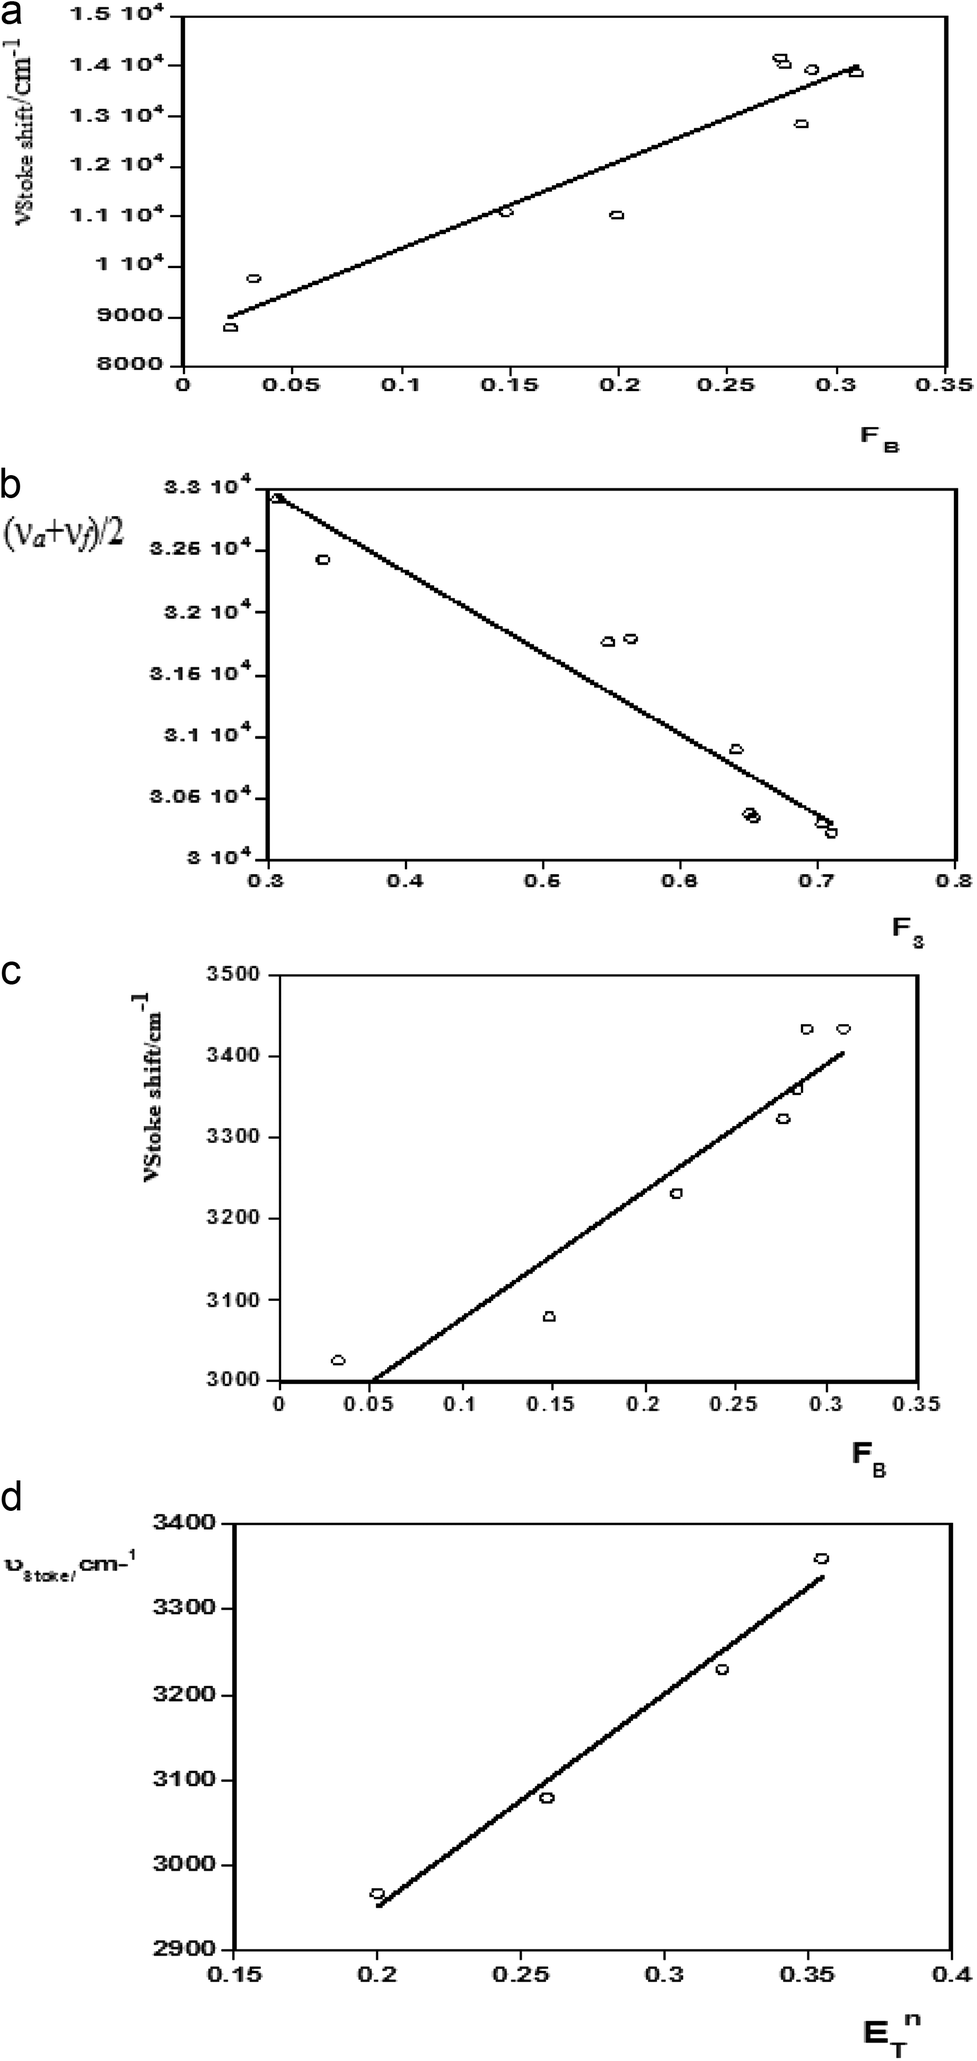 | ||
| Fig. 3 (a). Relation between νStokes shift (νa − νf) vs. F1. (b) Relation between (νa + νf)/2 vs. F3. (c) Relation between νStokes shift (νa − νf) vs. FB. (d) Relation between νStokes shift (νa − νf) vs. ENT. | ||
The shifts of the emission peaks with the solvent polarity changes were more pronounced than the shifts of the absorption peaks. This indicates that Δμ = μ* − μ, was positive, i.e., the dipole moments of all the systems studied here increased upon excitation. The calculated values of the correlation coefficients of the Stokes shifts versus the bulk solvent polarity functions F(ε,n) were analyzed using the proposed linear correlation methods13,22,23 reported by Bilot–Kawski, Lippert–Mataga, Bakhshiev, and Kawski–Chamma–Viallet, as well as by the microscopic solvent polarity parameter ENT40–42 (ESI Table 2†).
The ground state (μ) and excited state (μ*) dipole moments and Onsager cavity radii (a) of ACC, ACMHCA, and ACMNPHTCA were calculated as reported22,23 and were found to be 2.99, 3.47, and 4.42 Å, respectively (Table 3). ESI Table 3† presents the slopes obtained from the plots of the Stokes shift and averages ((a + f)/2) versus the bulk solvent polarity functions. The changes in dipole moment, μ, values derived from the obtained slopes (m) are given in ESI Table 1.† The theoretically calculated ground state dipole moments showed the highest value for the hydrazone ACMHCA, which may be due to the presence of electron-donating and electron-withdrawing groups located at the extreme ends, which result in maximum charge separation, compared to ACC, which has the minimum charge separation, as shown in Scheme 5, whereas ACMNPHTCA had the highest dipole moment in the excited state. The disagreement between the experimental and theoretical values of μ may be attributed to the stronger specific solute–solvent interaction in the solvent media, which are absent in the vapor phase. It was noticed that the μ values obtained from the Lippert–Mataga method were relatively large compared to the values obtained by the other methods, especially for ACMHCA, since it does not consider the polarizability effect of the solute. The change in dipole moment upon excitation can be considered a result of the nature of the emitting state and charge transfer.
| Compound | a | μga | aμ* | μgb | bμ* | μgc | cμ* | Δμd | μ*/μg |
|---|---|---|---|---|---|---|---|---|---|
| a Ground state and excited state dipole moments estimated by Gaussian09 using DFT software.b Calculated from Bakhshiev's (F1, F2) equation.c Calculated from Kawski–Chamma–Viallet's (F2, F3) equation.d Calculated from ENT.e Using F1, F2 results. | |||||||||
| ACC | 2.99 | 5.91 | 7.34 | 2.34 | 4.48 | 0.367 | 4.19 | 2.485 | 1.915 |
| ACMHCA | 3.465 | 0.88 | 2.66 | 1.798 | 3.392 | 3.071 | 4.484 | 1.918 | 1.89 |
| ACMNPHTCA | 4.42 | 0.87 | 2.21 | 2.337 | 5.49 one gp | 1.389 | 6.359 | 2.544 | 2.35 |
| — | — | — | 1.69 | 5.904 gp1 | — | — | 3.034 | 3.49 | |
| — | — | — | 2.58 | 5.020 gp2 | — | — | 2.540 | 1.946 | |
It could be seem that the experimental dipole moment changes (μ) (Table 3) were smaller than the theoretical estimates for all cases. The ratios of the singlet excited state dipole moment and ground state dipole moment (μ*/μ) experimentally and calculated were found to be 1.915, 1.89, and 2.35 (Table 3).
Linear graphs of the Stokes shift (νa − νf) versus F1 (FL-M), F2 (FB), and ENT, as well as average absorption and fluorescence (νa + νf)/2 versus F3, were plotted for ACC, ACMHCA, and ACMNPHTCA. The solvatochromic plots for ACC are shown in Fig. 3(a–d).
The ground (μ) and singlet excited state dipole moments (μ*) were found to be 2.34 D, 4.48 D (for ACC), 1.798 D, 4.48 D (for ACMHCA), and 2.17 D, 5.42 D (for ACMNPHTCA), respectively, and are tabulated in Table 3. As seen in this table, significant differences were found for the singlet excited state dipole moment values of the studied compounds, depending on the type of solvatochromic relationship. These differences in the estimated dipole moment values were very probably due to a number of assumptions and approximations that were made concerning the validity of their use; for example, (a) the dipole moments in the ground and excited states were supposed to be approximately collinear43 and (b) the solute molecules were considered to be spherical and consequently, the dipole moment was supposed to remain constant in the Onsager cavity21 as pointed out in the literature.44,45
The difference in dipole moment between the ground and singlet excited states suggests that the current molecules had considerable charge distribution in the singlet excited state, which plays an important role in the ICT process. The singlet excited state dipole moment values were found to be higher than that of the ground state, thereby confirming that the molecules were more polarized in the singlet excited state than in the ground state. This also suggests that the molecules have strong solute–solvent interactions, causing a large charge distribution in the singlet excited state.
As can be noted in Table 3, the excited state dipole moments (4.48, 3.39, and 5.49 D) were found to be higher than the ground state dipole moments (2.34, 1798, and 2.337 D). The differences ranged from about 2.14–3.15 D, indicating that the studied molecules were significantly more polar in their excited state than in their ground state. Therefore, the solvent–solute interactions should be stronger in the excited state than in the ground state, demonstrating an important redistribution of charge densities between both electronic states.
The ground and excited state dipole moments of the current compounds were also estimated assuming that they were parallel such as previously reported.46–50 The estimated values are depicted in Table 3. The difference in values of μg and μe were compared to the respective values obtained from other methods (ESI Table 3†) and suggest that μg and μe were not parallel. This prompted us to estimate the angle between μg and μe as reported previously23 and the values were found to be 65.07°, 66.51°, and 76.71°, showing that μg and μe were not parallel in all the investigated compounds.
Therefore, these angles suggest that there was charge movement across the molecules. The direction of the dipole moment vector in a molecule depends on the centers of the positive and negative charges. Although, non-parallelism between the ground and excited state dipole moments hinders charge migration across the molecule in the excited state more than in the ground state, the angles between them were in the range 65.07°–76.71°, which is an additional reason for the decrease in the quantum yields.
From Table 3, it could be observed that the dipole moment of the present organic compounds was higher in the first-excited state compared to in the ground state. The dipole moment increased almost two times upon excitation. This indicates the existence of a more relaxed excited state, due to ICT being favored by the cooperative effects of the 2-aminochromone moieties as donors and the carbonyl/thione groups as acceptors, and suggesting that the present compounds can serve as good nominee components of nonlinear optical materials.51
The discrepancies between the experimental and theoretically obtained data using DFT results, which were 5.914, 7.13, and 6.14 D for ACC, ACMHCA, and ACMNPHTCA, respectively, could be attributed to the fact that the theoretical calculations involved the gaseous phase of an isolated molecule while the experimental results were related to solutions.
3.7. Computational method
Estimations of the molecular geometrical optimization and structural parameters of ACC, ACMHCA, and ACMNPHTCA (ESI Fig 15–17†) were performed using the Gaussian 09 software according to density functional theory (DFT) at the B3LYP/6-31G++ (d, p) level of theory as established in the program.253.8. Frontier molecular orbital analysis (FMO)
FMO, such as analysis of the highest occupied molecular orbital (HOMO) and lowest unoccupied molecular orbital (LUMO), plays a key role in understanding the ability of organic compounds to absorb light and their optical properties.52 Fig. 4 depicts contour plots of the HOMO and LUMO orbitals in red and green regions. The HOMO contour of ACC suggests the charge density was localized on the benzene ring, with less on the γ-pyrone ring and aldehydic group. However, the LUMO was concentrated on the benzene, γ-pyrone rings, and aldehydic group, but none on the amino group of the chromone moiety. Thus, the delocalization of electrons sees them migrate from the chromone to carbonyl, amino, and phenyl groups. This could be confirmed by a Mulliken charge density plot of the chromone moiety vide infra. Whereas, the HOMO of ACMHCA showed a localization of the charge density all over the molecule, except in the NHph region and on the amino group of the chromone moiety, the LUMO charge density was localized on the benzene and γ-pyrone rings and none on the side chain and amino group of the chromone. Finally, in the HOMO of ACMNPHTCA, its charge density was concentrated on the side chain, except in NHph, whereas the LUMO charge density was localized all over the molecule, except in the NHph region and on the amino group of the chromone.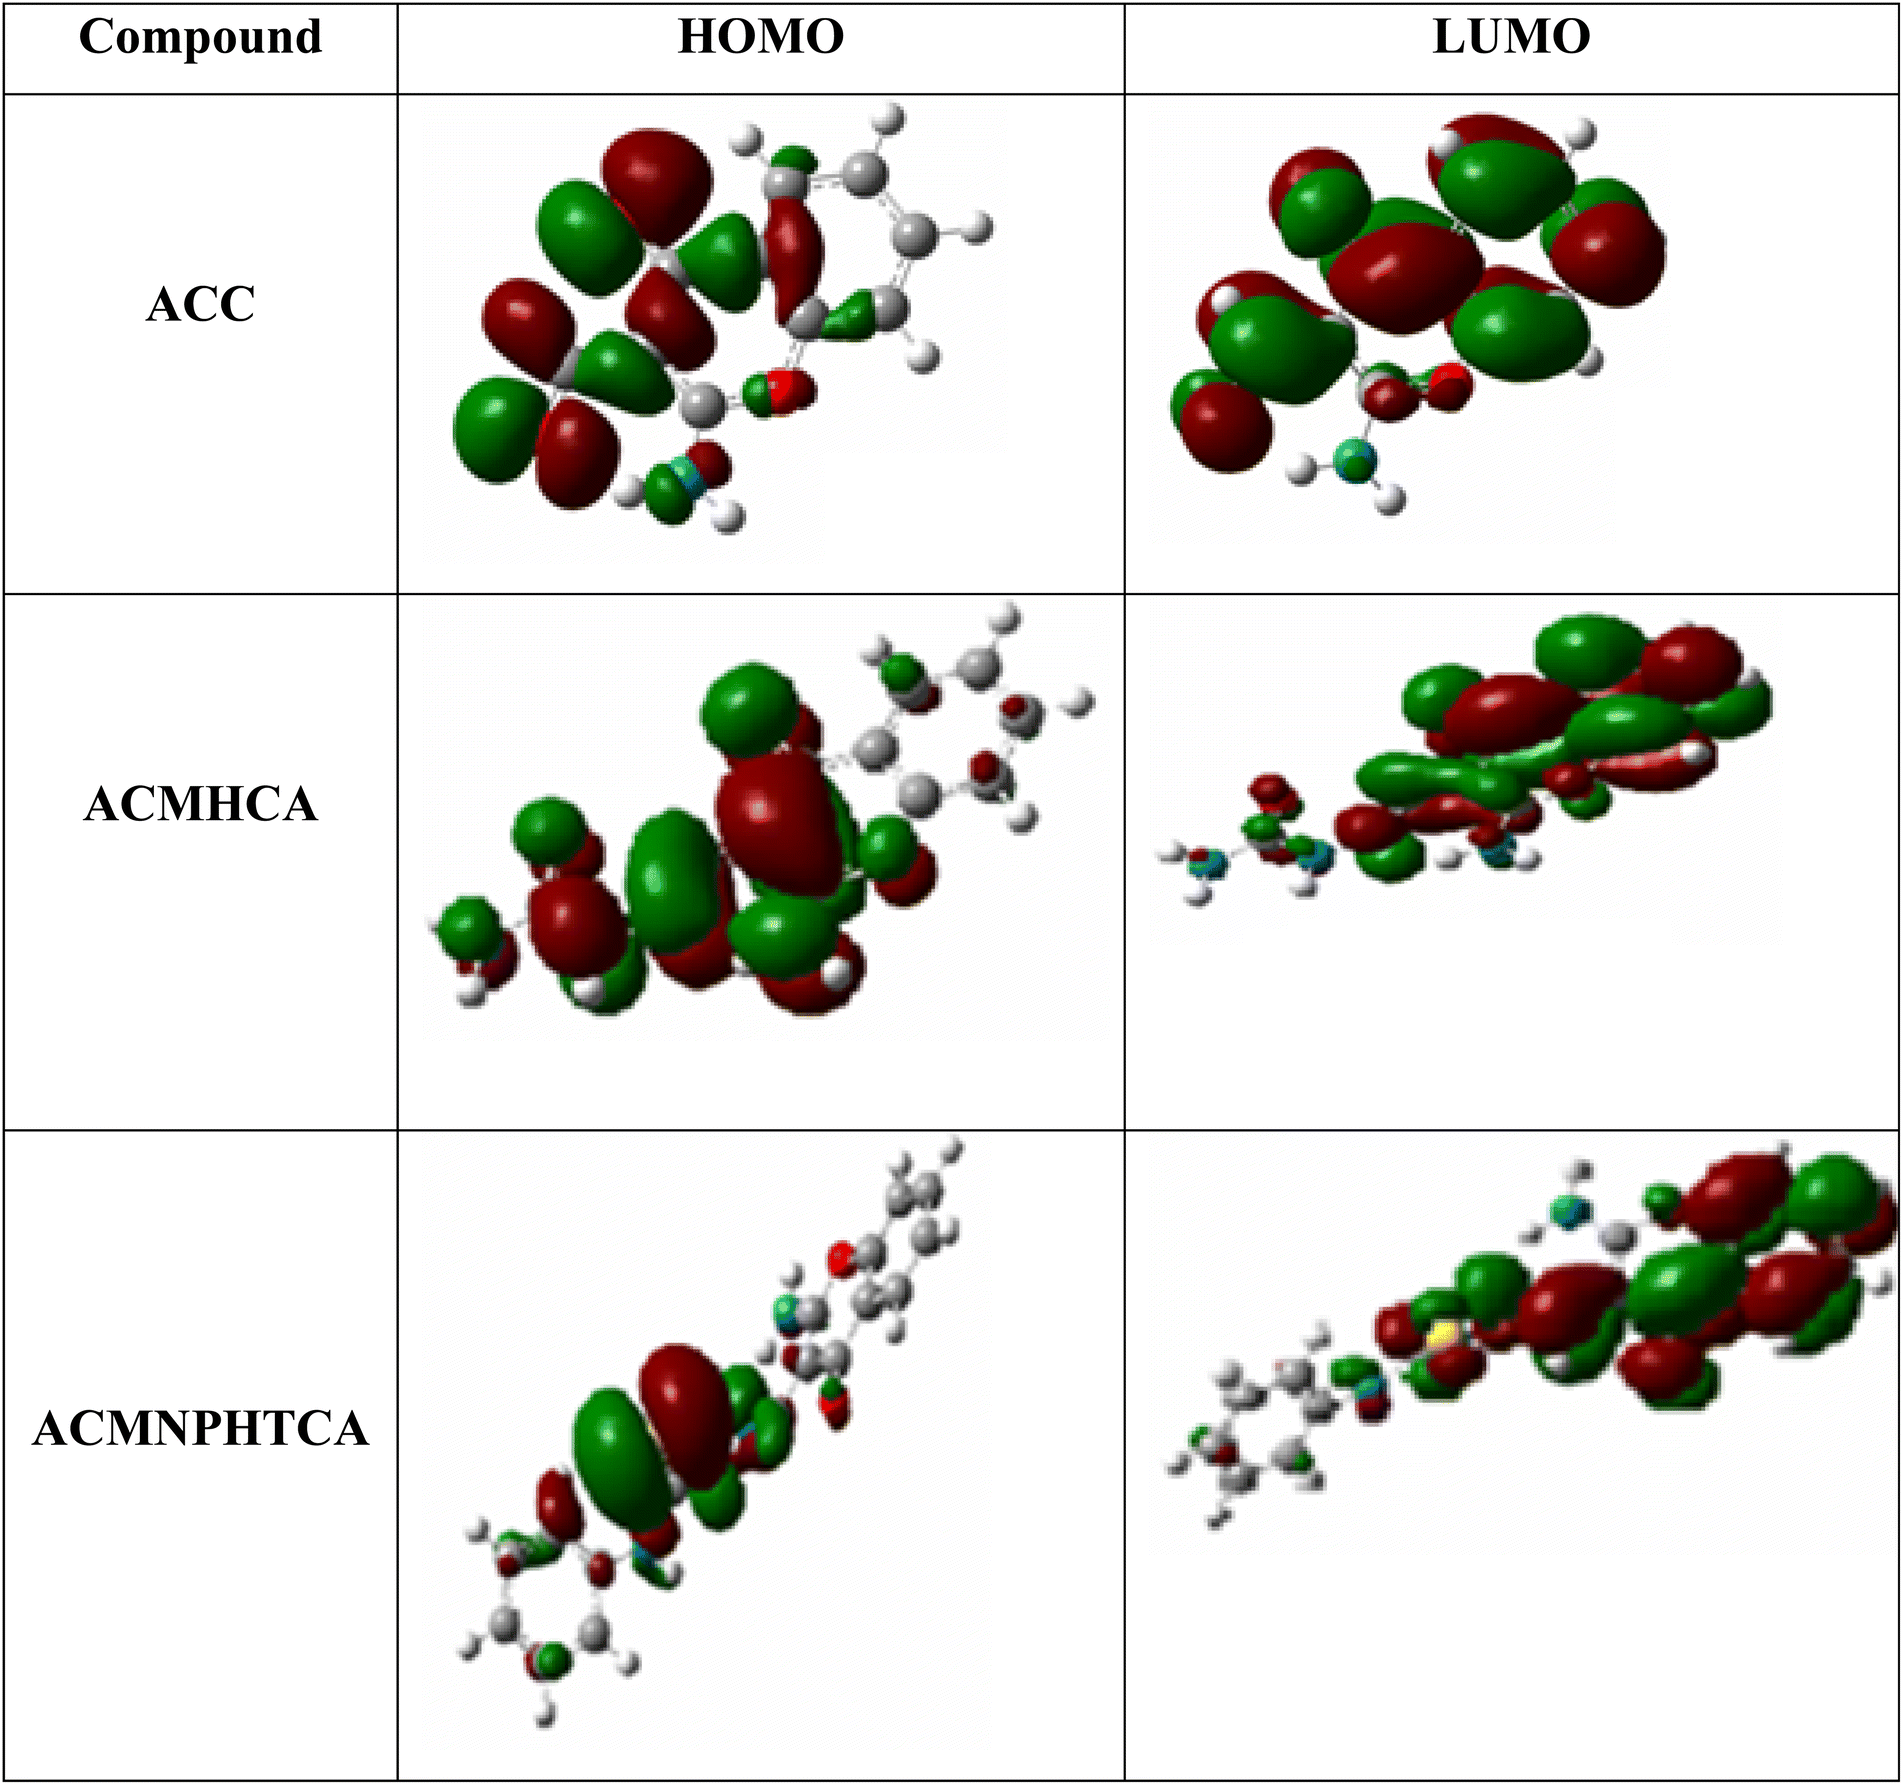 | ||
| Fig. 4 Contour plots of the HOMO and LUMO of ACC, ACMHCA, and ACMNPHTCA obtained at the B3LYP/6-311G(dp) level of theory. | ||
The energy gap values between the HOMO and LUMO energy levels for the reported molecules (ESI Table 4†) can help describe the chemical reactivity, thermal and kinetic stability, optical polarizability, as well ICT transition in the molecules, as concluded in the following approaches. The HOMO–LUMO energy gap for ACC had the highest value, 4.836 eV, whereas ACMNPHTCA had the lowest value, 3.976 eV, as indicated in ESI Table 4.† A low value for the energy gap suggests that a molecule is more reactive, soft, and has easier π−π* electronic transition. Moreover, the Egap values followed the order: ACC > ACMHCA > ACMNPHTCA; subsequently, ACC was the most stable and ACMNPHTCA the most reactive. The EHOMO values followed the order: ACC < ACMHCA ∼ ACMNPHTCA, while the ELUMO values followed the order: ACC < ACMNPHTCA < ACMHCA.
The bond lengths of CO15, CO27, CN18, CN19, and N18–N19 were computed and found to be 1.25984, 1.25033, 1.30903, 1.39021, and 1.39306 Å, respectively. Thus, the higher electronegativity (more charge density) of N19 related to N18 was antithetical and this was reflected by an elongation in the CN18 (1.30903 Å) and CN19 (1.39021 Å) bond lengths (ESI Table 4†).
3.9. Global chemical reactivity descriptors
Global chemical reactivity descriptors (GCRDs) are important parameters that give insights into the chemical reactivity and stability of molecules. GCRD parameters such as the total energy, chemical hardness (η), electrophilicity (ω), electronic chemical potential (μ), and dipole moment (u) were calculated, using methods as reported elsewhere,13,22,23 and the results are summarized in ESI Table 4.†The data in ESI Table 4† demonstrate that ACC was the hardest and most stable (less reactive) as it had the highest η value, as opposed to ACMNPHTCA, which was the softest and most reactive.
According to the data reported in ESI Table 4,† the electrophilicity index (ω) values followed the order: ACC > ACMNPHTCA> ACMHCA; which was the same order as the increasing electrophilic character, which controlled the chemical reactivity of the system.
Since, the electronic chemical potential (μ) is defined as the tendency of electrons to escape from the equilibrium state, so ACC was the most reactive, while ACMHCA was the least reactive as it had the lowest μ value. This outcome can be supported by the positive slope of the linear relationship of chemical potential versus the 1H NMR data, μ = −3.8242 + 0.83181 δ/ppm NH2, r = 0.998, n = 3, as illustrated in ESI Fig. 18.†
3.10. Molecular electrostatic potential surface analysis
The molecular electrostatic surface map and molecular electrostatic potential (MEP) results of the present compounds are depicted in Fig. 5, which can be used to detect positive and negative electrostatic potential regions for nucleophilic and electrophilic attacks, respectively.53,54 The blue-colored regions in the MEP surface are electron deficient areas that were observed at nitrogen atoms, either attached to chromone ring or at the side chain. However, the red-colored regions are electron rich and concentrated at the carbonyl of the chromone ring, in addition to the oxygen and sulfur atoms on the side chain. | ||
| Fig. 5 Schematic representation of the MEP surfaces of ACC, ACMHCA, and ACMNPHTCA. | ||
3.11. Mulliken and natural population analysis
Mulliken population analysis (MPA)53–55 and natural population analysis (NPA)56 were performed in order to explore the electrostatic potential (electrophilic/nucleophilic nature) of the presented compounds. The two methods (MPA and NPA) displayed similar results. The total atomic charge values are given in Table 4. As expected, the most negative charges were mainly on N, O, and S atoms. The results obtained from Table 4 showed that most the electronegative charge was accumulated on O14 in all the compounds. For ACMHCA, the negative charge was localized on O27 (−0.633) and N21 (−0.312). Meanwhile, in the case of ACMNPTCA, the negative charge was mainly concentrated on N21 (−0.309) and S38 (−0.021). These results agreed well with the MEP maps discussed above. The small differences between the charges obtained from the MPA and NPA models were due to the different approaches used for estimation of the atomic charges. Finally, the current compounds can be considered to have highly nucleophilic natures.| Compound | Charges | Bond lengths | ||||||||
|---|---|---|---|---|---|---|---|---|---|---|
| O14 | O27 | S24 | N21 | N22 | CO15 |
CS24 |
CN18 |
CN19 |
N–N | |
| ACC | −0.599 | — | — | — | 1.258 | — | — | — | — | |
| ACMHCA | −0.624 | −0.633 | — | −0.312 | −0.458 | 1.259 | 1.798 | 1.309 | 1.390 | 1.393 |
| −0.457 | −0.464 | −0.545 | −0.329 | |||||||
| ACMNPHTCA | −0.503 | — | −0.021 | −0.309 | −0.398 | 1.259 | 1.717 | 1.309 | 1.386 | 1.412 |
| −0.457 | — | −0.062 | −0.338 | −0.525 | ||||||
3.12. Photovoltaic behavior
The HOMO and LUMO energy levels were investigated as very significant parameters to evaluate the photovoltaic efficiency of the present compounds as an electron donor to the conduction band of the acceptor LUMO of TiO2 (−4.0 eV) or PCM (−3.7 eV).57,58 The data in ESI Table 4† show that the LUMO levels of the studied compounds were higher than the LUMO energy level of the acceptor compounds, PCBM and TiO2, implying that the photoexcited electron transfer from the present molecules to PCM or TiO2 can be effectively used in photovoltaic devices as the active layer in a bulk heterojunction layer (BHJ) for organic solar cells. The Voc values were calculated (ESI Table 4†) by using the following expression:59| Voc = EHOMO (comp) − ELUMO (PCBM/TiO2) |
As summarized in ESI Table 4,† the VOC values were 2.567–1.326 eV and 2.876–1.626 eV according to the first formula, but the second formula gave ranges of 2.814–2.26 and 2.514–0.994, with respect to TiO2 and PCM, respectively. These values are adequate to ensure an efficient electron injection, suggesting our molecules would be good applicants for organic solar cells.
3.13. 1H NMR spectral studies
The proton (1H) NMR chemical shifts of the synthesized compounds were computed by using the gage independent atomic orbital (GIAO) method60 at the B3LYP/6–311++G(d,p) basis set; in DMSO by using TMS as an internal reference standard, see ESI Fig 19–21.†61 The calculated and experimental 1H NMR chemical shifts of the current compounds are given in Table 5.| ACC | ACMHCA | ACMNPHTCA | ||||||
|---|---|---|---|---|---|---|---|---|
| Atoms | Calculated | Experimental | Atoms | Calculated | Experimental | Atoms | Calculated | Experimental |
| 18-H | 5.537718 | 9.60 | 25-H | 3.774216 | 6.38 | 17-H | 3.480961 | 8.75 |
| 6-H | 7.571464 | 7.55 | 26-H | 4.05817 | 6.38 | 25-H | 5.778975 | 11.45 |
| 12-H | 7.653417 | 7.40 | 17-H | 5.454761 | 8.64 | 34-H | 7.367763 | 7.17 |
| 13-H | 7.931241 | 7.79 | 6-H | 7.551962 | 7.36 | 6-H | 7.447364 | 7.33 |
| 11-H | 8.410165 | 8.04 | 12-H | 7.572793 | 7.41 | 12-H | 7.631333 | 7.35 |
| 19-H | 10.21059 | 9.60 | 28-H | 7.589662 | 9.80 | 38-H | 7.753892 | 7.37 |
| 20-H | 10.5051 | 10.14 | 13-H | 7.862116 | 7.66 | 32-H | 7.824341 | 7.39 |
| 11-H | 8.424244 | 7.98 | 37-H | 7.84938 | 7.44 | |||
| 19-H | 8.604212 | 8.38 | 36-H | 7.851485 | 7.47 | |||
| 18-H | 9.574084 | 8.64 | 13-H | 7.92449 | 7.69 | |||
| 11-H | 8.18711 | 8.00 | ||||||
| 26-H | 8.449107 | 9.89 | ||||||
| 19-H | 8.893963 | 8.73 | ||||||
| 18-H | 9.775394 | 8.75 | ||||||
The data in Table 5 displayed a chemical shift value of the aldehyde proton of the ACC compound, which appeared as a singlet signal at δ 10.505 ppm, which was higher than the analogous experimental value of δ 10.14 ppm. Similarly, the experimental singlet signals of CHazomethine at δ 8.38 and 8.73 ppm were lower than those calculated at δ 8.604 and 8.893 ppm for ACMHCA and ACMNPHTCA compounds, respectively. In contrast, the NH protons theoretically had a lower chemical shift than that observed in the experimental spectra in Table 5. The divergence between the theoretical and experimental data might arise from the differences between a single molecule and the solution medium, respectively. The correlations between the observed and calculated chemical shift values were predicted for the target ACC compound, as δ/ppm (exp) = 0.774 + 0.877 δ/ppm (calc), R2 = 0.99. As concluded from the slope, the agreement between the theoretical and experimental 1H NMR spectral data was ≈ 88%.
4. Antimicrobial studies
The antimicrobial activity of the prepared 2-aminochromone-3-carboxaldehde (ACC) and its hydrazones were screened toward some microorganisms, including Gram-positive bacteria; Staphylococcus aureus (G + 1) and Bacillus subtilis (G + 2), and Gram-negative bacteria; Escherichia coli (G − 1) and Salmonella typhimurium (G − 2), as well as yeast, Candida albicans (F1), and fungus, Aspergillus fumigatus (F2), and the data are depicted in Table 6. The data in Table 6 reveals that ACC had the highest antimicrobial activity compared to its hydrazone derivatives. Estimations of the effect of the structural parameters data in Table 6 on the antimicrobial activity could be concluded from their correlations with the normalized biological activity data in Table 6, and are described below.| Organism | Mean of zone diameter, nearest whole mm | |||||||||||
|---|---|---|---|---|---|---|---|---|---|---|---|---|
| Gram-positive bacteria | Gram-negative bacteria | Yeasts and fungi | ||||||||||
| Staphylococcus aureus (ATCC 25923) | Bacillus subtilis (ATCC 6635) | Salmonella typhimurium (ATCC 14028) | Escherichia coli (ATCC 25922) | Candida albicans (ATCC 10231) | Aspergillus fumigatus | |||||||
| Concentration | 1 mg ml−1 | 0.5 mg ml−1 | 1 mg ml−1 | 0.5 mg ml−1 | 1 mg ml−1 | 0.5 mg ml−1 | 1 mg ml−1 | 0.5 mg ml−1 | 1 mg ml−1 | 0.5 mg ml−1 | 1 mg ml−1 | 0.5 mg ml−1 |
| Sample | ||||||||||||
| ACC | 22 I | 19 H | 31 H | 22H | 29 H | 26 H | 24 I | 20 H | 33 H | 22 H | 25 I | 20 H |
| ACMHCA | 6 L | 3 L | 5 L | 2 L | 4 L | 2 L | 4 L | — | 7 L | 3 L | 5 L | 3 L |
| ACMNPHTCA | 7 L | 3 L | 8 L | 2 L | 5 L | 2 L | 6 L | 2 L | 6 L | 3 L | 4 L | 2 L |
| Control c | 35 | 26 | 35 | 25 | 36 | 28 | 38 | 27 | 35 | 28 | 37 | 26 |
Increasing the electronegativity of the present compounds (opposite to the chemical potential, μ) enhanced their antimicrobial activity against all the screened microorganisms as deduced from ω the negative slopes of the linear relationships of μ versus the normalized biological activity data: G + 1 = −2.7152 − 0.83828 μ, r = 0.999, n = 3, F = 11637; G − 1 = −3.001 − 0.9138 μ, r = 0.99, n = 3, F = 107.88; Y1 = −3.089 − 0.953 μ, r = 0.98, n = 3, F = 57.30; F1 = 3.334 − 1.007 μ, r = 0.982, n = 3, F = 54.32.
Moreover, the role of the chemical potential on the antimicrobial activity followed the order: G + 1 < G − 1 < Y1 < F, as deduced from their slope's values. Whereas, the positive slope of the normalized G + 1 versus electrophilicity, ω, revealed an enhancement with the increasing electrophilicity: G + 1 = −1.830 + 0.710 ω, r = 0.90, n = 3, F = 8.2.
However, the contribution of two structural parameters could be obtained using the MLRA: G + 1 = −0.2620 − 0.3017 dipole + 1.165 hardness, r = 1.0; G −1 = −0.9218 − 0.2801 dipole + 1.399 hardness, r = 1.0; Y1 = −1.175 − 0.2712 dipole + 1.516 hardness r = 1.0; and F1 = −1.339 − 0.2843 dipole + 1.607 hardness, r = 1.0.
The increase in dipole moment thus deactivates the biological activity of the investigated compounds against all the screened microorganisms, and vice versa for the effect of hardness parameter as concluded from their opposite slopes of their linear relationships. The weight of each parameter was deduced from the analogous coefficient, which revealed the dipole moment has a similar effect on all the screened organisms, but the hardness effect takes this order: G + 1 < G − 1 < Y1 < F1.
5. Conclusion
From the findings of the present study, it can be concluded that the hydrazones may exist in various tautomeric forms, such as keto–enol and/or thione-thiol forms. The UV/vis electronic and fluorescence spectra of the prepared compounds were recorded in a wide range of solvent polarities to investigate the effect of the solute–solvent interactions that showed solvatochromic behavior, as well as to estimate their ground (μ) and excited (μ*) states' dipole moments. The emission maxima underwent bathochromic shift as the polarity of the solvent increased, indicating π → π* transitions. The solvatochromic data were analyzed by LSER; accordingly a solvent-dependent shift of the present compounds was noted that could be attributed to variable factors, such as dipole–dipole interactions, a change in the nature of the emitting state induced by the solvent, and finally specific solvent–solute interactions (such as hydrogen bonding). The dipole moments were determined using solvatochromic shift methods. The μ* values were found to be higher than the μ values, suggesting that the probe molecules were more polar in the excited state. The DFT and TD-DFT theoretical data showed good agreement between the simulated and experimental results. The increase in dipole moment deactivated the biological activities of the investigated compounds for all the screened microorganisms, and vice versa for the effect of the hardness parameter as concluded from their opposite slopes of their linear relationships. FMO analysis suggested the hydrazone ACMNPHTCA was the most reactive molecule and has the most exciting potential in optical devices because it has the lowest band gap. The calculated VOC suggests our molecules are good applicants for organic solar cells. This indicates that ACMNPHTCA may have a very good nonlinear optical response. The current optimistic results should attract the attention of researchers working in this field of chromone-based hydrazone derivatives.Author contributions
Omima M. I. Adly: conceptualization, formal analysis, investigation, writing – original draft, writing – review & editing, data curation, methodology. Ali Taha: conceptualization, formal analysis, investigation, writing – original draft, writing – review & editing, data curation. Magdy A. Ibrahim: conceptualization, formal analysis, investigation, writing – original draft, writing – review & editing, data curation, methodology. Shery A. Fahmy: formal analysis, investigation, methodology.Conflicts of interest
The authors declare that they have no conflict of interest.References
- A. T. Benny, S. D. Arikkatt, C. G. Vazhappilly, S. Kannadasan, R. Thomas, M. S. N. Leelabaiamma, E. K. Radhakrishnan and P. Shanmugam, Mini-Rev. Med. Chem., 2022, 22, 1030–1063 CrossRef CAS PubMed.
- V. Sharma, A. Panwar, A. Sankhyan, G. Ram and A. K. Sharma, Biointerface Res. Appl. Chem., 2022, 13, 104–111 Search PubMed.
- R. B. Semwal, D. K. Semwal, S. Combrinck and A. Viljoen, Phytochem. Rev., 2020, 19, 761–785 CrossRef CAS.
- L.-Y. Mou, M. Wei, H. Y. Wu, L. J. Hu, J. L. Li and G. P. Li, Nat. Prod. Res., 2022, 36, 237–245 CrossRef CAS PubMed.
- T. E. Ali and M. A. Ibrahim, J. Braz. Chem. Soc., 2010, 21, 1007–1016 CrossRef.
- M. Fan, W. Yang, M. He, Y. Li, Z. Peng and G. Wang, Eur. J. Med. Chem., 2022, 237, 114397 CrossRef CAS PubMed.
- Q. Wang, X. Hu, W. Shi, H. Long and H. Wang, Bioorg. Med. Chem. Lett., 2022, 69, 128799 CrossRef CAS PubMed.
- A. Ajala, A. Uzairu, G. A. Shallangwa and S. E. Abech, Brain Disord., 2022, 7, 100041 CrossRef CAS.
- M. A. Ibrahim and Y. A. Alnamer, Heterocycles, 2021, 102, 2138–2152 CrossRef CAS.
- V. M. Rahman, S. Mukhtar, W. H. Ansari and G. Lemiere, Eur. J. Med. Chem., 2005, 40, 173–184 CrossRef CAS PubMed.
- F. Samy, A. Taha and F. M. Omar, Appl. Organomet. Chem., 2021, 35, e6375 CrossRef CAS.
- A. Taha, Spectrochim. Acta, Part A, 2003, 59, 1611–1620 CrossRef PubMed.
- O. M. I. Adly, A. Taha and M. A. Ibrahim, Appl. Organomet. Chem., 2022, 36, e6558 CrossRef CAS.
- O. M. I. Adly, Spectrochim. Acta, Part A, 2011, 79, 1295–1303 CrossRef CAS PubMed.
- S. R. Saritha, L. Anitha, S. R. Layana, M. R. Sudarsanakumar, I. H. Joe, D. Manimaran and V. L. Siji, J. Mol. Struct., 2019, 1182, 329–339 CrossRef CAS.
- A. A. A. Emara, A. A. Saleh and O. M. I. Adly, Spectrochim. Acta, Part A, 2007, 68, 592–604 CrossRef PubMed.
- J. E. Brady and P. W. Carr, J. Phys. Chem., 1985, 89, 5759–5766 CrossRef CAS.
- J. T. Edward, J. Chem. Educ., 1970, 47, 261–270 CrossRef CAS.
- T. L. Cecil and S. C. Rutan, Anal. Chem., 1990, 62, 1998–2004 CrossRef CAS.
- J. R. Lakowicz, Principles of Fluorescence Spectroscopy, Kluwer Academic/Plenum, New York, 2nd edn, 1999 Search PubMed.
- J. A. Mondal, S. Verma, H. N. Ghosh and D. Kpaltt, J. Chem. Sci., 2008, 120, 45–55 CrossRef CAS.
- O. M. I. Adly, A. Taha and S. A. Fahmy, J. Mol. Struct., 2019, 1186, 362–376 CrossRef CAS.
- O. M. I. Adly, A. Taha, M. A. Ibrahim and S. A. Fahmy, Appl. Organomet. Chem., 2020, 34, e5763 CrossRef CAS.
- A. Z. El-Sonbati, M. A. Diab, A. A. El-Bindary and S. M. Morgan, Spectrochim. Acta, Part A, 2014, 127, 310–328 CrossRef CAS PubMed.
- M. J. Frisch, G. W. Trucks, H. B. Schlegel, G. E. Scuseria, M. A. Robb, J. R. Cheeseman, G. Scalmani, V. Barone, B. Mennucci and G. A. Petersson, Gaussian 09, Revision C.01, Gaussian, Inc.: Wallingford, CT, USA, 2010 Search PubMed.
- U. Petersen and H. Heitzer, Liebigs Ann. Chem., 1976, 9, 1659–1662 CrossRef.
- A. Nohara, T. Umetani and Y. Sanno, Tetrahedron, 1974, 30, 3553–3561 CrossRef CAS.
- A. D. Becke, J. Chem. Phys., 1993, 98, 5648–5652 CrossRef CAS.
- W.-Y. Wang, X.-F. Du, N.-N. Ma, S.-L. Sun and Y.-Q. Qiu, J. Mol. Model., 2013, 19, 1779–1787 CrossRef CAS PubMed.
- K. C. Gross, P. G. Seybold and C. M. Hadad, Int. J. Quantum Chem., 2002, 90, 445–458 CrossRef CAS.
- Y. S. Mary, P. J. Jojo, C. Y. Panicker, C. V. Alsenoy, S. Ataei and I. Yildiz, Spectrochim. Acta, Part A, 2014, 122, 499–511 CrossRef CAS PubMed.
- F. Billes, A. Holmgren and H. Mikosch, Vib. Spectrosc., 2010, 53, 296–306 CrossRef CAS.
- A. W. Bauer, W. W. M. Kirby, J. C. Sherris and M. Turck, Am. J. Clin. Pathol., 1966, 45, 493–496 CrossRef CAS PubMed.
- M. A. Ibrahim and K. M. El-Mahdy, Phosphorus, Sulfur Silicon Relat. Elem., 2009, 184, 2945–2954 CrossRef CAS.
- P. Vijayan, P. Anitha, M. Rajeshkumar, P. Viswanathamurthi, P. Sugumar and M. N. Ponnuswamy, Polyhedron, 2017, 124, 77–85 CrossRef CAS.
- O. M. I. Adly and A. Taha, J. Mol. Struct., 2013, 1038, 250–259 CrossRef CAS.
- A. L. El-Ansary, H. M. Abdel-Fattah and N. S. Abdel-Kader, Spectrochim. Acta, Part A, 2011, 79, 522–528 CrossRef CAS PubMed.
- R. Kumari, A. Varghese, L. George and Y. N. Sudhakar, RSC Adv., 2017, 7, 24204 RSC.
- J. R. Lakowicz, Principles of fluorescence spectroscopy, Springer, University of Maryland School of Medicine Baltimore, Maryland, USA, 3rd.ed, 2006 Search PubMed.
- A. Kawski, in Progress in photochemistry and photophysics, ed. J.F. Rabek, CRC Press, Boca Raton, USA, 1992, vol. 5, pp. 1e47 Search PubMed.
- E. Lippert, Z. Naturforsch., 1955, 10, 541–545 CrossRef.
- N. Mataga, Y. Kaifu and M. Koizumi, Bull. Chem. Soc. Jpn., 1956, 29, 465e470 Search PubMed.
- U. S. Raikar, C. G. Renuka, Y. F Nadaf, B. G. Mulimani, A. M. Karguppikar and M. K. Soudagar, Spectrochim. Acta, Part A, 2006, 65, 673–677 CrossRef CAS PubMed.
- D. R. Lide, Handbook of Chemistry and Physics, CRC Press, 76th edn, 1995 Search PubMed.
- J. J. Aaron, C. Parkanyi, A. Adenier, C. Potin, Z. Zajıckova, O. R. Martınez, J. Svoboda, P. Pihera and P. Vachal, J. Fluoresc., 2011, 21, 2133–2141 CrossRef CAS PubMed.
- J. R. Lombardi, J. Chem. Phys., 1969, 50, 3780–3783 CrossRef CAS.
- J. Czekella, Electrochem, 1960, 64, 1221–1228 Search PubMed.
- M. P. Hass and J. M. Warman, Chem. Phys., 1982, 73, 35–53 CrossRef.
- V. J. Czekella, Chimia, 1961, 15, 26–31 Search PubMed.
- S. C. Lee, N. Y. Kang, S. J. Park, S. W. Yun, Y. Chandran and Y. T. Chang, Chem. Commun., 2012, 48, 6681–6683 RSC.
- T. Fayed, M. El-Morsi and M. El-Nahass, J. Chem. Sci., 2013, 125, 883–894 CrossRef CAS.
- J. D. Ebenezar, S. Ramalingam, C. R. Raja and V. Helan, Theor. Comput. Sci., 2013, 1, 1–13 CrossRef.
- B. S. Matada, R. Pattanashettar and N. G. Yernale, Bioorg. Med. Chem., 2021, 32, 115973 CrossRef CAS PubMed; M. Montana, V. Montero, O. Khoumeri and P. Vanelle, Molecules, 2021, 26, 4742–4764 CrossRef PubMed.
- A. Volkov, C. Gatti, Y. Abramov and P. Coppens, Acta Cryst. A, 2000, 56, 252–258 CrossRef CAS PubMed; R. S. J. Mulliken, Chem. Phys., 1955, 23, 1833–1840 Search PubMed.
- C. C. Ersanlı, G. Kaya Kantar and S. Sasmaz, J. Mol. Struct., 2017, 1143, 318–327 CrossRef.
- A. E. Reed, R. B. Weinstock and F. J. Weinhold, Chem. Phys., 1985, 83, 735–746 CAS.
- J. B. Asbury, Y. Q. Wang, Y. E. Hao, H. Ghosh and T. Lian, Res. Chem. Intermed., 2001, 27, 393–406 CrossRef CAS.
- Z. Wu, B. Fan, F. Xue, C. Adachi and J. Ouyang, Sol. Energy Mater. Sol. Cellsc, 2010, 94, 2230–2237 CrossRef CAS.
- A. Taha, A. A. M. Farag, O. M. I. Adly, N. Roushdy, M. Shebl and H. M. Ahmed, J. Mol. Struct., 2017, 1139, 31–42 CrossRef CAS.
- M. J. Frisch, J. A. Pople and J. S. Binkley, J. Chem. Phys., 1984, 80, 3265–3269 CrossRef CAS.
- N. Gunay, O. Tamer, D. Avci, E. Tarcan and Y. Atalay, Rev. Mex. Fis., 2020, 66, 749–760 CrossRef.
Footnote |
| † Electronic supplementary information (ESI) available. See DOI: https://doi.org/10.1039/d3ra05081e |
| This journal is © The Royal Society of Chemistry 2023 |