 Open Access Article
Understanding the cation exchange affinity in modified-MMT catalysts for the conversion of glucose to lactic acid†
S. M. Shahrul Nizan Shikh Zahari‡ *ac,
Nur Fatin Izzati Che Sam‡a,
Kholoud M. H. Elzaneena,
Mahfuzah Samirah Iderisa,
Farah Wahida Haruna and
Hazeeq Hazwan Azmanb
aIndustrial Chemical Technology Programme, Faculty of Science and Technology, Universiti Sains Islam Malaysia, Bandar Baru Nilai, 71800 Nilai, Negeri Sembilan, Malaysia. E-mail: shahrul.zahari@usim.edu.my
bDepartment of Science Biotechnology, Faculty of Engineering and Life Sciences, Universiti Selangor, Jalan Timur Tambahan, 45600 Bestari Jaya, Selangor, Malaysia
cDepartment of Chemical Engineering, South Kensington Campus, Imperial College London, London SWZ 2AZ, UK
First published on 26th October 2023
Abstract
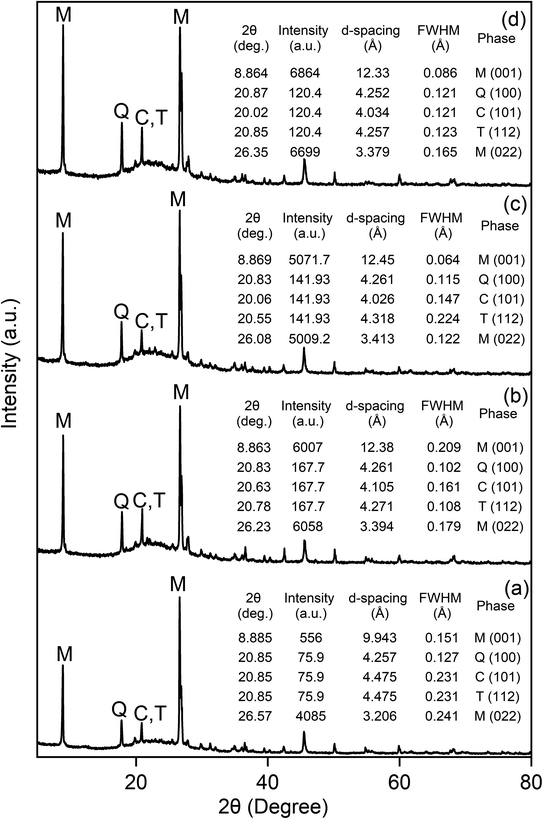
This study investigated the exchange affinity of Fe3+, Cu2+, and Zn2+ cations in sulfuric acid-purified montmorillonite (S-MMT) to enhance Lewis acid sites and subsequently improve the catalytic conversion of glucose to lactic acid. XRD analysis suggested the successful cation exchange process, leading to structural expansion of the resultant cation exchanged-MMTs (CE-MMTs). XRF and TGA indicated that Zn2+ had the highest exchange affinity, followed by Cu2+ and then Fe3+. This finding was further supported by the results of TPD-NH3 analysis and pyridine-adsorption test, which demonstrated that Zn-MMT had the highest total acid sites (TAS) and the ratio of Lewis acid-to-Brønsted acid surface site (LA/BA). These results indicated dominant presence of Lewis acid sites in Zn-MMT due to the higher amount of exchanged Zn2+ cations. Consistently, time-dependent catalytic studies conducted at 170 °C showed that a 7 h-reaction generated the highest lactic acid yield, with the catalytic performance increasing in the order of Fe-MMT < Cu-MMT < Zn-MMT. The study also observed the impact of adding alcohols as co-solvents with water at various ratios on the conversion of glucose to lactic acid catalysed by Zn-MMT. The addition of ethanol enhanced lactic acid yield, while methanol and propanol inhibited lactic acid formation. Notably, a water-to-ethanol ratio of 30![[thin space (1/6-em)]](https://www.rsc.org/images/entities/char_2009.gif) :
:![[thin space (1/6-em)]](https://www.rsc.org/images/entities/char_2009.gif) 70 v/v% emerged as the optimal solvent condition, resulting in ca. 35 wt% higher lactic acid yield compared to using water alone. Overall, this study provides valuable insights into the cation exchange affinity of different cations in MMT catalysts and their relevance to the conversion of glucose to lactic acid. Furthermore, the incorporation of alcohol co-solvent presents a promising way of enhancing the catalytic activity of CE-MMTs.
70 v/v% emerged as the optimal solvent condition, resulting in ca. 35 wt% higher lactic acid yield compared to using water alone. Overall, this study provides valuable insights into the cation exchange affinity of different cations in MMT catalysts and their relevance to the conversion of glucose to lactic acid. Furthermore, the incorporation of alcohol co-solvent presents a promising way of enhancing the catalytic activity of CE-MMTs.
1. Introduction
Global climate change has resulted in a wide range of impacts, prompting the transition from fossil-fuel-based energy to renewable alternatives. This has encouraged significant research efforts, particularly in the production of specialty chemicals from renewable sources. One of the potential chemicals that can be produced renewably is lactic acid. To date, lactic acid has been used in many industries, including pharmaceuticals, food, cosmetic and bioplastic packaging.1,2Lactic acid can be produced from cellulose, the major biopolymer constituent of biomass.3,4 Cellulose can be extracted through the pretreatment process, which removes hemicellulose and lignin fractions from cellulose.5–8 Cellulose undergoes three sequential steps to produce lactic acid: hydrolysis of cellulose to monomeric glucose catalysed by Brønsted acids, isomerization of glucose to fructose catalysed by Lewis acids, followed by retro-aldol conversion of fructose to lactic acid also facilitated by Lewis acid catalysts.9 Amongst Lewis acid catalysts that have been previously employed are AlCl3,10 Al2(SO4)3,11 and NiCl2![[thin space (1/6-em)]](https://www.rsc.org/images/entities/char_2009.gif) 12 in their aqueous form. Though the resulting yields are satisfactory, this homogenous reaction system is impractical due to the difficulty in separating lactic acid from aqueous metal cation catalyst. Consequently, solid catalysts have been extensively investigated as an alternative to homogenous catalysts. They include metal oxides,13,14 metal-doped zeolites15–17 and clay-based catalysts.18–21
12 in their aqueous form. Though the resulting yields are satisfactory, this homogenous reaction system is impractical due to the difficulty in separating lactic acid from aqueous metal cation catalyst. Consequently, solid catalysts have been extensively investigated as an alternative to homogenous catalysts. They include metal oxides,13,14 metal-doped zeolites15–17 and clay-based catalysts.18–21
Montmorillonite (MMT) is a commercially available clay that has a layered structure catalytic and high cation exchange capacity.22 The material possesses both Lewis and Brønsted acid sites, offering remarkable catalytic properties for the transformation of various organic reactions, including oxidation, esterification, and condensation.23 Interestingly, the strength and distribution of Lewis acid sites of MMT can be enhanced by the process called ‘cation-exchange’, whereby the exchangeable cations (typically Ca2+, K+ and Mg2+) in the clay are substituted with metal cations of a higher electron density.24 This development enables the use of cation-exchanged MMT for lactic acid production from glucose,23 as the catalyst providing a higher proportion of Lewis acid sites which are crucial for the sequential reactions involved in lactic acid production. In contrast, excess of Brønsted acid sites in the caly suppress glucose isomerisation to fructose and promotes dehydration of fructose to 5-hydroxymethylfurfural (5-HMF), consequently inhibiting the formation of lactic acid.25
Thus, this study specifically examined the exchange affinity of Fe3+, Cu2+ and Zn2+ cations in sulfuric acid-purified MMT (S-MMT) to improve the conversion of glucose to lactic acid. The rationale for sulfuric acid-purification was based on the findings of our previous study.26 It was observed that the purification removed mineral impurities (quartz, cristobalite and tridymite) from MMT structure and led to minor leaching of Al3+ and/or Si2+ from the structured layer of MMT. Surprisingly, the leaching increased acid sites, particularly Lewis acid, subsequently enhancing the catalytic conversion of glucose to lactic acid. In this current study, we employed chemical and physical characterisations along with catalytic reactions, providing some insights into the extent to which these cations effectively exchange with the inherent exchangeable cations in the interlayer spaces of MMT. The success of the cation exchange of MMT would result in the enhancement of its Lewis acid sites, which play a critical role in facilitating the conversion of glucose to lactic acid. Additionally, the study also presented a preliminary investigation into the potential use of alcohol as a co-solvent to counteract the inhibitory effects of Brønsted acid sites, which impede the isomerisation of glucose to fructose and the subsequent retro-aldol conversion of fructose to lactic acid.
2. Methodology
2.1 Sulfuric acid-purification of montmorillonite
The purification step was conducted following a previously reported protocol.18 Pristine MMT (20 g) placed in a cellulose thimble was continuously purified with water in a Soxhlet extractor and later dried in an oven at 110 °C overnight. Next, the oven-dried MMT was suspended in sulfuric acid (H2SO4) (0.3 M, 50 mL), followed by heating the suspension with vigorous stirring at 100 °C for 6 h. The suspension was filtered through a sintered-glass funnel. The recovered solid was further purified with water in a Soxhlet extractor and later dried in an oven at 110 °C overnight. The resultant solid was labelled as ‘S-MMT’.2.2 Preparation of metal cation-exchanged montmorillonite (CE-MMT)
The method reported by previous studies was employed with slight modifications.18,24 The following metal chloride salts were used as received: zinc(II) chloride (ZnCl2), copper(II) chloride dihydrate (CuCl2·2H2O) and iron(III) chloride hexahydrate (FeCl3·6H2O). Briefly, S-MMT (20 g) and a solution of metal chloride (0.01 M, 50 mL) were added into a round-bottomed flask. The suspension was refluxed with vigorous stirring at 70 °C for 10 h and later filtered through a sintered-glass funnel. The recovered solid, labelled as ‘CE-MMT’ (where CE signifies the types of metal cation Zn2+, Cu2+ or Fe3+), was subjected to silver nitrate (AgNO3) test and subsequently dried at 110 °C overnight. The CE-MMT sample was crushed using a mortar and a pestle. Three catalysts were obtained: Zn-MMT, Fe-MMT, and Cu-MMT.2.3 Catalytic conversion of glucose to lactic acid
Adopted from previous studies,2,18 a hydrothermal autoclave (Teflon-lined, 25 mL) was loaded with the following substances: D-glucose (0.1 g, 1.66 mmole), S-MMT or CE-MMT catalyst (0.1 g) and distilled water (15 mL). After stirring vigorously at room temperature for 15 min, the autoclave was tightly sealed and subsequently heated at 170 °C for a specific period (1, 3, 5, 7 and 9 h). After cooling the autoclave to room temperature, the mixture was filtered through a filter paper. Finally, the filtrate was collected, passed through a syringe filter, and then analysed by a high-performance liquid chromatography (HPLC) with a Phenomenex ROA column (RP80, 250 mm × 4.6 mm ID) under the following conditions: 0.1% phosphoric acid (H3PO4) as mobile phase, flow rate of 1 mL min−1, injection volume of 20 μL, column temperature of 30 °C and detector temperature of 50 °C. Standard solutions of lactic acids were prepared in distilled water with the following concentrations: 0.1, 1.0, and 1.5 mg mL−1 (the standard calibration curve is given in Fig. S1 in ESI†). Eqn (1) was used to determine lactic acid yields in wt%.26 As an alternative to HPLC analysis, the filtrate was also titrated with 0.05 M NaOH using phenolphthalein as an indicator.| Lactic acid yield (wt%) = (AHPLC × FD × VPL × FT)/(FHPLC × mGlucose) × 100% | (1) |
2.4 Silver nitrate test
S-MMT (or CE-MMT) was suspended in distilled water at room temperature with vigorous stirring for 1 h. The suspension was filtered through a sintered-glass funnel. To the resulting filtrate, several drops of AgNO3 solution were added. If white precipitates developed, the steps of purifying MMT with water and adding AgNO3 to the wash-water were repeated until the following conditions were met: (1) no further white precipitates formed, and (2) the pH of the wash-water reached neutral (pH 7). Once these conditions were achieved, the MMT was considered free of chloride ions.2.5 X-ray diffraction
The analysis was performed using a Shimadzu X-Ray Diffractometers (Lab X, XRD-6000), with Cu Kα radiation, (λ = 1.5418 Å) at 45 kV applied voltage and 40 mA of current. The scanning region was set from 2θ = 5° to 2θ = 80° with a step interval of 0.02°. The diffractometer was monitored by the Rigaku Corporation's software (Dongle key number B68000314-01-K2).2.6 Thermogravimetric analysis
S-MMT or CE-MMT was analysed on a TGA instrument model TGA/HT DSC HSS2. The sample (20 mg) was loaded into a sample holder and placed in the furnace. The analysis was performed within the temperature range of 30 °C to 1000 °C in nitrogen, under N2 flow at heating rate of 10 °C min−1.2.7 X-ray fluorescence
The chemical composition in MMT samples was determined by OMNIAN PANalytical (Model Epsilon 1) equipped with 5 W Ag anode as a source of X-rays.2.8 Nitrogen adsorption–desorption-BET
The surface area, total pore volume and average pore size were determined by a Micromeritics 2020 (Model 3Flex Version 5.02) using the gas sorption techniques at 78 K. Prior to the analysis, all the MMT samples were degassed at 300 °C in vacuum to remove all adsorbed moisture present on the clay surface.2.9 Temperature-programmed desorption of ammonia
The total acid sites (TAS) present in S-MMT and CE-MMT were analysed on a TPD-NH3 Micromeritics 2020 attached to a thermal conductivity detector (TCD). MMT sample (0.05 g) was placed in the reactor, treated under 150 °C for 45 min in compressed air (25 mL min−1). The sample was then exposed to the NH3 flow for 90 min. The analysis was carried out between 60 °C and 900 °C (15 °C min−1) under helium flow (45 mL min−1).2.10 Pyridine-adsorption test
The protocol reported previously was employed.22 S-MMT or CE-MMT (0.5 g) was weighed in a screw capped bottle and then dried at 100 °C for 1 h. After adding pyridine solution (1 mL) to the clay, the bottle was closed tightly, allowed to stand at room temperature for 1 h and heated at 120 °C for 12 h. After the heating process, the resultant sample was cooled to room temperature and later analysed by an ATR-FTIR-100 PerkinElmer with a scanning range between 400 cm−1 and 4000 cm−1. As reported in the chemical literature,27,28 the quantity of Lewis acid (LA) and Brønsted acid (BA) surface sites for each recorded FTIR spectrum was estimated by integrating the peak areas at 1445–1447 cm−1 (pyridine bound to LA) and 1542–1558 cm−1 (pyridine bound to BA) (graphs can be found in ESI, Fig. S2†).3. Results and discussion
3.1 Exchange affinity of MMT with different cations
| Elements (as oxides) | Composition (%) | |||
|---|---|---|---|---|
| S-MMT | Fe-MMT | Cu-MMT | Zn-MMT | |
| SiO2 | 85.10 ± 0.07 | 89.73 ± 0.04 | 86.93 ± 0.04 | 90.33 ± 0.04 |
| Al2O3 | 9.13 ± 0.11 | 6.08 ± 0.04 | 7.69 ± 0.02 | 5.40 ± 0.07 |
| K2O | 2.64 ± 0.02 | 1.83 ± 0.04 | 1.55 ± 0.00 | 1.09 ± 0.01 |
| CaO | 0.17 ± 0.00 | 0.16 ± 0.00 | 0.16 ± 0.00 | 0.17 ± 0.00 |
| MgO | 0.83 ± 0.25 | 0.55 ± 0.00 | 0.45 ± 0.00 | 0.54 ± 0.00 |
| Fe2O3 | 0.77 ± 0.00 | 0.65 ± 0.06 | 0.60 ± 0.00 | 0.40 ± 0.00 |
| CuO | — | — | 0.11 ± 0.00 | — |
| ZnO | — | — | — | 0.16 ± 0.13 |
| Si/Al ratio | 9.3 | 14.8 | 11.3 | 16.7 |
An increase in Si/Al ratio was observed in all CE-MMTs, suggesting that the exchange reaction caused Si or/and Al to leach out form the structure of S-MMT. For Fe-MMT, the compositions of the exchange K and Mg reduced by 30% in comparison to S-MMT. The composition of Ca, however, seemed not be impacted by the exchange process because the difference of 0.01% is rather insignificant. More importantly, the composition of Fe reduced by 10% relative to S-MMT. These results suggest that the added Fe3+ did not exchange with the exchangeable K+ and Mg2+ in S-MMT. Instead, the exchange reaction caused K+, Mg2+ and Fe3+ in S-MMT to simply leach out.
Regarding Cu-MMT, the compositions of K, Mg and Fe greatly reduced compared to those recorded in S-MMT (decrease of ca. 40% for K and Mg and 20% for Fe). Like Fe-MMT, the composition Ca seemed not be impacted by the exchanged process. Notably, Cu was detected at 0.11% which was absent in S-MMT. This appears to indicate that the added Cu2+ had successfully exchanged with the exchangeable K+ and Mg2+ in S-MMT throughout the exchange reaction.
For Zn-MMT, a similar trend to Cu-MMT was observed: the compositions of K, Mg and Fe reduced by ca. 59%, 35% and 48%, respectively (relative to S-MMT). The composition of Ca was identical to that recorded in S-MMT (0.17%). Meanwhile, Zn was recorded at 0.16%, which was initially undetected in S-MMT. The findings suggest that K+ and Mg2+ in S-MMT were successfully exchanged by the added Zn2+.
The results of Zn-MMT and Cu-MMT were compared, the composition of Zn in Zn-MMT (0.16%) was higher than Cu in Cu-MMT (0.11%); by contrast, the composition of K and Fe in Zn-MMT was reduced by ca. 30% in comparison to Cu-MMT. This infers that more added Zn2+ cations were exchanged with K+ (and/or Fe3+) in S-MMT than the added Cu2+. Overall, XRF results appear to deduce that the exchangeability of the added cation can be ranked as follows (most to least exchange): Zn2+ > Cu2+ > Fe3+.
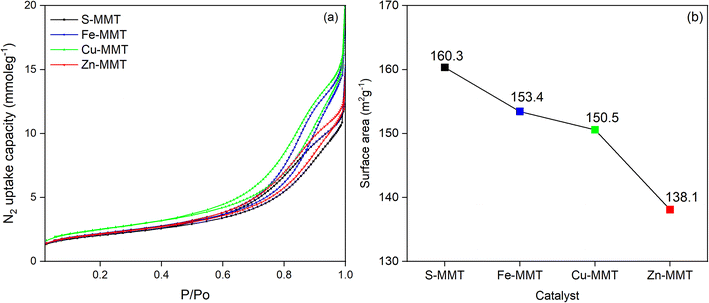
In theory, a higher BET surface area indicates more surface sites are covered by N2 monolayers in the examined sample. For a porous material, the total surface sites also count the number of pores, where the number of pores and the total surface sites typically display a direct relationship.30 Hence, the highest surface area recorded for S-MMT indirectly suggests that the catalyst had a higher number of pores.
All CE-MMTs exhibited much lower BET surface area than S-MMT. However, this does not entirely mean that the number of pores of CE-MMTs had reduced. Instead, the decreased surface area was believed to be due to the “pore-blocking effect”, a situation where the pores (interlayer spaces) are clogged and thus become inaccessible to N2 molecules.31,32 In this study, the “pore-blocking effect” was believed to arise from two occurrences. First, the presence of a higher content of intercalated cation (Fe3+, Cu2+ or Zn2+) in the interlayer spaces of MMT that exchanged with the exchangeable cations (K+ and/or Mg2+) during the reaction. Second, the exchange reaction could have occurred at the sites near the pore entry points on MMT, as proposed previously.33 Consequently, the pore-blocking effect decreased the surface area to be covered by N2 molecules, as shown in Fig. 2.
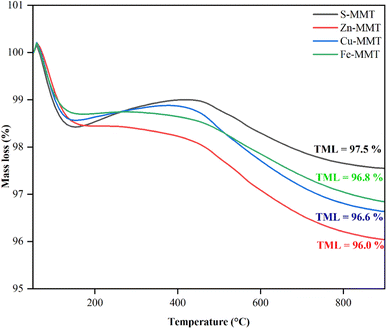
Comparing CE-MMTs, it can be deduced that the surface area decreases with the order: Fe-MMT > Cu-MMT > Zn-MMT. This also indirectly suggests that Zn-MMT had the highest Zn2+ content, while Fe-MMT had the lowest Fe3+ content. XRF analysis lends further support (Table 1), showing that, Zn content in Zn-MMT was the highest (0.16 ± 0.13) after the exchange reaction. The outcomes of XRF and N2-BET surface area (Table 1 and Fig. 2, respectively) appeared to indicate that Zn2+ was the most exchanged cation, followed by Cu2+ and Fe3+. To further confirm this, CE-MMTs were analysed by TGA. In theory, cations have a strong affinity towards water molecules because they serve as strong hydrophilic sites for water sorption, forming hydrated cations.34 Thus, any mass loss recorded by TGA is most likely due to the evaporation of water molecules, which indirectly reflects the quantity of added cation in MMT.
| Catalyst | T (°C) | TASa (mmol g−1) | LAb/BAc (surface) ratio | |||||
|---|---|---|---|---|---|---|---|---|
| <250 | 350–500 | >500 | ||||||
| T (°C) | Weak acidic site | T (°C) | Strong acidic site | T (°C) | Very strong acidic site | |||
| a Total acid sites.b Lewis acid (LA) surface sites.c Brønsted acid (BA) surface sites. | ||||||||
| S-MMT | 98 | 9.4 | NA | NA | 558 | 23.8 | 33.2 | 4.39 |
| Fe-MMT | 90 | 5.7 | 493 | 3.0 | NA | NA | 8.7 | 3.73 |
| Cu-MMT | 94 | 5.4 | NA | NA | 514 | 4.3 | 11.8 | 10.33 |
| 746 | 2.105 | |||||||
| Zn-MMT | 89 | 7.6 | NA | NA | 539 | 15.3 | 34.8 | 13.06 |
| 745 | 11.9 | |||||||
In TPD-NH3 analysis, Zn-MMT exhibited the highest TAS, while Fe-MMT had the lowest TAS. Surprisingly, except for Zn-MMT, the TAS for S-MMT was far higher than those of Fe-MMT and Cu-MMT. However, through the pyridine-adsorption test, S-MMT had far lower LA/BA surface ratio compared to Zn-MMT and Cu-MMT. This strongly suggests that the higher TAS with the lower LA/BA in S-MMT reflects the presence of more Brønsted acid surface sites (H+). In the case of Zn-MMT, the highest LA/BA ratio signifies the presence of more Lewis acid surface sites, affirming the successful intercalation of more Zn2+ cation during the exchange process. This is consistent with TGA analysis, where TML in Zn-MMT was found to be the highest, thus proposing there were a number of Zn2+ cations being intercalated during the exchange reaction. For Cu-MMT, the LA/BA ratio was also notably high, indicating that some of the added Cu2+ was intercalated during the exchanged reaction. As a conclusion, the order for exchangeability of cation is as follows: Zn2+ > Cu2+ > Fe3+.
3.2 Catalytic performance of CE-MMTs
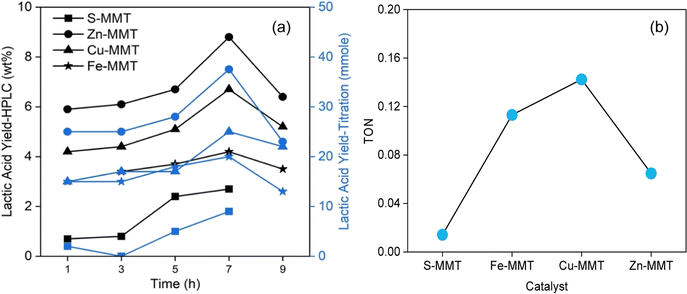
The time-dependent catalytic activity of CE-MMTs in converting glucose to lactic acid at 170 °C was evaluated. Recorded lactic acid yields are presented in Fig. 4.Both quantification methods (HPLC and titration) gave identical trends, which led to two findings. First, the catalytic performance of the tested MMTs in producing lactic acid can be ranked as follows (in increasing order): S-MMT < Fe-MMT < Cu-MMT < Zn-MMT (Fig. 4(a)). Zn-MMT produced the highest lactic acid yield simply because the catalyst had the highest Lewis acid surface sites, as indicated by the pyridine-adsorption test (Table 2). The highest Lewis acid surface sites was due to the higher content of Zn2+ intercalated in MMT following the exchange process with the exchangeable cations (K+, Mg2+ and Fe3+). The second finding is that, irrespective of the type of MMTs, the lactic acid yield showed a gradual increase, peaking at 7 h, and then decreasing at 9 h (Fig. 4(a)). This trend likely reflects a competition between dehydration and retro-aldol reactions. Below 7 h-reaction, retro-aldol might have predominated, increasing lactic acid production. However, exceeding 7 h-reaction, the dehydration likely dominated over retro-aldol, leading to the increased HMF production while suppressing lactic acid formation.
Fig. 4(b) shows the estimated turnover numbers (TON) of the tested MMTs in producing lactic acid from D-glucose under 170 °C for 7 h. TON was calculated using a reported formula,35 where the number of lactic acid produced (mmole) is divided by the number TAS (mmole) measured by TPD-NH3 analysis (Table 2). In contrary to the trends in lactic acid yields depicted in Fig. 4(a), Cu-MMT had the highest TON, followed in decreasing order by Fe-MMT, Zn-MMT and S-SMT (Fig. 4(b)). Above all, the results of catalytic conversion further support the outcomes of XRF, N2-BET surface area and TGA analyses, demonstrating that Zn2+ was the most exchanged cation, followed by Cu2+ and Fe3+. These collective findings align with the primary objective of the study.
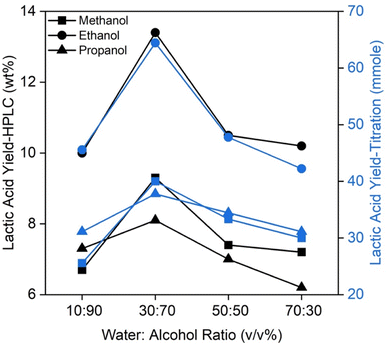
It has been reported that additional Brønsted acid can be formed when Lewis acid sites of solid acids are hydrated with water molecules. However, their presence is temporary due to reversible formation.36,37 A similar occurrence was anticipated in this study because water was used as the reaction medium. To verify this, different alcoholic co-solvents (methanol, ethanol and propanol) were added to water at different ratios. The outcomes are summarised in Fig. 5.
Irrespective of the water-to-alcohol ratio, the addition of ethanol further enhanced lactic acid yield, whereases the use of methanol and propanol inhibited lactic acid formation. Water-to-ethanol at 30![[thin space (1/6-em)]](https://www.rsc.org/images/entities/char_2009.gif) :
:![[thin space (1/6-em)]](https://www.rsc.org/images/entities/char_2009.gif) 70 v/v% appeared to be the optimal solvent ratio, generating ca. 35% (by wt%) more lactic acid compared to using just water (Fig. 4(a)).
70 v/v% appeared to be the optimal solvent ratio, generating ca. 35% (by wt%) more lactic acid compared to using just water (Fig. 4(a)).
Table 3 compares the highest lactic acid yields produced in this study with those reported in the chemical literature. Lactic acid yield reported by Gao et al.19 is slightly lower than the yield we recorded, which was obtained at a much lower temperature over a longer period. Meanwhile, in the study conducted by Onda et al.,38 the lactic acid yield is twice as high as in our study. However, their study used a catalyst amount six times higher than what we employed in this work.
| No. | Catalyst | Glucose amount | Solvent | Tem. (°C) | Time (h) | Lactic acid yielda (%) | Ref. | |
|---|---|---|---|---|---|---|---|---|
| Type | Amount (g) | |||||||
| a Highest lactic acid yields generated by the reaction.b Lactic acid yields (by wt%) determined by HPLC analysis.c The catalyst was heated at 723 K (450 °C) under nitrogen for 6 h prior to the reaction.38 | ||||||||
| 1 | Zn-MMT | 0.1 | 0.1 g | H2O![[thin space (1/6-em)]](https://www.rsc.org/images/entities/char_2009.gif) : :![[thin space (1/6-em)]](https://www.rsc.org/images/entities/char_2009.gif) EtOH (30 EtOH (30![[thin space (1/6-em)]](https://www.rsc.org/images/entities/char_2009.gif) : :![[thin space (1/6-em)]](https://www.rsc.org/images/entities/char_2009.gif) 70) 70) |
170 | 7 | 13.4%b | This study |
| 2 | Bentonite | 0.04 | 0.04 g | H2O | 275 | 1.5 | 11% | 19 |
| 3 | Hydrotalcite-723 Kc | 0.6 | 25 mmol L−1 | H2O | 50 | 8 | 20% | 38 |
3.3 Overall discussion
Based on the physical and chemical analyses, Zn2+ was found to exhibit greatest affinity towards exchanging with the exchangeable cations (K+, and Mg2+) in MMT, followed by Cu2+ and lastly Fe3+. We associated this to the extent of the hydration of the added cation that strongly effects the strength of electrostatic interactions with the negatively charged surfaces of MMT. The enthalpies of hydration (−ΔH) for various cations have been reported in the chemical literature, where the order of ΔH can be ranked as follows: Fe3+ (4429 kJ mole−1) > Cu2+ (2099 kJ mole−1) > Zn2+(2047 kJ mole−1).39 This theoretically means that Zn2+ tends to form a smaller and less stable hydration shell, while Fe3+ inclines to form a larger and more stable hydration shell. Hence, we believed that Zn2+ formed stronger electrostatic interactions with the negatively charged surfaces of MMT due to the lesser interfering caused by its smaller hydration shell. As a result, more Zn2+ cations were retained in the interlayer spaces of MMT. Meanwhile, Fe3+ might have experienced the opposite effect, where the larger hydration shell weakened the electrostatic interactions between the cation and the negatively charged surfaces of MMT. This is strongly supported by the outcomes of catalytic reaction, as shown in Fig. 4(a). The Zn-MMT produced the highest lactic acid yield, reflecting higher Lewis acid–Zn(II) sites in the catalyst, further promoting the isomerization of glucose to fructose, followed by the retro-aldol conversion of fructose to lactic acid (Fig. 6, steps 1 and 3). In the case of Cu-MMT and Fe-MMT, the surface of both catalysts was dominated by Brønsted acid sites, as indicated by TPD-NH3 analysis and pyridine-adsorption test (Table 2). Consequently, these catalysts exhibited a greater preference towards the formation of 5-HMF formation (Fig. 6, step 2).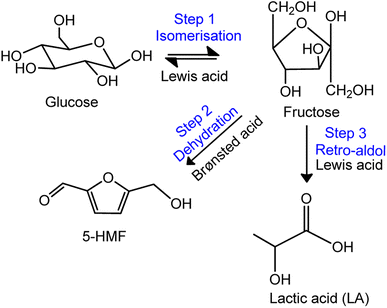 | ||
| Fig. 6 Lewis/Brønsted acid catalysed conversion of glucose to lactic acid.40 | ||
The subsequent study, of which the results are shown in Fig. 5, was motivated by an investigation carried out by Omata et al.36 They demonstrated the formation of temporary Brønsted acid sites on Nb–O catalyst through the reversible interaction of Lewis acid–Nb(I) sites and water, as shown in Fig. 7.36 A similar occurrence was anticipated in this study. To suppress the formation of additional Brønsted acid sites, we purposely added alcohols as co-solvents and reduced the quantity of water. Although alcohols do have an acidic proton, their acidity is much lower than water. This is due to the electron-donating nature of alkyl groups bonded to oxygen atom, increasing the electron density on oxygen. As a result, the dissociation of acidic proton of alcohols is much less likely compared to water, thus is very unlikely that alcohols form additional Brønsted acid sites. More importantly, we speculated that the presence of electron donating alkyl groups renders the oxygen atom on alcohols more negatively charged than that of water. Consequently, the interactions with Lewis acid sites are preferred and stronger with alcohols than water. These explanations lend support for the outcomes in Fig. 5.
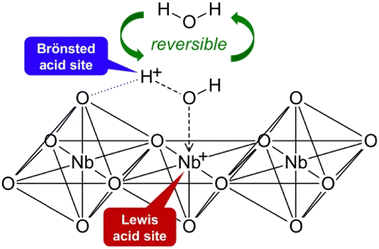 | ||
| Fig. 7 Mechanism for activation of water molecule on Nb–O catalyst proposed by Omata et al.36 | ||
It should also be noticed that ethanol produced the highest lactic acid yield, followed by methanol and propanol. In general, the ethyl group in ethanol has a weaker electron-donating effect compared to the propyl group propanol. As a result, the oxygen atom in ethanol might have interacted moderately with Lewis acid sites, causing a minimal obstruction to the access of the Lewis acid sites by the reactants. Meanwhile, the propyl group in propanol, being a much stronger electron-donating group, could possibly form much stronger interactions with Lewis acid sites, leading to a higher degree of obstruction. This is further supported by the fact that of propanol is more basic than water (pKa ∼ 16.1 and pKa ∼ 15.7, respectively). On-going investigations are being conducted to further understand the specific role of type of alcohols and alcohol-to-water ratios on the catalytic conversion of glucose to lactic acid.
Finally, it is essential to highlight that the central focus of this study was to understand the exchange affinity of Fe3+, Cu2+ and Zn2+ cations with the inherent exchangeable cations in S-MMT to enhance Lewis acid sites, thereby improving the catalytic conversion of glucose to lactic acid. Other important aspects of the reaction, such as optimisation of reaction parameters, catalyst reusability and characterisation of spent catalysts, were not addressed in this study. We are presently investigating these aspects and anticipate publishing the outcomes in our upcoming publication.
4. Conclusion
In summary, this study focused on investigating the exchange affinity of Fe3+, Cu2+, and Zn2+ cations in sulfuric acid-purified MMT (S-MMT) catalysts to enhance Lewis acid sites and the consequent conversion of glucose to lactic acid. XRD analysis corroborated the successful exchange process, resulting in an increase in d-spacing of the resultant cation-exchanged MMTs. XRF and TGA analyses substantiated that Zn2+ displayed the highest exchange affinity, followed by Cu2+ and Fe3+. This finding was further supported by TPD-NH3 analysis and pyridine-adsorption test, revealing that Zn-MMT possessed the highest total acid sites (TAS) and the ratio of Lewis acid-to-Brønsted acid surface site (LA/BA), thereby indicating the presence of higher Lewis acid sites owing to the substantial quantity of Zn2+ cations. Consistently, the catalytic studies exhibited increasing lactic acid yields in the order of Fe-MMT < Cu-MMT < Zn-MMT. Furthermore, the conversion catalysed by Zn-MMT with the incorporation of ethanol as a co-solvent enhanced lactic acid yield, whereases methanol and propanol impeded lactic acid formation. Notably, water-to-ethanol ratio of 30![[thin space (1/6-em)]](https://www.rsc.org/images/entities/char_2009.gif) :
:![[thin space (1/6-em)]](https://www.rsc.org/images/entities/char_2009.gif) 70 v/v% appeared as the optimal solvent ratio, yielding an approximate 35% increase in lactic acid yield compared to the use of water alone. Overall, these findings provide significant insights into the cation exchange affinity of different cations in MMT catalysts and their consequential applications in optimising the conversion of glucose to lactic acid. Furthermore, the utilisation of alcohol as a co-solvent offers a promising method for enhancing the catalytic performance of cation-exchanged MMTs, hence propelling advances in sustainable chemical transformations.
70 v/v% appeared as the optimal solvent ratio, yielding an approximate 35% increase in lactic acid yield compared to the use of water alone. Overall, these findings provide significant insights into the cation exchange affinity of different cations in MMT catalysts and their consequential applications in optimising the conversion of glucose to lactic acid. Furthermore, the utilisation of alcohol as a co-solvent offers a promising method for enhancing the catalytic performance of cation-exchanged MMTs, hence propelling advances in sustainable chemical transformations.
Conflicts of interest
We know of no conflicts of interest associated with this manuscript.Acknowledgements
This study was funded by the Ministry of Higher Education of Malaysia (MOHE) through a research fund (FRGS-RACER/1/2019/TK05/USIM//1/17091). Dr S. M. S. N. Shikh Zahari acknowledges MOHE for awarding the scholarship (KPT(BS)860407) to pursue postdoctoral research fellow in Professor Hallett's Research Group at Department of Chemical Engineering, Imperial College London, UK. The authors also acknowledge the open access funding provided by Universiti Sains Islam Malaysia.References
- D. Yankov, Fermentative lactic acid production from lignocellulosic feedstocks: from source to purified product, Front. Chem., 2022, 10, 823005, DOI:10.3389/fchem.2022.823005.
- A. A. Marianou, et al., Cellulose conversion into lactic acid over supported HPA catalysts, Green Chem., 2019, 21(22), 6161–6178, 10.1039/C9GC02622C.
- I. P. Mahendra, et al., Poly(L-lactic acid)/deproteinized natural rubber blends with enhanced compatibility, Polimery, 2021, 66, 105–111, DOI:10.14314/polimery.2021.2.3.
- G. Velvizhi, et al., Integrated biorefinery processes for conversion of lignocellulosic biomass to value added materials: paving a path towards circular economy, Bioresour. Technol., 2022, 343, 126151, DOI:10.1016/j.biortech.2021.126151.
- N. I. Haykir, et al., Applications of ionic liquids for the biochemical transformation of lignocellulosic biomass into biofuels and biochemicals: a critical review, Biochem. Eng. J., 2023, 193, 108850, DOI:10.1016/j.bej.2023.108850.
- A. Brandt, et al., Deconstruction of lignocellulosic biomass with ionic liquids, Green Chem., 2013, 15(3), 550–583, 10.1039/C2GC36364J.
- S. M. S. N. S. Zahari, et al., Deconstruction of Malaysian agro-wastes with inexpensive and bifunctional triethylammonium hydrogen sulfate ionic liquid, AIP Conf. Proc., 2018, 1972(1), 030024, DOI:10.1063/1.5041245.
- S. M. S. N. S. Zahari, et al. Triethylammoniumhydrogen sulfate ionic liquid as a low-cost solvent: a short review of synthesis, analysis and applications, MATEC Web of Conferences, 2018, 204, 00006, DOI:10.1051/matecconf/201820400006.
- A. A. Marianou, et al., Effect of Lewis and Brønsted acidity on glucose conversion to 5-HMF and lactic acid in aqueous and organic media, Appl. Catal., A, 2018, 555, 75–87, DOI:10.1016/j.apcata.2018.01.029.
- T. Qi, et al., Cooperative catalytic performance of Lewis and Brønsted acids from AlCl3 salt in aqueous solution toward glucose-to-fructose isomerization, J. Phys. Chem. C, 2019, 123(8), 4879–4891, DOI:10.1021/acs.jpcc.8b11773.
- E. Jolimaitre, et al., Dihydroxyacetone conversion into lactic acid in an aqueous medium in the presence of metal salts: influence of the ionic thermodynamic equilibrium on the reaction performance, Catal. Sci. Technol., 2018, 8(5), 1349–1356, 10.1039/C7CY02385E.
- Z. Huo, et al., Selective conversion of glucose into lactic acid with transition metal ions in diluted aqueous NaOH solution, ACS Sustain. Chem. Eng., 2014, 2(12), 2765–2771, DOI:10.1021/sc500507b.
- R. Kupila, et al., Lignin-based activated carbon-supported metal oxide catalysts in lactic acid production from glucose, Appl. Catal., A, 2021, 612, 118011, DOI:10.1016/j.apcata.2021.118011.
- H. Xu, et al., ZnO as a simple and facile catalyst for acid-base coordination transformation of biomass-based monosaccharides into lactic acid, Mol. Catal., 2022, 522, 112241, 10.1039/C9CY00991D.
- X. Zhao, et al., γ-Valerolactone-introduced controlled-isomerization of glucose for lactic acid production over an Sn-Beta catalyst, Green Chem., 2021, 23(7), 2634–2639, 10.1039/D1GC00378J.
- P. Sun, et al., Rational positioning of metal ions to stabilize open tin sites in beta zeolite for catalytic conversion of sugars, Angew. Chem., Int. Ed., 2023, 62(6), e202215737, DOI:10.1002/anie.202215737.
- W. Dai, et al., Spectroscopic signature of Lewis acidic framework and extraframework Sn sites in beta zeolites, ACS Catal., 2020, 10(23), 14135–14146, DOI:10.1021/acscatal.0c02356.
- F.-F. Wang, et al., Conversion of cellulose to lactic acid catalyzed by erbium-exchanged montmorillonite K10, Green Chem., 2015, 17(4), 2455–2463, 10.1039/C4GC02131B.
- X. Gao, et al., Hydrothermal conversion of glucose into organic acids with bentonite as a solid-base catalyst, Catal. Today, 2016, 274, 49–54, DOI:10.1016/j.cattod.2016.02.008.
- H. Yang, et al., Catalytic conversion of cellulose to reducing sugars over clay-based solid acid catalyst supported nanosized SO42−-ZrO2, Appl. Clay Sci., 2020, 185, 105376, DOI:10.1016/j.clay.2019.105376.
- X. Ye, et al., Natural mineral bentonite as catalyst for efficient isomerization of biomass-derived glucose to fructose in water, Sci. Total Environ., 2021, 778, 146276, DOI:10.1016/j.scitotenv.2021.146276.
- F. W. Harun, et al., Esterification of oleic acid with alcohols over Cu-MMT K10 and Fe-MMT K10 as acid catalysts, AIP Conf. Proc., 2018, 1972(1), 030025, DOI:10.1063/1.5041246.
- G. Nagendrappa, Organic synthesis using clay and clay-supported catalysts, Appl. Clay Sci., 2011, 53(2), 106–138, DOI:10.1016/j.clay.2010.09.016.
- S. Yahya, et al., Optimization of biodiesel production from waste cooking oil using Fe-montmorillonite K10 by response surface methodology, Renewable Energy, 2020, 157, 164–172, DOI:10.1016/j.renene.2020.04.149.
- R. Khumho, et al., Glucose conversion into 5-hydroxymethylfurfural over niobium oxides supported on natural rubber-derived carbon/silica nanocomposite, Catalysts, 2021, 11(8), 887, DOI:10.3390/catal11080887.
- N. F. I. C. Sam, et al., Sulfuric acid treated-montmorillonite as catalyst for hydrothermal conversion of glucose to lactic acid: a preliminary study, AIP Conf. Proc., 2023, 2625(1), 030003 CrossRef CAS.
- Z. Vajglová, et al., The physicochemical and catalytic properties of clay extrudates in cyclization of citronellal, Appl. Catal., A, 2022, 629, 118426 CrossRef.
- X. Wu, Acidity and catalytic activity of zeolite catalysts bound with silica and alumina, Texas A&M University, 2004 Search PubMed.
- H. Zhao, et al., Catalytic dehydration of glycerol to acrolein over sulfuric acid-activated montmorillonite catalysts, Appl. Clay Sci., 2013, 74, 154–162 CrossRef CAS.
- I. E. Dubois, et al., Dependency of BET surface area on particle size for some granitic minerals, Proceedings in Radiochemistry, 2011, 1(1), 75–82 CrossRef.
- J.-F. Lee, et al., Size effects of exchange cation on the pore structure and surface fractality of montmorillonite, J. Colloid Interface Sci., 1999, 217(1), 172–176 CrossRef CAS PubMed.
- G. B. B. Varadwaj, et al., A stable amine functionalized montmorillonite supported Cu, Ni catalyst showing synergistic and co-operative effectiveness towards C–S coupling reactions, RSC Adv., 2013, 3(20), 7570–7578 RSC.
- C.-C. Wang, et al., Adsorption of basic dyes onto montmorillonite, J. Colloid Interface Sci., 2004, 273(1), 80–86, DOI:10.1016/j.jcis.2003.12.028.
- F.-C. Huang, et al., Effects of cation exchange on the pore and surface structure and adsorption characteristics of montmorillonite, Colloids Surf., A, 2004, 239(1), 41–47, DOI:10.1016/j.colsurfa.2003.10.030.
- A. Wali, et al., Montmorillonite clay catalysis: conversion of methyl benzoate and NH3 into benzonitrile and amides, J. Catal., 1998, 173(1), 84–94, DOI:10.1006/jcat.1997.1896.
- K. Omata, et al., Catalysis of water molecules acting as Brönsted acids at Lewis acid sites on niobium oxide, Appl. Catal., A, 2020, 607, 117812 CrossRef CAS.
- Q.-L. Dai, et al., Water effects on the acidic property of typical solid acid catalysts by 3,3-dimethylbut-1-ene isomerization and 2-propanol dehydration reactions, Catal. Today, 2017, 295, 110–118, DOI:10.1016/j.cattod.2017.05.084.
- A. Onda, et al., Lactic acid production from glucose over activated hydrotalcites as solid base catalysts in water, Catal. Commun., 2008, 9(6), 1050–1053, DOI:10.1016/j.catcom.2007.10.005.
- D. W. Smith, Ionic hydration enthalpies, J. Chem. Educ., 1977, 54(9), 540, DOI:10.1021/ed054p540.
- C. Megías-Sayago, et al., Recent advances in the Brønsted/lewis acid catalyzed conversion of glucose to HMF and lactic acid: pathways toward bio-based plastics, Catalysts, 2021, 11(11), 1395, DOI:10.3390/catal11111395.
Footnotes |
| † Electronic supplementary information (ESI) available. See DOI: https://doi.org/10.1039/d3ra05071h |
| ‡ N. F. I. Che Sam and S. M. S. N. Shikh Zahari are joint first author who contributed equality to this work. |
| This journal is © The Royal Society of Chemistry 2023 |

