 Open Access Article
Enhanced anodic catalytic performance in PrFeO3−δ of perovskite materials via Co-doping with Sr and VB subgroup metals (V, Nb, Ta)
Hongfei Chen a,
Zhe Lü
 *a,
Zhipeng Liub,
Yujie Wua,
Shuai Wanga and
Zhihong Wanga
aSchool of Physics, Harbin Institute of Technology, Harbin 150001, China. E-mail: lvzhe@hit.edu.cn
bElectric Power Research Institute, State Grid Heilongjiang Electric Power Company Ltd, Harbin 150030, China
First published on 26th September 2023
Abstract
The anodic catalytic capability of PrFeO3−δ is restricted by the Fe-site element type in the perovskite material structure due to its low electrical conductivity of electrons. Here, we present a strategy for tuning the Fe-site element type via Sr and VB subgroup metals (V, Nb, Ta) co-doping to enhance the anodic catalytic performance of PrFeO3−δ anode materials. Our calculations show that Sr and Nb co-doping has suitable hydrogen adsorption energy for PrFeO3−δ anode materials, and its adsorption energy is adjusted to −0.717 eV, which is more suitable to absorb the hydrogen molecule than other high-profile perovskite anode materials. Meanwhile, after the doped surface is adsorbed by hydrogen molecules, the bond length lengthens until it breaks, and one of the broken hydrogen atoms moves directly above the surface oxygen atom, which is beneficial for accelerating the anodic catalytic reaction. Thus, the Pr0.5Sr0.5Fe0.875Nb0.125O3−δ material is a promising perovskite anode catalyst. Interestingly, the stability of PrFeO3−δ is significantly affected by the oxygen vacancy content; the structural stability of the undoped system can be maintained via Sr and Nb co-doping to avoid decomposition, which provides new thinking to maintain the high stability of perovskite ferrite materials. Furthermore, we find that relative to the PrFeO3−δ, the Pr0.5Sr0.5Fe0.875Nb0.125O3−δ surface of hydrogen adsorption has obvious charge transfer and upward shift of the d-band center. Our anodic catalytic theoretical work shows that Sr and Nb co-doping can effectively enhance the catalytic performance of the PrFeO3−δ ferrite materials.
1. Introduction
The fuel cell (FC) is one of the candidate energy conversion devices investigated for improving the efficiency of new energy conversion significantly. Since solid oxide fuel cell (SOFC) is shown to have a relatively excellent practical service life, long-term stability and fuel suitability, it is considered to be a third-generation FC with good development potential.1–9 The following three procedures are included in the working process of SOFC. First, the cathode side gains electrons. Next, due to the concentration difference, oxygen ions move via the electrolyte to reach the anode. Finally, the generated electrons move back via an external circuit.10,11Based on the working principle of SOFC, its various parts of the construction materials have been widely studied. Among them, the anode is the crucial component of SOFC with unique selection requirements, such as conductivity, stability, thermal expansion and catalytic capacity.12,13 The anodes currently under study are mainly Ni-based, Cu–CeO2-based and Perovskite and its derived structural systems. Ni-based systems are prevented from being used in the long term because of their instability and high cost.14–16 An effective dry catalyst was prepared, which could effectively reduce the carbon resistance while increasing the power density by Yao et al., which is very important to improve the efficiency of converting waste heat of biogas fuel into chemical energy.17 Cheng et al. revealed the nanocrystalline properties of NiO-YSZ materials and used techniques to distinguish the distribution of NiO in microstructure from NiO and YSZ particles.18 Cu is used to impede the deposition of carbon from Ni-based systems because it is hard to form C–C bonds in fuels. Nevertheless, Cu with agglomeration phenomenon is considered detrimental to anodic catalysis due to the high-temperature operation.19 Jung et al. studied the effect of Cu distribution on wet hydrogen fuel via the impregnation method which made Cu distribution in anode uniform.20 Ye et al. proposed a two-strip anode casting method, studied its performance characteristics in different fuels, and compared its long-term performance in high-temperature streams.21
The rise of anode material research makes people pay attention to perovskite materials. In recent years, perovskite and its derived structures play an important role in SOFC electrode research.22–31 Perovskite and its derivative systems are used in classical cathode materials. LaSr(MnO3)2, as the representative material of cathode, has good physical properties, cathode stability and electrode performance above 1000°.32,33 Since the perovskite cathode materials, perovskite system anode has become a research hotspot with constantly being explored.34–42 Cr-based perovskite is well regarded for reducing the gas electrode and maintaining excellent stability.43–45 In particular, Fe-based perovskite has attracted extraordinary inquiry interest recently.46 Perovskite materials have shown many advantages in anode applications.
Unfortunately, compared with Ni-based anode, perovskite anode PrFeO3−δ has a low electronic conductivity that greatly restricts the anodic catalytic performance in the SOFC field.47,48 Therefore, it's highly necessary to adopt a facile arrangement for improving the conductivity of materials to enhance the anodic catalytic performance. Fe-site doping is a frequent arrangement for tuning conductivity. Whereas, single doping usually causes more appearances of impurity defects that trigger more serious defect structure evolution.49
To overcome the low electronic conductivity issue, Sr and VB subgroup metals co-doping is a practical and facile arrangement to improve the electronic conductivity of PrFeO3−δ, thus promoting the anodic catalytic reaction. Doping with Nb elements helps to prevent the intrinsic material from decomposing and simultaneously forms Nb–O bonds to enhance the stability of the intrinsic structure. The co-doping with Sr elements, with their appropriate ion radius, can balance the valence state imbalance caused by higher-valent doping. Although there are rare reports on the stability and catalytic performance of PrFeO3−δ, many studies above improving the catalytic performance of perovskite electrodes by increasing the conductivity of Fe-site element have been reported. By comparing and investigating the doping, redox stability and conductivity of LaCrO3, Jiang et al. calculated that A-site doping with few basic elements can reduce the activation energy of conductivity thus significantly improving the electrical conductivity.50 Shin et al. calculated that the PrMnO3 formation energy of oxygen vacancy is significantly reduced compared to that of a chalcogenide such as LaMnO3. Oxygen adsorption on the surface of LaMnO3 was investigated by theoretical simulations. Found that the oxygen vacancies in La0.5Sr0.5FeO3−δ reduced the electrical conductivity, ultimately leading to a metal-to-semiconductor structural transition under low pressures.51 However, calculations of Zhou display that the oxygen vacancy formation energy of PrMnO3 is significantly reduced compared to that of a chalcogenide such as LaMnO3.52 Although some progress has been made in the experimental research and theoretical reports on perovskite anode materials.
To date, only rare studies above tuning the bulk formation energy, initial and final-state with surface adsorption of the PrFeO3−δ anode via co-doping.53,54 Nevertheless, in these reports, the initial and final-state adsorption surface is not calculated, which cannot fully further explain the mechanism of anode catalysis. With our current research, few details are regarded with the oxygen vacancy stability and adsorption mechanism of PrFeO3−δ systems under Sr and Fe-site co-doping. From an experimental perspective, it is indeed possible to prepare the anode materials for this system. Among them, Pr0.5Sr0.5FeO3, Pr0.5Sr0.5Fe0.875V0.125O3, and Pr0.5Sr0.5Fe0.875Nb0.125O3 powders were synthesized via the sol–gel method. Pr0.5Sr0.5Fe0.875Ta0.125O3, on the other hand, was synthesized using the conventional solid–state reaction method.
In this theoretical calculation work, we focus on the bulk and surface of pristine and co-doping PrFeO3−δ systems, such as bulk forming energy, oxygen vacancy formation energy and adsorption performance. We find that PrFeO3−δ under Sr and Nb co-doped is a promising anode catalyst due to its desirable adsorption property value, significant charge transfer and d-band center moves upward. Meanwhile, the stability of the PrFeO3−δ with different oxygen vacancy concentrations and sites is differ widely, which further illustrates the effect of oxygen vacancy from the structure of perovskite. Sr and Nb co-doped the adsorption property value of PrFeO3−δ adjust to −0.717 eV, that neither the catalytic effect is strong enough, nor does it cause electrode poisoning. In addition, the structure of the final-states co-doped anode is conducive to the next catalytic step. Our simulated results manifest that Sr and Fe-site co-doped can effectively augment the anode catalytic performance of the PrFeO3−δ.
2. Calculation methods
The VASP code was executed through the whole simulated calculations.55,56 The PAW can express the core–electron interaction, while the exchange and correction effects was adopted with the GGA-PBE.57–59 The core–electron interaction refers to the interaction between the atomic nucleus and electrons. It arises from the Coulomb interaction, which is the interaction between charged particles. This interaction directly influences the motion, energy, and distribution of electrons, thereby determining the external behavior and chemical reactions of atoms. In all part simulated work, the cutoff energy and the energy convergence were tested to be 500 eV and 1.0 × 10⁻⁶ eV, separately. The vacuum layer was set to 20 Å thickness along the z-direction. The k-point mesh sampling for PrFeO3−δ bulk and surface in the Brillouin zone was tested to 6 × 6 × 6 and 6 × 6 × 1, respectively. The force was set to 0.05 eV Å−1. We adopt the DFT+U method, in which the Ueff (=U − J) Hubbard parameter is added to the transition elements (UFe,d = 5.3 eV, UV,d = 5.3 eV, UNb,d = 5.0 eV, and UTa,d = 4.8 eV), which was adopted in the previous study.60–62 The maximum stress was set to 0.1 GPa. We calculated the formation energy according to
 | (1) |
| Eads = Esur–H2 − Esur − EH2 | (2) |
3. Results and discussion
3.1. PrFeO3−δ bulk materials of pristine and co-doped
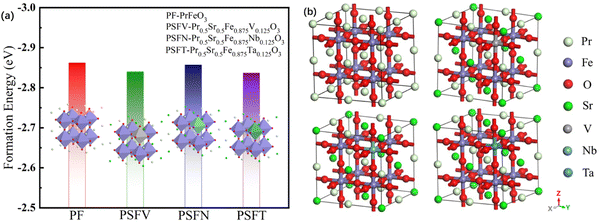 | ||
| Fig. 1 (a) The formation energy and (b) the optimized model of the PrFeO3−δ, Pr0.5Sr0.5Fe0.875V0.125O3−δ, Pr0.5Sr0.5Fe0.875Nb0.125O3−δ and Pr0.5Sr0.5Fe0.875Ta0.125O3−δ bulk materials. | ||
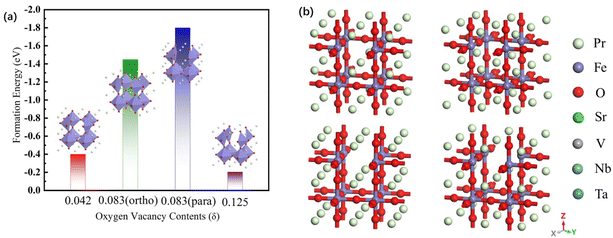
The oxygen vacancy formation energy of the pristine PrFeO3−δ is shown in Fig. 2. The para-0.083 oxygen vacancy concentration has the most stable structure of the PrFeO3−δ with −1.799 eV formation energy. The PrFeO3−δ with oxygen vacancy still shows a perovskite structure, which has no lattice distortion. The increase in oxygen vacancy can improve the PrFeO3−δ anode stability.
3.2. Pristine and co-doped PrFeO3−δ (001) surface materials
| O2− + H2 → H2O + 2e− | (3) |
It can be seen that the premise of the pristine and co-doped PrFeO3−δ catalytic reaction is hydrogen adsorption on the surface of the anode materials. According to the different adsorption sites of the same perovskite structure, the adsorption energy of the optimal adsorption site was calculated. After determining the optimal adsorption site of the same material, the adsorption energy of hydrogen at the optimal site of different materials was compared to interpret the catalytic effect of anode materials.
The adsorption energy value of the pristine PrFeO3−δ is −0.278 eV, much lower than the adsorption energy of chemisorption, which is judged as physical adsorption. Therefore, the adsorption energy value was tuned via co-doping. The adsorption energy of the pristine and co-doped PrFeO3−δ (001) is shown in Fig. 4. All three kinds of Sr and V, Nb, Ta co-doped give rise to an enhancement in PrFeO3−δ (001) hydrogen adsorption.
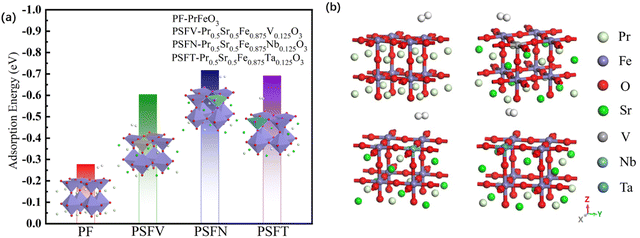 | ||
| Fig. 4 (a) The adsorption energy and (b) the optimum adsorption model of the PrFeO3−δ, Pr0.5Sr0.5Fe0.875V0.125O3−δ, Pr0.5Sr0.5Fe0.875Nb0.125O3−δ and Pr0.5Sr0.5Fe0.875Ta0.125O3−δ surface materials. | ||
The best adsorption sites of the pristine and co-doped PrFeO3−δ (001) are all directly above the iron atom. The adsorption energy value of Pr0.5Sr0.5Fe0.875Nb0.125O3−δ (001) increased to −0.717, which was more obvious than that of Pr0.5Sr0.5Fe0.875V0.125O3−δ and Pr0.5Sr0.5Fe0.875Ta0.125 O3−δ (001). After adsorption, the bond lengths of H–H bonds on the surfaces of the pristine and (Sr and V, Nb, Ta) co-doped surface (001) were 0.751 Å, 0.754 Å, 0.760 Å and 0.0.756 Å, respectively, indicating that the H–H bonds were gradually elongated after adsorption occurred. With the most obvious effect for Nb. The distances between the hydrogen molecules and the surfaces of the pristine and Sr and V, Nb, Ta co-doped were 2.126 Å, 2.070 Å, 2.063 Å and 2.067 Å respectively, while the bond lengths of Fe–O bonds on the surfaces of the pristine and Sr and V, Nb, Ta co-doped were 1.881 Å, 1.936 Å, 1.985 Å and 1.961 Å respectively. The comparison shows that the adsorption of hydrogen on the pristine (001) is closer to physical adsorption, while the surfaces of Sr and V, Nb, Ta co-doped belong to chemisorption.
| Δρ = ρsur–H2 − ρsur − ρH2 | (4) |
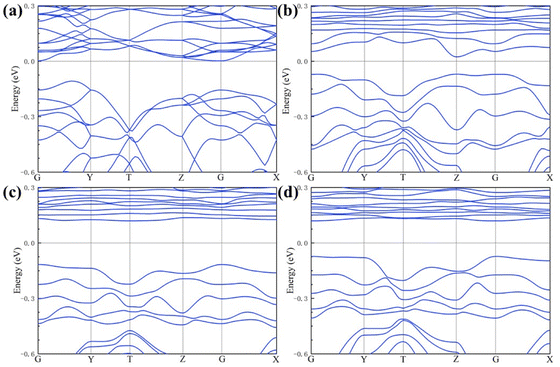
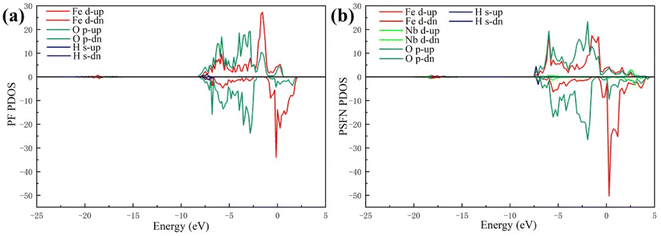
Our works on the PDOS show that the Sr and Nb co-doping not only has an obvious d-band center upward shift but also has a narrowing of band gap due to sparse surface arrangement. Therefore, Sr and Nb can effectively enhance the chemisorption bonding performance of the anode.
3.3. Co-doped PrFeO3−δ absorption final-state
As recounted in Fig. 7. The final-state of the hydrogen adsorption Pr0.5Sr0.5Fe0.875Nb0.125O3−δ (001) surface has six final adsorption sites, which fixes a hydrogen atom above one iron to adjust the site of another hydrogen atom. The adsorption energies of the two broken H-atoms simultaneously adsorbed on the surface of final-state surfaces at various points are 0.839 eV, 1.292 eV, 2.788 eV, −0.110 eV, 0.764 eV and 1.796 eV respectively. In contrast, the most stable state of the final-state adsorption surface is reached at the fourth surface model. After the gas is adsorbed onto the surface, the next step in the catalytic reaction involves the cleavage of the H–H bond. One of the H atoms positioned directly above the Nb atom undergoes a localized displacement, while the other H atom migrates to the O atom located adjacent to the Nb atom. The distances of the two hydrogen atoms from the surface are 1.492 Å and 0.975 Å, respectively, indicating that the hydrogen atom is further chemisorbed to the oxygen on the surface. At the same time, the distance between the two hydrogen atoms is stretched to 1.973 Å, indicating that this process facilitates further co-doped anodic catalysis.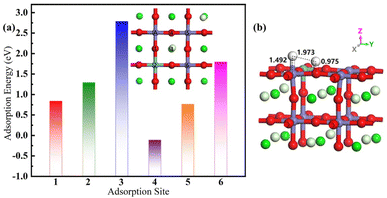 | ||
| Fig. 7 (a) The adsorption energy with different position and (b) the optimal adsorption site structure of the final-state Pr0.5Sr0.5Fe0.875Nb0.125O3−δ surface materials. | ||
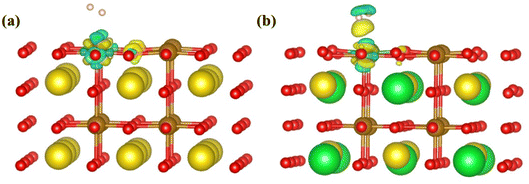
To study the charge transfer status of the final-state of Pr0.5Sr0.5Fe0.875Nb0.125O3−δ (001), the differential charge density of the final-state adsorption structure is shown in Fig. 8(a). This indicates that a substantial loss of electrons occurs between the two hydrogen atoms, while each hydrogen atom gains some electrons from the adjacent iron and oxygen atoms on the surface. The electrons then transfer from the two hydrogen atoms to the corresponding positions below them on the specifical site (the Nb and O atoms). Notably, the charge transferred to the surface via the Nb atom is greater than that transferred through the O atom after the H–H bond is broken. This observation implies that the charge distribution among the two hydrogen atoms is not uniform following the bond cleavage.
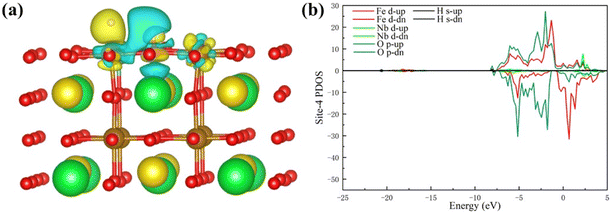 | ||
| Fig. 8 (a) The differential charge density and (b) the PDOS of the final-state Pr0.5Sr0.5Fe0.875Nb0.125O3−δ surface materials. | ||
Fig. 8(b) displays the d-band PDOS of the final-state Pr0.5Sr0.5Fe0.875Nb0.125O3−δ (001). Relative to the initial-state Pr0.5Sr0.5Fe0.875Nb0.125O3−δ (001), the final-state Pr0.5Sr0.5Fe0.875Nb0.125O3−δ (001) have an obvious upward shift in the d-band center.
Our work on the PDOS shows that the reaction mechanism for Pr0.5Sr0.5Fe0.875Nb0.125O3−δ is the gradual elongation of the H–H bond until it breaks, eventually forming final-state adsorption. Therefore, the final-state is conducive to the further catalytic reaction of the Pr0.5Sr0.5Fe0.875Nb0.125O3−δ anode.
4. Conclusions
To summarize, using the software package of VASP calculation works, we integrally simulated the bulk pristine and co-doped PrFeO3−δ, pristine and co-doped PrFeO3−δ surface and final-state adsorption surface. The simulation conclusion of our DFT results shows that Pr0.5Sr0.5Fe0.875Nb0.125O3−δ has suitable adsorption energy value (−0.717 eV) for anodic catalytic reaction, and in the final-state, both hydrogen atoms have charge transfer with the surface, which promotes the next step of electrode reaction. Meanwhile, the apparent charge transfer and the d-band center upward shift of the co-doped adsorption model leads to a significant enhancement in the anode catalytic degree in the SOFC reaction. Thus, the Pr0.5Sr0.5Fe0.875Nb0.125O3−δ is a promising SOFC anode catalyst. In addition, the oxygen vacancy concentration at para-8.3% is the most stable state of the PrFeO3−δ, that are greatly affected the stability of the perovskite anode structure. Furthermore, the obtained simulation conclusions indicate that as an anode with both catalytic and stable properties, its catalytic mechanism is that hydrogen is adsorbed to the Pr0.5Sr0.5Fe0.875Nb0.125O3−δ (001), the H–H bond is gradually elongated, and a new adsorption site is finally formed. Our theoretical work shows that Sr and Nb co-doping can effectively enhance the anode catalytic performance.Conflicts of interest
The authors declare no conflicts of interest.Acknowledgements
The authors acknowledge the support of the National Natural Science Foundation of China (Grant No. 51872067).References
- S. P. S. Badwal and K. Foger, Ceram. Int., 1996, 22, 257–265 CrossRef CAS.
- H. Yokokawa, N. Sakai, T. Horita, K. Yamaji and M. E. Brito, MRS Bull., 2005, 30, 591–595 CrossRef CAS.
- J. Liu, M. Yang, B. S. Chauhan, M. Abdrabboh, M. Fayed, H. Ayed, A. Mouldi, Y. Chen and X. Chen, Process Saf. Environ. Prot., 2023, 175, 783–795 CrossRef CAS.
- Y. Gao, X. Huang, M. Yuan, J. Gao, Z. Wang, Z. Lv, L. Xu and B. Wei, J. Eur. Ceram. Soc., 2023, 43, 2002–2012 CrossRef CAS.
- X. Wang and R. Hou, Int. J. Hydrogen Energy, 2023, S0360319923020268 Search PubMed.
- D. Yu, J. Hu, W. Wang and B. Gu, Fuel, 2023, 333, 126442 CrossRef CAS.
- I. Ismael, A. A. El-Fergany, E. A. Gouda and M. F. Kotb, Int. J. Hydrogen Energy, 2023, S0360319923034183 Search PubMed.
- Y. Hu, C. Han, W. Li, Q. Hu and H. Wu, Fuel Process. Technol., 2023, 250, 107919 CrossRef CAS.
- A. Ding, H. Sun, S. Zhang, X. Dai, Y. Pan, X. Zhang, E. Rahman and J. Guo, Energy Convers. Manage., 2023, 291, 117327 CrossRef CAS.
- P. W. Li and M. K. Chyu, J. Heat Transfer, 2005, 127, 1344–1362 CrossRef CAS.
- P. Boldrin and N. P. Brandon, Nat. Catal., 2019, 2, 571–577 CrossRef CAS.
- H.-H. Möbius, J. Solid State Electrochem., 1997, 1, 2–16 CrossRef.
- P. Sarkar, L. Yamarte, H. Rho and L. Johanson, Int. J. Appl. Ceram. Technol., 2007, 4, 103–108 CrossRef CAS.
- J. Koh, Solid State Ionics, 2002, 149, 157–166 CrossRef CAS.
- F. Wang, W. Wang, J. Qu, Y. Zhong, M. O. Tade and Z. Shao, Environ. Sci. Technol., 2014, 48, 12427–12434 CrossRef CAS PubMed.
- M. Pihlatie, A. Kaiser and M. Mogensen, Solid State Ionics, 2009, 180, 1100–1112 CrossRef CAS.
- Y. Yao, C. Shi, Z. Huang, P. Cai and S. Wang, J. Power Sources, 2022, 521, 230905 CrossRef CAS.
- M. Y. Cheng and B. J. Hwang, J. Am. Chem. Soc., 2004, 2, 49 Search PubMed.
- O. Costa-Nunes, R. J. Gorte and J. M. Vohs, J. Power Sources, 2005, 141, 241–249 CrossRef CAS.
- S. Jung, C. Lu, H. He, K. Ahn, R. J. Gorte and J. M. Vohs, J. Power Sources, 2006, 154, 42–50 CrossRef CAS.
- X.-F. Ye, B. Huang, S. R. Wang, Z. R. Wang, L. Xiong and T. L. Wen, J. Power Sources, 2007, 164, 203–209 CrossRef CAS.
- X. Xiong, J. Yu, X. Huang, D. Zou, Y. Song, M. Xu, R. Ran, W. Wang, W. Zhou and Z. Shao, J. Mater. Sci. Technol., 2022, 125, 51–58 CrossRef CAS.
- S. Pang, G. Yang, Y. Su, J. Xu, X. Shen, M. Zhu, X. Wu, S. Li and C. Chen, Ceram. Int., 2019, 45, 14602–14607 CrossRef.
- Q. Zhou, T. Zhang, C. Zhao, L. Qu, Y. He, T. Wei and X. Tong, Mater. Res. Bull., 2020, 131, 110986 CrossRef CAS.
- C.-Y. Gu, X.-S. Wu, J.-F. Cao, J. Hou, L.-N. Miao, Y.-P. Xia, C. Fu and W. Liu, Int. J. Hydrogen Energy, 2020, 45, 23422–23432 CrossRef CAS.
- X. Meng, G. Long, S. Liu, Y. Ji, M. Pang, B. Wang, S. Lü and J. Yang, Int. J. Hydrogen Energy, 2015, 40, 6935–6941 CrossRef CAS.
- X. Zhang, L. Zhang, J. Meng, W. Zhang, F. Meng, X. Liu and J. Meng, Int. J. Hydrogen Energy, 2017, 42, 29498–29510 CrossRef CAS.
- S. B. Adler, Chem. Rev., 2004, 104, 4791–4844 CrossRef CAS PubMed.
- Y. Gao, X. Huang, M. Yuan, J. Gao, Z. Wang, A. M. Abdalla, A. K. Azad, L. Xu, Z. Lv and B. Wei, J. Power Sources, 2022, 540, 231661 CrossRef CAS.
- Y. Gao, X. Huang, Z. Wang, M. Yuan, J. Gao, Z. Lv, L. Xu and B. Wei, Int. J. Hydrogen Energy, 2023, 48, 2341–2350 CrossRef CAS.
- S. Yu, Y. Li, Y. Wang, Y. Yin and Q. Zhang, Ceram. Int., 2023, 49, 30905–30913 CrossRef CAS.
- J. H. Kuo, H. U. Anderson and D. M. Sparlin, J. Solid State Chem., 1990, 87, 55–63 CrossRef CAS.
- Z. Shao and S. M. Haile, Nature, 2004, 431, 170–173 CrossRef CAS PubMed.
- Y. Yang, X. Su, S. Pan and Z. Yang, Phys. Chem. Chem. Phys., 2015, 17, 26359–26368 RSC.
- C.-Y. Liu, S.-Y. Tsai, C.-T. Ni, K.-Z. Fung and C.-Y. Cho, Jpn. J. Appl. Phys., 2019, 58, SDDG03 CrossRef CAS.
- F. Zhao, C. Jin, C. Yang, S. Wang and F. Chen, J. Power Sources, 2011, 196, 688–691 CrossRef CAS.
- K. Deshpande, A. Mukasyan and A. Varma, J. Power Sources, 2006, 158, 60–68 CrossRef CAS.
- T. S. Li, M. Xu, C. Gao, B. Wang, X. Liu, B. Li and W. G. Wang, J. Power Sources, 2014, 258, 1–4 CrossRef CAS.
- H. Y. Chang, Y. M. Wang, C. H. Lin and S. Y. Cheng, Acad. Manag. Rev., 2013, 702, 111–114 CAS.
- B. Huang, S. R. Wang, R. Z. Liu, X. F. Ye, H. W. Nie, X. F. Sun and T. L. Wen, J. Power Sources, 2007, 167, 39–46 CrossRef CAS.
- I. Z. Rahman, M. A. Raza and M. A. Rahman, Acad. Manag. Rev., 2012, 445, 497–502 CAS.
- B. A. Boukamp, Nat. Mater., 2003, 2, 294–296 CrossRef CAS PubMed.
- W. Y. Hernández, M. A. Centeno, F. Romero-Sarria and J. A. Odriozola, J. Phys. Chem. C, 2009, 113, 5629–5635 CrossRef.
- W. Cai, M. Zhou, D. Cao, X. Yan, Q. Li, S. Lü, C. Mao, Y. Li, Y. Xie, C. Zhao, J. Yu, M. Ni, J. Liu and H. Wang, Int. J. Hydrogen Energy, 2020, 45, 21873–21880 CrossRef CAS.
- Y. Li, Z. Wang, J. Li, X. Zhu, Y. Zhang, X. Huang, Y. Zhou, L. Zhu and Z. Lü, J. Alloys Compd., 2017, 698, 794–799 CrossRef CAS.
- Y. Tao, Y. Zhou, W. Li, J. Shao, L. Bai and X. Liu, J. Alloys Compd., 2018, 741, 1091–1097 CrossRef CAS.
- S. Wang, Y. Wu, Y. Gao, H. Chen, A. M. Abdalla, A. K. Azad, Z. Lü and B. Wei, Int. J. Hydrogen Energy, 2022, 47, 34205–34215 CrossRef CAS.
- S. Wang, Y. Wu, H. Chen, Y. Gao, J. Liu, M. Li, Z. Lü and B. Wei, J. Alloys Compd., 2023, 932, 167685 CrossRef CAS.
- X. Luo, G. Wang, Y. Huang, B. Wang, H. Yuan and H. Chen, J. Phys. Chem. C, 2017, 121, 18534–18543 CrossRef CAS.
- S. P. Jiang, L. Liu, K. P. Ong, P. Wu, J. Li and J. Pu, J. Power Sources, 2008, 176, 82–89 CrossRef CAS.
- Y. Shin, K.-Y. Doh, S. H. Kim, J. H. Lee, H. Bae, S.-J. Song and D. Lee, J. Mater. Chem. A, 2020, 8, 4784–4789 RSC.
- Y. Zhou, Z. Lü, B. Wei, Z. Wang and X. Zhu, Solid State Commun., 2015, 201, 31–35 CrossRef CAS.
- Y. Zhou, Z. Lü, P. Guo, Y. Tian, X. Huang and W. Su, Appl. Surf. Sci., 2012, 258, 2602–2606 CrossRef CAS.
- M. Rezaiguia, W. Benstaali, A. Abbad, S. Bentata and B. Bouhafs, J. Supercond. Novel Magn., 2017, 30, 2581–2590 CrossRef CAS.
- G. Kresse and J. Furthmüller, Phys. Rev. B: Condens. Matter Mater. Phys., 1996, 54, 11169–11186 CrossRef CAS PubMed.
- G. Kresse and D. Joubert, Phys. Rev. B: Condens. Matter Mater. Phys., 1999, 59, 1758–1775 CrossRef CAS.
- G. Kresse and J. Hafner, Phys. Rev. B: Condens. Matter Mater. Phys., 1993, 47, 558–561 CrossRef CAS PubMed.
- M. Ernzerhof and G. E. Scuseria, J. Chem. Phys., 1999, 110, 5029–5036 CrossRef CAS.
- J. A. White and D. M. Bird, Phys. Rev. B: Condens. Matter Mater. Phys., 1994, 50, 4954–4957 CrossRef CAS PubMed.
- I. V. Solovyev, P. H. Dederichs and V. I. Anisimov, Phys. Rev. B: Condens. Matter Mater. Phys., 1994, 50, 0163–1829 CrossRef PubMed.
- Y. W. Suen, Phys. Rev. B: Condens. Matter Mater. Phys., 1994, 50, 0163–1829 Search PubMed.
- H. J. Kulik, M. Cococcioni, D. A. Scherlis and N. Marzari, Phys. Rev. Lett., 2006, 97, 0031–9007 CrossRef PubMed.
- W. Mikenda, J. Mol. Struct., 1986, 147, 1–15 CrossRef CAS.
| This journal is © The Royal Society of Chemistry 2023 |

