 Open Access Article
Effects of porous carbon materials on heat storage performance of CaCl2 hydrate for low-grade thermal energy
Na Gaoab,
Lisheng Deng *a,
Jun Lia,
Tao Zeng
 ac,
Hongyu Huang
 *a,
Noriyuki Kobayashid,
Mitsuhiro Kubotad and
Xiaohu Yangc
aGuangzhou Institute of Energy Conversion, Chinese Academy of Sciences, Guangzhou 510640, China. E-mail: dengls@ms.giec.ac.cn; huanghy@ms.giec.ac.cn
bUniversity of Chinese Academy of Sciences, Beijing 100049, China
cScience and Technology on Thermal Energy and Power Laboratory, Wuhan 2nd Ship Design and Research Institute, Wuhan 430205, China
dDepartment of Chemical Engineering, Nagoya University, Nagoya, Aichi 464-8603, Japan
First published on 6th November 2023
Abstract
Thermochemical energy storage (TES) is a promising technology to overcome supply-demand mismatch in the recycling of low-grade industrial waste heat. A novel sorbent is developed for low-grade TES system by employing an ordered mesoporous carbon, CMK-3, as the matrix of CaCl2 hydrates. Expanded graphite (EG) and activated carbon (AC) as matrixes are also discussed for a comparative study. All the composites show quick kinetic within 120 °C. Salt upload ability and heat storage capacity of the composites follow the order of CMK-3/CaCl2 (2037.2 kJ kg−1, 50.4 wt%) > EG/CaCl2 (1637.6 kJ kg−1, 48.1 wt%) > AC/CaCl2 (1221.8 kJ kg−1, 46.3 wt%). CMK-3/CaCl2 show the best heat storage performance due to the ordered tubular mesostructure, which limits the deliquescence at a proper level and provided good accommodation for salt solution. The inner solution absorption presents positive thermal effect that add to total heat storage capacity, making actual heat sorption of CMK-3/CaCl2 much higher than pure chemical reaction heat. A 25-cycle sorption–desorption experiment shows excellent cycling stability of CMK-3/CaCl2. This study proves CMK-3/CaCl2 to be a promising composite for low-grade TES system below 120 °C, and provides new insights for improving energy density of the heat storage materials.
1. Introduction
With the development of industry and shortage of fossil fuels, many efforts have been made for recycling industrial waste heat. However, the practical utilization has been depressed due to low efficiency and supply-demand mismatch, especially for low-grade waste heat. Thermal energy storage technology is a great solution for such problems as it can collect and store energy in a stable system for that can be drawn upon at a later time. An energy storage cycle generally consists of three main steps: charging, storing and discharging.2 Based on different working principles of energy storing, thermal energy storage systems are classified into three categories: sensible heat storage (SHS), latent heat storage (LHS) and thermochemical energy storage (TES). A SHS system charges or discharges energy through temperature increase or decrease of the storage medium.3,4 A LHS system stores or releases thermal energy in the form of latent heat of phase change materials (PCM), which makes a higher energy density than SHS system.5–9 A TES system is based on a reversible chemical reaction which is endothermic in one direction and exothermic in the opposite direction.10 During the charging step, thermal energy is converted into chemical potential by breaking the binding force between the compounds.11,12 Compared with SHS or LHS technology, TES technology offers some unique characteristics including: high energy densities, ambient storage, long-term storage, transportability, heat pumping, and low capacity costs.13 As far as volume efficiency is concerned, thermochemical heat storage is more favourable with great energy storage density that is approximately 8–10 higher than sensible energy storage, and 2 times higher than latent energy storage.14A number of candidate materials has been developed for TES system, which are classified mainly into two categories: chemical sorption heat storage and chemical reaction heat storage without sorption.15 Hygroscopic calcium chloride is suggested as one of the most promising chemosorbent for the TES system, which shows low charging temperature, higher conversion, high water uptake capacity, fast kinetics, high energy density and low price.16–18 The hydration/dehydration process can be described by following reversible reaction:
| CaCl2·xH2O(s) + heat ↔ CaCl2·(x − y)H2O(s) + yH2O(g) | (1) |
One of the major problem in utilization of pure CaCl2 hydrate is the material's deterioration after cycles, like agglomeration, melting, superficial layers forming, etc.19,20 As a result, the heat storage performance could degrade dramatically after a few cycles since the hydration/dehydration reactions are diffusion-limited.21 To address this issue, researchers usually incorporate the salt into proper host matrixes to make a composite with improved chemical kinetics and better heat & mass transfer performance. The most commonly used matrixes include zeolite molecular sieve,22 silica gel,23 alumina,24 iron silicate,25 vermiculite,26 etc. Some novel matrixes are also proposed such as aerated porous concrete,27 and porous minerals.28
Ordered porous materials have drawn increasing attention as host matrixes in recent years owing to large surface area and pore volume that can enhance the water sorption capacity and load space for salt. Permyakova et al.29 developed the MOFs-CaCl2 composites with a highest energy storage capacity of 1746 kJ kg−1 for 62 wt% of salt with little loss upon cycling (adsorption at 30 °C, desorption at 80 °C), and the result shows a synergetic effect between chemisorption of the salt and physisorption of the matrix. Touloumet et al.30,31 developed hierarchical porous AF/Al as the matrix, which showed better heat storage performance (1930 kJ kg−1 for 61 wt% of salt, adsorption at 25 °C, desorption under a heating procedure of 25–150 °C) than single microporous AF and mesoporous Al. Xu et al.32 optimized the UiO-66/CaCl2 composite and obtain a best heat storage capacity of 1416 kJ kg−1 for around 60 wt% of salt (adsorption at 30 °C, 80% RH). Silvester et al.33 observed a considerable improvement of hydration rate and cycling stability of CaCl2 after its incorporation into an ordered-mesoporous SBA-15, and present a stable heat storage capacity of 1713.5 ± 32.4 kJ kg−1 for 60 wt% of salt (adsorption at 25 °C, desorption under a heating procedure of 25–150 °C).
CMK-3 is a novel carbon-based material that have a highly ordered mesoporous morphology. It is a kind of rod-type carbon replica that is cast from SBA-15, usually prepared by incorporating a proper carbon precursor into the pore system of SBA-15 followed by the removal of the matrix, as is schematically shown in Fig. 1.1,34 The analogue are considered as a great adsorbent due to its high specific area, homogenous pore size. In addition, as a carbon-based material, CMK-3 show better characteristics in chemical inertness, structure stability, electric conductivity and thermal conductivity than pure mesoporous silica.35,36 Up to now, CMK-3 has been widely studied as a promising adsorbent, matrix or catalyst support in the field of hydrogen storage and production,37 lithium-ion batteries,38 super capacitors,39 methane gas storage,40 catalytic cracking,41 fuel desulfurization,42 contaminant removal,43 and etc. There are also a few researches on ordered mesoporous carbon being used as the matrix of organic phase-change materials for latent thermal energy storage.44,45 However, no report has been made on CMK-3 as the matrix of inorganic hydrous salt for thermochemical heat storage.
 | ||
| Fig. 1 Schematic representation of CMK-3 preparation.1 | ||
Therefore, the aim of present study is to investigate the applicability of CMK-3 as the host matrix of calcium chloride, and explore the potential of CMK-3 matrix for improving heat storage performance of CaCl2 hydrates. To get a better understanding of the effects of porous structure on heat storage performance, a comparative analysis was conducted between CMK-3 and another two carbon-based matrixes with different pore morphology: activated carbon (AC) and expanded graphite (EG). A series of composites with different salt-matrix ratio are prepared for studies on structure characterization, hydration and dehydration behaviours, water sorption capacity and heat storage density. Performance of EG/CaCl2 composite as a TES material has been discussed in our previous study.46
2. Experimental section
2.1 Preparation of composites
CMK-3, activated carbon (AC), expanded graphite (EG) and calcium chloride (purity ≥96.0%) used in the study are purchased from Nanjing JCNANO Technology Co., Ltd, Sinopharm Chemical Reagent Co., Ltd, Suzhou Dongneng new material Co., Ltd and Tianjin Zhiyuan Chemical Reagent Co., Ltd respectively.The composite samples were synthesized by wet impregnating method which is conducted by following procedure: (1) CaCl2 and carbon powder were dried in a vacuum oven at 150 °C for 8–10 hours, and then cooled down to ambient temperature; (2) CaCl2 aqueous solutions of multiple concentrations (10%, 20%, 30%, 42%) were prepared by dissolving dried CaCl2 into deionized water; (3) the carbon powder (1 g for each sample) were poured into the solutions (20 ml for each sample) and stirred by magnetic stirrer for four hours at 30 °C under the atmospheric pressure; (4) the mixture was filtered through vacuum filtration method for 3 hours to remove surplus salt solution, and then rinsed with a few deionized water to remove excessive surface salts; (5) the extracted mixture was dried in an vacuum oven at 150 °C for more than 10 hours to get dewatered composites.
For each type of matrix, four composites were synthesized with different salt content that depend on impregnating solution. All together 12 samples are prepared which are named after respective matrixes, namely CMK-3/CaCl2, and AC/CaCl2 and EG/CaCl2. Numbers are used in the names' end for representing the concentration of impregnating solution (−1 for 10%, −2 for 20%, −3 for 30%, −4 for 42%). More information can be found in Table 1.
| Sample | Matrix | Solution concentration | Salt content (wt%) |
|---|---|---|---|
| EG/CaCl2-1 | EG | 10% | 23.8 |
| EG/CaCl2-2 | EG | 20% | 36.2 |
| EG/CaCl2-3 | EG | 30% | 48.1 |
| EG/CaCl2-4 | EG | 42% | 57.8 |
| AC/CaCl2-1 | AC | 10% | 15.5 |
| AC/CaCl2-2 | AC | 20% | 32.0 |
| AC/CaCl2-3 | AC | 30% | 46.3 |
| AC/CaCl2-4 | AC | 42% | 57.0 |
| CMK-3/CaCl2-1 | CMK-3 | 10% | 18.0 |
| CMK-3/CaCl2-2 | CMK-3 | 20% | 37.8 |
| CMK-3/CaCl2-3 | CMK-3 | 30% | 50.4 |
| CMK-3/CaCl2-4 | CMK-3 | 42% | 63.4 |
2.2 Material characterization
Superficial morphologies of the composites were measured by field-emission scanning electron microscopy (SEM, S-4800, Hitachi Ltd). Interior topography was measured by transmission electron microscopy (TEM, JEM-2100F, JEOL). Element mapping was performed for analysing salt loading ability of each matrix using an energy dispersive spectrometer (EDS) along with TEM measurement. Chemical structure and crystallization of the composites and pure materials were analysed by an X-ray diffractometer (XRD, D8 Advance, Bruker). The structural characteristics (specific surface area, total pore volume, pore diameter distribution) of EG were determined using Mercury Intrusion Porosimetry (MIP, Autopore V9600, Micromeritics Instrument Corp.). The morphological properties of CMK-3 are characterized by gas (N2) adsorption apparatus (NOVA-4200e, Quantachrome Instrument Corp). The morphological properties of AC are characterized by gas (N2) adsorption apparatus (ASAP2020 Plus2.0, Micromeritics Instrument Corp.). Surface area was determined by BET equation applied to the absorption branch of the isotherm between the p/ps range of 0.05–0.25. The samples were pre-treated at 200 °C under vacuum for 3 hours before nitrogen sorption/desorption measurements. The micropore volume and micropore surface area are calculated by t-plot method. Average pore width is determined by BJH method (for mesopore) applied to the desorption isotherm and Horvath–Kawazoe method (for micropore).2.3 Sorption/desorption experiments
Water sorption capacity was measured by a precise analytical balance (AX224ZH, OHAUS Corp.) installed in a constant temperature & humidity incubator (Labonce-60CH, Labonce Thermostatic Technology Co., Ltd) which is equipped with a humidity generator system. Samples' weights were automatically recorded by an integral of 10 seconds. Each sample is spread in a glass dish on the balance. The diameter of glasses is 95 mm. Amount of each sample for sorption experiment is 0.6 g. The sorption experiment was proceeded until a stable weight was reached implying a saturation state of the sorption process. The ambient temperature and humidity condition is set constant at 30 °C/60% RH.After the sorption experiments, the desorption behaviour and endothermic effect the hydrated samples were tested by thermogravimetry (TG) and differential scanning calorimetry (DSC) measurement using a simultaneous thermal analyser (TGA/DSC3+, METTLER TOLEDO). Mass of each sample for TGA/DSC test is approximately 10 mg. The heating rate was set at constant 5 K min−1 from 25 °C to 200 °C. The experiment gas flow (nitrogen as inert gas) surrounding the sample was set as 50 ml min−1. Differential thermogravimetry (DTG) curve was extracted from TG curves as the result of 1st order derivative.
3. Results and discussion
Salt content (SC) of composite samples can be calculated by the mass fraction of uploaded salt in the dry composite. The equation is listed as follows:| SC (wt%) = (mcomposite − mmatrix)/mcomposite | (2) |
The results are summarized in Table 1.
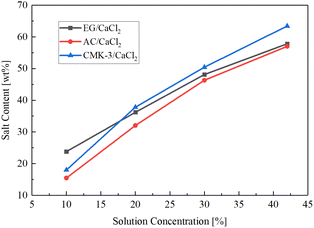
Fig. 2 shows SC values of the composites changing with solution concentration. It's found that salt content follows an approximate linear growth while the concentration of the impregnating solution increases. The salt content values get larger than 45 wt% for all of the matrixes when the solution concentration exceeds 20%. For low-concentration solution (10%), the loading capacity of CMK-3 and AC for CaCl2 than are both smaller than expanded graphite (23.8 wt%). But as solution concentration increases, CMK-3 exhibit a fastest growth trend, and reaches a highest salt content of 63.4 wt% at the solution concentration of 42%.
The salt upload ability of matrixes is mainly determined by porous structure, details of which are discussed in Section 3.1. Sorption and desorption of the samples' performance are present in Section 3.2 and 3.3 separately. Based on these properties, the comparative analysis on heat storage capacity are illustrated in Section 3.4.
3.1 Material characterization
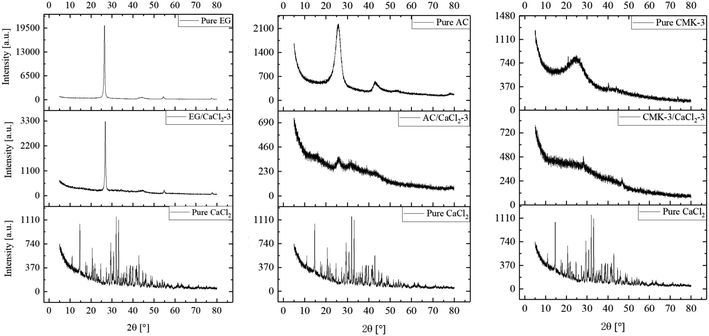
Fig. 3 shows the XRD patterns of EG/CaCl2-3, AC/CaCl2-3 and CMK-3/CaCl2-3, representatively, in comparison with corresponding pure matrixes and the hydrous salt. As carbon materials, the pure matrixes all showed peaks at around 2θ = 26.4°, 44.4° and 54.8°. But the intensity and width of the diffraction peaks differs between the matrixes due to their different structure. On the whole, EG matrix show the highest peak heights and narrowest FWHMs (Full Width at half maximum) due to the laminated structure and big particle size; on the contrary, CMK-3 matrix show the widest FWHMs and lowest peak heights because of the small size and anisotropic distribution of the particles; while AC matrix present an intermediate level. Pure CaCl2 shows much peaks in our observation and some peaks of salt hydrates (CaCl2·nH2O) are found. The reason is that hydration reaction occurs during the experiments since the salt is highly hygroscopic. The XRD pattern of each composite reflected the peak characteristics of the matrix and CaCl2. The peaks' location consistent with pure matrix, indicates that the salt has been successfully incorporated into each matrix without structure damage. The peaks' intensity gets reduced for both matrix and CaCl2 in the composites as their content decreased.32Fig. 4 shows the SEM images of carbon particles and the inner porous structure. Expanded graphite (EG) shows lamellar structure with flat-shaped macropores between graphite layers. EG has the largest pore size among the three matrixes, which is mainly described in axial (100–200 nm) and radial (500–2000 nm) direction. Correspondingly, EG particles are in flat shape with a thickness equals to multiples of pores' axial size, and the particle width depends on the pores' radial size. Activated carbon shows amorphous structure with abundant micropores densely distributed on the particle surface. And the AC particles' size distributes within a larger range of 2–8 µm. CMK-3 exhibits a highly ordered, 1-dimensional mesoporous structure, with a relatively smooth surface and tubular pores inside. The axial length of the CMK-3 is in accordance with pore length (around 2.5 µm), by contrast, the radial dimension is much smaller (500–600 nm) than that in axial direction.
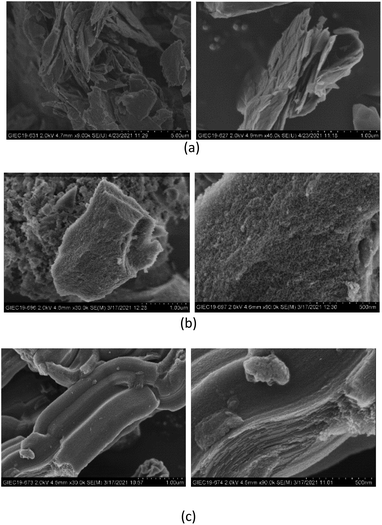 | ||
| Fig. 4 SEM images of (a) expanded graphite, (b) activated carbon and (c) CMK-3 in particle scale and pore scale. | ||
According to scale of the pore size, the structural characteristics of expanded graphite are studied using MIP, while the textural properties of activated carbon and CMK-3 were determined from gas (N2) adsorption analysis. The results are listed in Table 2. EG matrix possesses highest pore volume (4.0 cm3 g−1) and pore diameter (998.8 nm), which is helpful for providing accommodation for salt loading. CMK-3 matrix presents the highest surface area of approximately 990 m2 g−1 and homogeneous pore width around 4.1 nm, which is beneficial for salt dispersion. AC matrix exhibits both micro- and mesoporosity. The micropores may enhance the storage capacity by providing available sorption sites, and the mesopores may enhance vapour diffusivity thus beneficial for mass and heat transfer.30
| Matrixes | Specific surface area (m2 g−1) | Total pore volume (cm3 g−1) | Average pore diameter (nm) |
|---|---|---|---|
| EG | 16.0 | 4.0 | 998.8 |
| AC (meso) | 211.7 | 1.3 | 17.6 |
| AC (micro) | 31.5 | 0.02 | 1.0 |
| CMK-3 | 990.1 | 1.0 | 4.1 |
Fig. 5 and 6 show superficial morphologies (by SEM images) and interior topography (by TEM images) of EG/CaCl2-3, AC/CaCl2-3 and CMK-3/CaCl2-3. For all composites, CaCl2 can be well located in the host matrixes by impregnation method, and no significant morphological change happened in the base structure of the matrixes. As the framework of the salt, the matrixes can keep the salt crystals from serious aggregation, thereby improve mechanical strength of the material.
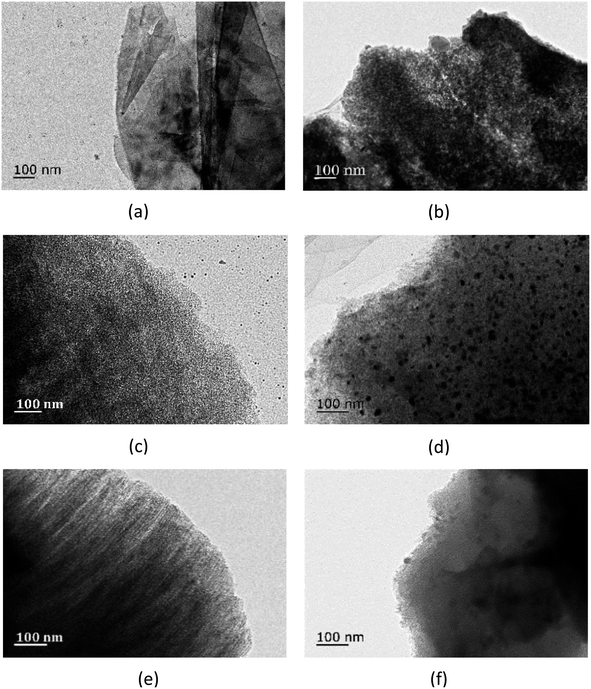 | ||
| Fig. 6 TEM images of composites (a) pure EG, (b) EG/CaCl2-3, (c) pure AC, (d) AC/CaCl2-3, (e) pure CMK-3 and (f) CMK-3/CaCl2-3. | ||
Due to the difference in pore structure, the matrixes exhibit distinct salt loading patterns. With a large pore size, EG matrix supplies enough room for salt bulkily residing inside the interlayers, and there are also some crystal grains formed with big size up to 200 nm. Because of the hierarchical pore structure of AC matrix, two types of CaCl2 grains are formed: (1) the fine grains deposited inside the mesopores, as is seen in Fig. 6d, with an approximate average size of 15 nm; and (2) relatively larger grains adhere to the external micropores, as is seen in Fig. 5b, with an average diameter of 100 nm. CMK-3 can load tiny salt grains on the inner surface of the ordered tubular pores (see Fig. 6f).
Such difference in pore structures and salt patterns made the difference between matrixes in salt loading capacity (Fig. 2). In the case of low solution concentration (10%), EG show the highest salt content due to the larger size of salt grains than AC and CMK-3, while CMK-3 present the least salt loading because of the small mass of the grains. As the solution concentration increases, salt content in CMK-3 present a fastest rise and exceed the value of EG when the concentration of salt solution reaches 20%. The reason lies in the high specific surface area (990.1 m2 g−1, see Table 2) and the channel-like pore structure that provide most deposition location for the salt. Finally, a highest SC value of 63.4 wt% was obtained for CMK-3 matrixes. On the whole, AC matrix show the worst salt loading capacity among the matrixes. The specific surface area is much less than CMK-3 and the pore diameter is much smaller than EG, making the least salt loading into the AC matrix. What's more, most surface-loading salt was lost during rinsing step (Section 2.1, step 4 of the composites preparation), causing a further drop in the salt content. Although the SC curve of AC rise with a rate larger than EG, it finally presents a lowest salt loading capacity under high concentration condition.
Fig. 7 show element mapping images of EG/CaCl2-3, AC/CaCl2-3 and CMK-3/CaCl2-3 by EDS method. The Ca (red) and Cl (green) elements exhibit a uniform exhibition in the matrixes' particle, implying a high uniformity of interior load of salt. There are also a few high-concentration Ca spots locate in wrinkle areas, which represent the larger crystal grains deposited on external surface (CMK-3 and AC) or folding layer (EG). Salt content of the composites can be calculated based on elemental ratios of Ca and C by the following equation:
 | (3) |
 being the element ratio of Ca and C, MCaCl2 and MCa being the mole mass of CaCl2 (110.98 g mol−1) and Ca (40.08 g mol−1), representatively.
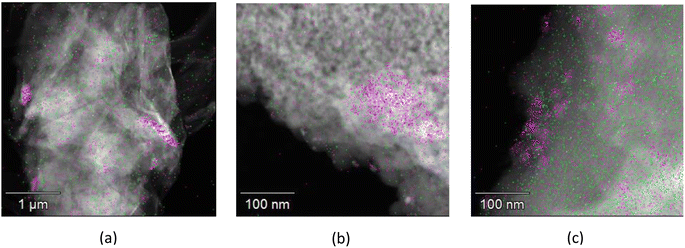 | ||
| Fig. 7 Elemental mapping of Ca (red) and Cl (green): (a) EG/CaCl2-3, (b) AC/CaCl2-3, (c) CMK-3/CaCl2-3. | ||
The results of SCEDS for EG/CaCl2-3, AC/CaCl2-3 and CMK-3/CaCl2-3 are listed in Table 3. The values are in line with salt content by mass with a small deviation below 2.3%.
| Sample | WCa/WC | Salt content (wt%) | |
|---|---|---|---|
| By EDS | By mass | ||
| EG/CaCl2-3 | 0.32 | 47.0 | 48.1 |
| AC/CaCl2-3 | 0.30 | 45.4 | 46.3 |
| CMK-3/CaCl2-3 | 0.36 | 49.9 | 50.4 |
The well salt loading capacity is also confirmed through comparison of pore structural characteristics between composites and corresponding matrixes (Table 4). On the whole, specific surface, total pore volume and pore diameter decreased dramatically for all matrixes because of inner salt deposition. The theoretical maximum salt content of composites can be calculated through the following equation23 in the situation of pore volume are completely occupied by salt:
 | (4) |
| Composites | Specific surface area (m2 g−1) | Total pore volume (cm3 g−1) | Average pore diameter (nm) |
|---|---|---|---|
| EG/CaCl2-3 | 11.5 | 0.6 | 218.7 |
| AC/CaCl2-3 (meso) | 45.7 | 0.3 | 16.8 |
| (Micro) | 6.4 | 0.003 | 1.0 |
| CMK-3/CaCl2-3 (meso) | 30.9 | 0.07 | 3.7 |
| (Micro) | 34.7 | 0.03 | 1.1 |
The theoretical pore volume of the composites is calculated to be 1.83 cm3 g−1 (EG), 0.48 cm3 g−1 (AC) and 0.26 cm3 g−1 (CMK-3), respectively. This is a little larger than the experimentally measured pore volume (0.6 cm3 g−1, 0.3 cm3 g−1, 0.1 cm3 g−1). The difference can be explained by inevitable pore blockage formed during salt loading process. For the blocked pores, the corresponding volume is hard to be detected by N2 adsorption apparatus or MIP method, making the measured pore volume of composites smaller than theoretical value due to some pore blockage. It can be seen that EG composite show the greatest blockage degree due to the bulk deposition pattern of the lamellar macropores. And CMK-3 composite show more blockage than AC composite because the long channel of the tubular pores makes more mass transfer resistance than amorphous pores.
Specific surface areas reduced by 28% (EG), 78% (AC), 93% (CMK-3), representatively. Correspondingly, average pore diameter of EG matrix shrink by 85%, while that of AC didn't change much due to the external salt-load pattern. And for CMK-3, average diameter of the pores decreased obviously because of salt filling, and part of the mesopores are turned into micropores with and average diameter of 1.1 nm. This means that the salt has been well loaded into the pores by wet impregnated method.
3.2 Water sorption capacity
Water sorption capacity of the samples is evaluated by water uptake quantity per unit mass of the sample, calculated by the following equation:| Wsor (g g−1) = (mhydrate − manhydrate)/manhydrate | (5) |
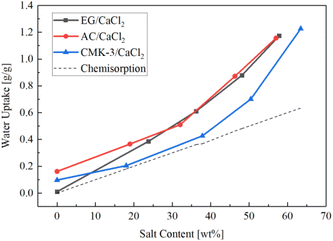
Fig. 8 shows the water sorption capacity changing with salt content under the same temperature and humidity condition of 30 °C/60% RH. Each curves present an exponential growth. The gross water uptake increases rapidly with salt content, meanwhile the rising gradient get larger gradually. In the range of 20 wt%–50 wt%, EG- and AC- composites exhibit similar sorption capacity, and the value is about 20% higher than that of CMK-3-composites. A water uptake of 0.87 g g−1 was achieved for AC/CaCl2-3 (46.3 wt%) and EG/CaCl2-3 (48.1 wt%), while CMK-3/CaCl2-3 shows a lower water uptake capacity (0.7 g g−1) although with a higher salt content (50.4 wt%). As salt content increases, a highest water sorption capacity (1.22 g g−1) was attained in CMK-3/CaCl2-4 with the highest salt content (63.4 wt%).
The distinction of sorption capacity between different composites can be explained by sorption mechanism of CaCl2 and effects of matrixes on it. Water sorption of composites consists of three portion, namely physisorption, chemisorption and solution absorption introduced by deliquescence. So the variation of water sorption capacity can be discussed from these three aspects as follows.
The pure matrixes can be regarded as composites with the salt content of 0 wt%. The water sorption in pure matrixes is propelled by Van Der Waals force between pore surface and water molecules, so called physisorption. As is observed, AC matrix presents hydrophilic characteristics with a physisorption of 0.16 g g−1, and CMK-3 matrix exhibits a relatively weaker hydrophilicity with a physisorption of 0.08 g g−1, while pure EG shows hydrophobicity with almost no water absorption. For composites, the physisorption inclines to be restrained to a lower level as most pore surface is occupied by salt crystals. The more salt loaded in a matrix, the less physisorption contributing to the gross water uptake. That is to say, chemisorption and solution absorption become the dominate water-sorption modes for the composites rather than physisorption.
Under the 30 °C/60% RH condition, CaCl2 was supposed to be converted into hexa-hydrate (CaCl2·6H2O) according to the equilibrium relationship between pressure and temperature.47 According to the reported studies, highly hydrated CaCl2 has a quite low melting point,48 and the melt point would show a further depression when the hydrate is confined to micro- or mesopores.49 Therefore, the CaCl2 hydrates could stay as crystalline solid in EG macropores, but might exist in liquid form inside micro- or mesopores for AC and CMK-3.
The water adsorption during the chemical hydration process, which is called chemisorption, is usually calculated based on the ratio between hydration water and anhydrous salt, regardless of the type of matrix. As is shown in Table 1, CMK-3 exhibits the best salt loading ability, thus the CMK-3/CaCl2 composites seems own the greatest chemisorption ability among tested samples. However, it has been confirmed in reported literature50 that salt in small pores absorbs water vapour worse than in large pores. This means the practical chemisorption in CMK-3 composites are supposed to be suppressed due to the smallest pore size. What's more, the narrow and long tubular pores of CMK-3 result in larger mass transfer resistance for water vapour, causing a further suppression of water absorption.
Since CaCl2 is both hygroscopic and deliquescent, the solid material will absorb moisture from the air until it dissolves, and the solution will continue to absorb moisture until an equilibrium is reached between the vapour pressure of solution and that of the air.51 Pore structure of a matrix might play an important role in determining the rate of solution absorption and the final equilibrium state. Therefore, degree of deliquescence differs significantly according to the type of matrix, causing large difference in the water uptake. As is observed in this study, CMK-3/CaCl2 composites exhibit lowest water uptake under the same SC condition (which means the same chemisorption), from which one can conclude that the highly ordered pore structure of CMK-3 matrix helps to limit excessive solution absorption.
The dotted line in Fig. 8 presents the chemisorption capacity (Wch,sor) when the maximum amount of crystal water (CaCl2·6H2O) is reached during hydration process, as expressed by the following equation:
 | (6) |
It's easy to find that the practical gross water uptake measured in the experiments are much higher than the chemisorption capacity. The experimental data of gross water uptake of EG- and AC- composites is 1.6–2.0 times higher than the pure chemisorption capacity. CMK-3 composite shows a small differential between gross water uptake and chemisorption for the low-SC samples, and the differential increase sharply when the SC value is greater than 57 wt%. This means high degree of deliquescence has occurred during the sorption process. As the salt content rises, the proportion of external-deposited salt grains increases, making the resistance to solution absorption reduced, thus the growth gradient of gross water uptake speeds up.
The result is consistent with the experimental observation on the appearance of hydrated samples. Low-SC composites (SC < 40 wt%) basically made little change in their powder appearance after sorption experiments. For composite with a SC value around 50% (CMK-3/CaCl2-3, EG/CaCl2-3 and AC/CaCl2-3), the powder become moist after hydration due to slight deliquescence, as is seen in Fig. 9. Appearance of CMK/CaCl2-3 powder changed little, while particle agglomeration was observed in AC/CaCl2-3 and EG/CaCl2-3. This means deliquescence of CMK-3/CaCl2-3 is mostly confined to the pores, while a little solution absorption occurred on the surface of AC/CaCl2-3 and EG/CaCl2-3. The degree of such moisture follow the order of AC/CaCl2-3 > EG/CaCl2-3 > CMK-3/CaCl2-3, while no apparent solution leakage was observed for each of them. In comparison, Fig. 10 shows obvious solution leakage in high SC-composites (CMK-3/CaCl2-4, EG/CaCl2-4 and AC/CaCl2-4), which should be avoided in practical application. Therefore, the SC value around 50% seem to be an optimum choice that exhibits excellent performance on sorption ability as well as material stability. The samples with exorbitant salt content (CMK-3/CaCl2-4, EG/CaCl2-4 and AC/CaCl2-4) are excluded in following discussion on dehydration behaviour and heat storage performance.
 | ||
| Fig. 9 Visual observation of high-SC composites after sorption experimental (a) EG/CaCl2-3, (b) AC/CaCl2-3, (c) CMK-3/CaCl2-3. | ||
 | ||
| Fig. 10 Visual observation of high-SC composites after sorption experimental (a) EG/CaCl2-4, (b) AC/CaCl2-4, (c) CMK-3/CaCl2-4. | ||
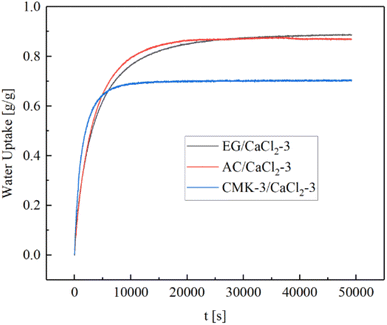
Hydration curves EG/CaCl2-3, AC/CaCl2-3 and CMK-3/CaCl2-3 are shown in Fig. 11. Each curve presents as a logarithmic curve with a rapid rate in the beginning, and approaches to a final value after the tangent point with much lower rates. It could be inferred that deliquescence mainly occurred at the first stage and the solution absorption introduced by deliquescence is limited. CMK-3/CaCl2-3 exhibits faster absorption than AC/CaCl2-3 and EG/CaCl2-3, but approaches toward a lower final value despite it has the highest SC value. This is in accordance with Fig. 8 and implies less deliquesce in EG composites than that in AC- and CMK-3 composites. EG/CaCl2-3 exhibits the slowest absorption rate, and the water uptake keeps rising until long after the tangent of the curve. Finally, EG/CaCl2-3 show a little more water uptake than AC/CaCl2-3, with corresponding to the higher SC value (48.1%) than that of AC/CaCl2-3 (46.3%). The saturation state is achieved at about the 4th hour for CMK-3/CaCl2-3, and at the 6th hour for AC/CaCl2-3.
3.3 TG/DSC analysis
Fig. 12–14 show the normalized weigh (TG) and flow rate (DSC) curves based on the weight of anhydrous sample. The weight losses of samples are in consistent with water uptake amount measured in sorption experiments with tiny differences that raise from the variation of sample dosage. The DTG curves are derived from TG curves through 1st derivate method. The conversion rate was defined as the proportion of an instantaneous value of the weight change to the total weight loss, as expressed in the following expression:| Conversion rate (%) = (W0 − W)/(W0 − WS) | (7) |
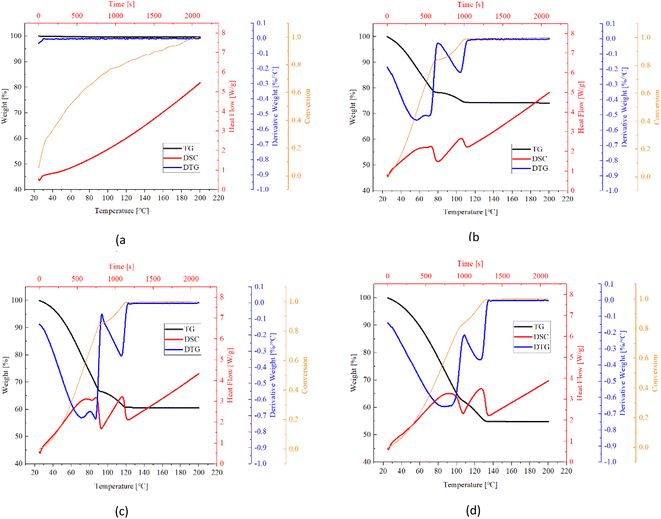 | ||
| Fig. 12 TG (black), DTG (blue), conversion (orange) and DSC (red) curves of EG based composites (a) pure EG, (b) EG/CaCl2-1, (c) EG/CaCl2-2, (d) EG/CaCl2-3. | ||
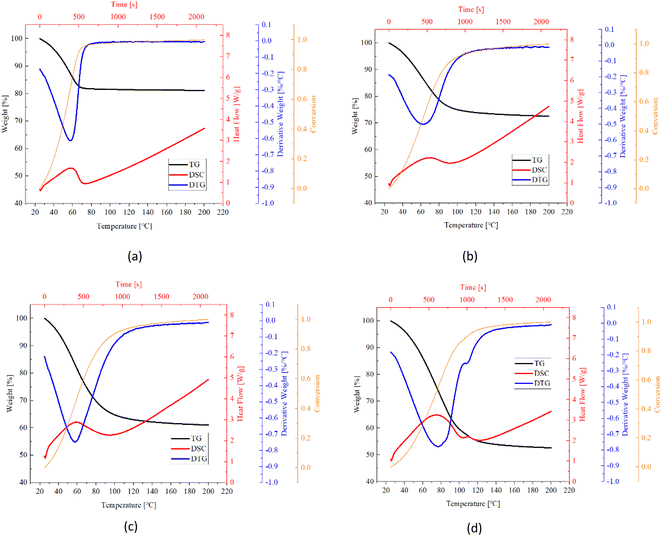 | ||
| Fig. 13 TG (black), DTG (blue), conversion (orange) and DSC (red) curves of AC based composites (a) pure AC, (b) AC/CaCl2-1, (c) AC/CaCl2-2, (d) AC/CaCl2-3. | ||
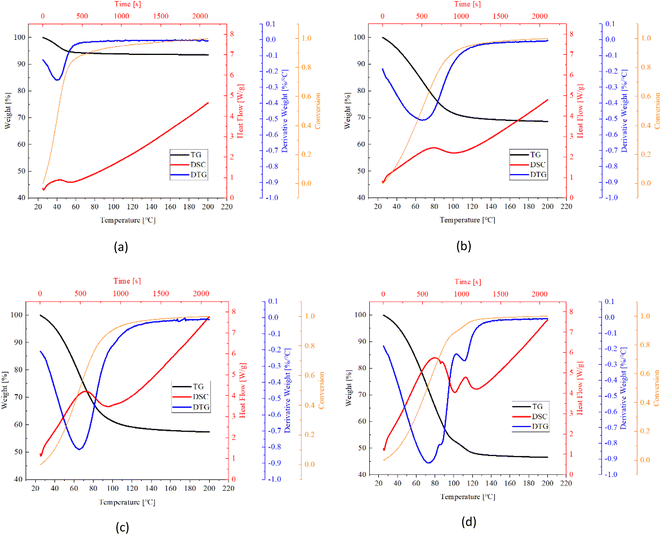 | ||
| Fig. 14 TG (black), DTG (blue), conversion (orange) and DSC (red) curves of CMK-3 composites (a) pure CMK-3, (b) CMK-3/CaCl2-1, (c) CMK-3/CaCl2-2, (d) CMK-3/CaCl2-3. | ||
Table 5 listed key information of the samples' dehydration including weight change, temperature range, peak temperature (first peak location) and dehydration rate (peak value). It's found that CMK-3 composite represents greater weight change than AC- and EG composite, although it absorbed the least water in sorption experiments. This implies the excellent solution supporting capacity of CMK-3 matrix. When a small dose of TG sample (milligram-scale) was taken out from the glass dish containing hydrated samples (gram-scale), the leaked solution from matrixes' pores were left in the glass dish. Therefore, the water content and salt content will both decrease for TG samples of AC- and EG composites.
| Sample | Weight change (%) | Temperature range (°C) | Peak temperature (°C) | Dehydration rate (%/°C) |
|---|---|---|---|---|
| EG | — | — | — | — |
| EG/CaCl2-1 | 25.7 | 25–113 | 57.4 | −0.5 |
| EG/CaCl2-2 | 39.3 | 25–123 | 71.8 | −0.7 |
| EG/CaCl2-3 | 45.1 | 25–136 | 87.1 | −0.7 |
| AC | 18.3 | 25–76.7 | 57.4 | −0.6 |
| AC/CaCl2-1 | 26.2 | 25–125 | 61.9 | −0.5 |
| AC/CaCl2-2 | 37.4 | 25–129 | 57.2 | −0.7 |
| AC/CaCl2-3 | 45.9 | 25–135 | 76.9 | −0.8 |
| CMK-3 | 5.7 | 25–65.3 | 40.4 | −0.3 |
| CMK-3/CaCl2-1 | 30.0 | 25–120 | 66.4 | −0.5 |
| CMK-3/CaCl2-2 | 41.1 | 25–125 | 65.8 | −0.8 |
| CMK-3/CaCl2-3 | 52.4 | 25–130 | 72.8 | −0.9 |
Fast desorption was observed for all the samples. The dehydration started immediately from the very moment when the heating procedure begins (25 °C). All the samples were turned into completely anhydrous materials within 22 minutes (corresponding to the temperature range of 25 °C–135 °C), and reached a conversion of 0.85 within 110 °C (17 min). As salt content increases, the balance of reversible dehydration/hydration go towards dehydration direction, thus the dehydration rate get higher. As a result, while dehydration duration goes longer by just a small extend even though the water amount in the samples increases a lot. Take the CMK-3/CaCl2 composite as an example, when the total weight loss increased from 30% (CMK-3/CaCl2-1) to 52.4% (CMK-3/CaCl2-3), the endset temperature increased from 120 °C to 130 °C, corresponding to an expansion of dehydration duration by only 2 minutes.
The dehydration rate of samples follows the order of CMK-3 > AC > EG, which is in line with the absorption rate order. This might be explained by the different salt loading patterns in the matrix. CMK-3 and AC matrix load the CaCl2 salt in the form of crystal grains, which can guarantee good heat and mass transfer performance during the endothermic desorption process. But in EG matrix it presents a bulky pattern, so that diffusion channel might be blocked up, causing some decrease in adsorption rate.
Pure matrixes exhibit single peaks on DTG and DSC curves, as is shown in Fig. 12a, 13a and 14a. These single peaks represent dewatering of the physically adsorbed water. Absorbability of pure matrixes follows the order of AC > CMK-3 > EG, and the relevant heat absorption was calculated to be 307.0 kJ kg−1 (AC), 75.2 kJ kg−1 (CMK-3) and 26.3 kJ kg−1 (EG), respectively. Thermal effects of pure EG and CMK-3 are quite slight by comparison with the composites.
In the case of composites, DTG and DSC curves present several overlapped peaks, which represent some kind of multi-step processes. The detailed study about the multi-step desorption behaviour and sub-peak analysis have been reported in our previous study on EG/CaCl2 composites, and the similar characteristics are found in AC/CaCl2 and CMK-3/CaCl2 in this study. The desorption process follows the order of solution desorption → chemical desorption (CaCl2·6H2O → CaCl2·4H2O → CaCl2·2H2O → CaCl2·H2O → CaCl2). What's more, the solution absorption plays nearly the equitant important role as chemical sorption, both in water adsorption ability and thermal storage capacity. As CaCl2·6H2O also works as a phase change material with a low melting temperature (28.1 °C) and high melting enthalpy (176.9 kJ kg−1),9 the latent heat accounts for a certain proportion of the gross heat sorption during dehydration process. For CMK-3 and EG composites, the values of latent heat even exceed physisorption-related heat.
In conclusion, the heat storage capacity of the composites consists of four major parts: condensation heat of solution, latent heat of hexahydrate, physical desorption heat of matrix, and reaction heat of chemisorption. The procedures may occur simultaneously with each other, especially for the first three parts. Therefore, the sub-peaks are highly overlapped, as is seen in Fig. 12–14. The degree of overlapping is relative to the sub-peaks’ location, width and relevant heat flow. For example, AC matrix present the better physisorption capacity than EG and CMK-3, so the relevant sub-peak for AC-based composites have the wider temperature range and highest heat flow rate, making it more likely to be overlapped with the adjacent peaks. Consequently, DSC curves of AC/CaCl2 composites present only one integrated peak which is actually accumulated from several sub-peaks, as is seen in Fig. 13. Comparing the TG curves between different matrixes, one can found that there are obvious turning points in the TG lines of EG-composites and CMK-composites with high salt content, while the other samples show relatively smoother TG lines. The sudden change in the slope of TG curve indicates the beginning of a relatively isolated sub-peak, making it easy to identify the sub-process out of the whole curve (Fig. 12b–d).
3.4 Heat storage capacity
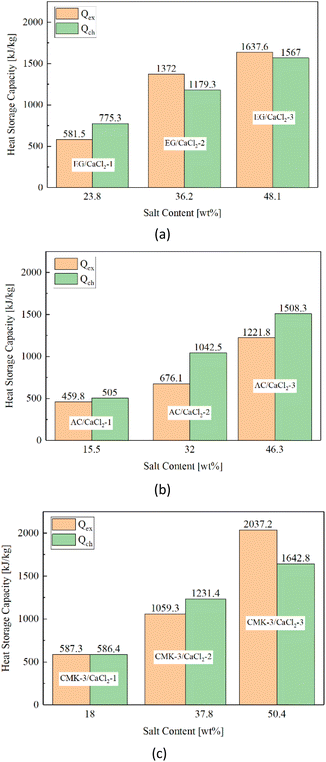
In order to compare the heat storage capacity among composites based on different matrixes with different SC values, two concepts are introduced here for thermal analysis. One is the “total heat storage capacity” (Qex) determined experimentally by DSC method, which represent total heat absorption during the dehydration process. As is discussed in Section 3.3, total heat storage capacity consists of chemical reaction heat and physical thermal absorption that correlates to matrix desorption and solution desorption. For composites, the matrix desorption is not considered here since the physical adsorption of matrix is basically suppressed by inner salt, while solution absorption/desorption takes an nonnegligible part as chemical adsorption/desorption. In order to analyse the impact of solution absorption on total heat storage capacity, another concept named “chemical heat storage capacity” (Qch) is introduced in this study, which is defined as the reaction heat needed for pure CaCl2·6H2O being completely converted into anhydrous CaCl2, taking no account of any physical absorption.The concept of “chemical heat storage capacity” represents the highest quantity of chemical heat sorption in the situation assuming that all of the salt can be converted into CaCl2·6H2O after hydration process. Therefore, it is a theoretical concept rather than the practical value of chemical-part heat sorption. According to the of formation enthalpy, the heat sorption is 361.6 kJ mol−1 for the complete dehydration of CaCl2·6H2O.51 The value of chemical heat storage capacity can be easily derived through the following equation:
 | (8) |
As is shown in the equation, there's a linear relationship between chemical heat storage capacity and salt content value. Since CMK-3 matrix has a better salt loading performance than EG and AC, the CMK-3/CaCl2 composite is supposed to present the highest chemical heat storage potential. The chemical heat sorption of CMK-3/CaCl2-3 is calculated to be 1642.8 kJ kg−1, and the value of EG/CaCl2-3 and AC/CaCl2-3 composites are slightly lower at 1567 kJ kg−1 and 1508.3 kJ kg−1, respectively.
Fig. 15 shows the total heat storage capacity (Qex) of composites compared with corresponding chemical heat storage capacity (Qch). When the solution desorption is considered in practical heat storage process, the heat storage capacity of CMK-3/CaCl2-3 is lifted to 2037.2 kJ kg−1, and for EG/CaCl2-3 the value is lifted to 1637.6 kJ kg−1 with a smaller increase, while the value decreased for AC/CaCl2-3 (1221.8 kJ kg−1). This might relate with the supporting ability for solution of the matrixes, which follows the order of CMK-3 > EG > AC.
Although water sorption experiments in Section 3.2 have shown a higher water uptake in the EG- and AC-composites (Fig. 8), it imply a higher probability of solution exudation and greater salt loss either. Since there's a considerable portion of salt particles loaded onto surface pores of AC matrix, salt solution introduced by surface deliquescence is much more than that inside pores, making salt leakage easier to occur for AC composites. The salt leakage causes a substantial decline in the chemical heat sorption so that the total heat sorption dropped sharply. EG matrix present a large pore room and relatively good supporting ability for solution, but the lamellar structure and bulkily salt load pattern make a smaller surface tension for keeping the inner solution from leakage, especially in comparison with CMK-3. When highly ordered CMK-3 was used as the host matrix, the inner solution can be accommodated in the long and narrow tubular pores. Consequently, the heat required for solution desorption makes a further improvement in the heat storage capacity.
In a word, the practical heat storage capacity of composites exceeds pure chemical heat sorption when the positive effect of solution desorption surpasses the negative effect of salt leakage, and vice versa. For the composites with a moderate salt content (32–38 wt%), a different situation is observed. The heat storage capacity follows an order of EG/CaCl2 > CMK-3/CaCl2 > AC/CaCl2. The reason is related closely to the total pore volume of the matrixes. In this case, solution exudation from EG/CaCl2 composite is much reduced as gross water uptake decreases. This means the positive effect of solution desorption play a demonstrate role in the total heat storage capacity. EG matrix provide a larger total pore volume than CMK-3 for accommodation of inner solution, hence the sample EG/CaCl2-2 present a higher heat storage capacity than CMK-3/CaCl2-2, as is seen in Fig. 15a and c. AC/CaCl2-2 exhibits the lowest heat storage capacity (Fig. 15b) despite a high water uptake similar with EG/CaCl2-2. The reason is similar to the situation of AC/CaCl2-3 that external salt load pattern of AC matrix causes a large proportion of external deliquescence, making it the worst solution supporter among the matrixes.
3.5 Cycling stability
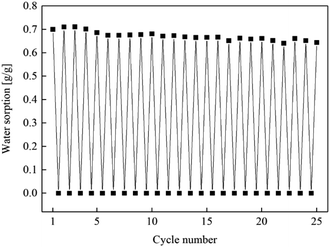
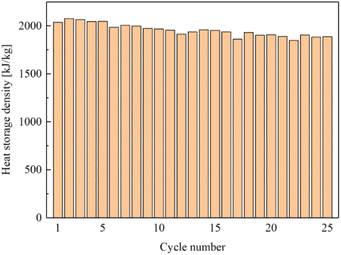
A 25-time cycling experiment are carried out to investigate the stability of the porous carbon/CaCl2 composites. CMK-3/CaCl2-3 is selected as the sample material since it present the best heat storage performance in this study. And the 25 cycles of sorption–desorption are conducted by alternating water sorption measurements and TG tests.Fig. 16 and 17 show water sorption ability and heat storage capacity of CMK-3/CaCl2-3 changing with cycle numner, representatively. When the cycle number increases, water sorption ability and heat storage capacity both decline slowly with slight fluctuations. The fluctuation may result from experimental error or inhomogeneity of the material. After 25 consecutive cycles, water sorption ability shows only a 6.8% decline (0.7 g g−1 to 0.63 g g−1), and heat storage capacity show a 7.2% decline (2037.2 kJ kg−1 to 1889.6 kJ kg−1) correspondingly. This results indicate that CMK-3/CaCl2-3 is a promissing composite for heat storage system with excellent performance and cycling stability.
4. Conclusions
A novel CMK-3/CaCl2 composite was developed as heat storage material used in the low-grade thermal energy. Effect of CMK-3 matrix on heat storage performance of the salt hydrate was investigated in comparison with expanded graphite (EG) and activated carbon (AC). Different pore structure of the matrixes leads to quite distinct salt-load patterns, and consequently result in great difference in capacity of salt load, water sorption and heat storage. CMK-3 shows the highest salt load capacity among the matrixes due to high specific surface area (990.1 m2 g−1). CMK-3/CaCl2 represents the least salt leakage potential and highest heat storage density (2037.2 kJ kg−1, 0.7 g g−1) by comparison with AC/CaCl2 (1221.8 kJ kg−1, 0.87 g g−1) and EG/CaCl2 (1637.6 kJ kg−1, 0.87 g g−1). The tubular porous structure provides good accommodation for inner solution absorption, which contributes to an important part of total heat storage capacity. CMK-3/CaCl2 composite also show excellent cycling stability. After 25 consecutive cycles, water sorption ability and heat storage capacity decreased by only 6.8% and 7.2%.The results show that CMK-3/CaCl2 composite is a promising material for low-grade energy storage systems below 120 °C, such as waste heat from regenerative thermal oxidizer in coal liquefaction process. Further research of this novel matrix is needed on physical and chemical properties, thermodynamics and kinetic characters, mechanical behavior and efficiency analysis for practical utilization.
Conflicts of interest
There are no conflicts to declare.Acknowledgements
The authors appreciate the support from the National Key Research and Development Program of China (2021YFB1507303), National Natural Science Foundation of China (no. 52176091, 52006158) and Open Fund of Science and Technology on Thermal Energy and Power Laboratory (no. TPL2020A02).References
- R. Janus, P. Natkański, M. Wądrzyk, M. Lewandowski, M. Michalik and P. Kuśtrowski, Carbon, 2022, 195, 292–307 CrossRef.
- A. Gil, M. Medrano, I. Martorell, A. Lázaro, P. Dolado, B. Zalba and L. F. Cabeza, Renewable Sustainable Energy Rev., 2010, 14, 31–55 CrossRef CAS.
- K. J. Khatod, V. P. Katekar and S. S. Deshmukh, J. Energy Storage, 2022, 50, 104622 CrossRef.
- A. Gautam and R. P. Saini, Sol. Energy, 2020, 207, 937–956 CrossRef.
- J. Li, X. Hu, C. Zhang, W. Luo and X. Jiang, Renewable Energy, 2021, 178, 118–127 CrossRef CAS.
- W. Luo, M. Zou, L. Luo, W. Chen, X. Hu, Y. Ma, Q. Li and X. Jiang, ACS Appl. Mater. Interfaces, 2022, 14, 55098–55108 CrossRef CAS PubMed.
- L. Luo, W. Luo, W. Chen, X. Hu, Y. Ma, S. Xiao, Q. Li and X. Jiang, Sol. Energy, 2023, 255, 146–156 CrossRef CAS.
- Y. Ma, M. Zou, W. Chen, W. Luo, X. Hu, S. Xiao, L. Luo, X. Jiang and Q. Li, Appl. Energy, 2023, 349, 121658 CrossRef CAS.
- Y. Jing, K. Dixit, S. N. Schiffres and H. Liu, Energy Fuels, 2023, 37, 12381–12390 CrossRef CAS.
- E. W. Schmidt and P. A. Lowe, 1976.
- H. Jarimi, D. Aydin, Z. Yanan, G. Ozankaya, X. Chen and S. Riffat, Int. J. Low-Carbon Technol., 2019, 14, 44–69 CrossRef CAS.
- T. R. S. Gbenou, A. Fopah-Lele and K. Wang, Entropy, 2021, 23, 953 CrossRef CAS PubMed.
- T. T. Bramlette, Thermochemical energy storage and transport program. Progress report, October 1977-December 1978, United States, 1979 Search PubMed.
- D. Aydin, S. P. Casey and S. Riffat, Renewable Sustainable Energy Rev., 2015, 41, 356–367 CrossRef CAS.
- T. Yan, R. Z. Wang, T. X. Li, L. W. Wang and I. T. Fred, Renewable Sustainable Energy Rev., 2015, 43, 13–31 CrossRef CAS.
- W. Li, J. J. Klemeš, Q. Wang and M. Zeng, Renewable Sustainable Energy Rev., 2022, 154, 111846 CrossRef CAS.
- K. E. N'Tsoukpoe, H. U. Rammelberg, A. F. Lele, K. Korhammer, B. A. Watts, T. Schmidt and W. K. L. Ruck, Appl. Therm. Eng., 2015, 75, 513–531 CrossRef.
- H. U. Rammelberg, T. Schmidt and W. Ruck, Energy Procedia, 2012, 30, 362–369 CrossRef CAS.
- B. Michel, N. Dufour, C. Börtlein, C. Zoude, E. Prud'homme, L. Gremillard and M. Clausse, Appl. Therm. Eng., 2023, 227, 120400 CrossRef CAS.
- K. Heijmans, S. Nab, B. Klein Holkenborg, A. D. Pathak, S. Gaastra-Nedea and D. Smeulders, Comput. Mater. Sci., 2021, 197, 110595 CrossRef CAS.
- M. Gaeini, A. L. Rouws, J. W. O. Salari, H. A. Zondag and C. C. M. Rindt, Appl. Energy, 2018, 212, 1165–1177 CrossRef CAS.
- Z. Xueling, W. Feifei, Z. Qi, L. Xudong, W. Yanling, Z. Yeqiang, C. Chuanxiao and J. Tingxiang, Sol. Energy Mater. Sol. Cells, 2021, 230, 111246 CrossRef.
- E. Courbon, P. D'Ans, A. Permyakova, O. Skrylnyk, N. Steunou, M. Degrez and M. Frère, Sol. Energy, 2017, 157, 532–541 CrossRef CAS.
- A. Jabbari-Hichri, S. Bennici and A. Auroux, Sol. Energy Mater. Sol. Cells, 2017, 172, 177–185 CrossRef CAS.
- A. Ristić, D. Maučec, S. K. Henninger and V. Kaučič, Microporous Mesoporous Mater., 2012, 164, 266–272 CrossRef.
- R. J. Sutton, E. Jewell, J. Elvins, J. R. Searle and P. Jones, Energy Build., 2018, 162, 109–120 CrossRef.
- M. Karim Nejhad and D. Aydin, Energy Sources, Part A, 2021, 43, 3011–3031 CrossRef CAS.
- S. Wei, W. Zhou, R. Han, J. Gao, G. Zhao, Y. Qin and C. Wang, Sol. Energy Mater. Sol. Cells, 2022, 243, 111769 CrossRef CAS.
- A. Permyakova, S. Wang, E. Courbon, F. Nouar, N. Heymans, P. D'Ans, N. Barrier, P. Billemont, G. De Weireld, N. Steunou, M. Frère and C. Serre, J. Mater. Chem. A, 2017, 5, 12889–12898 RSC.
- Q. Touloumet, G. Postole, L. Silvester, L. Bois and A. Auroux, J. Energy Storage, 2022, 50, 104702 CrossRef.
- Q. Touloumet, L. Silvester, L. Bois, G. Postole and A. Auroux, Sol. Energy Mater. Sol. Cells, 2021, 231, 111332 CrossRef CAS.
- W. Xu, Y. Wang, H. Xing, J. Peng and Y. Luo, Microporous Mesoporous Mater., 2023, 355, 112574 CrossRef CAS.
- L. Silvester, Q. Touloumet, A. Kamaruddin, F. Chassagneux, G. Postole, A. Auroux and L. Bois, ACS Appl. Energy Mater., 2021, 4, 5944–5956 CrossRef CAS.
- R. Huang, X. Li, Y. Wu, Z. Huang, H. Ye, Y. Niu, L. Li and J. Wang, Chemosphere, 2022, 294, 133761 CrossRef CAS PubMed.
- H. Huwe and M. Fröba, Carbon, 2007, 45, 304–314 CrossRef CAS.
- M. Inagaki, H. Itoi and F. Kang, in Porous Carbons, ed. M. Inagaki, H. Itoi and F. Kang, Elsevier, 2022, pp. 239–540 Search PubMed.
- X. Niu, X. Wang, K. Guan, Q. Wei and H. Liu, Chem. Phys. Lett., 2021, 778, 138762 CrossRef CAS.
- D. Ni, W. Sun, L. Xie, Q. Fan, Z. Wang and K. Sun, J. Power Sources, 2018, 374, 166–174 CrossRef CAS.
- A.-Y. Lo, Y. Jheng, T.-C. Huang and C.-M. Tseng, Appl. Energy, 2015, 153, 15–21 CrossRef CAS.
- H. Zhou, S. Zhu, I. Honma and K. Seki, Chem. Phys. Lett., 2004, 396, 252–255 CrossRef CAS.
- P. Michorczyk, P. Kuśtrowski, P. Niebrzydowska and A. Wach, Appl. Catal., A, 2012, 445–446, 321–328 CrossRef CAS.
- A. Banitalebi-Dehkordi, E. Shams and N. Farzin Nejad, Environ. Nanotechnol., Monit. Manage., 2018, 10, 179–188 Search PubMed.
- J. Zhang, N. Zhang, F. M. G. Tack, S. Sato, D. S. Alessi, P. Oleszczuk, H. Wang, X. Wang and S. Wang, J. Hazard. Mater., 2021, 418, 126266 CrossRef CAS PubMed.
- D. Feng, P. Li, Y. Feng, Y. Yan and X. Zhang, Microporous Mesoporous Mater., 2021, 310, 110631 CrossRef CAS.
- T. Kadoono and M. Ogura, Phys. Chem. Chem. Phys., 2014, 16, 5495–5498 RSC.
- N. Gao, L. Deng, J. Li, H. Huang, B. Zhou and Y. Zhou, Energy Rep., 2022, 8, 12117–12125 CrossRef.
- K. Fujioka and H. Suzuki, Appl. Therm. Eng., 2013, 50, 1627–1632 CrossRef CAS.
- K. E. N'Tsoukpoe, T. Schmidt, H. U. Rammelberg, B. A. Watts and W. K. L. Ruck, Appl. Energy, 2014, 124, 1–16 CrossRef.
- Y. I. Aristov, G. Di Marco, M. M. Tokarev and V. N. Parmon, React. Kinet. Catal. Lett., 1997, 61, 147–154 CrossRef CAS.
- Y. I. Aristov, M. M. Tokarev, G. Restuccia and G. Cacciola, React. Kinet. Catal. Lett., 1996, 59, 335–342 CrossRef CAS.
- T. D. C. Company, Calcium Chloride Handbook, United States, 2003 Search PubMed.
| This journal is © The Royal Society of Chemistry 2023 |

