DOI:
10.1039/D3RA04681H
(Paper)
RSC Adv., 2023,
13, 27663-27671
An irreversible paper-based profluorescent nitroxide probe for the selective detection of ascorbic acid†
Received
12th July 2023
, Accepted 4th September 2023
First published on 18th September 2023
Abstract
Ascorbic acid (AA) or vitamin C plays multiple crucial roles, particularly as an antioxidant. This essentially biologically active molecule was selectively detected over other reductants by the synthesized profluorescent nitroxide probe ProN6 via a switch-on method. After either a hydrogen atom or single electron transfer from AA to nitroxide, the resulting diamagnetic hydroxylamine was rapidly cyclized to form a fluorescent O-acylalkoxyamine. This cyclization prevented the reoxidation of the corresponding hydroxylamine to the nitroxide, leading to a high precision of detection. A kinetic fluorescence study indicated that ProN6 exhibited higher reactivity than ProN7. Density functional theory (DFT) calculations indicated that the Gibbs free energy of the AA-induced cascade reductive lactonization of ProN6 was lower than that of ProN5 and ProN7. The designed probe achieved the sensitive and specific detection of AA with detection limits of 77.9 nM and 195.9 μM in solution and on paper, respectively. The utilization of the probe as a paper-based fluorescent sensor demonstrated the good accuracy of the quantitative analysis of AA in commercial supplements.
Introduction
Ascorbic acid (AA), also known as vitamin C, plays numerous roles in living organisms, especially in the human body, such as tissue repair, collagen metabolism, and the enzymatic production of certain neurotransmitters and antioxidants.1 Moreover, Alzheimer's disease, the common cold, and scurvy can be prevented by normal levels of AA in serum.2–4 Plasma AA concentration acts as a biomarker of antioxidant status, oxidative stress, inflammation, and the risk for coronary heart disease.5 Although high doses (>1 mg mL−1) of AA can inhibit tumor cell growth, it could also cause anti-angiogenic activity in normal cells (human umbilical arterial endothelial cells).6 The small nutrient molecule AA cannot be produced by biosynthesis in human cells and consequently, external AA from the diet is required at a suitable dosage for a healthy life.3 A diet rich in fruits and vegetables with high AA content has beneficial effects and lowers the risk of health problems, such as coronary heart disease.6 However, AA in food, beverages and supplements gradually decomposes based on various factors, including oxygen, pH values, temperature and light.7 The degradation of AA leads to furfural, 2-furoic acid, 5-hydroxymaltol and 3-hydroxy-2-pyrrone,8,9 which could react with food ingredients and reduce product quality. Hence, the accurate quantification of AA is highly important in analytical and diagnostic applications. Several publications related to the determination of AA have been declared. Expensive and environmentally harmful heavy metals are used as electrodes for most electrochemical biosensors.10–12 Spectrophotometric methods are used for AA analysis, such as UV spectrophotometry,13 which not only provides low sensitivity and difficulty in result interpretation but also lacks selectivity. Remarkably, profluorescent nitroxide sensors have been widely used as potent tools for the straightforward detection of a variety of antioxidants including AA on the nM to mM scale.14–16 Interestingly, the electron spin exchange between excited electrons of fluorophores and unpaired electrons of nitroxide considerably affects fluorescence quenching.17 The switch-on detection arises from the inhibition of this event by the conversion of the paramagnetic nitroxide into the diamagnetic hydroxylamine or alkoxyamine. The detection of AA by profluorescent nitroxides has been documented as involving hydrogen atom transfer (HAT) or single electron transfer (SET), followed by protonation.18–20 However, hydroxylamine 2 can be comfortably reoxidized to 1, resulting in the inaccurate quantification of detection as depicted in Scheme 1. The transformation of hydroxylamine 2 to O-acylalkoxyamine 3 could prevent reoxidation and provide better precision. In recent years, colorimetric paper strips or paper-based sensors have been extensively investigated as devices to quantify various analytes, such as heavy metals,21 carcinogenic organic compounds present in food products,22 carcinoembryonic antigens (a tumor marker),23 dopamine,24 cysteine25 and other biologically relevant analytes26 since they are easily handled. However, to the best of our knowledge, the quantitative analysis of AA on a paper-based sensor using profluorescent nitroxide probes has not been explored.
 |
| | Scheme 1 Our idea of the improvement of AA detection by profluorescent nitroxide. | |
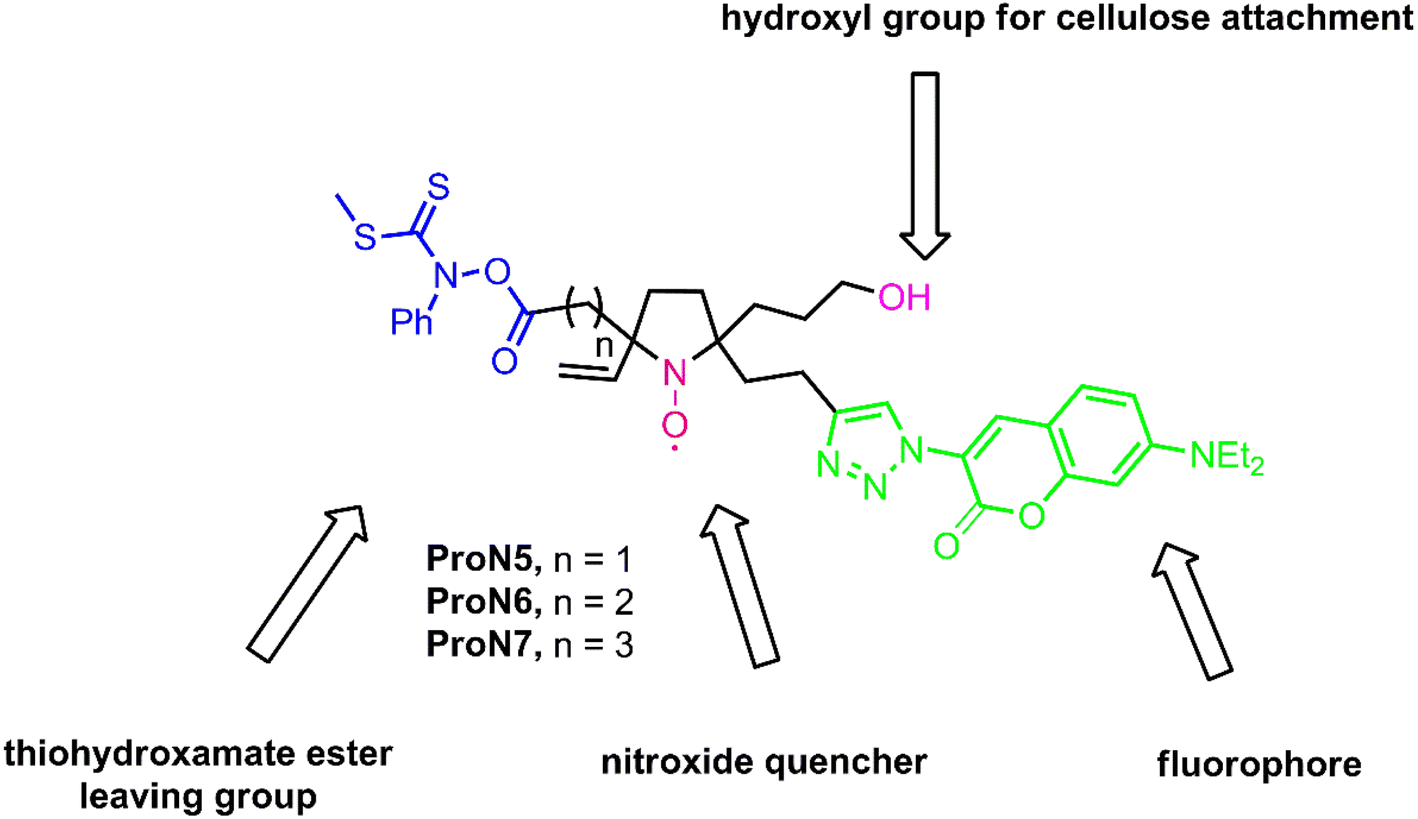
Herein, the efficient detection of AA was performed by intramolecular esterification (lactonization) to convert hydroxylamine 2 to O-acylalkoxyamine 3, hence the reoxidation of hydroxylamine 2 to profluorescent nitroxide 1 was inhibited. For the structural design of the probe, we hypothesized that the 6- and 7-membered O-acylalkoxyamines should be more easily formed than the 5-membered one due to the larger rings, and the possible generation of O-acylalkoxyamines by the 5-, 6- and 7-membered analogs from profluorescent nitroxides was also predicted by density functional theory (DFT). For the utilization of the probe as a cellulose-based fluorescent sensor, hydrogen bonding interactions between the probe and cellulose are required. Consequently, a hydroxyl group should be present in the sensor. Moreover, a good leaving group (LG) is crucial for C–O bond formation in order to avoid reoxidation after the reduction of the nitroxide. Since the 13C NMR data of the carbonyl group of the thiohydroxamate ester is around 197 ppm, and the reaction progress can be easily monitored by TLC, it was selected as a LG. For these reasons and all literature precedents, the profluorescent nitroxide for AA detection was designed with four primarily essential segments, including a hydroxyl group, a fluorophore, a nitroxide quencher, as well as a rather stable and excellent leaving thiohydroxamate ester group as presented in Fig. 1.
 |
| | Fig. 1 Structure of the designed profluorescent nitroxide probes. | |
Experimental section
Chemicals and instruments
Chemical reagents were purchased from Tokyo Chemical Industry Co., Ltd. (TCI). Analytical grade solvents for synthesis and analysis were used as received from the suppliers. The fluorescence spectra were obtained via a fluorometer (LS55, PerkinElmer, United Kingdom). Evaluation of the UV-vis absorption spectra was performed using a Genesys 150 UV-visible spectrophotometer (Thermo Fisher, USA). The EPR spectra were collected using an EPR Bruker system, ELEXSYS E-500 model at X-band microwave frequencies (approximately 9.85 GHz).
Synthesis
Synthetic routes, materials and methods for synthesis, as well as characterization of intermediates and probes, can be found in the ESI.†
Kinetic study of AA detection
Rates of AA detection by profluorescent nitroxides (ProN6 and ProN7) were studied over 7000 seconds and fluorescence intensity was collected continuously at 490 nm. The concentrations of both profluorescent nitroxides and AA were identical, at 10 μM (1![[thin space (1/6-em)]](https://www.rsc.org/images/entities/char_2009.gif) :1 mole ratio). Rate constants were calculated from t = 0 s to 3000 s using the equation
:1 mole ratio). Rate constants were calculated from t = 0 s to 3000 s using the equation 
Preparation of the paper-based fluorescent sensor
The paper-based device was prepared following Phonchai's procedure (Scheme 2).27 Briefly, a mixture of hydrophobic epoxy resin and gray epoxy resin were placed on the designed screen in a circle with 1.5 cm inner diameter. The resin was dragged through a ring-shaped mesh and cured at room temperature for 4 h to provide the corresponding device. A solution of ProN6 (2500 μM in ethanol, 20 μL) was applied on the device. The resulting paper-based fluorescent sensor was lyophilized at room temperature for 2 min.
 |
| | Scheme 2 Preparation of the cellulose-based profluorescent nitroxide sensor. | |
AA measurement by fluorescence emission
To solutions of 4 μM (100 μL) ProN6 in ethanol were added different concentrations of AA solution in ethanol, varied from 0 to 16 μM (100 μL) to final concentrations of 0 to 8 μM. The solution was incubated for 1 h. The emission spectra at 490 nm were recorded with an excitation wavelength of 300 nm using excitation/emission slit widths of 10 nm. The range of the linear relationship between the concentration of AA (μM) and fluorescence intensity at 490 nm was selected to obtain a calibration curve. The LOD was calculated using the following formula: LOD = 3Sy/S, where Sy is the standard deviation of the y-intercept of the linear relationship between the fluorescence intensity at 490 nm and the amount of AA, S is the slope of the fitting curve. The selectivity of ProN6 was also accomplished using the abovementioned procedure by mixing a variety of natural reducing agents, including quercetin, gallic acid, vanillin, eugenol, caffeic acid, DL-α-tocopherol, phloroglucinol, 2,6-di-tert-butyl-p-cresol, 3-tert-butyl-4-hydroxyanisole and ferrous chloride in ethanol (8 μM, 100 μL). Experiments were performed in triplicate.
The paper-based sensor was used for the quantitative determination of three samples of a commercial vitamin C powder supplement. A solution of ProN6 (2500 μM in ethanol, 20 μL) was carefully and slowly applied to the devices to obtain a homogeneous spread of the probe for constant results. A series of 20 μL-AA with concentrations from 0 to 10000 μM were applied to the devices. After 45 min, digital images were captured with the built-in camera of the smartphone and an in-house light control box, under a handheld UV-light torch (360 nm). The distance between the UV-light torch and the paper-based sensor was kept constant at 20 cm. The color intensity of each image was measured as the green intensity using ImageJ software (National Institute of Health, USA). The range of the linear relationship between the quantity of AA (μM) and the green intensity was selected to obtain a calibration curve. The experiment was performed in triplicate. The vitamin C supplement (product labels stated: 500 mg, 1000 mg and 1500 mg) was dissolved in distilled water and adjusted to 100 mL. Then, 15 μL of the resulting solution was diluted with distilled water and adjusted to 200 μL to final concentrations of 2.1, 4.2 and 6.4 mM, respectively. Next, 20 μL of each sample was applied to the paper-based sensor, and digital images were captured and processed as above. The amounts of AA in each sample were determined using the calibration curve. The experiment was repeated four times.
Eaton's equation was applied to calculate the quantum yield28 of the fluorescent cyclized product of probe ProN6 (22a, Scheme 4) using coumarin 30 as a reference.29 The fluorescence spectra of a solution of ProN6 and coumarin 30 (0.05 μM, 3 mL) in the absence of AA were recorded, with excitation at 300 nm. Moreover, the fluorescence spectra of the above solutions (0.1 μM, 1.5 mL) in the presence of AA (0.1 μM, 1.5 mL) were also taken. Their UV absorbances were also collected.
AA measurement by UV absorption
The determination of AA in vitamin C commercial supplements using UV absorption was performed following Zeng's procedure.13 The UV calibration profile (see ESI†) was prepared using a stock solution of AA (2500 μM) in methanol. The stock solutions, consisting of 0.4, 1, 2, 4, 6 and 8 mL, were transferred into 10 mL volumetric flasks and adjusted to 10 mL using methanol to provide 100, 250, 500, 1000, 1500, 2000 and 2500 μM as calibration solutions, respectively. The absorption spectra of the prepared solutions were immediately collected (Fig. S65†). The UV calibration profile (Fig. S66†) was obtained by the linear curve fitting of a variety of concentrations of AA mentioned above versus absorbance values at 255 nm. Three samples of commercial vitamin C powder supplement (product labels stated: 500 mg, 1000 mg and 1500 mg) were dissolved in distilled water and adjusted to 100 mL. Then, 300 μL of the resulting solution was diluted with distilled water using a 10 mL volumetric flask, and the UV spectra were recorded (Fig. S67†). The amounts of AA in each commercial product were determined using the above UV calibration profile. The experiment was performed in triplicate.
Computational methods
Geometry optimization of all structures was carried out at the DFT B3LYP/6-311g** level in ethanol using Gaussian09. The polarizable continuum model (PCM) was employed for the solvation model. The vibrational frequencies were also calculated at the B3LYP/6-311g** level in ethanol with respect to the zero-point vibrational energy and thermal corrections at 298 K. The vibrational analysis revealed that no imaginary frequency was found for the reported minima. The Gibbs free energy of the reaction (ΔGreaction) was then calculated in kcal mol−1 using the following equation: ΔGreaction = ∑ΔGproducts − ∑ΔGreactants.
Results and discussion
A kinetic study of AA detection and the photostability of probes
To investigate the rates of AA detection by ProN6 and ProN7 probes, fluorescence enhancement of the fluorescent cyclized product of each probe was measured. As shown in Fig. 2, the rate of AA detection of ProN6 was faster than that of ProN7 since intramolecular cyclization to furnish the 6-membered ring (22a) is usually more favorable as compared to the 7-membered ring (22b). The relative reaction rates calculated from fluorescence enhancement were 0.15 a.u. s−1 and 0.10 a.u. s−1 for ProN6 and ProN7, respectively. Significantly, ProN6 exhibited a 1.5-fold higher reactivity than ProN7 so ProN6 was further selected as a potentially suitable sensor in other experiments.
 |
| | Fig. 2 The kinetic study of ProN6 and ProN7 monitored by fluorescence enhancement at 490 nm (I490) after mixing with AA (1:1 mole ratio). | |
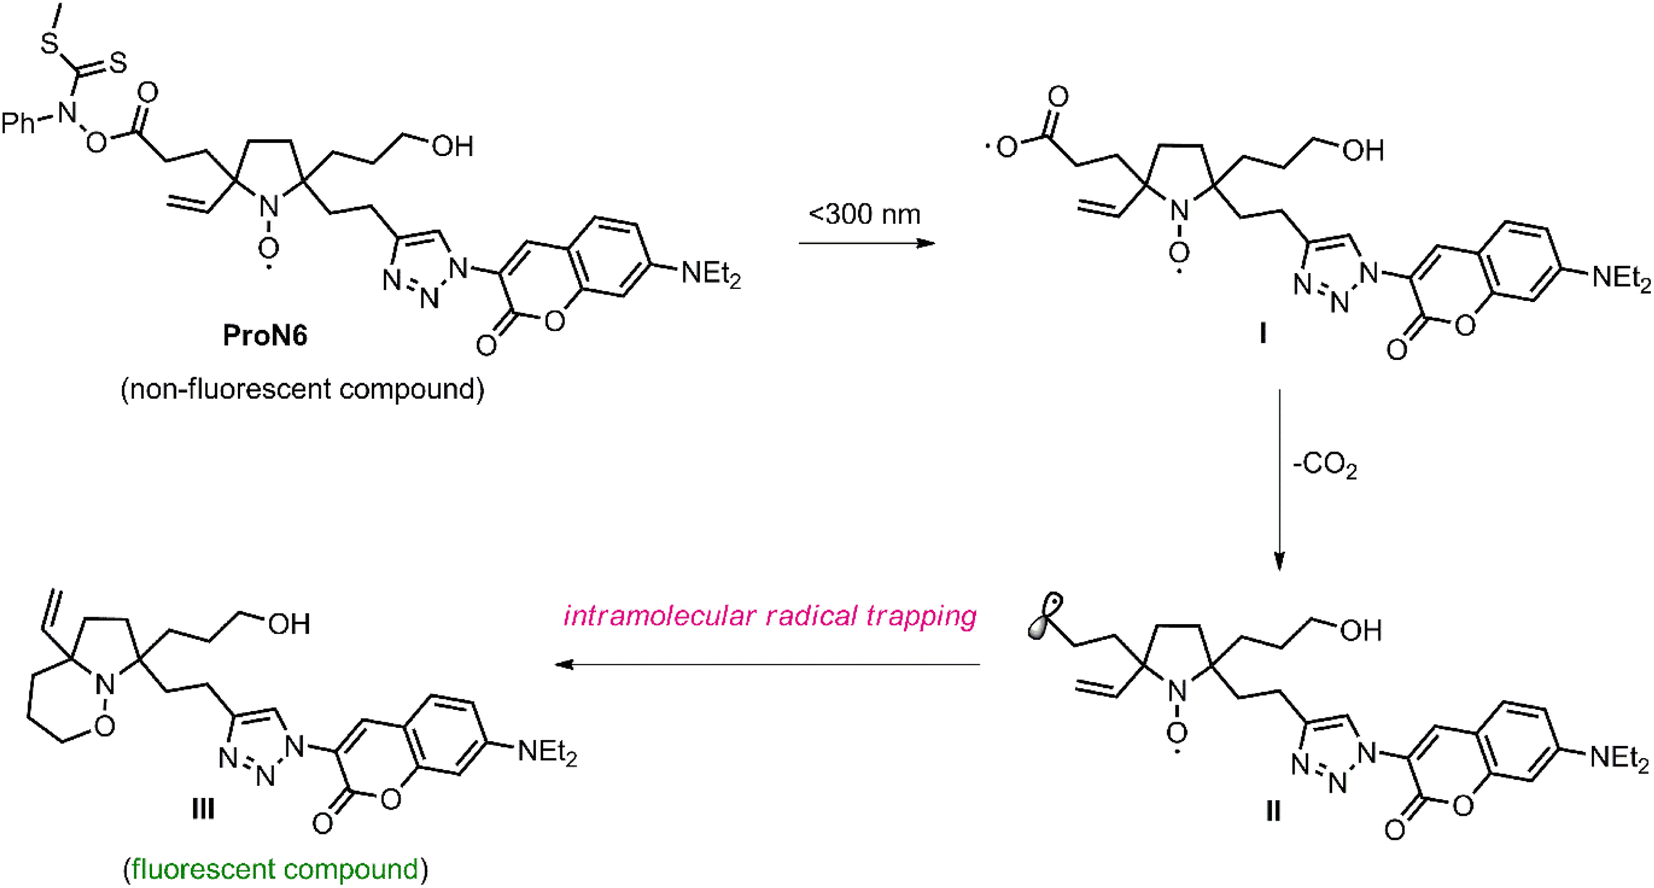
The acceleration of the homolytic cleavage of the N–O bond of the thiohydroxamate ester of ProN6 could deliver carboxyl radical I by irradiation under UV light. Decarboxylative radical trapping would be performed to increase the fluorescence intensity by affording the 6-membered alkoxyamine III via the active primary radical intermediate II as described in Scheme 3. Due to this photosensitivity of the thiohydroxamate ester,30 the stability of the profluorescent probe was also investigated by irradiation of probes ProN6 and ProN7 in ethanol at 300 nm. Satisfactorily, the fluorescence intensity was not enhanced during 2 h as shown in Fig. 2, thus the photocleavage in Scheme 3 did not occur during the measurement.
 |
| | Scheme 3 Possible photoinduced intramolecular decarboxylative radical trapping. | |
EPR study
The electron paramagnetic resonance (EPR) spectrum of ProN6 in deaerated ethanol exhibited the expected characteristic three 14N hyperfine lines31 as illustrated in Fig. 3. The addition of AA to a solution of ProN6 led to a gradual reduction in the peak-to-peak height over 60 min, and the signal was completely reduced by 18 h. These results indicated that the paramagnetic profluorescent nitroxide ProN6 was gradually transformed into a diamagnetic compound upon reaction with AA.
 |
| | Fig. 3 EPR spectra of ProN6 (0.5 mM) and a mixture of ProN6 and excess AA (1.0:1.5 mole ratio of AA/ProN6, 0.5 mM) in deaerated ethanol. Spectra were obtained over 5 to 60 min and overnight. | |
AA measurement in a solution
A fluorescence titration experiment was carried out to investigate the reaction of AA and ProN6. The addition of various concentrations of AA from 0 to 16 μM to a solution of ProN6 provided a gradual enhancement of the blue-green fluorescence emission at 490 nm (Fig. 4A and B). The titration profile revealed that the emission intensity increased linearly with AA concentration from 0.2 to 1.4 μM (R2 = 0.996) (Fig. 4B, inset). Additionally, the limit of detection (LOD) toward AA was determined to be 77.9 nM. Similarly, the quantum yields (Φ) of ProN6 in the absence of AA and the isolated fluorescent cyclized adduct 22a were increased from 7.2% to 58.3%, respectively. Moreover, the UV-vis absorption spectra of ProN6 in the absence and presence of AA are provided in the ESI (Fig. S64).†
 |
| | Fig. 4 (A) Fluorescence titration spectra of ProN6 (2 μM) after mixing with various concentrations of AA (0–16 μM) in ethanol. The excitation wavelength was 300 nm; (B) the plot of fluorescence intensity of ProN6 at 490 nm against varied concentrations of AA. Inset: selected range of a linear relationship between the concentration of AA (μM) and the fluorescence intensity at 490 nm (I490). | |
Selectivity
Polyphenol compounds, cysteine, an essential amino acid containing thiol moiety, as well as transition metals, such as Fe2+, a precursor of heme present in the bloodstream, play a crucial role as antioxidants.32,33 Fe2+ also acts as a reducing agent in SET fashion. Since the reactivity of these reductants may also convert the paramagnetic nitroxide moiety to diamagnetic hydroxylamine, the selectivity of ProN6 was demonstrated. Reductive cyclization reactions of ProN6 in the presence of a variety of competitors, such as quercetin, gallic acid, vanillin, eugenol, caffeic acid, DL-α-tocopherol, phloroglucinol, 2,6-di-tert-butyl-p-cresol, cysteine as well as ferrous chloride (FeCl2), were performed. Fluorescence responses of ProN6 to all antioxidants in excess concentrations were scarcely increased as depicted in Fig. 5A and B. However, when ProN6 was treated with AA and AA + FeCl2, the fluorescence intensities were significantly enhanced. Hence, other reductants should not interfere with ProN6, and only AA remarkably affected its fluorescence as presented in the bar chart (Fig. 5B). This result supported the excellent selectivity of the profluorescent sensor ProN6 for AA analysis. Notably, the color of the ProN6 solution was observed by the naked eyes in daylight as a slightly yellow solution, and then yellowish-green after the addition of a variety of reductants and AA. In addition, in the presence of AA, a solution of ProN6 solution provided a strong greenish-blue (cyan) fluorescence emission under 300 nm UV stimulation.
 |
| | Fig. 5 (A) Fluorescence spectra of the ProN6 solution after the addition of a variety of reductants and AA. Inset: the fluorescence spectra of ProN6 without AA; (B) fluorescence intensities and photographs (under 360 nm UV light) of ProN6 solution after the addition of a variety of reductants and AA. Note: I0 = the fluorescence intensity at 490 nm of ProN6, and It = fluorescence intensity at 490 nm of ProN6 with the reductants. | |
AA measurement on a paper-based sensor
The paper-based fluorescent sensor of ProN6 was prepared according to Scheme 2. Before the quantification of AA by this sensor, fluorescence degradation under open air was investigated. The green intensity of the paper hardly changed during the 7 h (Fig. 6). This observation suggested that ProN6 underwent an irreversible reaction with AA, and thus the resulting product tolerated oxidation. The green intensity of the paper-based sensor was enhanced after the addition of AA by fixing the amount of probe at 2500 μM (Fig. 7). The calibration curve was obtained by varying the amounts of AA from 0 to 10000 μM. Satisfactorily, a good linear calibration curve was observed from 500 to 5000 μM of AA with R2 = 0.997 and LOD = 195.9 μM. This was related to the gradual production of the bright blue-green shades presented in the inset. Although the LOD of the paper-based sensor was higher than that in the solution, the determination of AA in the mM concentration range could be utilized in some studies, such as AA accumulation in human neutrophils.34
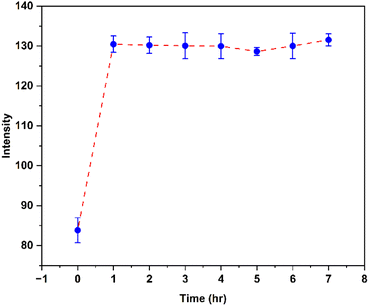 |
| | Fig. 6 Green intensities of the ProN6 paper-based sensor treated with AA during 7 h. | |
 |
| | Fig. 7 Enhancement of the green intensity of the ProN6 paper-based fluorescent sensor by increasing the concentration of AA (0–10000 μM). Inset: selected range of a linear relationship between the quantity of AA (μM) and the green intensity, and photographs of the paper-based fluorescent sensors in the presence of ethanol, water, and in response to different concentrations of AA under UV light (360 nm). | |
Quantitative analysis of AA in commercial supplements
Utilizing the standard calibration curve, the ProN6 paper-based fluorescent sensor was used to quantify the amount of AA in three commercial vitamin C powder supplements as shown in Table 1. The amount of AA examined by the paper-based profluorescent nitroxide sensor was in the closest proximity to that stated on the label in the case of a thousand milligrams in sample B. Significantly, the amounts of AA in all three supplements determined by the ProN6 paper-based sensor were greater than those determined by UV absorption used as a reference method, and also in better agreement with those stated on the labels of the supplements. Noticeably, amounts of AA calculated by both techniques were lower than those verified on the labels. These results suggested that AA might have been damaged by various factors, such as light and oxygen, especially in samples A and C.7 The data for green intensities obtained from ImageJ and photographs of paper-based sensors after the AA analysis of each sample are provided in the ESI (Table S1 and Fig. S63).†
Table 1 Quantitative analysis of AA in three commercial vitamin C powder supplements using the profluorescent nitroxide paper-based fluorescent sensor and UV absorption
| Sample |
Total amount of AA (mg) from commercial vitamin C supplements |
Amount of AA (mg) determined by |
| Paper-based fluorescent sensor |
UV absorption |
| A |
500 |
293 ± 16 |
270 ± 7 |
| B |
1000 |
1067 ± 15 |
939 ± 24 |
| C |
1500 |
1107 ± 10 |
900 ± 15 |
Proposed mechanisms
Based on the presence of both bicyclic O-acylalkoxyamine 22a and thiohydroxamic acid 20, which could be monitored by TLC and isolated by column chromatography, the mechanism of AA detection was proposed, involving redox reactions in two plausible pathways as depicted in Scheme 4. In pathway A, we anticipated that hydrogen abstraction or the hydrogen atom transfer (HAT) of AA by profluorescent persistent nitroxide radical ProN6 was initially performed to deliver hydroxylamine intermediate V. The next step should be the lactonization of V by the liberation of thiohydroxamic acid 20 to establish the fluorescent O-acylalkoxyamine 22a. Alternatively, as shown in pathway B, ascorbate radical IV, generated by HAT, can also reduce persistent radical ProN6 via single electron transfer (SET) to afford the active N-oxide intermediate VII. The next transformation is a lactonization to furnish the same corresponding fluorescent product 22a.
 |
| | Scheme 4 The proposed plausible mechanism of AA-induced cascade reductive lactonization and fluorescence enhancement. | |
DFT calculation
To further investigate the Gibbs free energy of the AA-induced cascade reductive lactonization, the geometry optimization was performed and the Gibbs free energies were predicted at the B3LYP/6-311g** level using Gaussian09. Fig. 8 represents the optimized structures of profluorescent nitroxides ProN5, ProN6 and ProN7, 5-, 6- and 7-membered O-acylalkoxyamines (22c, 22a and 22b) and thiohydroxamate ester 20, while their Gibbs free energies are displayed in Table S2.† The AA-induced cascade reductive lactonization was computed to be endergonic and non-spontaneous for ProN5 as the product was 0.15 kcal mol−1 less stable than the reactant. This could be due to the high ring strain of the 5-membered O-acylalkoxyamine. On the other hand, the reductive lactonization of ProN6 and ProN7 was calculated to be exergonic and spontaneous as their products were 12.66 and 8.78 kcal mol−1 more stable than the reactant, respectively. ΔG of ProN6 was lower than that of ProN7. This indicated that ProN6 would be preferable for practical ascorbic acid determination.
 |
| | Fig. 8 Optimized geometries of ProN5, ProN6 and ProN7, 5-, 6- and 7-membered O-acylalkoxyamines (22c, 22a and 22b) and thiohydroxamate ester (20), and the Gibbs free energies of AA-induced cascade reductive lactonization. | |
Conclusions
In summary, the synthesized profluorescent nitroxide probe comprised of the thiohydroxamate ester functionality accommodated the conversion of the corresponding hydroxylamine to unoxidized O-acylalkoxyamine, leading to the more accurate quantification of AA. The sensor characteristic was proven to be the fluorescence turn-on approach. Moreover, the excellent selectivity of the probe was remarkable among a variety of phenolic antioxidants as competitors. The profluorescent nitroxide sensor fabricated on the cellulose filter paper was utilized as a powerful tool for ascorbic acid measurement in commercial supplements. The fluorescence quenching occurs through electron spin exchange between the unpaired electrons of nitroxide and excited state electrons of the fluorophore. Therefore, fluorescence enhancement was gradually observed by the reduction of unpaired electrons of nitroxide by AA. Taking advantage of the paper-based profluorescent nitroxide performance, it can be applied as a promising potential device to quantitatively determine the amount of AA in other sources.
Author contributions
Nattawut Decha: investigation, conceptualization, methodology, validation, formal analysis, data curation, writing-original draft, writing-review & editing, visualization, Jitnapa Sirirak: methodology, data curation, validation, visualization, formal analysis, Dhassida Sooksawat: resources, supervision, methodology, formal analysis, Apichai Phonchai: resources, supervision, methodology, formal analysis, Soraya Pornsuwan: resources, methodology, formal analysis, Chittreeya Tansakul: resources, supervision, funding acquisition, project administration, conceptualization, methodology, validation, formal analysis, writing-review & editing. All authors discussed the results and commented on the manuscript.
Conflicts of interest
There are no conflicts to declare.
Acknowledgements
This work was financially supported by Prince of Songkla University (Grant No. SCI6502097S-0). N. Decha is grateful for the Royal Golden Jubilee PhD program (PHD/0181/2561), the Thailand Research Fund (TRF), the National Research Council of Thailand (NRCT) for the PhD scholarship, and the Center of Excellence for Innovation in Chemistry (PERCH-CIC), Ministry of Higher Education, Science, Research and Innovation as well as the Graduate School, Prince of Songkla University for additional financial support. The Center of Excellence for Trace Analysis and Biosensor (TAB-CoE) is acknowledged for instrument support for fluorescence measurement.
References
- S. M. Siddeeg, N. S. Alsaiari, M. A. Tahoon and F. B. Rebah, Int. J. Electrochem. Sci., 2020, 15, 3327–3346 CrossRef CAS.
- J. H. Baron, Nutr. Rev., 2009, 67, 315–332 CrossRef PubMed.
- G. Cerullo, M. Negro, M. Parimbelli, M. Pecoraro, S. Perna, G. Liguori, M. Rondanelli, H. Cena and G. D'Antona, Front. Immunol., 2020, 11, 574029 CrossRef CAS PubMed.
- G. L. Bowman, BioFactors, 2012, 38, 114–122 CrossRef CAS PubMed.
- Y. T. Szeto, T. C. Y. Kwok and I. F. F. Benzie, Nutrition, 2004, 20, 863–866 CrossRef CAS PubMed.
- N. A. Mikirova, T. E. Ichim and N. H. Riordan, J. Transl. Med., 2008, 6, 50 CrossRef PubMed.
- H.-Y. Hsu, Y.-C. Tsai, C.-C. Fu and J. S.-B. Wu, J. Agric. Food Chem., 2012, 60, 10696–10701 CrossRef CAS PubMed.
- Y. Shinoda, M. Murata, S. Homma and H. Komura, Biosci., Biotechnol., Biochem., 2004, 68, 529–536 CrossRef CAS PubMed.
- Y. Shinoda, H. Komura, S. Homma and M. Murata, Biosci., Biotechnol., Biochem., 2005, 69, 2129–2137 CrossRef CAS PubMed.
- C.-L. Sun, H.-H. Lee, J.-M. Yang and C.-C. Wu, Biosens. Bioelectron., 2011, 26, 3450–3455 CrossRef CAS PubMed.
- X. Zhang, Y.-C. Zhang and L.-X. Ma, Sens. Actuators, B, 2016, 227, 488–496 CrossRef CAS.
- J. Yan, S. Liu, Z. Zhang, G. He, P. Zhou, H. Liang, L. Tian, X. Zhou and H. Jiang, Colloids Surf., B, 2013, 111, 392–397 CrossRef CAS PubMed.
- W. Zeng, F. Martinuzzi and A. MacGregor, J. Pharm. Biomed. Anal., 2005, 36, 1107–1111 CrossRef CAS PubMed.
- Y. Matsuoka, K. Ohkubo, T. Yamasaki, M. Yamato, H. Ohtabu, T. Shirouzu, S. Fukuzumi and K. Yamada, RSC Adv., 2016, 6, 60907–60915 RSC.
- H. Nam, J. E. Kwon, M.-W. Choi, J. Seo, S. Shin, S. Kim and S. Y. Park, ACS Sens., 2016, 1, 392–398 CrossRef CAS.
- K. Gallas, A.-C. Knall, S. R. Scheicher, D. E. Fast, R. Saf and C. Slugovc, Macromol. Chem. Phys., 2014, 215, 76–81 CrossRef CAS.
- J. P. Blinco, K. E. Fairfull-Smith, B. J. Morrow and S. E. Bottle, Aust. J. Chem., 2011, 64, 373–389 CrossRef CAS.
- Y. Matsuoka, M. Yamato, T. Yamasaki, F. Mito and K. Yamada, Free Radic. Biol. Med., 2012, 53, 2112–2118 CrossRef CAS PubMed.
- Y. Matsuoka, M. Yamato and K. Yamada, J. Clin. Biochem. Nutr., 2016, 58, 16–22 CrossRef CAS PubMed.
- L. Cao, Q. Wu, Q. Li, S. Shaoa and Y. Guo, New J. Chem., 2013, 37, 2991–2994 RSC.
- S. Muhammad-aree and S. Teepoo, Anal. Bioanal. Chem., 2020, 412, 1395–1405 CrossRef CAS PubMed.
- S. Seetasang and T. Kaneta, ACS Sens., 2022, 7, 1194–1200 CrossRef CAS PubMed.
- Y.-K. Yen, C.-H. Chao and Y. S. Yeh, Sensors, 2020, 20, 1372 CrossRef CAS PubMed.
- C. Liu, F. A. Gomez, Y. Miao, P. Cui and W. Lee, Talanta, 2019, 194, 171–176 CrossRef CAS PubMed.
- C. Liu, Y. Miao, X. Zhang, S. Zhang and X. Zhao, Microchim. Acta, 2020, 187, 362 CrossRef CAS PubMed.
- O. Chailapakul, W. Siangproh, S. Jampasa, S. Chaiyo, P. Teengam, A. Yakoh and C. Pinyorospathum, Compr. Anal. Chem., 2020, 89, 31–62 CAS.
- P. Karamahito, J. Sitanurak, D. Nacapricha, P. Wilairat, K. Chaisiwamongkhol and A. Phonchai, Microchem. J., 2021, 162, 105784 CrossRef CAS.
- M. B. Albert, Pure Appl. Chem., 2011, 83, 2213–2228 CrossRef.
- G. Jones, W. R. Jackson and C.-Y. Choi, J. Phys. Chem., 1985, 89, 294–300 CrossRef CAS.
- E. Nyfeler and P. Renaud, Org. Lett., 2008, 10, 985–988 CrossRef CAS PubMed.
- B. R. Knauer and J. J. Napier, J. Am. Chem. Soc., 1976, 98, 4395–4400 CrossRef CAS.
- A. Podkowa, A. Kryczyk-Poprawa, W. Opoka and B. Muszyńska, Eur. Food Res. Technol., 2021, 247, 513–533 CrossRef CAS.
- P. Bar-On, M. Mohsen, R. Zhang, E. Feigin, M. Chevion and A. Samuni, J. Am. Chem. Soc., 1999, 121, 8070–8073 CrossRef CAS.
- P. Washko, D. Rotrosen and M. Levine, J. Biol. Chem., 1989, 264, 18996–19002 CrossRef CAS PubMed.
|
| This journal is © The Royal Society of Chemistry 2023 |
Click here to see how this site uses Cookies. View our privacy policy here. 
 Open Access Article
 This Open Access Article is licensed under a Creative Commons Attribution-Non Commercial 3.0 Unported Licence
 de,
Soraya Pornsuwanf and
Chittreeya Tansakul
de,
Soraya Pornsuwanf and
Chittreeya Tansakul