 Open Access Article
A novel carbazole-based fluorometric and colorimetric sensor for the highly sensitive and specific detection of Cu2+ in aqueous solution†
Yiduo Li,
Luyue Wang,
Liqiang Wang,
Baokun Zhu and
Jie Ma *
*
School of Materials and Chemistry, University of Shanghai for Science and Technology, Shanghai, 200093, P. R. China. E-mail: majie@usst.edu.cn; majie0203ch@hotmail.com
First published on 13th November 2023
Abstract
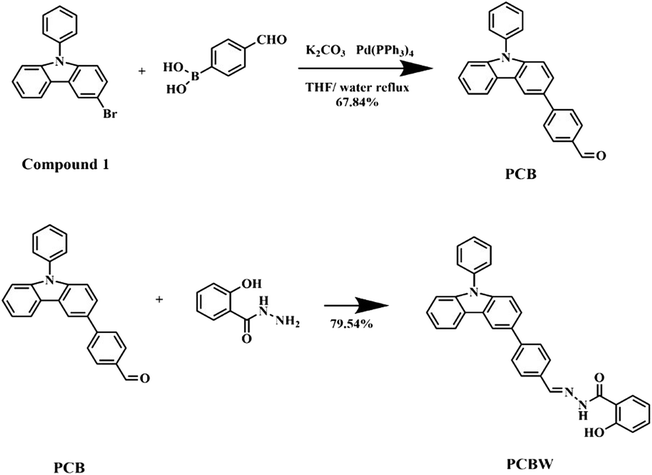
Based on the typical Suzuki coupling reaction and Schiff base reaction, a novel fluorescent molecular PCBW is synthesized and applied as a fluorescence and colorimetric sensor to detect Cu2+ in aqueous solution. The PCBW sensor presents the aggregation-caused quenching (ACQ) effect and at 1 × 10⁻⁵ mol L−1 it emits the strongest turquoise fluorescence in the DMSO–H2O system (fw = 40%). The sensor exhibits a ‘turn-off’ fluorescent characteristic by adding Cu2+, and its fluorescent intensity shows a reliable linear relationship with the Cu2+ concentration in the range of 0–6 × 10⁻⁶ mol L−1, with a detection limit of 1.19 × 10⁻⁸ mol L−1. Meanwhile, the PCBW sensor also exhibits the colorimetric sensing from colorless to light yellow. The sensor has good selectivity and anti-interference and its pH application range can be extended from 5 to 10. The intramolecular charge transfer (ICT) is speculated as the main fluorescence mechanism of PCBW. In addition, the sensor presents good reusability and is practicable to detect Cu2+ in diverse aqueous samples.
1. Introduction
Copper is widely used in the machinery industry, wire industry, pipeline industry, and construction industry and it is also used in the auto parts industry. The widespread existence of copper and copper-containing substances makes Cu2+ an important metal pollutant.1–3 Although copper is one of the necessary trace elements for the human body and plays an important role in various physiological processes of the human body, it will cause serious environmental pollution and harm to human health when it is in excess.4,5 The abnormal concentrations of copper have been linked to several serious diseases,6,7 such as Wilson's disease,8 Alzheimer's disease,9 Menkes syndrome,10 Parkinson's disease,11 and prion disease.12 According to the World Health Organization (WHO), the standard of copper ion in drinking water has a median value of 23.4 μmol L−1 in the range of 0.78–46.9 μmol L−1.13 Therefore, it is a very important research point to develop a fast, sensitive, and reliable method to detect Cu2+ in diverse samples.In past decades, various detection methods have been applied to detect Cu2+ ions in biological and environmental samples, such as atomic emission spectrometry (AES), mass spectrometry (MS), inductively coupled plasma spectroscopy (ICP), atomic absorption spectrometry (AAS), electrochemical methods, etc.14–16 However, the above methods still have some disadvantages including complex and expensive instruments, complex detecting procedures, and long time-consuming, and off-site tests. Recently, a fluorescence method has been paid more attention due to its advantages of convenient operation, high selectivity and sensitivity, fast response time, low cost, etc.17–20 So far, although many fluorescent sensors have been designed and developed to detect Cu2+,21–24 with the increasing requirements for the environment and application of ion detection, the design and development of new fluorescent sensors is still a hot spot in the field of fluorescence detection.25
Carbazole is a kind of aromatic heterocyclic compound rich in electrons and an important intermediate of many fine chemicals. Commonly, the 3 and 6 positions of carbazole have high activity and can carry out a series of reactions, such as Friedel–Crafts alkylation, Friedel–Crafts acylation, nitration, halogenation formylation, and so on.26 Many kinds of carbazole derivatives can be synthesized by the relative reaction modifying functional monomers, these carbazole derivatives with large conjugate systems may show high active electron transfer ability, high thermal stability, photochemical stability, photoelectric properties, and bioactivity properties.27,28 They have been widely applied in many fields, such as photoelectric materials, chemical dyes, clinical medicine, molecular recognition, and so on.29 In recent years, carbazole derivatives have been used as fluorophore moiety to construct fluorescent molecular sensors due to their large π-conjugated rigid planar structure and active intramolecular charge transfer characteristic.30–32
In this paper, a new type of coordinated fluorescent material named (2-hydroxyphenyl) {2-[(E)-[4-(9-phenylcarbazol-3-yl) phenyl] methylidene] diazanyl} methanone (PCBW) is synthesized successfully via two-step reactions. The PCBW molecule with a given concentration at 1 × 10⁻⁵ mol L−1 shows special fluorescence properties at 477 nm in the mixed solution of DMSO–H2O (fw = 40%). It shows a special “turn-off” fluorescent response for detecting Cu2+. Meanwhile, Cu2+ will make the color of the PCBW solution change from colorless to light yellow in sunlight. The fluorescence intensity of PCBW at 477 nm shows a reliable linear relationship with the concentration of Cu2+. In a given DMSO–H2O system, the PCBW sensor shows excellent selectivity and anti-interference and has excellent reusability. The detection mechanism of PCBW is analyzed by high-resolution mass spectrometry (HRMS), nuclear magnetic resonance (NMR), and theoretical calculation. The reported method provides a good reference for constructing novel carbazole-based fluorescent sensors applied in different fields.
2. Experimental section
2.1. Materials and apparatus
All reagents are analytical grade without further purification in procedures except for some specific reagents specified. They are purchased from the Chemical Reagents Ltd. Co. of Sinopharm Group (China). All metal ions are provided by relatively soluble salts, including CuCl2·2H2O, AgNO3, Co(NO3)2·6H2O, ZnCl2, Pb(NO3)2, AlCl3·6H2O, CdCl2, CrCl3, MnCl2, FeCl3·6H2O, NiSO4·6H2O, Hg(NO3)2, KCl, NaCl, CaCl2, MgSO4, BaCl2·2H2O. 3-Bromo-N-phenyl-9H-carbazole is purchased from Aladdin with 98% purity. 2-Hydroxybenzhydrazide is purchased from Aladdin with 98% purity.High-resolution mass spectra (HRMS) are recorded with Thermo Scientific Q Exactive (Thermo Fisher-QE, America). LC-MS spectra are measured by a Liquid Chromatography-Mass Spectrometer (LCMS-2020, Japan). NMR spectra are recorded by an NMR spectrometer (Bruker AV-400, Germany). Monitoring fluorescence intensity by fluorescence spectrometer (FL-7000, Hitachi, Japan). The UV-vis spectrum is recorded on the UV-vis spectrophotometer (UV-3900, Hitachi, Japan). Particle size data recorded on a dynamic light scattering instrument (Dynapro Titan TC, Wyatt Technology, America).
2.2. Synthesis process
![[thin space (1/6-em)]](https://www.rsc.org/images/entities/char_2009.gif) :
:![[thin space (1/6-em)]](https://www.rsc.org/images/entities/char_2009.gif) 1 PE–EA) and the pure white solid 4-(9-phenylcarbazol-3-yl)benzene-1-carbaldehyde (PCB) is obtained (1.4653 g, yield 67.84%).1H NMR (600 MHz, DMSO-d6) δ 10.05 (s, 1H), 8.74 (d, J = 1.6 Hz, 1H), 8.38 (d, J = 7.7 Hz, 1H), 8.02 (q, J = 8.3 Hz, 4H), 7.84 (dd, J = 8.6, 1.7 Hz, 1H), 7.70 (t, J = 7.7 Hz, 2H), 7.64 (d, J = 7.4 Hz, 2H), 7.56 (t, J = 7.4 Hz, 1H), 7.45 (dd, J = 7.9, 4.9 Hz, 2H), 7.39 (d, J = 8.2 Hz, 1H), 7.33 (t, J = 7.4 Hz, 1H). 13C NMR (126 MHz, DMSO-d6) δ 192.41, 146.39, 140.54, 140.10, 136.43, 134.23, 130.61, 130.06, 130.02, 127.69, 126.94, 126.48, 125.30, 123.35, 122.67, 120.75, 120.23, 119.19, 110.02, 109.64. LC-MS: purity 98%, m/z [M + 1]+ 347.2 (calcd 347.2). 1H NMR, 13C NMR, and LC-MS spectra are listed in the ESI (Fig. S1–S3†).
1 PE–EA) and the pure white solid 4-(9-phenylcarbazol-3-yl)benzene-1-carbaldehyde (PCB) is obtained (1.4653 g, yield 67.84%).1H NMR (600 MHz, DMSO-d6) δ 10.05 (s, 1H), 8.74 (d, J = 1.6 Hz, 1H), 8.38 (d, J = 7.7 Hz, 1H), 8.02 (q, J = 8.3 Hz, 4H), 7.84 (dd, J = 8.6, 1.7 Hz, 1H), 7.70 (t, J = 7.7 Hz, 2H), 7.64 (d, J = 7.4 Hz, 2H), 7.56 (t, J = 7.4 Hz, 1H), 7.45 (dd, J = 7.9, 4.9 Hz, 2H), 7.39 (d, J = 8.2 Hz, 1H), 7.33 (t, J = 7.4 Hz, 1H). 13C NMR (126 MHz, DMSO-d6) δ 192.41, 146.39, 140.54, 140.10, 136.43, 134.23, 130.61, 130.06, 130.02, 127.69, 126.94, 126.48, 125.30, 123.35, 122.67, 120.75, 120.23, 119.19, 110.02, 109.64. LC-MS: purity 98%, m/z [M + 1]+ 347.2 (calcd 347.2). 1H NMR, 13C NMR, and LC-MS spectra are listed in the ESI (Fig. S1–S3†).
![[thin space (1/6-em)]](https://www.rsc.org/images/entities/char_2009.gif) :
:![[thin space (1/6-em)]](https://www.rsc.org/images/entities/char_2009.gif) 1 PE–EA) and the pure white solid PCBW (0.1103 g, yield 79.57%) is obtained. 1H NMR (600 MHz, DMSO-d6) δ 11.90 (s, 1H), 11.89 (s, 1H), 8.71 (s, 1H), 8.53 (s, 1H), 8.39 (s, 2H), 7.95 (s, 1H), 7.94 (s, 1H), 7.89 (s, 2H), 7.86 (s, 1H), 7.84 (s, 1H), 7.72 (s, 1H), 7.68 (s, 2H), 7.57 (s, 1H), 7.47 (s, 2H), 7.42 (s, 1H), 7.34 (s, 1H), 7.01 (s, 1H), 6.99 (s, 1H), 6.98 (s, 1H). 13C NMR (151 MHz, DMSO) δ 165.21, 159.52, 148.94, 142.95, 141.12, 140.39, 137.19, 134.30, 132.89, 131.95, 130.72, 129.08, 128.38, 127.47, 127.13, 125.68, 123.97, 123.38, 121.41, 120.79, 119.46, 119.26, 117.77, 116.45, 110.60, 110.26. HRMS: m/z [M + 1]+ 482.2 (calcd 482.2). 1H NMR, 13C NMR, and HRMS spectra are listed in the ESI (Fig. S4–S6†).
1 PE–EA) and the pure white solid PCBW (0.1103 g, yield 79.57%) is obtained. 1H NMR (600 MHz, DMSO-d6) δ 11.90 (s, 1H), 11.89 (s, 1H), 8.71 (s, 1H), 8.53 (s, 1H), 8.39 (s, 2H), 7.95 (s, 1H), 7.94 (s, 1H), 7.89 (s, 2H), 7.86 (s, 1H), 7.84 (s, 1H), 7.72 (s, 1H), 7.68 (s, 2H), 7.57 (s, 1H), 7.47 (s, 2H), 7.42 (s, 1H), 7.34 (s, 1H), 7.01 (s, 1H), 6.99 (s, 1H), 6.98 (s, 1H). 13C NMR (151 MHz, DMSO) δ 165.21, 159.52, 148.94, 142.95, 141.12, 140.39, 137.19, 134.30, 132.89, 131.95, 130.72, 129.08, 128.38, 127.47, 127.13, 125.68, 123.97, 123.38, 121.41, 120.79, 119.46, 119.26, 117.77, 116.45, 110.60, 110.26. HRMS: m/z [M + 1]+ 482.2 (calcd 482.2). 1H NMR, 13C NMR, and HRMS spectra are listed in the ESI (Fig. S4–S6†).2.3. Preparation of stock solutions and detecting solutions
The PCBW substance is fully dissolved in DMSO to prepare a concentration of 1 × 10⁻³ mol L−1 stock solution. The concentration of all investigated metal ions stock solution is also set as 1 × 10⁻³ mol L−1 with deionized water, including Cu2+, Ag+, Co2+, Zn2+, Pb2+, Al3+, Cd2+, Cr3+, Mn2+, Fe3+, Ni2+, Hg2+, K+, Na+, Ca2+, Mg2+, Ba2+. All prepared stock solutions are fully oscillated evenly mixed and stored at room temperature (25 °C). The 1 × 10⁻³ mol L−1 EDTA stock solution is prepared from Na2EDTA and deionized water. The PCBW sensors are set as 10 mL volume with the concentration of PCBW at 1 × 10⁻⁵ mol L−1 in the DMSO–H2O system. For example, when a water content (fw) is given at 40% (fw = 40%), the sensor system is prepared from 0.1 mL PCBW stock solution, 0.1 mL metal ion stock solution, 5.9 mL DMSO solvent, and 3.9 mL deionized water. The UV absorption spectra of all analyte solutions are recorded in the range of 310–425 nm. The fluorescence emission spectra excited by 352 nm light are recorded in the range from 370 nm to 710 nm.2.4. The pH experiments and the repeatability experiments
Since the probe is used for the detection of Cu2+ in solution, the optimum pH range of the tested solution is worth discussing. To study the stability of the probe in different pH samples, the solution is composed of 0.1 mL PCBW stock solution, 5.9 mL DMSO solvent, and 4.0 mL deionized water (pH = 2–12), then the fluorescence intensity of these probe solutions is measured in turn. For the ability of the PCBW probe to identify Cu2+ in different pH solutions, when water content is given at 40%, the sensor solution system is made from 0.1 mL PCBW stock solution, 5.9 mL DMSO solvent, 0.001 mL 0.1 mol per L Cu2+ stock solution and 3.999 mL deionized water (pH = 2–12) and then measure the fluorescence intensity of these prepared solutions.All repeatability experiments are performed under the same conditions except for the addition of different amounts of Cu2+ and EDTA from their stock solutions (1 × 10⁻³ mol L−1) alternately. The volume amounts of copper ions and EDTA stock solutions used in the 11 experiments are 0.1 mL Cu2+, 0.1 mL Cu2+ + 0.1 mL EDTA, 0.2 mL Cu2+ + 0.1 mL EDTA, 0.2 mL Cu2+ + 0.2 mL EDTA, 0.3 mL Cu2+ + 0.2 mL EDTA, 0.3 mL Cu2+ + 0.3 mL EDTA, 0.4 mL Cu2+ + 0.3 mL EDTA, 0.4 mL Cu2+ + 0.4 mL EDTA, 0.5 mL Cu2+ + 0.4 mL EDTA, 0.5 mL Cu2+ + 0.5 mL EDTA, 0.6 mL Cu2+ + 0.5 mL EDTA in turn. The two storage solutions are added in a rotating order of 0.1 mL Cu2+ and 0.1 mL EDTA until the set amount.
2.5. Computational method
Simulation calculations about the monomolecular of PCBW are carried out in the Gaussian 09 software package based on DFT and TD-DFT theories. The DFT based on the B3LYP/6-31G* model is performed for the geometries of relative molecules. Based on the above, the lowest empty molecular orbital (LUMO) and highest occupied molecular orbital (HOMO) states and electron cloud distributions are calculated by M06-2X/6-31G* basis set.3. Results and discussion
3.1. Effect of water content on the PCBW sensor
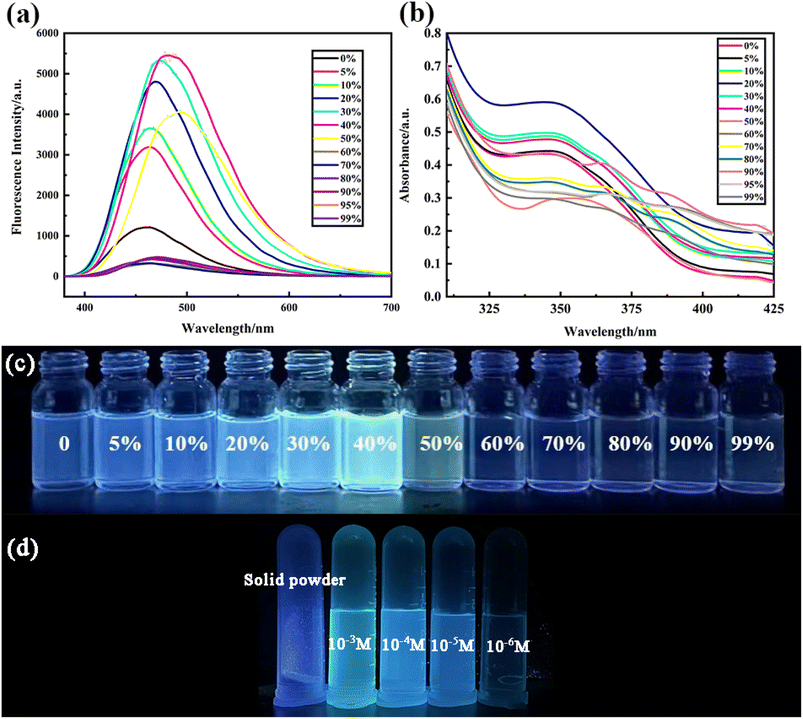
Due to PCBW not being soluble in water but in DMSO, a DMSO–H2O mixture is used as its solvent to construct the sensor system. Fig. 1a shows the change curve of the fluorescence intensity of the PCBW sensor with different water content, excited by 352 nm UV light. It is indicated the PCBW sensor has the strongest fluorescence intensity when the water content is about 40%. As the water content increases by over 40%, the fluorescence intensity of the sensor gradually decreases from approximately 5500 a.u. to below 1000 a.u. However, when the water content increases from 0% to 40%, the fluorescence intensity of the sensor gradually increases, accompanied by a redshift. The above results indicate that water content is a critical factor for the PCBW fluorescent system. It should be attributed that PCBW molecules are concentrated and even aggregated with the increase of fw. Fig. S11† is particle size of PCBW at different moisture contents detected by dynamic light scattering (DLS), demonstrates that as the water content increases, the particle size in the system shows a trend of first increasing and then decreasing, and reaches its maximum at 60% water content. We speculate that within the range of 0–40%, the system can be seen as dominated by DMSO, with water molecules dissolved in DMSO; at 40–60%, water, and DMSO act as mutual solvents, because compound PCBW are insoluble in water and will exists in the system as DMSO–PCBW droplets, reaching its maximum at 60%; when the water content exceeds 60%, it can be seen as water as a solvent, and PCBW–DMSO droplets are dispersed in the aqueous phase. As the water content increases, DMSO in the droplets is forced to transfer to water, resulting in a continuous decrease in particle size, and the aggregation of molecule PCBW. As the concentration increases to a certain extent, its fluorescence intensity reaches the maximum; then fluorescence of the PCBW sensor decreases with the continuous increase in water content, due to the aggregation of molecules. Therefore, the synthesized PCBW should belong to ACQ fluorescent material; the red-shift phenomenon of fluorescence is attributed to the increase of decay of non-radiative transition energy caused by intermolecular interaction.Fig. 1b and S9† are the ultraviolet absorption spectra of the PCBW sensor with different water content. The UV-vis absorption spectrum of the sensor has an obvious absorption band between 310–425 nm, and the position and intensity of the UV-vis absorption peak of PCBW are different under different water content. With the water content less than 40%, the sensor shows an absorption band in the range of 325 to 400 nm. However, the absorbing band is also widened and red-shifted with water content beyond 40%. The decrease in intensity around 350 nanometers should be attributed to the interactions among aggregated molecules.
Fig. 1c shows a digital photograph of a PCBW sensor in different water content under long wavelength UV lamp light. It can be seen that the fluorescence intensity is the strongest with the water content of 40%, which is accordingly with the spectrum results shown in Fig. 1a. As shown in Fig. 1d, by varying the fluorescence intensity of PCBW at different concentrations in pure DMSO, it can be further confirmed that PCBW has an ACQ effect, as its solid does not emit fluorescence under long wavelength UV lamp light. It can also be demonstrated that there is a significant red shift in its fluorescence with its concentration increases. This result supports the speculation that adding water may lead to the concentration of PCBW in the DMSO–H2O system.
It is speculated that the PCBW molecule will emit strong fluorescence in the suitable dispersed state. However, its exciton energy may be expended via a non-radiative route by the interaction among aggregated molecules, leading to a decrease or even disappearance of fluorescence intensity. To ensure the effectiveness of the experiment, the ideal PCBW sensor (1 × 10⁻⁵ mol L−1) is constructed with the compound dispersed in a DMSO–H2O solvent containing water 40% at room temperature (25 °C).
3.2. Selectivity and sensitivity of the PCBW sensor
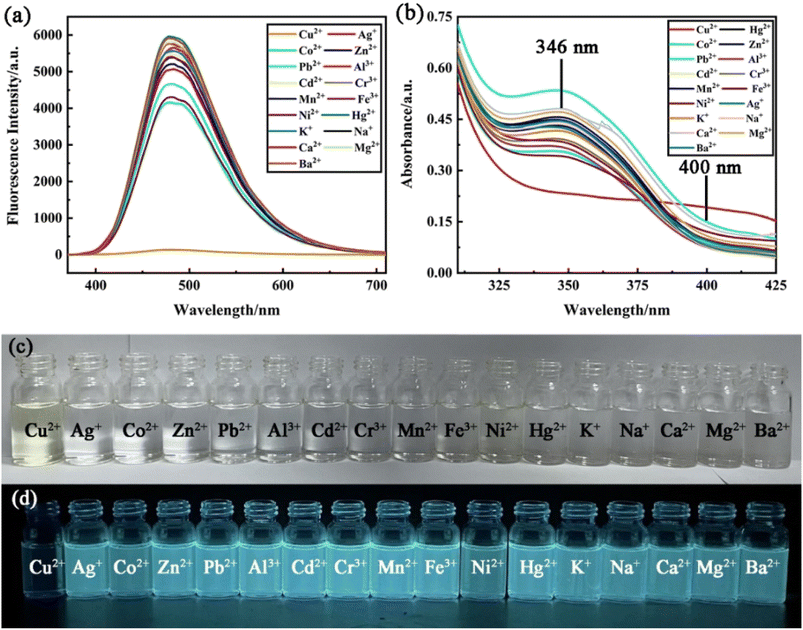
To investigate the specificity of the PCBW sensor for Cu2+, the fluorescence spectra and UV-vis absorption spectra changes of the probe with 17 kinds of ions are measured. These spectral analyses are carried out under the same condition except for different kinds of cations, including Ag+, Co2+, Zn2+, Pb2+, Al3+, Cd2+, Cr3+, Mn2+, Fe3+, Ni2+, Hg2+, K+, Na+, Ca2+, Mg2+, Ba2+ ([M]n+ = 1.0 × 10⁻⁵ mol L−1). It can be seen from the fluorescence spectra shown in Fig. 2a and the fluorescent image shown in Fig. 2d that only copper ions can cause fluorescence quenching of the probe, although other ions have slightly different effects on it. Meanwhile, the UV-vis absorption spectra shown in Fig. 2b and the daylight image shown in Fig. 2c further indicate that only copper ion can cause the change of the UV-visible absorption spectrum of the probe molecule. The above results indicate that the PCBW sensor has excellent specificity for copper ions in both fluorescent detection and colorimetric detection within the range of 17 ions examined. Digital photographs of PCBW interacting with metal ions under daylight and long wavelength UV lamp light are shown in Fig. 2c and d. It further indicates that after adding Cu2+, PCBW solution is transparent light yellow under sunlight and non-fluorescence under long wavelength UV lamp light. Meanwhile, whether in sunlight or under long wavelength UV lamp light, the color of the probe system hardly changes with the addition of other ions. The specificity of the sensor should be attributed to the formation of PCBW–Cu2+ complexes via Cu2+ coordinating with N and O atoms in PCBW molecules, while other ions cannot form stable complexes, so it has little effect on its fluorescence and UV-visible absorption. The formation of copper ion and PCBW complex leads to the change of its probe molecular structure, which results in its fluorescence quenching. With the addition of copper ions, the UV visible absorption spectral band shifts from around 346 nanometers to the visible light region around 400 nanometers, resulting in the color of the solution changing from colorless to light yellow. Therefore, we can preliminarily determine if copper ions are present in the probe system by observing the color changes of the sensor system under natural light with the naked eye.The anti-interference experiment results of the PCBW sensor are shown in Fig. 3. It shows the comparative data of the fluorescence intensity at 477 nm of the PCBW sensor after the addition of various ions in the presence or absence of copper ions. For comparison purposes, the fluorescence intensity of the blank sensor and the sensor adding copper ions is placed on the leftmost of the bar graph in Fig. 3. It is found that the fluorescence intensity of the PCBW sensor containing 16 cations is similar to that of the pure sensor when Cu2+ is absent, further indicating the sensor does not have recognizability to them. Meanwhile, the fluorescence of all PCBW sensors containing different cations is almost completely quenched in the presence of Cu2+. These results prove that Cu2+ ions can effectively quench the fluorescence of the PCBW sensor and these metal ions hardly interfere with the detection of Cu2+ ions. These results further suggest that the constructed sensor has excellent specificity and anti-interference ability for detecting copper(II) ions in aqueous.
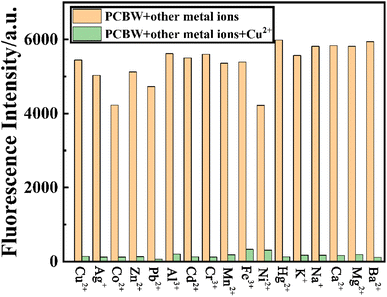 | ||
| Fig. 3 The fluorescence intensity at 477 nm of PCBW sensor with diverse metal ions (1 × 10⁻⁵ mol L−1) alone or with Cu2+ (1 × 10⁻⁵ mol L−1). | ||
3.3. Effect of Cu2+ concentration on the sensor
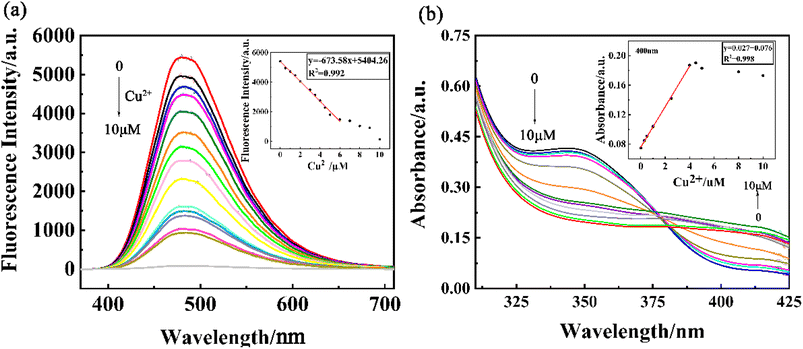
To study the fluorescence recognition ability of Cu2+, a series of concentrations of Cu2+ are titrated into a given PCBW sensor system. The curve shown in Fig. 4a illustrates the change in fluorescence intensity of the sensor in the range of Cu2+ concentration from 0 to 1 × 10⁻⁵ mol L−1. With the increase of Cu2+ concentration, the fluorescence emission peak of the PCBW sensor at 477 nm does not shift, but its intensity gradually decreases. The fluorescence intensity of the sensor at 477 nm shows a good negative linear with the concentration of Cu2+ in the range of 0–6 × 10⁻⁶ mol L−1, and the fitting curve equation is as y = −673.58x + 5404.26 (R2 = 0.992). It indicates that the PCBW sensor, as a fluorescence “turn-off” sensor, can be used for quantitative detection of Cu2+ content in the range of 0–6 × 10⁻⁶ mol L−1. According to the equation as LOD = 3σ/s (σ represents the standard deviation of blank sample, s represents the absolute value of the coefficient of the fitting function between fluorescence intensity and the concentration of testing metal ion),33 the LOD of the sensor reaches 1.19 × 10⁻⁸ mol L−1, which further indicates the PCBW sensor has a good sensitivity for the detection of Cu2+ in solution. Meanwhile, the concentration of Cu2+ also can be roughly estimated via the naked eye by the fluorescence image obtained under long wavelength UV lamp light shown in Fig. S10.†Fig. 4b shows the UV-visible spectrum of the sensor as a function of Cu2+ concentration from 0 to 1 × 10⁻⁵ mol L−1. From the curves, it can be seen that as the concentration of copper ions in the system increases, the absorption peak intensity at 346 nm gradually decreases to a minimum, while the new absorption peak intensity at 400 nm gradually increases to a maximum. Due to the new absorption band from 400 nm to 425 nm belonging to the visible light region, the color of the PCBW sensor solution changes from colorless to faint yellow under sunlight (Fig. 2c). Therefore, it is possible to preliminarily determine the content of copper ions in the system by observing the color changes of the probe solution under sunlight with naked eyes. Moreover, the absorption intensity of the sensor at 400 nm also presents good positive linear with Cu2+ concentration in the range of 0–4 × 10⁻⁶ mol L−1, and the fitting curve is as y = 0.027x + 0.076 (R2 = 0.998). Therefore, according to the UV-vis absorption spectrum, the PCBW sensor can also quantitatively detect Cu2+ concentration in the range of 0–4 × 10⁻⁶ mol L−1.
3.4. The presumed fluorescence detection mechanism
The coordination mechanism of the PCBW molecule with Cu2+ ion is studied by a series of Job's plot experiments. As shown in the following Fig. 5, when [Cu2+]![[thin space (1/6-em)]](https://www.rsc.org/images/entities/char_2009.gif) :
:![[thin space (1/6-em)]](https://www.rsc.org/images/entities/char_2009.gif) [Cu2+ + PCBW] ≈ 1
[Cu2+ + PCBW] ≈ 1![[thin space (1/6-em)]](https://www.rsc.org/images/entities/char_2009.gif) :
:![[thin space (1/6-em)]](https://www.rsc.org/images/entities/char_2009.gif) 3, the fluorescence intensity is almost the lowest, indicating that the PCBW molecule coordinates with Cu2+ at a stoichiometric ratio of 2
3, the fluorescence intensity is almost the lowest, indicating that the PCBW molecule coordinates with Cu2+ at a stoichiometric ratio of 2![[thin space (1/6-em)]](https://www.rsc.org/images/entities/char_2009.gif) :
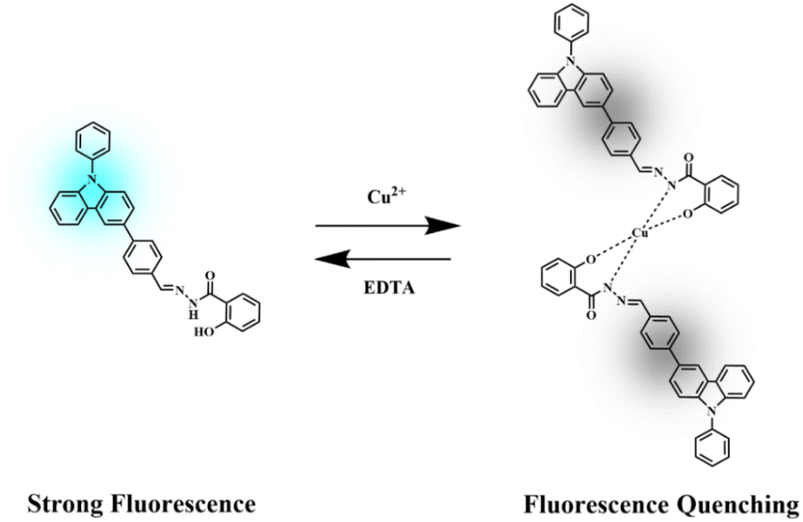
:![[thin space (1/6-em)]](https://www.rsc.org/images/entities/char_2009.gif) 1. The coordination mode of sensors PCBW and Cu2+ is deduced and proposed the possible coordination mode of sensors PCBW and Cu2+ as shown in Scheme 2. It is speculated that Cu2+ coordinates with the N atom of the imino group and the O atom of hydroxyl groups in PCBW molecules to form metal coordination complexes. The peak at 1045.24 belongs to the m/z of 2PCBW–Cu–Na is found in the HRMS spectrum of PCBW–Cu2+ shown in Fig. S7,† further suggesting the stoichiometric ratio of PCBW to Cu2+ is 2
1. The coordination mode of sensors PCBW and Cu2+ is deduced and proposed the possible coordination mode of sensors PCBW and Cu2+ as shown in Scheme 2. It is speculated that Cu2+ coordinates with the N atom of the imino group and the O atom of hydroxyl groups in PCBW molecules to form metal coordination complexes. The peak at 1045.24 belongs to the m/z of 2PCBW–Cu–Na is found in the HRMS spectrum of PCBW–Cu2+ shown in Fig. S7,† further suggesting the stoichiometric ratio of PCBW to Cu2+ is 2![[thin space (1/6-em)]](https://www.rsc.org/images/entities/char_2009.gif) :
:![[thin space (1/6-em)]](https://www.rsc.org/images/entities/char_2009.gif) 1. The binding constants Ka is calculated by the benefit software and the relative result is shown in Fig. S8,† the Kd (1/Ka) is estimated at 2.56 × 10⁻⁵ M, indicating a strong coordination effect between copper ions and PCBW fluorescent molecules. Due to the strong coordination between Cu2+ and PCBW, the ICT effect in PCBW molecules is restrained, resulting in its fluorescence quenching.
1. The binding constants Ka is calculated by the benefit software and the relative result is shown in Fig. S8,† the Kd (1/Ka) is estimated at 2.56 × 10⁻⁵ M, indicating a strong coordination effect between copper ions and PCBW fluorescent molecules. Due to the strong coordination between Cu2+ and PCBW, the ICT effect in PCBW molecules is restrained, resulting in its fluorescence quenching.
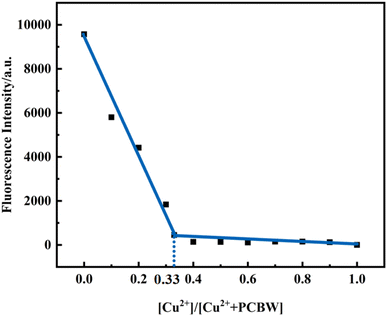 | ||
| Fig. 5 Job's plot for PCBW molecule towards Cu2+ at 477 nm. The total concentration of PCBW and Cu2+ ions given at 2.5 × 10⁻⁵ mol. | ||
3.5. Theoretical analysis
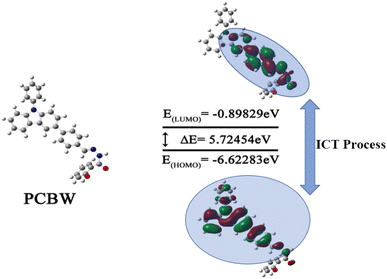
To reasonably explain the Cu2+ response behavior observed in the experiment, based on DFT and TD-DFT, the optimized structure, HOMO and LUMO states, and electron distribution of sensor PCBW are studied via Gaussian 09 software. B3LYP/6-31G* level is adopted in Gaussian operation. Fig. 6 shows the optimized molecular configuration of PCBW and their corresponding frontier molecular orbital energy levels. In the HOMO and LUMO of PCBW, the electron cloud HOMO is mainly distributed on the carbazole group of the PCBW unit, and the benzene ring connected to the carbazole group, LUMO is distributed on the benzene ring connected to the carbazole group and the coordination center. It can be seen that the distribution of the electron cloud has an obvious shift, this shows that there is an obvious ICT process in PCBW. Because Cu2+ may coordinate with N and O atoms in PCBW molecules. Coordination may lead to changes in the structure and energy distribution of PCBW molecules. The result is that the fluorescence of PCBW disappears, so Cu2+ can quench the fluorescence of the probe. It further proves that the proposed recognition mechanism is reasonable.3.6. The time response of the sensor
The time response performance of the sensor to Cu2+ is investigated and the results are shown in Fig. 7. It clearly shows that the fluorescence signal of the pure sensor remains stable at the time of 0–25 min. When 1 × 10⁻⁵ mol per L Cu2+ is added to the sensor solution, the fluorescence intensity of the sensor immediately decreases, and then the fluorescence intensity of the sensor gradually decreases to the minimum for about 20 min and keeps stable. This phenomenon should be attributed to the different dissolution characteristics of PCBW and copper ions. The PCBW is wrapped in the DMSO organic phase while Cu2+ is dispersed in the water phase. The PCBW molecules on the surface of the organic phase immediately react with Cu2+, so the fluorescence intensity of the sensor solution decreases immediately after adding Cu2+. However, since the organic phase of the sensor, DMSO is 60% of the total system, and only the PCBW molecule on the surface can bind with Cu2+, it takes a long time for copper ions to fully interact with fluorescent molecules. It shows that the sensor has good time response performance and can effectively detect Cu2+.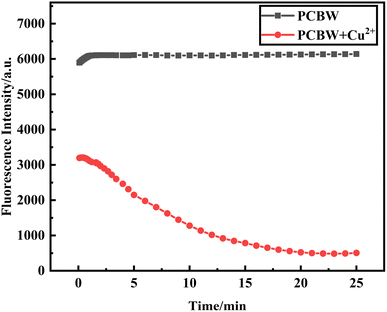 | ||
| Fig. 7 Time-dependent fluorescence response at 477 nm of the PCBW sensor and the sensors in the presence of Cu2+. | ||
3.7. Applicable pH range of sensor
To study the optimum pH range of the sensor, we investigated the change of fluorescence intensity of the sensor in the pH range of 2 to 12 in the aqueous phase. It can be seen from Fig. 8 that the fluorescent intensity of the PCBW sensor increases when pH changes from 2 to 5; it then remains almost stable in the pH range of 5–10; finally, it decreases rapidly when pH exceeds 10. When equal amounts of copper ions are present in the sensor system, the fluorescence intensity of the system gradually decreases in the pH range of 2 to 5, and then it remains stable despite the pH ranging from 5 to 12. Indicating that the constructed PCBW sensor can effectively monitor copper ions in the pH range of 5–10. Because the pH value of real water samples is mostly within the range of 5–10, it indicates that the sensor has a broad prospect for Cu2+ detection in actual aqueous.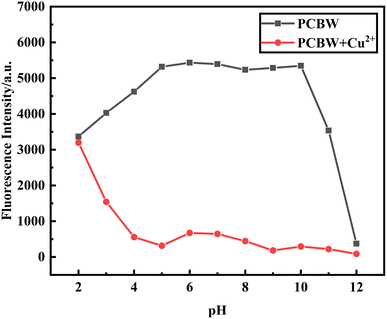 | ||
| Fig. 8 The fluorescence intensity change at 477 nm of the PCBW sensor and the sensors in the presence of Cu2+ with different pH at 477 nm. | ||
3.8. The recycling ability of the sensor
Reusability is one of the important indicators for evaluating coordination-type sensors. Therefore, EDTA, as a common ligand, is used to evaluate the reversibility of the PCBW sensor in detecting the procedure of Cu2+. As shown in Fig. 9, the fluorescence of the PCBW sensor shows evident quench when an equal amount of Cu2+ is added to it. Then, with the addition of equimolar EDTA, the fluorescence emission intensity is significantly enhanced to its original value, indicating the as-prepared probe can be readily regenerated by EDTA. Subsequently, the alternating addition of Cu2+ and EDTA leads to fluorescence quenching and fluorescence recovery alternately. According to coordination theory, the reusability of the sensor should be attributed to the binding ability of EDTA to Cu2+ being stronger than that of PCBW to Cu2+. When EDTA is added, EDTA molecules preferentially coordinate with Cu2+, leading to the release of PCBW molecules from the PCBW–Cu2+ complex and the re-emergence of fluorescence. The reversible cycle is repeated at least 5 times, and there is only a small change in fluorescence intensity. Although the addition of EDTA one time can verify the recovery of the probe, it cannot indicate whether the presence of EDTA will interfere with the detection of copper ions. From these cyclic tests, it can be seen that when an equal amount of EDTA is added to Cu2+, Cu2+ almost completely coordinate with EDTA, which is attributed to the huge difference in the coordination ability of probe molecules compared to EDTA. However, regardless of the content of EDTA, as long as the Cu2+ content exceeds EDTA, the PCBW probe has good sensitivity to Cu2+. Therefore, during the testing process, adding copper ions equivalent to EDTA can eliminate the influence of the ligand on the probe, indicating the PCBW probe has good reusability and stability in high concentrations of EDTA conditions.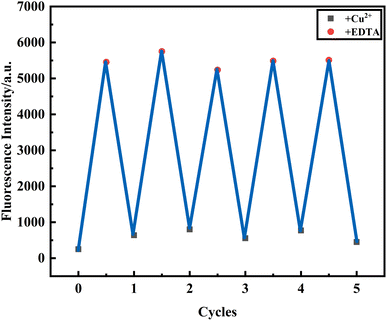 | ||
| Fig. 9 Reversible changes of fluorescence intensity at 477 nm of PCBW upon addition of Cu2+ and EDTA alternately. | ||
3.9. Application in real water samples
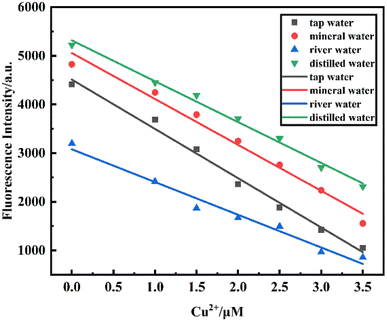
To explore the application of the PCBW sensor in real water samples, the fluorescence characteristics of the sensor for detecting Cu2+ are investigated in three real samples taken from tap water (from the Lab), mineral water (from Nongfu Spring), and river water (from Fuxing River), and all experimental conditions are same as those of the sensor taken from deionized water. Fig. 10 shows the linear fitting curve of the fluorescence intensity of four different water samples at 477 nm with the variation of Cu2+ concentration (scatter points represent the fluorescence intensity at 477 nm of four different water samples after adding different concentrations of Cu2+. The four straight lines are the linear fitting curves of the fluorescence intensities of the four water samples). It presents that the fluorescence intensity of these PCBW sensors all decreases with the increase of Cu2+ concentration and they have a good linear relationship. Meanwhile, the fluorescence intensity of the sensor in a real water sample is lower than that in deionized water at the same conditions, indicating there is a trace amount of copper ion Cu2+ in real aqueous. The content of Cu2+ in a river is the highest among the three real water samples. Although these three types of water samples may contain a variety of complex ions and minerals, these substances hardly affect the sensor's determination of copper ions.Based on the fitting curve (y = −943.58x + 5056.73) obtained in deionized water, the detection deviations of different concentrations of Cu2+ in tap water, mineral water, and river water are calculated, which are listed in Table 1. These results also show that Cu2+ exists in three actual water systems: tap water, mineral water, and river water. The concentrations of Cu2+ in tap water, mineral water, and river water are calculated to be 1.08 × 10⁻⁶ mol L−1, 0.59 × 10⁻⁶ mol L−1 and 2.52 × 10⁻⁶ mol L−1, in turn. The LOD of the PCBW sensor reaches 7.91 × 10⁻⁹ mol L−1, 7.21 × 10⁻⁹ mol L−1 and 1.20 × 10⁻⁸ mol L−1 to detect Cu2+ in tap water, mineral water and river water, respectively, it can be seen that the detection limit of the probe for Cu2+ in tap water and mineral water is lower than that in deionized water. It shows that the prepared PCBW sensor can be well used for the detection of Cu2+ in real water, and has a wide application prospect.
| Sample | Cu2+ spiked (1 × 10⁻⁶ mol L−1) | Cu2+ found (1 × 10⁻⁶ mol L−1) | Deviation (%) |
|---|---|---|---|
| Tap water | 0 | 1.08 | None |
| 1 | 1.94 | 86.0 | |
| 1.5 | 2.67 | 106.0 | |
| 2 | 3.52 | 122.0 | |
| 2.5 | 4.09 | 120.4 | |
| 3 | 4.64 | 118.7 | |
| 3.5 | 5.08 | 114.3 | |
| Mineral water | 0 | 0.59 | None |
| 1 | 1.28 | 69.0 | |
| 1.5 | 1.82 | 82.0 | |
| 2 | 2.47 | 94.0 | |
| 2.5 | 3.05 | 98.4 | |
| 3 | 3.67 | 102.7 | |
| 3.5 | 4.48 | 111.1 | |
| River water | 0 | 2.52 | None |
| 1 | 3.45 | 93.0 | |
| 1.5 | 4.10 | 105.3 | |
| 2 | 4.34 | 91.0 | |
| 2.5 | 4.55 | 81.2 | |
| 3 | 5.18 | 88.7 | |
| 3.5 | 5.32 | 80.0 |
3.10. PCBW-based test strips for Cu2+ detection
Fluorescent strip detection is a convenient, rapid, and efficient method for the detection of Cu2+. It is easy to operate and suitable for real-time detection of real water. The filter paper is dripped by applying 1 × 10⁻³ mol per L PCBW solution and dried. During the test, 1 × 10⁻³ mol L−1 aqueous solution of metal ions is dropped on the test paper. Fig. 11 shows the photographs of PCBW-based test strips upon the addition of Na+, Hg2+, Cd2+, Cr3+, Ni2+, and Cu2+ under sunlight and long wavelength UV lamp light. It can be seen that after adding metal ions under the sunlight, the color of the test strip remains the color of the original filter paper (white). Under the long wavelength UV lamp light, the test strip shows turquoise fluorescence with a metal ion solution other than Cu2+ is added, the color of fluorescence is the same as the test strip with only the pure sensor. Only the turquoise fluorescence of the test strip disappeared after adding Cu2+ and showing a black shadow. It is worth noting that the test paper dripped with Ni2+ also shows a perceptible black shadow, which is the same as the results of the previous selective experiment shown in Fig. 2a and d. It is worth noting that the PCBW solid has no fluorescence, but it emits bright turquoise fluorescence after being made into a dry test strip. This phenomenon should be attributed to the inability of PCBW molecules to aggregate in large quantities after dropping onto the test paper. It further indicates that the PCBW has an ACQ effect and its' test paper can qualitatively detect Cu2+ in aqueous.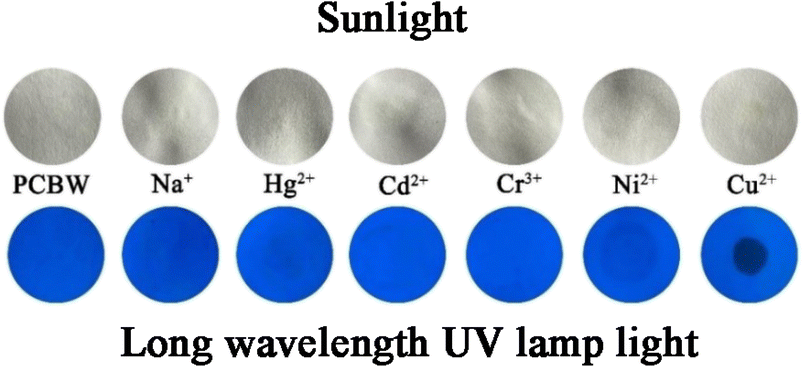 | ||
| Fig. 11 The photographs of PCBW-based test strips upon addition of Na+, Hg2+, Cd2+, Cr3+, Ni2+, and Cu2+ under sunlight and long wavelength UV lamp light. | ||
3.11. Comparison of sensor PCBW with other reported fluorescence sensors for Cu2+ detection
According to Table 2, the detection limit of PCBW for Cu2+ recognition is lower than that of most fluorescent sensors previously reported. Many sensors need to be used under a specific pH, so it is necessary to use a buffer solvent (such as HEPES) to adjust the pH of the sensor solution before use, which not only complicates the operation but also increases the use of the buffer solution, while the sensor PCBW can effectively detect Cu2+ in a wide pH range of 5–10. There is no need to adjust the pH value of the solution when using sensor PCBW to detect Cu2+. In addition, the sensor PCBW requires DMSO as a solvent, which is a relatively safe solvent, but most sensors use toxic reagents as solvents, such as THF, ACE, CH3CN, etc. More importantly, although the sensor has an ACQ effect, it is suitable for use in a system with a water content of 40%, which is a relatively high-water system, such a system can reduce the use of organic solvents and be environmentally friendly.| Sensor | Solution systems | LOD | Ref. |
|---|---|---|---|
| PCBW | DMSO/H2O (6![[thin space (1/6-em)]](https://www.rsc.org/images/entities/char_2009.gif) : :![[thin space (1/6-em)]](https://www.rsc.org/images/entities/char_2009.gif) 4, v/v, pH = 5–10) 4, v/v, pH = 5–10) |
1.19 × 10⁻⁸ M | This work |
| HBT-H | ACE/H2O (4![[thin space (1/6-em)]](https://www.rsc.org/images/entities/char_2009.gif) : :![[thin space (1/6-em)]](https://www.rsc.org/images/entities/char_2009.gif) 6, v/v, pH = 7.4) 6, v/v, pH = 7.4) |
3.08 × 10⁻⁷ M | 34 |
| AH | CH3CN/H2O (1![[thin space (1/6-em)]](https://www.rsc.org/images/entities/char_2009.gif) : :![[thin space (1/6-em)]](https://www.rsc.org/images/entities/char_2009.gif) 1, v/v, pH = 7.4) 1, v/v, pH = 7.4) |
4.22 × 10⁻⁸ M | 35 |
| TPE-1 | THF/HEPES (1![[thin space (1/6-em)]](https://www.rsc.org/images/entities/char_2009.gif) : :![[thin space (1/6-em)]](https://www.rsc.org/images/entities/char_2009.gif) 9, v/v, pH = 7.3) 9, v/v, pH = 7.3) |
9.91 × 10⁻⁸ M | 36 |
| WGB | CH3CN/HEPES (1![[thin space (1/6-em)]](https://www.rsc.org/images/entities/char_2009.gif) : :![[thin space (1/6-em)]](https://www.rsc.org/images/entities/char_2009.gif) 1, v/v, pH = 7.4) 1, v/v, pH = 7.4) |
6.76 × 10⁻⁸ M | 37 |
| BTN | CH3CN | 3.3 × 10⁻⁶ M | 38 |
| HMAN | CH3CN/HEPES (95![[thin space (1/6-em)]](https://www.rsc.org/images/entities/char_2009.gif) : :![[thin space (1/6-em)]](https://www.rsc.org/images/entities/char_2009.gif) 5, v/v) 5, v/v) |
2.45 × 10⁻⁸ M | 39 |
| NPPY | DMSO/HEPES (95![[thin space (1/6-em)]](https://www.rsc.org/images/entities/char_2009.gif) : :![[thin space (1/6-em)]](https://www.rsc.org/images/entities/char_2009.gif) 5, v/v) 5, v/v) |
3.29 × 10⁻⁸ M | 40 |
| SH | DMSO/HEPES (95![[thin space (1/6-em)]](https://www.rsc.org/images/entities/char_2009.gif) : :![[thin space (1/6-em)]](https://www.rsc.org/images/entities/char_2009.gif) 5, v/v) 5, v/v) |
3.74 × 10⁻⁶ M | 41 |
| DA | DMSO/H2O (1![[thin space (1/6-em)]](https://www.rsc.org/images/entities/char_2009.gif) : :![[thin space (1/6-em)]](https://www.rsc.org/images/entities/char_2009.gif) 1, v/v) 1, v/v) |
9.79 × 10⁻⁷ M | 42 |
| L | EtOH![[thin space (1/6-em)]](https://www.rsc.org/images/entities/char_2009.gif) : :![[thin space (1/6-em)]](https://www.rsc.org/images/entities/char_2009.gif) HEPES (5 HEPES (5![[thin space (1/6-em)]](https://www.rsc.org/images/entities/char_2009.gif) : :![[thin space (1/6-em)]](https://www.rsc.org/images/entities/char_2009.gif) 95, v/v) 95, v/v) |
5.31 × 10⁻⁷ M | 43 |
4. Conclusions
In conclusion, a new PCBW molecule with ACQ effect is successfully synthesized. The PCBW sensor is constructed readily in the DMSO–H2O system (fw = 40%) at room temperature. As a turn-off fluorescence and colorimetric sensor, PCBW shows excellent selectivity, sensitivity, and anti-interference for detecting Cu2+ among 17 tested ions. The detection limit of the sensor reaches 1.19 × 10⁻⁸ mol L−1. The fluorescence detection mechanism should be attributed to the formation of the PCBW–Cu2+ complex, and the fluorescence emission mechanism of the PCBW molecule belongs to the ICT effect according to the theoretical simulation results. With the presence of copper ion, the PCBW–Cu2+ complex is formed and the ICT effect is destroyed, resulting in the fluorescence quenching. The PCBW sensor has excellent reusability, which can be readily recovered by EDTA. The sensor shows effective application in the detection of Cu2+ in real water samples, and the strip containing PCBW can also be successfully applied to the detection of Cu2+. The work provides an alternative thread for the synthesis of fluorescent molecules with AIE or ACQ effect based on the same fluorescent group through the modification of substituted moieties. Meanwhile, it is a good reference for the development and application of fluorescent sensors in the aqueous detection field.Data availability
The data used or analyzed during the current study are available from the corresponding author upon reasonable request.Author contributions
Yiduo Li and Jie Ma provided the initial idea for this work; Jie Ma, as supervisor, provided support; Luyue Wang, Liqiang Wang, and Baokun Zhu contributed to the collection and analysis of test data; Yiduo Li contributed to the theoretical calculation. Jie Ma and Yiduo Li contributed to the paper writing.Conflicts of interest
The authors declare no interest or biases in the submitted work.Acknowledgements
This work is financially supported by the Natural Science Foundation of Shanghai (No. 15ZR1428500). The authors are thankful to Haoyang Wang for the HR-ESI-MS analysis from the Shanghai Institute of Organic Chemistry, Chinese Academy of Sciences, and Chunfang Zheng for the HRMS analysis from Shiyanjia Lab (https://www.shiyanjia.com).References
- D. Udhayakumari, S. Naha and S. Velmathi, Anal. Methods, 2017, 9, 552–578 RSC.
- Y. Wang, X. H. Hao, L. X. Liang, L. Y. Gao, X. M. Ren, Y. G. Wu and H. C. Zhao, RSC Adv., 2020, 10, 6109–6113 RSC.
- Y. P. Zhang, Y. C. Zhao, Q. H. Xue, Y. S. Yang, H. C. Guo and J. J. Xue, Inorg. Chem. Commun., 2021, 129, 108612 CrossRef CAS.
- J. Y. Shang, Y. B. Li, K. N. Chen and H. P. Li, Chem. Pap., 2021, 75, 1851–1859 CrossRef CAS.
- X. L. Niu, H. Zhang, X. J. Wu, S. B. Zhu, Y. L. Liu and M. Tian, J. Mol. Struct., 2022, 1264, 133294 CrossRef CAS.
- L. Huang, F. P. Hou, P. X. Xi, D. C. Bai, M. Xu, Z. P. Li, G. G. Xie, Y. J. Shi, H. Y. Liu and Z. Z. Zeng, J. Inorg. Biochem., 2011, 105, 800–805 CrossRef CAS PubMed.
- V. Desai and S. G. Kaler, Am. J. Clin. Nutr., 2008, 88, 855S–858S CrossRef CAS PubMed.
- S. Lutsenko, Biochem. Soc. Trans., 2008, 36, 1233–1238 CrossRef CAS PubMed.
- M. G. Savelieff, S. Lee, Y. Z. Liu and M. H. Lim, ACS Chem. Biol., 2013, 8, 856–865 CrossRef CAS PubMed.
- B. E. Ziegler, R. A. Marta, M. B. Burt and T. B. McMahon, Inorg. Chem. Commun., 2014, 53, 2349–2351 CrossRef CAS PubMed.
- W. I. M. Vonk, V. Kakkar, P. Bartuzi, D. Jaarsma, R. Berger, M. H. Hofker, L. W. J. Klomp, C. Wijmenga, H. H. Kampinga and B. van de Sluis, PLoS One, 2014, 9, e92408 CrossRef PubMed.
- A. J. McDonald, J. P. Dibble, E. G. B. Evans and G. L. Millhauser, J. Biol. Chem., 2014, 289, 803–813 CrossRef CAS PubMed.
- A. A. Taylor, J. S. Tsuji, M. R. Garry, M. E. McArdle, W. L. Goodfellow, W. J. Adams and C. A. Menzie, Environ. Manage., 2020, 65, 131–159 CrossRef PubMed.
- S. Feng, Q. Gao, X. Gao, J. Yin and Y. Jiao, Inorg. Chem. Commun., 2019, 102, 51–56 CrossRef CAS.
- L. Hou, J. Feng, Y. Wang, C. Dong, S. Shuang and Y. Wang, Sens. Actuators, B, 2017, 247, 451–460 CrossRef CAS.
- Y. Qian, J. Lin, T. Liu and H. Zhu, Talanta, 2015, 132, 727–732 CrossRef CAS PubMed.
- D. J. Zhu, A. S. Ren, X. C. He, Y. H. Luo, Z. H. Duan, X. W. Yan, Y. H. Xiong and X. Zhong, Sens. Actuators, B, 2017, 252, 134–141 CrossRef CAS.
- Y. Liu, B. Jiang, L. L. Zhao, L. Zhao, Q. Y. Wang, C. Wang and B. C. Xu, Spectrochim. Acta, Part A, 2021, 261, 120009 CrossRef CAS PubMed.
- X. D. Zeng, S. Gao, C. Jiang, Q. X. Duan, M. S. Ma, Z. G. Liu and J. Chen, Luminescence, 2021, 36, 1761–1766 CrossRef CAS PubMed.
- Z. Q. Guo, Q. F. Wang, D. G. Zhou, Y. An, P. Wang and F. Liao, Spectrochim. Acta, Part A, 2022, 264, 120257 CrossRef CAS PubMed.
- M. A. Assiri, A. G. Al-Sehemi and M. Pannipara, Inorg. Chem. Commun., 2019, 99, 11–15 CrossRef CAS.
- A. G. Al-Sehemi, A. Irfan, M. Pannipara, M. A. Assiri and A. Kalam, Z. Phys. Chem., 2019, 233, 895–911 CrossRef CAS.
- S. J. Jiang, J. B. Qiu, S. B. Chen, H. Y. Guo and F. F. Yang, Spectrochim. Acta, Part A, 2020, 227, 117568 CrossRef CAS PubMed.
- X. D. Zeng, S. Gao, C. Jiang, X. Jin, M. S. Ma, Z. G. Liu and J. Chen, Chemistryselect, 2021, 6, 6619–6624 CrossRef CAS.
- J. T. Yang, J. Chai, B. S. Yang and B. Liu, Spectrochim. Acta, Part A, 2019, 211, 272–279 CrossRef CAS PubMed.
- V. Nayana and B. Kandasubramanian, J. Polym. Res., 2020, 27, 285 CrossRef CAS.
- A. K. Mitra, J. Iran. Chem. Soc., 2022, 19, 2075–2113 CrossRef.
- F. Bekkar, F. Bettahar, I. Moreno, R. Meghabar, M. Hamadouche, E. Hernaez, J. L. Vilas-Vilela and L. Ruiz-Rubio, Polymers, 2020, 12, 2227 CrossRef CAS PubMed.
- D. Erdener and I. Kaya, J. Fluoresc., 2022, 32, 2097–2106 CrossRef CAS PubMed.
- D. Li, S. Tu, Y. Le, Y. Zhou, L. Yang, Y. Y. Ding, L. Huang and L. Liu, Spectrochim. Acta, Part A, 2023, 285, 121816 CrossRef CAS PubMed.
- H. F. Wang, P. P. Wang, L. F. Niu, C. H. Liu, Y. Z. Xiao, Y. Tang and Y. Chen, Spectrochim. Acta, Part A, 2022, 278, 121257 CrossRef CAS PubMed.
- Y. Y. Zhu, R. Jia, Z. Y. Ke, X. W. Wang, L. P. Su, Y. P. Tian and X. H. Tian, Dyes Pigm., 2022, 208, 110875 CrossRef CAS.
- J. Pan, J. Ma, L. Liu, D. Li, Y. Huo and H. Liu, J. Photochem. Photobiol., A, 2021, 416, 113322 CrossRef CAS.
- L. X. Zhao, K. Y. Chen, K. B. Xie, J. J. Hu, M. Y. Deng, Y. L. Zou, S. A. Gao, Y. Fu and F. Ye, Dyes Pigm., 2023, 210, 110943 CrossRef CAS.
- J. Y. Yang, W. Y. Gao, J. H. Wang, Z. M. Dong, Y. Wang and S. M. Shuang, J. Lumin., 2023, 254, 119549 CrossRef CAS.
- Y. X. Pan, Y. Li, X. F. Sun, L. J. Tang and X. M. Yan, Dyes Pigm., 2023, 210, 110985 CrossRef CAS.
- C. Segura, O. Yanez, A. Galdamez, V. Tapia, M. T. Nunez, I. Osorio-Roman, C. Garcia and O. Garcia-Beltran, J. Photochem. Photobiol., A, 2023, 434, 114278 CrossRef CAS.
- G. Kim, D. Choi and C. Kim, J. Fluoresc., 2021, 31, 1203–1209 CrossRef CAS PubMed.
- F. N. Arslan, G. A. Geyik, K. Koran, F. Ozen, D. Aydin, S. N. K. Elmas, A. O. Gorgulu and I. Yilmaz, J. Fluoresc., 2020, 30, 317–327 CrossRef CAS PubMed.
- V. Bhardwaj, S. K. A. Kumar and S. K. Sahoo, Microchem. J., 2022, 178, 107404 CrossRef CAS.
- D. A. Patel, S. K. A. Kumar and S. K. Sahoo, J. Photochem. Photobiol., A, 2023, 437, 114465 CrossRef CAS.
- A. Thangaraj, V. Bhardwaj and S. K. Sahoo, Photochem. Photobiol. Sci., 2019, 18, 1533–1539 CrossRef CAS PubMed.
- V. Bhardwaj, L. Hindocha, S. K. A. Kumar and S. K. Sahoo, New J. Chem., 2022, 46, 3248–3257 RSC.
Footnote |
| † Electronic supplementary information (ESI) available. See DOI: https://doi.org/10.1039/d3ra04571d |
| This journal is © The Royal Society of Chemistry 2023 |

