
 Open Access Article
 This Open Access Article is licensed under a Creative Commons Attribution-Non Commercial 3.0 Unported Licence
Identification of chemical components and rat serum metabolites in Danggui Buxue decoction based on UPLC-Q-TOF-MS, the UNIFI platform and molecular networks†
Yanhui Lv‡
ab,
Xike Xu‡a,
Jishun Yang‡c,
Yuan Gaoab,
Jiayun Xinab,
Wei Chen a,
Li Zhangb,
Jiali Lib,
Jie Wangb,
Yanping Weib,
Xintong Weib,
Jixiang He*b and
Xianpeng Zu*a
a,
Li Zhangb,
Jiali Lib,
Jie Wangb,
Yanping Weib,
Xintong Weib,
Jixiang He*b and
Xianpeng Zu*a
aDepartment of Natural Medicinal Chemistry, School of Pharmacy, Naval Medical University, Shanghai 200433, China. E-mail: zuxianpeng@163.com
bDepartment of Pharmaceutical Analysis, School of Pharmacy, School of Pharmacy, Shandong University of Traditional Chinese Medicine, Jinan 250355, China. E-mail: 05000044@sdutcm.edu.cn
cMedical Security Center, Naval Medical Center, Naval Medical University, Shanghai 200433, China
First published on 7th November 2023
Abstract
Danggui Buxue Decoction (DBD), consisting of Astragalus membranaceus (Fisch.) Bge. var. mongholicus (Bge.) Hsiao (Huangqi, HQ) and Angelica sinensis (Oliv.) Diels (Danggui, DG), is a traditional Chinese medicine (TCM) formula with the function of tonifying Qi and promoting blood. In this study, ultra-performance liquid chromatography coupled with quadrupole time-of-flight mass spectrometry (UPLC-Q-TOF-MS) was used to comprehensively identify the chemical constituents in DBD and those entering into the rat serum after gastric perfusion. A combination of the UNIFI platform and Global Natural Product Social molecular networking (GNPS) was used to analyze the chemical composition of DBD. As a result, 207 compounds were unambiguously or tentatively identified including 60 flavonoids, 38 saponins, 35 organic acids, 26 phthalides, 12 phenylpropanoids, 11 amino acids and 25 others. Furthermore, a total of 80 compounds, including 29 prototype components and 51 exogenous metabolites, were detected in the serum of rats. Phase I reactions (oxidation, reduction, and hydration), phase II reactions (methylation, sulfation, and glucuronidation), and their combinations were the main metabolic pathways of DBD. The results provided fundamental information for further studying the pharmacological mechanisms of DBD, as well as its quality control research.
1. Introduction
Traditional Chinese Medicine (TCM) formulas have attracted worldwide attention due to their reliable clinical therapeutic effects.1,2 TCM formulas are composed of hundreds of components and exert their pharmacological effects through the synergistic contribution of multiple components and multiple targets.3 However, the complexity of chemical components may hinder the modernization of TCM formulas. Therefore, it is essential to systematically determine what components are present in TCM formulas and which of them can be absorbed into the blood. Fortunately, serum pharmacochemistry serves as a bridge between chemicals and pharmacology, elucidating which chemical components can migrate into the blood.4In recent years, ultra-performance liquid chromatography coupled with time-of-flight mass spectrometry (UPLC-Q-TOF-MS) has been widely used for the separation of multiple components in TCM formulas due to its high sensitivity and resolution.5–7 Mass SpectrometryEnergy (MSE) and fast data directed analysis (fast DDA) are two of the common data acquisition modes. The former is a representation of data-independent mode and can provide MS/MS fragmentation of all precursor ions without ion selection or separation, while the latter as a data-dependent mode enables targeted fragmentation of precursor ions with high response strengths exclusively, which can greatly simplify the complexity of data processing for structural resolution.3,8 Consequently, the integration of MSE and fast DDA acquisition modes can make the comprehensive characterization of compounds much easier. UNIFI is a powerful data processing tool with a variety of data processing methods including product ion filter (PIF), neutral loss filter (NLF) and mass defect filter (MDF), which can facilitate the identification of known components.9 Global natural products social molecular networking (GNPS), a public data-sharing web platform, can form a visual molecular network based on the similarity of MS/MS spectra.10 Currently, GNPS has been widely applied to metabolomics, identifying chemical components of TCM, and inferring unknown compounds of TCM formulas based on the correlation of individual nodes.11–13 Therefore, the combination of the above data processing platform and various acquisition modes can greatly improve the accuracy and efficiency for identifying chemical components and metabolites in TCM formulas.
Danggui Buxue Decoction (DBD) is a well-known TCM formula in the Jin Dynasty, which has been used to tonify Qi and promote blood in clinical practice.14 DBD is consisted of Astragalus membranaceus (Fisch.) Bge. var. mongholicus (Bge.) Hsiao (Huangqi, HQ) and Angelica sinensis (Oliv.) Diels (Danggui, DG) with a weight ratio of 5![[thin space (1/6-em)]](https://www.rsc.org/images/entities/char_2009.gif) :1.15 The formula can be used not only as an effective medicine, but also as a common dietary supplement. Modern pharmacological research has demonstrated that DBD has pharmacological effects on promoting hematopoiesis, regulating immunity, anti-tumor, and hepatoprotection.16,17 It is necessary to systematically characterize the chemical components of DBD to elucidate the mechanism of its pharmacological activities.
:1.15 The formula can be used not only as an effective medicine, but also as a common dietary supplement. Modern pharmacological research has demonstrated that DBD has pharmacological effects on promoting hematopoiesis, regulating immunity, anti-tumor, and hepatoprotection.16,17 It is necessary to systematically characterize the chemical components of DBD to elucidate the mechanism of its pharmacological activities.
In the present work, a database of chemical compound was first established to facilitate the process of identification. Then, data acquisition modes of MSE and fast DDA were integrated on UPLC-Q-TOF-MS and combined with UNIFI platform, molecular networking for data processing to systematically identify known and unknown chemical components in DBD. The prototype components and their associated metabolites were identified in serum by UNIFI software after oral administration of DBD. The workflow is shown in Fig. 1. This work provides a material basis for further investigation on the pharmacological effects of DBD.
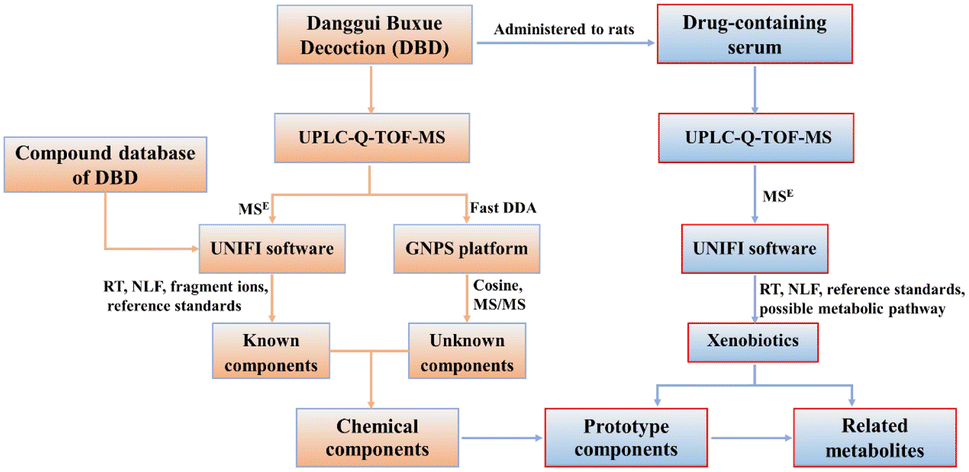 | ||
| Fig. 1 The flowchart for the identification of components in vitro and in vivo of DBD. | ||
2. Materials and methods
2.1. Reagents and materials
The reference standards of calycosin-7-O-β-D-glucoside, cycloastragenol, ferulic acid, ursolic acid, senkyunolide A, adenosine, genistein, glycitin, glycitein, palmitic acid, daidzein, hesperidin, chlorogenic acid, caffeic acid, salicylic acid, isoastragaloside I, astragaloside I, astragaloside IV, were supplied by Shanghai Liding Biotech Co., Ltd (Shanghai, China). Levistolide A, senkyunolide I, leucine, isoferulic acid were purchased from National Institutes for Food and Drug Control (Beijing, China). Astragaloside III, genistin, liquiritigenin were purchased from Herbest Biotech Co., Ltd (Shanxi, China). Riboflavin, Inosine, Vanillic acid were purchased from Shanghai Yuanye Bio-Technology Co., Ltd (Shanghai, China). Tyrosine, tryptophan, ononin, formononetin, calycosin, umbelliferone, 7-methoxycoumarin Shanghai ZaiQi Biotech Co., Ltd (Shanghai, China). The purity of 35 reference standards was greater than 95%, and the structure of the compounds is presented in Fig. 2. DG and HQ were provided by Shanghai Hongqiao Traditional Chinese Medicine Co., Ltd (Shanghai, China) and authenticated by Prof. Bao-Kang Huang (Department of Pharmacognosy, Naval Medical University, Shanghai, China). LC-MS-grade methanol, acetonitrile, formic acid and water were obtained from Fisher Scientific Co. (Fair Lawn, NJ, USA). Leucine enkephalin (LC-MS grade) was provided by Sigma-Aldrich (St. Louis, MO, USA).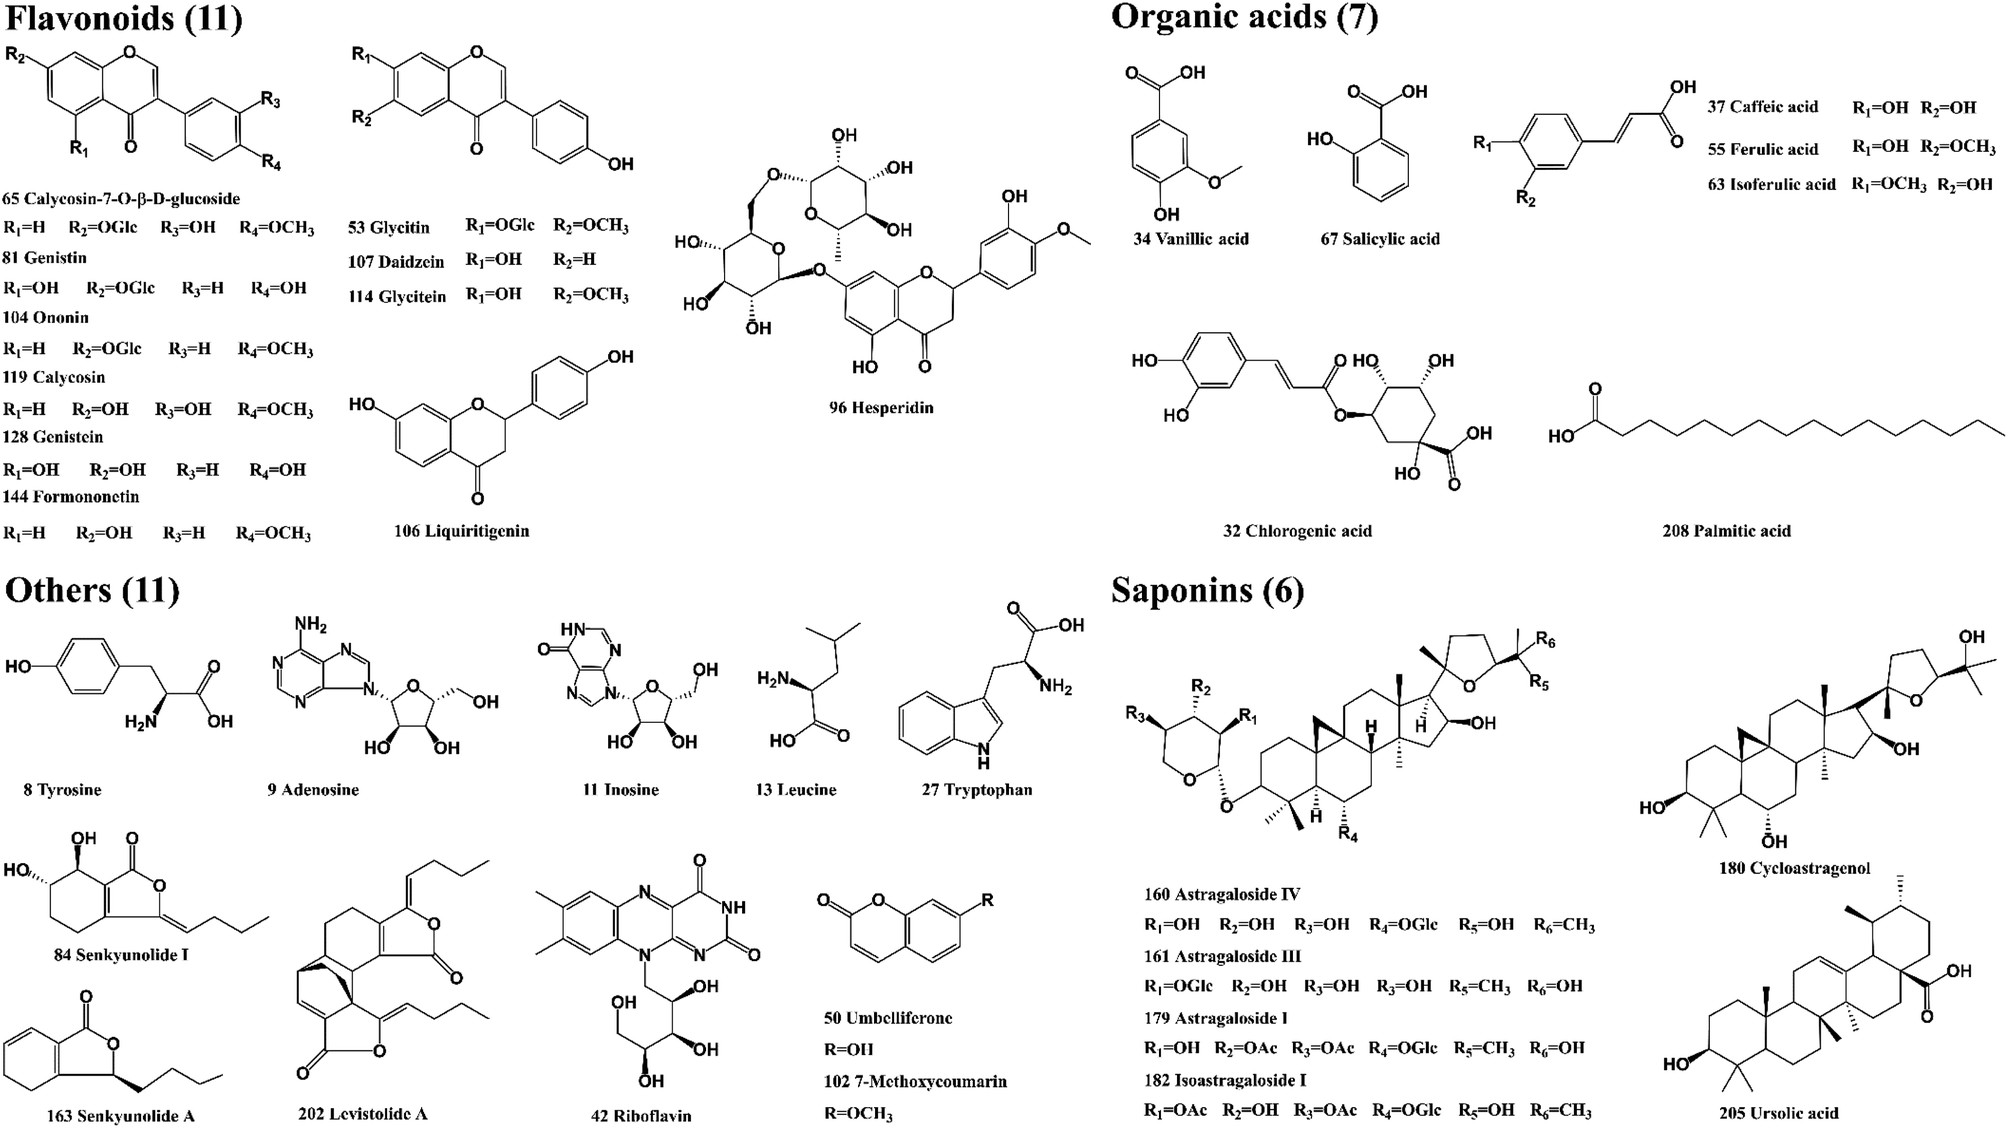 | ||
| Fig. 2 The chemical structures of 35 reference standards in DBD. | ||
2.2. Preparation of DBD and standard solutions
HQ (500 g) and DG (100 g) were mixed together and immersed into water (1:8, w/v) for 2 h, then extracted three times with boiled water, which the drug–water ration (w/v) and extract time were 1:8 and 2 h, 1:6 and 1.5 h, 1:6 and 1.5 h, respectively, and filtered through gauze. The filtrates were combined and concentrated to 2.0 g mL−1 under reduced pressure at 60 °C. The DBD extract was diluted to 0.5 g mL−1 with methanol, then centrifugated at 12000 rpm for 10 min and filtered through a 0.22 μm syringe filter before analysis.
All the reference standards were accurately weighted and dissolved in methanol at a concentration of 1 mg mL−1. Appropriate amounts of standards were combined to obtain the mixed standard solution, which was centrifuged at 12000 rpm for 10 min before analysis.
2.3. Animals and drug administration
Six female Sprague-Dawley rats (weighing 200 ± 20 g) were obtained from Shanghai Sippr-BK Laboratory Animal Co., Ltd (Shanghai, China). All rats were raised under standard conditions of humidity (50% ± 10%), temperature (25 ± 2 °C) and light (12 h light/12 h dark cycle) and fed with standard laboratory water and food. The rats were acclimated to the laboratory for one week before the experiment and were fasted with free access to tap water for 12 h before administration. All animal procedures were performed in accordance with the Guidelines for Care and Use of Laboratory Animals of Naval Medical University and approved by the Animal Ethics Committee of Naval Medical University.All rats were randomly divided into two groups, containing control group and DBD dosed group (three rats in each group). DBD was diluted with 0.5% carboxymethyl cellulose sodium and orally administered to rats at a dose of 30 g kg−1 for the DBD group. An equivalent volume of 0.5% carboxymethyl cellulose sodium was administered to the control group. The blood samples were collected from the hepatic portal vein at 1 h after oral administration and centrifuged at 4000 rpm for 10 min at 4 °C. The obtained supernatant was stored at −80 °C prior to analysis.
2.4. Preparation of serum samples
Serum samples from the same group were combined for prototype components and exogenous metabolites identification. Four equal volumes of methanol were added to 200 μL of the serum sample and vortexed for 5 min to precipitate the proteins. After centrifugation at 12000 rpm for 5 min at 30 °C, the supernatant was transferred to another tube and then evaporated to dryness under vacuum at 30 °C. The residue was redissolved with 100 μL of methanol through ultrasonication and vortex, and then centrifuged at 12000 rpm for 10 min at 4 °C.
2.5. UPLC-Q-TOF-MS analysis conditions
Chromatographic analysis was performed with an ACQUITY UPLC I-class system (Waters, Milford, MA, USA) equipped with a binary solvent delivery system, an autosampler, a degasser and a thermostatifc column compartment. An ACQUITY HSS T3 column (2.1 mm × 100 mm, 1.8 μm, Waters, Milford, MA, USA) was chosen for chromatographic separations. The mobile phase consisted of solvent A (0.1% formic acid in water) and solvent B (acetonitrile) with the following gradient elution program: 0–8 min, 5–15% B; 8–15 min, 15–18% B; 15–25 min, 18–25% B; 25–37 min, 25–60% B; 37–42 min, 60–65% B; 42–47 min, 65–95% B; 47–49 min, 95–5% B; 49–50 min, 5% B. The injection volume was set at 1 μL, and the flow rate was 0.4 mL min−1.Mass spectrometric analysis was performed on a Waters SYNAPT G2-Si HRMS system with a ZSpray™ electrospray ion trap (ESI) source. The desolvation gas flow rate and cone gas flow rate were 800 L h−1 and 50 L h−1, respectively; source offset voltage, 80 V; cone voltage, 40 V; desolvation temperature, 400 °C, and source temperature was set to 120 °C; capillary voltage was 3.0 kV and 2.5 kV in positive and negative ion mode, respectively. Data acquisition was performed in positive and negative ionization modes by MSE and fast DDA modes, respectively. In the MSE mode, the acquired mass spectra range was set from 50 to 1500 Da, the scan time was set to 0.3 s, and the high collision energy was set to 40–70 eV, low collision energy was set to 6 eV. MS/MS fragments of all precursor ions can be produced in MSE mode. The energy of the dual dynamic collision in fast DDA mode was 10–40 V (50 Da) and 40–120 V (1500 Da). The MS and MS/MS scan rate was 0.2 s. The top 5 strong ions of the precursor ions were selected for MS/MS fragmentation.18 Leucine encephalin solution was used as a reference for calibration of the data in real-time, with the lock masses at m/z 556.2771 in positive ion mode and m/z 554.2615 in negative ion mode, respectively, at a concentration of 200 pg mL−1.
2.6. Compound database construction
By searching the literature and online databases including PubMed, CNKI, PubChem, TCMSP, TCMID and Chemical Book, a total of 815 chemical compounds related to DBD were summarized. A self-generated database of DBD compounds, including name, chemical structure, molecular formula, and precise molecular weight, was established. The database would be directly imported into the UNIFI library to better identify the chemical components of DBD.2.7. Data processing and analysis
Data acquisition was operated using Masslynx™ V4.1 data collection software (Waters, Milford, USA) and analyzed by UNIFI™ V1.8 software (Waters, Milford, USA) and the GNPS platform. The data under MSE acquisition mode were analyzed by the UNIFI software. UNIFI conditions included adduct selection of ±H, +Na, +K, +HCOO and +Cl; retention time range, 0.5–50.0 min; mass accuracy tolerance at ±5 ppm, mass range 50–1500 Da. For 3D peak detection, peak intensities of high and low energies were greater than 500 and 100, respectively. Biotransformation reactions included desaturation, reduction, oxidation, dehydration, hydration, demethylation, glucosylation, glucuronidation, methylation, sulfation, glutathione conjugation, cysteine conjugation and acetyl cysteine conjugation. The fast DDA mass spectrometry data were converted into “mzXML” format and then uploaded to the GNPS platform. The GNPS parameters were set as follows: the precursor ion mass tolerance and the fragment ion tolerance were set at 2 Da and 0.05 Da, respectively. The cosine score with a value of more than 0.7, meanwhile, there were at least six matched peaks. A molecular network of DBD was created, and then a visualization was performed by Cytoscape 3.9.1 (https://www.cytoscape.org/).3. Results and discussion
In this study, chemical components of DBD in positive and negative ion modes were analyzed by UPLC-Q-TOF-MS. The MSE data were processed and analyzed using the UNIFI software to automatically match the compound fragment information and identify the known constituents with the compound database. The fast DDA mass spectrometry data were uploaded to the GNPS platform for analogous classification and structural annotation of the unknown components. As a result, a total of 207 chemical components, including 60 flavonoids, 38 saponins, 35 organic acids, 26 phthalides, 12 phenylpropanoids, 11 amino acids and 25 others were unambiguously identified or tentatively characterized by comparing their retention times (RT), fragmentation patterns with reference standards or previous literature. Among them, 35 compounds were definitively confirmed by comparison with reference standards. The representative base peak intensity (BPI) chromatograms and molecular networks were presented in Fig. 3 and S1.† Detailed information on the components in DBD, including peak number, RT, compound name, formula, mass error, fragment ions, classification and origin, are shown in Table S1.†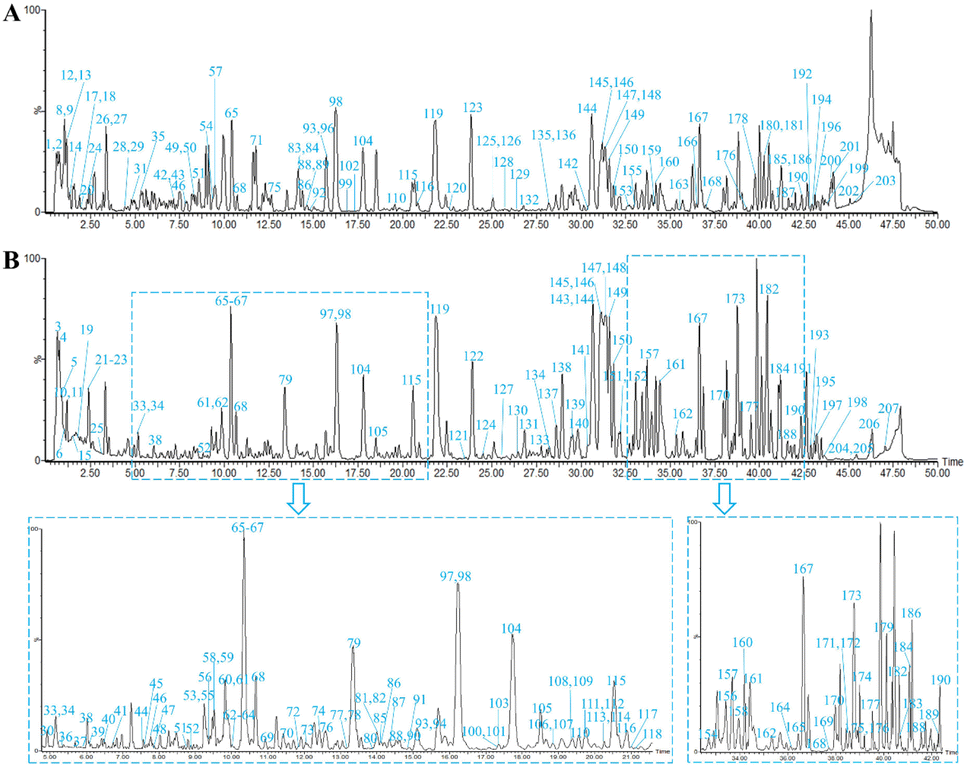 | ||
| Fig. 3 The base peak intensity (BPI) chromatograms of DBD in positive (A) and negative (B) ion modes. | ||
3.1. Identification of known components in DBD
Compound 65 produced a quasi-molecular ion at m/z 447.1293 [M + H]+ in the positive ion mode. The MS/MS spectra showed a fragment ion at m/z 285.0830, which was attributed to the neutral losses of glucoside, and then subsequently produced a fragmentation pathway analogous to compound 119. Firstly, the loss of CH3 from the B-ring at m/z 285.0830 yields the product ion at m/z 270.0594, which continues with the loss of OH (17 Da) to produce the fragment ion at m/z 253.0552. The ion at m/z 253.0552 was apt to experience the successive losses of CO and produced the main fragment ions at m/z 225.0584 and m/z 197.0629, respectively. The product ion m/z 213.0621 can be explained by the direct loss of two molecules of CO at m/z 270.0594. In addition, compounds 65 and 119 were also subjected to RDA cleavage to produce fragment ion at m/z 137.0267. By comparison with the reference standards and literature information, compounds 65 and 119 were finally identified as calycosin-7-O-β-D-glucoside and calycosin, respectively.23 The mass spectra and proposed fragmentation pathways were shown in Fig. 4.
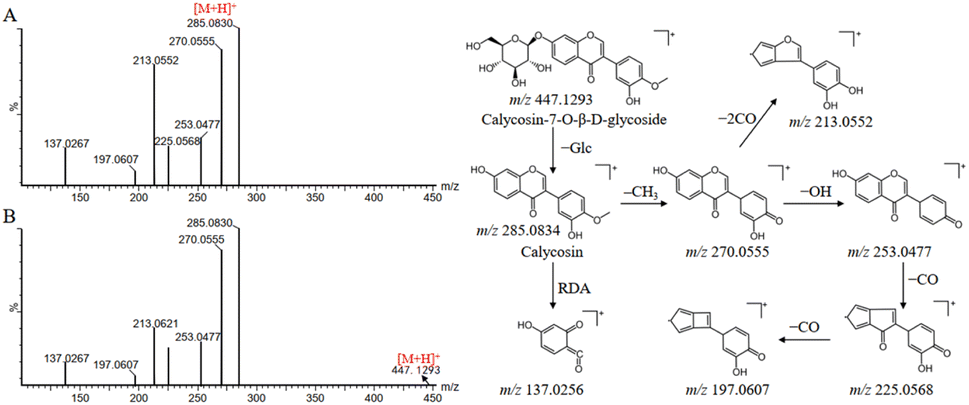 | ||
| Fig. 4 Mass spectra and possible fragmentation pathway of calycosin (A) and calycosin-7-O-β-D-glucoside (B) in positive ion mode. | ||
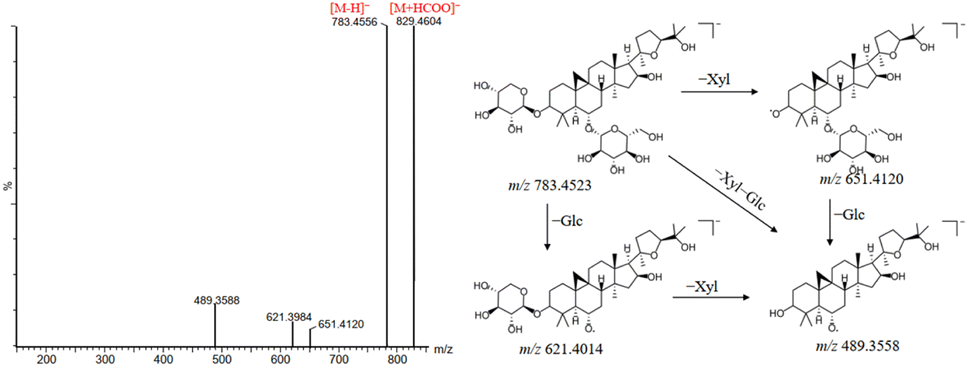 | ||
| Fig. 5 Mass spectra and possible fragmentation pathway of astragaloside IV in negative ion mode. | ||
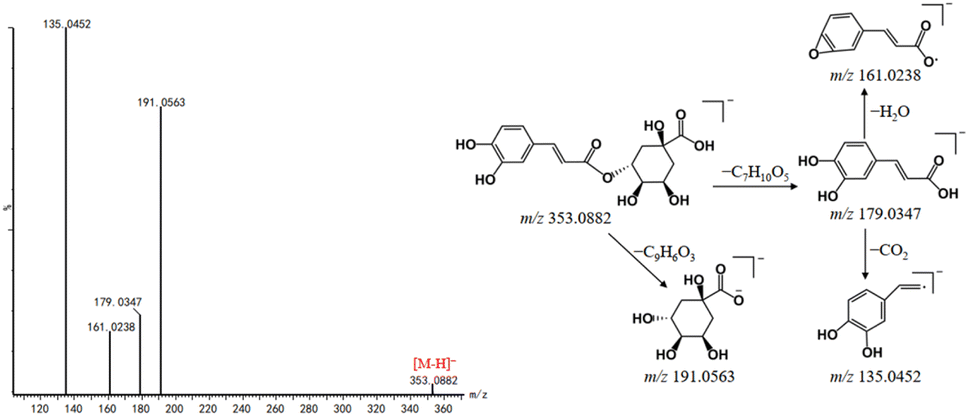 | ||
| Fig. 6 Mass spectra and possible fragmentation pathway of chlorogenic acid in negative ion mode. | ||
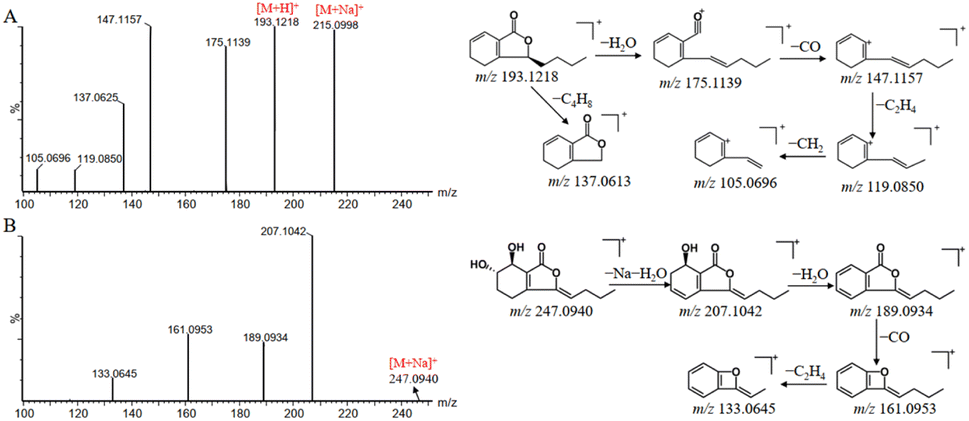 | ||
| Fig. 7 Mass spectra and possible fragmentation pathway of senkyunolide A (A) and senkyunolide I (B) in positive ion mode. | ||
3.2. Annotation of unknown compounds in DBD
On searching self-built and public databases, it was found that some nodes in the molecular network were not matched to known compounds, and which could be considered as unknown components. GNPS is able to quickly process fast DDA mass spectrometry data by creating molecular networks, so that the results can be visualized.10,35 In addition, the GNPS platform is able to utilize the similarity of adjacent nodes to rapidly predict new compounds, which reduces the duration of the analysis. The similarity is represented by the cosine value from 0 to 1, and the closer the cosine value is to 1, the higher the similarity of the mass spectra. 8 compounds in DBD, including 4 flavonoids, 3 lignans and 1 organic acid, were screened out and tentatively identified by neutral losses, characteristic fragment ions, and fragmentation behaviors of known compounds.Compounds of the same structural type are apt to undergo similar cleavage behavior, and tend to cluster together on the GNPS platform to facilitate analysis. Starting from a known compound, information about unknown compounds can be elucidated through molecular networks. For example, peak 99 (#593) was not assigned as a known compound by searching with compound database in UNIFI platform. Luckily, as is shown in Fig. 8A, the node at m/z 593 (peak 99) was adjacent to the known node at m/z 431 (peak 104), which was identified as ononin by the UNIFI platform, with the molecular formula of C22H22O9 [M + H]+ and the mass error of 3.3 ppm. The cosine value of the neighboring nodes was 0.93, suggesting the high similarity in their structures. In addition, the same fragment ions at m/z 269.0810, 254.0574, 237.0545, 226.0629 and 213.0910 (Fig. 8B) were both produced in peak 99 and 104, indicating that the two compounds have the same skeleton. The presence of fragment ion at m/z 269.0806 of peak 99 was due to the breakage of the glycosidic bond at the C-7 position. The molecular weight difference between peak 99 and 104 was 162 Da, which were presumed as the structure of the glucoside. Moreover, the flavonoids in DBD are mainly flavonoid O-glucosides, and compound 99 is also consistent with the fragmentation pattern of flavonoid O-glucosides.36,37 Thus, peak 99 can be tentatively presumed as ononin-Glc, with the formula of C28H32O14 [M + H]+ and the mass error of −3 ppm.
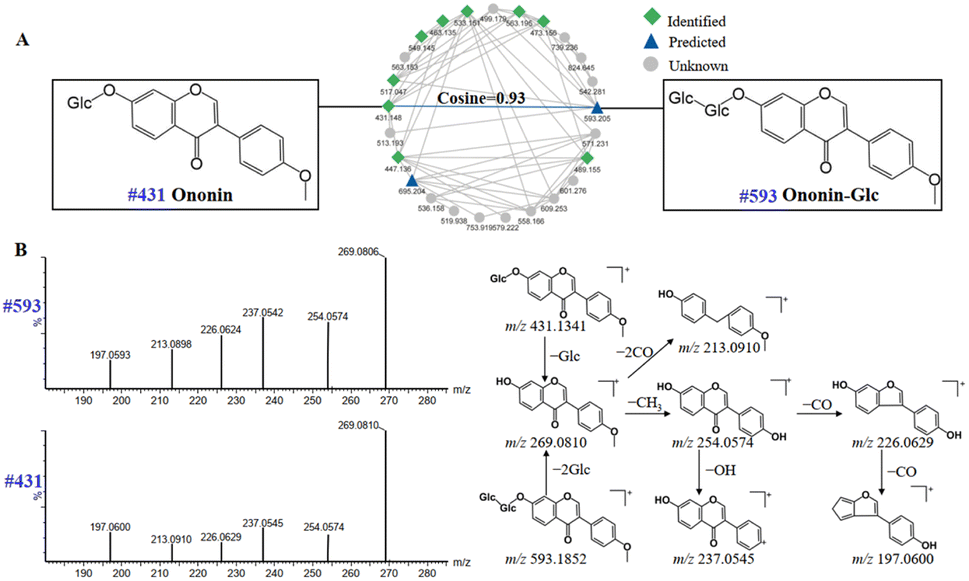 | ||
| Fig. 8 Molecular networks of flavonoids in positive ion mode of DBD (A); mass spectra and possible fragmentation pathway of nodes #431 and #593 (B). | ||
3.3. Identification of prototype components in serum
After the identification of chemical components in DBD, UPLC-Q-TOF-MS was performed to explore the potential absorbed prototypes in rat serum. The peaks appearing at the same position in the chromatograms of both the dosed rat serum and the DBD but not in the blank serum, were regarded as the prototype components. In total, 29 absorbed compounds were identified or tentatively characterized after oral administration of DBD. These prototype components can be classified into 14 flavonoids, 3 saponins, 2 phthalides, 3 organic acids and 7 other compounds based on the structural type, with detailed information listed in Table S2.† riboflavin (6), calycosin-7-O-β-D-glucoside (8), ononin (12), liquiritigenin (13), daidzein (14), glycitein (17), calycosin (18), genistein (19), formononetin (21), astragaloside IV (23), levistolide A (28) and ursolic acid (29) were confirmed by comparing mass spectral information and RT with reference standards. The prototype components have laid the basis for the further metabolite analysis of DBD.3.4. Identification of exogenous metabolites in serum
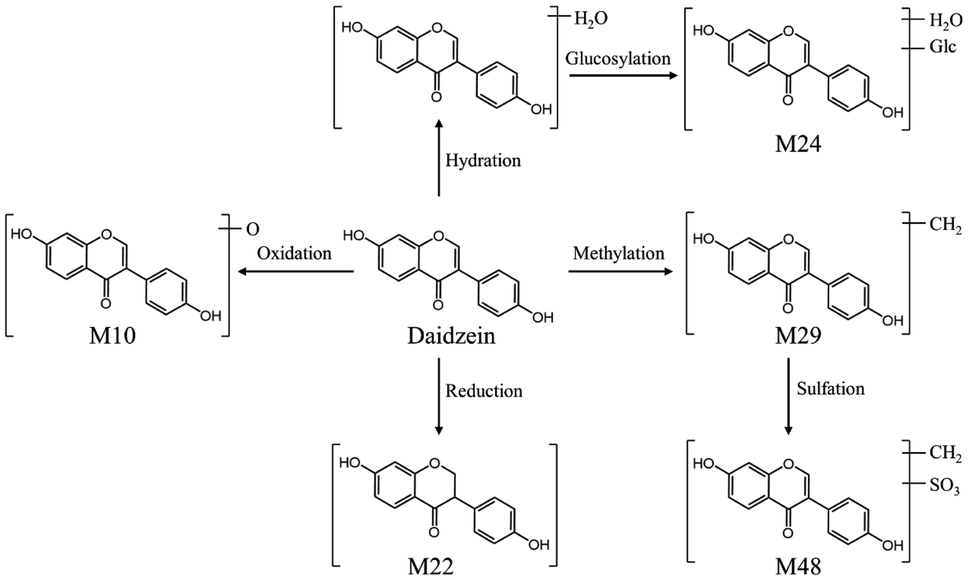
The peaks appeared in drug-containing serum samples, but not in blank serum, and were not screened out in DBD, which may be exogenous metabolites. It is particularly important to identify exogenous metabolites to elucidate the underlying material basis of TCM formulas. In this study, UNIFI™ software was applied to identify potential metabolites in rat serum after the oral administration of DBD. As a result, a total of 51 exogenous metabolites were characterized, which were transformed from 15 prototype components, mainly included flavonoids, saponins, and phthalides. The detailed information of exogenous metabolites is shown in Table S3.† It mainly underwent phase I metabolic pathways such as reduction, oxidation, hydrolysis, hydration, and phase II metabolic pathways such as methylation, sulfation, glucuronidation.After the oral administration of DBD, a total of 34 flavonoid-related metabolites were detected in rat serum, and the main metabolic pathways involved reduction, oxidation, desaturation, methylation, sulfation, glucuronidation. Take M10 as an example to illustrate the identification process of flavonoid-related metabolites. M10 had a precursor ion [M–H]− at m/z 269.0452, and characteristic aglycone ion at m/z 253.0531 suggesting that Daidzein is the prototype component of M10. The precursor ion of M10 was 16 Da less than that of daidzein, the characteristic fragments of M10 were similar to daidzein. Consequently, M10 was considered to be a metabolite formed by the metabolic reaction of oxidation of Daidzein based on its related mass spectrometry fragmentation pathway. However, due to the fact that the position of the flavonoid nucleus structure where oxygen atoms can be added is not unique, it is impossible to determine the exact location of oxidation. Four other metabolites related to Daidzein were identified in the same manner. The proposed metabolic pathways of daidzein in rat serum are shown in Fig. 9.
 | ||
| Fig. 9 The possible metabolic pathways of daizein in rat serum. | ||
Saponins generally undergo a series of reactions in rats to increase their water solubility before being excreted through the urine or bile. And some saponins are also absorbed and metabolized as prototype components. There were a large number of saponins existed in DBD, but only seven saponin-related metabolites were detected in rat serum. The reason for this might be due to the high polarity of saponins, which are more difficult to be absorbed into the blood. The metabolic pathways of saponins in rats mainly included oxidation, reduction, methylation and sulfonation. M45 showed the [M + Na]+ ion at m/z 645.3973, which was 162 Da less than that of astragaloside IV. Based on the RT and the product ions at m/z 491.3715 [M + H–Glc–Rha]−, 473.3428 [M + H–Glc–Rha–H2O]−, and 455.3530 [M + H–Glc–Rha–2H2O]−, it was identified as a hydrolysis product of astragaloside IV.
Nine metabolites of phthalide and one metabolite of organic acid were also detected in rat serum. The phthalides could conduct a serious of metabolic reactions in vivo, such as oxidation, reduction, glucuronidation, acetyl cysteine conjugation and glutathione conjugation. Comparing the exact molecular weight of M33 with that of butylphthalide, it was deduced as a glucuronidation product of the prototype. The mass spectra exhibited that the fragment ion at m/z 173.0927 [M + H–C6H8O6–H2O]+, 163.1179 [M + H–C6H8O6–CO]+, and 145.1005 [M + H–C6H8O6–H2O–CO]+, consistent with those of butylphthalide. Thus, M33 is a metabolite produced by the phase II metabolic pathway of butylphthalide. In addition, piscidic acid, a component of organic acid, was prone to take place hydration and methylation reactions.
4. Conclusion
In summary, a comprehensive method based on the combination of UPLC-Q-TOF-MS and various data processing methods was developed to analyze the chemical components of DBD and its metabolites. Integrate MSE mode and fast DDA mode to systematically profile the components of DBD. A total of 207 chemical components, including flavonoids, saponins, organic acids and phthalides were unambiguously or tentatively identified by UNIFI software and GNPS platform. Among them, 35 compounds were unambiguously confirmed by comparison with the reference standards. Furthermore, 80 components, including 29 prototype components and 51 exogenous metabolites of DBD, were detected in rat serum by UNIFI platform. The metabolic pathways of DBD in rat serum mainly included phase I reactions (reduction, hydration, desaturation, hydrolysis and oxidation) and phase II reactions (methylation, sulfation and glucuronidation). The results in this work could contribute to a more comprehensive understanding of the pharmacodynamic material basis of DBD and provide helpful chemical information for in-depth pharmacology and mechanistic researches. More importantly, the established analytical strategy could be applied to characterize the chemical components and metabolites of other TCM formulas.Author contributions
Xianpeng Zu and Jixiang He designed the study and reviewed the manuscript. Yanhui Lv, Xike Xu and Jishun Yang performed the experiments and wrote the manuscript. Yuan Gao, Jiayun Xin and Wei Chen participated in data collection. Li Zhang, Jiali Li, Jie Wang, Yanping Wei and Xintong Wei were involved in figures drawing. Xianpeng Zu and Jishun Yang supported fund assistance. All authors read and approved the final manuscript.Conflicts of interest
The authors declare that there is no conflict of interest.Acknowledgements
The work was supported by the National Natural Science Foundation of China (82004215, 82173704, 82141203, 82003624, 82004003), the Key Research and Development Program of China (2022YFC3502000), Shanghai Municipal Health Commission Project (20204Y0326, 202140061), Shanghai Municipal Science and Technology Major Project (ZD2021CY001), Innovation Team and Talents Cultivation Program of National Administration of Traditional Chinese Medicine (ZYYCXTDD-202004), Three-year Action Plan for Shanghai TCM Development and Inheritance Program [ZY(2021-2023)-0401] and Sailing Program of Naval Medical University.Notes and references
- X. B. Qi, X. Y. Wang, T. F. Cheng, Q. Wu, N. Mi, X. Mu, X. Guo, G. Zhao, Z. Huang, J. Ye and W. Zhang, J. Sep. Sci., 2019, 42, 2748–2761 CrossRef CAS PubMed.
- S. Z. Li, S. Liu, Z. F. Pi, F. Song, Y. Jin and Z. Liu, J. Pharm. Biomed. Anal., 2017, 138, 289–301 CrossRef CAS PubMed.
- X. M. Mu, X. K. Xu, X. Guo, P. Yang, J. Du, N. Mi, T. Cheng, L. Lu, X. Qi, X. Wang, J. Ning, W. Zhang and J. Ye, J. Chromatogr. B: Anal. Technol. Biomed. Life Sci., 2019, 1108, 54–64 CrossRef CAS PubMed.
- W. J. Miao, Y. Hu, L. Jia, C. X. Zhang, W. Z. Yang, P. Zhang and D. A. Guo, Chin. J. Nat. Med., 2018, 16, 791–800 CAS.
- Y. H. Lv, X. K. Xu, Y. P. Wei, Y. Shen, W. Chen, X. Wei, J. Wang, J. Xin, J. He and X. Zu, Metabolites, 2023, 13, 204 CrossRef CAS PubMed.
- L. L. Hong, Y. Zhao, C. Y. Yang, G. Z. Li, H. S. Wang, W. D. Chen, X. Y. Cheng and L. Liu, J. Sep. Sci., 2021, 44, 4327–4342 CrossRef CAS PubMed.
- A. Kang, J. L. Jiang, Q. Li, X. Sheng, Y. Chen, J. Tan, L. Li, W. Shen, D. Tang, H. Cheng and D. Sun, J. Sep. Sci., 2022, 45, 1600–1609 CrossRef CAS PubMed.
- W. Z. Yang, J. X. Zhang, C. L. Yao, S. Qiu, M. Chen, H. Pan, X. Shi, W. Wu and D. Guo, J. Pharm. Biomed. Anal., 2016, 128, 322–332 CrossRef CAS PubMed.
- L. Xu, M. Y. Li, H. F. Zhou, B. Zhang, Z. Zhang, N. Han and T. Wu, J. Sep. Sci., 2019, 42, 1174–1193 CrossRef CAS PubMed.
- Y. H. Zhang, H. B. Lei, J. F. Tao, W. L. Yuan, W. D. Zhang and J. Ye, RSC Adv., 2021, 11, 15546–15556 RSC.
- C. Ma, Y. H. Zhang, X. X. Dou, L. Liu, W. Zhang and J. Ye, RSC Adv., 2022, 12, 27781–27792 RSC.
- Q. Lyu, T. H. Kuo, C. Sun, K. Chen, C. C. Hsu and X. Li, Food Chem., 2019, 282, 9–17 CrossRef PubMed.
- K. Song, J. H. Oh, M. Y. Lee, S. G. Lee and I. J. Ha, Molecules, 2020, 25, 2636 CrossRef CAS PubMed.
- Y. T. Liu, Y. H. Ju and X. M. Qin, J. Pharm. Pharmacol., 2021, 73, 767–777 CrossRef PubMed.
- W. C. Chang, C. C. Yen, C. P. Cheng, Y. T. Wu and M. C. Hsu, Pharm. Biol., 2020, 58, 545–552 CrossRef CAS PubMed.
- F. X. Yang, Y. Wang, P. F. Xia, R. J. Yang, Y. X. Wang, J. Zhang, Q. Fan and L. Zhao, China J. Chin. Mater. Med., 2021, 46, 2677–2685 Search PubMed.
- H. D. Zhao, M. Qi, Y. Gong, H. Chen, D. Wang, J. Fan, Y. Wang and J. Wang, J. Sep. Sci., 2023, 46, e2200794 CrossRef PubMed.
- H. B. Lei, Y. H. Zhang, X. P. Zu, J. Ye, Y. Liang, T. Cheng and W. Zhang, Anal. Bioanal. Chem., 2021, 413, 129–139 CrossRef CAS PubMed.
- R. Ferreira, S. J. Greco, M. Delarmelina and K. C. Weber, Electrochim. Acta, 2015, 163, 161–166 CrossRef CAS.
- J. Z. Qian, B. C. Wang, J. Fan, J. Tan and X. Yang, J. Struct. Chem., 2015, 56, 338–345 CrossRef CAS.
- H. M. Abdallah, F. M. Almowallad, A. Esmat, I. A. Shehata and E. A. Abdel-Sattar, Phytochem. Lett., 2015, 13, 74–80 CrossRef CAS.
- D. Gao, B. J. Wang, Z. P. Huo, Y. He, N. Polachi, Z. Lei, X. Liu, Z. Song and L. W. Qi, J. Pharm. Biomed. Anal., 2017, 140, 301–312 CrossRef CAS PubMed.
- T. F. Cheng, J. Ye, H. L. Li, H. Dong, N. Xie, N. Mi, Z. Zhang, J. Zou, H. Jin and W. Zhang, RSC Adv., 2019, 9, 8714–8727 RSC.
- H. S. Liu, F. Huang, H. Wu, B. Zhang, H. Shi, X. Wu and Z. Hu, Int. J. Mol. Med., 2017, 40, 1270–1276 CrossRef CAS PubMed.
- C. Huang, D. J. Xu, Q. Xia, P. P. Wang, C. Rong and Y. Su, J. Pharm. Pharmacol., 2012, 64, 1741–1750 CrossRef CAS PubMed.
- R. Liu, H. Q. Jiang, Y. Tian, W. Zhao and X. Wu, J. Surg. Res., 2016, 200, 315–323 CrossRef CAS PubMed.
- B. Wang and M. Z. Chen, Arch. Pharmacal Res., 2014, 37, 793–802 CrossRef CAS PubMed.
- X. D. Cheng and M. G. Wei, Molecules, 2014, 19, 18881–18896 CrossRef PubMed.
- W. Y. Gao, C. H. Wang, L. Yu, T. Sheng, Z. Wu, X. Wang, D. Zhang, Y. Lin and Y. Gong, BioMed Res. Int., 2019, 2019, 6769789 Search PubMed.
- S. Huang, L. L. Wang, N. N. Xue, C. Li, H. H. Guo, T. K. Ren, Y. Zhan, W. B. Li, J. Zhang, X. G. Chen, Y. X. Han, J. L. Zhang and J. D. Jiang, Theranostics, 2019, 9, 6745–6763 CrossRef CAS PubMed.
- E. Hermawati, N. Arfian, M. Mustofa and G. Partadiredja, Eur. J. Neurosci., 2020, 51, 651–669 CrossRef PubMed.
- R. Mi, X. F. Li, Z. Zhang, T. F. Cheng, S. S. Tian, X. K. Xu, Y. H. Zhang, W. L. Yuan, J. Ye, L. Liu and X. R. Zhang, J. Sep. Sci., 2020, 43, 4263–4280 CrossRef CAS PubMed.
- N. Mi, T. Cheng, H. Li, P. Yang, X. Mu, X. Wang, X. Zu, X. Qi, X. Guo, J. Ye and W. Zhang, J. Pharm. Biomed. Anal., 2019, 164, 70–85 CrossRef CAS PubMed.
- X. Q. Lei, G. Li, L. Cheng, X. L. Wang and F. Y. Meng, J. Pharm. Biomed. Anal., 2018, 154, 123–137 CrossRef CAS PubMed.
- T. F. Cheng, Y. H. Zhang, J. Ye, H. Z. Jin and W. D. Zhang, J. Pharm. Biomed. Anal., 2020, 184, 113197 CrossRef CAS PubMed.
- X. X. Li, L. Qu, Y. Z. Dong, L. F. Han, E. W. Liu, S. M. Fang, Y. Zhang and T. Wang, Molecules, 2014, 19, 18850–18880 CrossRef PubMed.
- Y. Su, L. Tao, X. L. Zhang, X. J. Sheng, Q. Li, W. Y. Fei, T. Yin, A. Kang, J. Y. Aa and G. J. Wang, J. Pharm. Biomed. Anal., 2023, 222, 115086 CrossRef CAS PubMed.
Footnotes |
| † Electronic supplementary information (ESI) available. See DOI: https://doi.org/10.1039/d3ra04419j |
| ‡ Yanhui Lv, Xike Xu and Jishun Yang contributed equally to this work. |
| This journal is © The Royal Society of Chemistry 2023 |