 Open Access Article
Creative Commons Attribution 3.0 Unported Licence
Enhanced cycle life of starter lighting ignition (SLI) type lead–acid batteries with electrolyte modified by ionic liquid†
Paweł
Kędzior
 a,
Waldemar
Rzeszutek
 a,
Jarosław
Wojciechowski
 *b,
Andrzej
Skrzypczak
b and
Grzegorz
Lota
 *bc
*bc
aPPUH Autopart Jacek Bąk sp. z o.o., Kwiatkowskiego 2A, Mielec 39-300, Poland
bInstitute of Chemistry and Technical Electrochemistry, Poznan University of Technology, Berdychowo 4, Poznań 60-965, Poland. E-mail: grzegorz.lota@put.poznan.pl; jaroslaw.g.wojciechowski@put.poznan.pl
cŁukasiewicz Research Network – Institute of Non-Ferrous Metals Division in Poznan, Central Laboratory of Batteries and Cells, Forteczna 12, 61-362 Poznan, Poland
First published on 7th August 2023
Abstract
The aim of the presented work was to improve the lifetime of lead–acid SLI (starting, lighting and ignition) batteries through electrolyte modification with ionic liquids. The conducted research included the synthesis and determination of the influence of di(hexadecyldimethylammonium) and di(octadecyldimethylammonium) sulphates on the basic parameters (capacity, cranking performance) of the starter battery as well as parameters affecting its lifetime (dynamic charge acceptance, corrosion, water consumption). It has been shown that the addition of these compounds increases corrosion resistance and reduces water consumption, resulting in an increase in cyclic durability by up to 36%. The improvement is associated with the absorption of ionic liquid molecules into the mass of lead(II) sulphate, which was confirmed by physicochemical and electrochemical studies.
1 Introduction
Chemical power sources play a significant role in everyday life and various industrial sectors. Nowadays, it is increasingly difficult to find a device that does not require power or support from an electrical energy source. This translates into higher requirements and technological advancements in the construction of cells and batteries (accumulators).1 Despite the dynamic development of lithium-ion battery technology in recent years, lead–acid batteries are still dominant in the market due to their low raw material costs, low energy consumption during production, high recycling efficiency, and reliable system operation.2–4 Lead–acid batteries are mostly utilized in the automotive industry in the form of starting, lighting, and ignition (SLI) batteries types.5 However, with the current rapid development of fully electric vehicles, they can also serve as auxiliary batteries, providing safety features.6 This requires specially designed high-energy devices with high cyclic durability.7–9A significant part of the current research on lead–acid batteries focuses on various additives for the negative and positive active electrode masses, as well as for the electrolyte. In the case of the negative electrode, commonly used additives include lignosulfonates, barium sulphate, and carbon in various allotropic forms.10 Carbon additives are currently the most intensively researched.11 In the case of the electrolyte, phosphoric acid and sodium sulphate are often used.12,13 There are also literature reports on the effects of surfactants and ionic liquids.14–26 The electrolyte is one of the active materials of the lead–acid battery and comes into contact with all elements of the system. Modifying its composition can significantly affect the utilization of the active materials in both the negative and positive electrodes, as well as reduce the internal resistance of the entire device. Additives used in the electrolyte should meet a number of requirements due to the highly severe environment. First and foremost, they must be electrochemically, chemically, and thermally stable in concentrated sulfuric acid (VI) under the conditions of production and operation of the lead–acid battery. Ionic liquids, which are defined as salts with melting temperatures below 373 K, fulfill these requirements.27 Below the melting point, these compounds are a liquids consisting only of ions. Due to their low vapor pressure and high thermal and chemical stability, ionic liquids are considered as environmentally friendly. This is a very wide group of compounds that has found application in most branches of electrochemistry. A particularly large share is visible in chemical power sources.28,29 In the case of lead–acid batteries, Rezaei et al. found that different ammonium bisulphates affects the stability of the electrolyte and inhibits the phenomenon of electrochemical corrosion of current collectors.16–18 Additionally, it has been shown that the observed effects depend on the concentration of the ionic liquid and the number of branches and length of alkyl substituents.19 However, in some cases, the authors identified negative effects of ionic liquid additives, such as the formation of larger crystals of lead(II) sulphate and an increase in the rate of corrosion phenomenon.20 A significant effect of the addition of ammonium ionic liquids to the electrolyte on the hydrogen evolution potential was also conformed.21 Deyab et al. obtained a synergistic effect of using the phosphate anion and the imidazolium cation. An increase in battery capacity was observed together with the simultaneous inhibition of corrosion of current collectors and the inhibition of hydrogen gas evolution.22 Studies on the effect of the addition of ionic liquid with polydiallyldimethylammonium cation and bisulphate anion also showed an increase in capacity and a decrease in internal resistance, as well as a significant decrease in the corrosion rate of the positive electrode current collector and an improvement in the electrochemical stability of the electrolyte. Similar effects were also observed for diallyldimethylammonium, hexyldimethylammonium, and hexyltrimethylammonium sulphates, with the greatest effect observed for the polymeric ionic liquid.23 Kopczyński et al. estimated the dependence of electrolyte stability and corrosion rate of battery current collectors on the length of the alkyl chain in alkyl trimethylammonium bisulphates and sulphates.24 However, it was noted that the practical application of the investigated ionic liquids in the presented concentrations is not possible due to the intense foaming effect.25 Additionally, dimethylalkylammonium sulphate additives with alkyl substituents ranging from 4 to 16 carbon atoms in the chain were also studied. Based on this, it was found that the presence of dimethylalkylammonium ionic liquid in the positive electrode active mass leads to an increase in capacity during cyclic operation, a decrease in internal resistance, inhibition of corrosion processes, and an increase in self-discharge of the battery.26
The aim of the work is to assess the effect of the addition of ammonium ionic liquids to the electrolyte solution on the cyclic durability of SLI type lead–acid batteries. The possibility of practical application of ionic liquids in the production of batteries was taken into account. The lifetime of the battery system is significantly affected by the corrosion of the positive electrode current collectors, charge acceptance and water consumption.9 The influence of ionic liquids on these parameters was estimated using DC and AC electrochemical techniques. In addition, the surfaces of the individual elements of the battery were also characterized by physicochemical tests. The presented results are a direct response to the main challenges faced by SLI systems.
2 Experimental
2.1. Ionic liquids selection, synthesis and physicochemical analysis
Two different compounds with the following formulas were obtained: 2[(CH3)2HNC16H33]+ SO42− (di(hexadecyldimethylammonium) sulphate) and 2[(CH3)2HNC18H37]+ SO42− (di(octadecyldimethylammonium) sulphate). Ionic liquids selection, reagents for synthesis, synthesis and physicochemical analysis (NMR, elemental and thermal) procedures are given in detail in ESI.†2.2. Weight loss corrosion test of current collectors
The cell for corrosion testing (weight loss method) consisted of two electrodes connected to the negative terminals and a Pb–Ca–Sn–Al alloy polarized anodically (positive terminal). The negative electrodes were placed on both sides of the positive electrode. They are Pb–Ca–Al and Pb–Ca–Sn–Al alloys, respectively. All of the electrodes were a grids produced by Autopart company using the expanded metal technology. The test cell was filled with an electrolyte with the addition of ionic liquid in concentrations of 0.1, 0.3, and 0.5 g L−1. The range of tested concentrations was reduced due to the limited solubility of the ionic liquid in a 37.5 wt% sulfuric acid solution. The corrosion of the grid in the reference electrolyte, without the addition of ionic liquid, was also examined. The electrodes were polarized using the galvanostatic technique with a current density of 6 mA cm−2 for 10 days without a voltage limit. The acid temperature was maintained at 75 ± 2 °C. After exposure to the highly corrosive environment, the grids were etched with a solution of sodium hydroxide, hydrazine, and mannitol to remove the corrosion products layer. The weights of the grids were checked before and after the corrosion test.2.3. Production of SLI type lead–acid batteries
All production stages were carried out in the Autopart company. Grids for positive and negative electrodes were obtained by the expanded metal method. For both electrodes, lead alloys identical to those from weight loss method studies, were used. The preparation of active masses, pasting of grids, plate curing, and assembly were carried out according to the standard procedures of the company. The battery cells were filled with a 33 wt% sulfuric acid solution with the ionic liquids additives at concentrations of 0.1, 0.3, and 0.5 g L−1. Reference cells (without ILs) were also filled with the same electrolyte. The resulting batteries were subjected to formation process using the Autopart company algorithm. This induce sulfuric acid concentration increase to 37.5 wt%. The battery specifications are shown in Table 1.| Parameter | Value |
|---|---|
| Voltage | 12 V |
| Nominal capacity Cn | 55 A h |
| Electrolyte density | 1.28 g cm−3 |
2.4. Battery tests
The battery tests were carried out in accordance with the European standards for starter batteries EN 50342:1 and EN 50342:6.30,31 The procedure sequences for each battery are presented in Table 2 and following subsections, while some of the detailed explanations are given in the ESI.† The tests were performed using battery testers DIGATRON UBT30-0/18-5M, DIGATRON UBT 10-18-64 HD, and DIGATRON HEW2000-12. Prior to each test, all batteries were charged in a water bath at a temperature 25 °C for 24 hours with a current 13.75 A, i.e. five times the nominal current In with a voltage limit 16.00 V. The use of nominal current values is also explained in the following subsections, ESI† and in Table 3, depicting required battery parameters.30,31| Stage | Test | Battery no | ||||
|---|---|---|---|---|---|---|
| 1 | 2 | 3 | 4 | 5 | ||
| 1 | Pre-testing charging | × | × | × | × | × |
| 2 | Capacity check | × | × | × | × | × |
| 3 | Cranking performance | × | × | × | × | × |
| 4 | Plate surface analysis | × | ||||
| 5 | Dynamic charge acceptance (DCA) | × | ||||
| 6 | Corrosion resistance | × | ||||
| 7 | Water consumption | × | ||||
| 8 | Cyclic durability at 50% depth of discharge (DoD) | × | ||||
| Parameter | Value |
|---|---|
| Effective capacity Ce (≥0.95Cn), (20 hour capacity C20) | ≥ 52.25 A h |
| Cranking current (CC) | 550 A |
| Water loss | ≤ 8 g A−1 h−1 (42 days) |
| Corrosion test | ≥ 4 unit |
| Cycle life (50% DoD) | ≥ 80 cycles |
| DCA | ≥ 0.1 A A−1 h−1 |
 | (1) |
As a result, I20 = 2.75 A. The tests were conducted in a water bath at a temperature of 25 °C. The C20 capacity was calculated using the formula:
| C20 = t × I20 | (2) |
 | (3) |
 | (4) |
As a result, Crch = 29.7 A h. Charging was carried out for a maximum 5 hours with a current equal to Idch and a voltage limit 15.6 V. If CR was not reached, the batteries were charged additionally for a maximum 1 hour with a current I20 without a voltage limit until CR was reached. After the specified charging time or after delivering a charge of 29.7 A h, the next cycle started. If the voltage during discharge dropped below 10.0 V, the test was interrupted and the number of cycles was recorded.
2.5. Three-electrode electrochemical studies
Electrochemical studies in three-electrode cell systems were performed in order to understand the nature of the phenomena occurring in the lead–acid battery. Therefore, an alloy composed of lead, calcium, aluminum and tin was used as the working electrode. This is the material, which was utilized for the production of positive current collectors (grids) of a previously tested lead–acid batteries. The counter electrode was made of lead (99.9%), while the reference was a mercury/mercurous sulphate electrode (Hg|Hg2SO4 in 1 M H2SO4). The lead alloy and lead were produced by Autopart Company. The tested electrode was in the shape of a disk with a surface area of 4.7 cm2. The surface of the counter electrode was doubled to ensure efficient charge transfer. Electrochemical measurements were carried out in a solution of sulfuric acid (37.5 wt%) with the addition of ammonium ionic liquids at a concentration of 0.5 g L−1. In order to stabilize open circuit potential (ocp), the samples were initially kept in the electrolyte solution in an open circuit conditions for 4 h. Then, electrochemical impedance spectroscopy (EIS) measurements were performed in the frequency range from 10 mHz to 100 kHz (amplitude ±10 mV vs. ocp). After that, the potentiodynamic polarization (PP) tests were carried out in the potential range of −250 mV to +250 mV vs. ocp. Electrochemical experiments were carried out at ambient conditions using a VMP3 BioLogic® multichannel potentiostat/galvanostat with an impedance test module and EC-Lab® software.3 Results and discussion
3.1. NMR, elemental and thermal analysis of ionic liquids
The results of NMR spectroscopy analysis for the investigated ionic liquids are presented below in the form of raw data, while graphs (Fig. S1–S12†) are provided in ESI.† For the compound di(hexadecyldimethylammonium) sulphate (marked as C16), peaks were recorded at the following concentration values (ppm): 1H NMR: 0.84–0.87 (t, 6H); 1.24–1.26 (m, 52H); 1.57–1.59 (m, 4H); 2.75 (s, 12H); 2.98–3.02 (m, 4H) and 13C NMR: 13.94; 22.11; 23.76; 25.90; 28.57; 28.74; 28.88; 29.00, 29.04; 29.09; 31.32; 42.28; 56.75. The results for di(octadecyldimethylammonium) sulphate (marked as C18) are presented as follows: 1H NMR: 0.84–0.87 (t, 6H); 1.19–1.24 (m, 60H); 1.54–1.58 (m, 4H); 2.70 (s, 12H); 2.92–2.96 (m, 4H) and 13C NMR (75 Hz, CDCl3): 14.00; 22.13; 23.99; 25.92; 28.56; 28.73; 28.85; 28.98, 29.07; 31.32; 42.28; 56.89.As it can be seen, the structures of both compounds were confirmed. Protons from alkyl substituents were recorded as signals in the range of 0.84 to 0.87 ppm for methyl groups. Protons in methylene groups at the end of the alkyl chain were identified as peaks between 1.19 and 1.26 ppm. Methylene groups in the β position to the nitrogen atom appeared as signals from 1.54 to 1.59 ppm, while protons in the α position were noted in the range of 2.92 to 3.02 ppm. Methyl groups directly substituted to the nitrogen atom were identified as high peaks in the range of 2.70 to 2.71 ppm.
The results of the elemental analysis for both compounds are also evaluated: C36H80N2O4S (M = 637.10 g mol−1): calcd: C = 67.87; H = 12.66; N = 4.40; found: C = 68.11; H = 12.89; N = 4.16; C40H88N2O4S (M = 685.15 g mol−1): calcd: C = 70.12; H = 11.76; N = 4.09; found: C = 70.51; H = 12.08; N = 4.39.
Thermal analysis of di(hexadecyldimethylammonium) and di(octadecyldimethylammonium) sulphates (Fig. 1(a and b)) confirmed that the compounds can be referred to as ionic liquids, since their melting temperatures were respectively 53.8 °C and 63.5 °C, which is below 100 °C. The temperatures at which a 5% sample mass loss was observed were respectively 154 and 160 °C. This is a value significantly above the temperature range of lead–acid battery operation. Therefore, the investigated compounds are thermally stable enough considering their potential future applications.
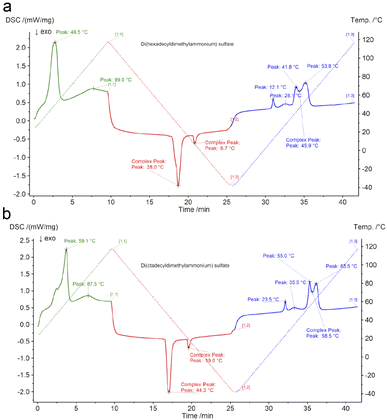 | ||
| Fig. 1 Thermal transition temperatures for (a) di(hexadecyldimethylammonium) sulphate and (b) di(octadecyldimethylammonium) sulphate. | ||
3.2. Weight loss corrosion test of current collectors
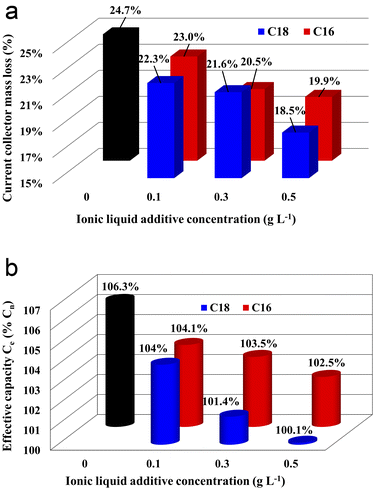
The results of corrosion tests of grids (current collectors) of lead–acid batteries are presented in Fig. 2(a). The mass loss of the current collector in the electrolyte without the ionic liquid additive was 10.3 g, which corresponds to 24.7% of the initial value, i.e. mass before the test. All samples with the ionic liquid showed reduced mass loss, and an increase in the concentration of the additive caused an increase in this effect. In the case of di(octadecyldimethylammonium) sulphate compound, a greater positive impact was demonstrated in comparison to di(hexadecyldimethylammonium) sulphate. Therefore, the sample immersed in the electrolyte with the addition of 0.5 g L−1 of C18 compound achieved the most satisfying value, lower by the c.a. 6.2% than the current collector immersed in the unmodified electrolyte. The reason for the obtained results is explained in detail in subsections 3.3.3. and 3.4 while describing the results of physicochemical, morphological and three-electrode electrochemical tests.3.3. Battery tests
Capacity check, cranking performance, DCA, corrosion resistance, water consumption, and cyclic durability tests were carried out in accordance with European standards.30,31 These standards are applicable to SLI batteries and their aim is to determine the requirements, essential functional characteristics, and appropriate test methods. Determining the operational parameters of the battery using standard tests is crucial in order to confirm the obtained effects.| Ionic liquid | Concentration, g L−1 | U 10s, V | t 6v, s |
|---|---|---|---|
| — | — | 7.85 | 101 |
| Di(hexadecyldimethylammonium) sulphate | 0.1 | 7.83 | 99 |
| 0.3 | 7.81 | 97 | |
| 0.5 | 7.79 | 96 | |
| Di(octadecyldimethylammonium) sulphate | 0.1 | 7.80 | 98 |
| 0.3 | 7.81 | 98 | |
| 0.5 | 7.77 | 97 |
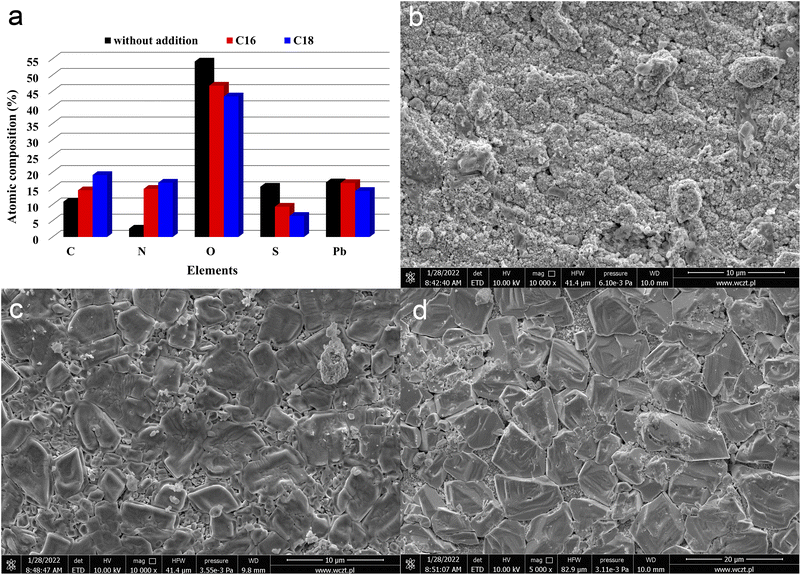 | ||
| Fig. 3 Chemical composition (a) and SEM images (b–d) of positive current collectors, derived from batteries containing unmodified (b) and ILs-modified ((c) C16, (d) C18) sulfuric acid electrolytes. Results represents the state after electrodes soaking, formation process and stages 1–3 of battery testing (Table 2). | ||
In addition to current collectors, an analysis of the surface of active electrode materials, i.e. NAM (Negative Active Mass) and PAM (Positive Active Mass), was also performed. SEM images of samples from tested batteries are shown in Fig. 4(a–f). The samples for analysis were taken from the same batteries as above, i.e. previously subjected to soaking, formation and stages 1–3 of testing (Table 2). It has been shown that the addition of both tested ionic liquids affects the morphology of only NAM surface (Fig. 4(a, c and e)). Therefore, it seems that the applied ionic liquids affect the morphology and physicochemical properties of lead oxidation reaction products, i.e. lead(II) sulphate. This is convergent with the above positive current collectors composition and morphology (Fig. 3(a–d)). Moreover, it was shown that the addition of both tested liquids does not cause any changes on the surface of PAM (Fig. 4(b, d and f)). Therefore, they do not influence reversible reaction of lead dioxide. Confirmation of the above conclusions and a broader analysis of the electrochemical phenomena were presented in the subsection describing the results of three-electrode electrochemical measurements.
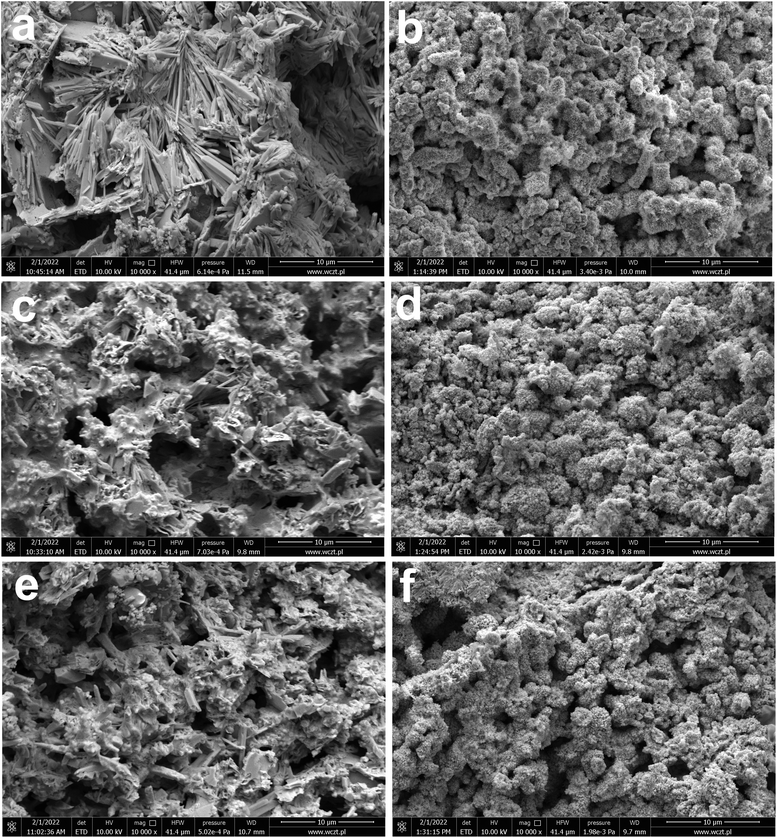 | ||
| Fig. 4 SEM images (a–f) of NAM (a, c and e) and PAM (b, d and f) from batteries containing unmodified (a and b) and ILs-modified ((c and d) C16, (e and f) C18) sulfuric acid electrolytes. Results represents the state after electrodes soaking, formation process and stages 1–3 of battery testing (Table 2). | ||
| Ionic liquid | Concentration g L−1 | Cycles | |
|---|---|---|---|
| No. | %Ref | ||
| — | — | 85 (Ref) | 100% |
| C16 | 0.1 | 99 | 116% |
| 0.3 | 102 | 120% | |
| 0.5 | 109 | 128% | |
| C18 | 0.1 | 110 | 129% |
| 0.3 | 113 | 133% | |
| 0.5 | 116 | 136% | |
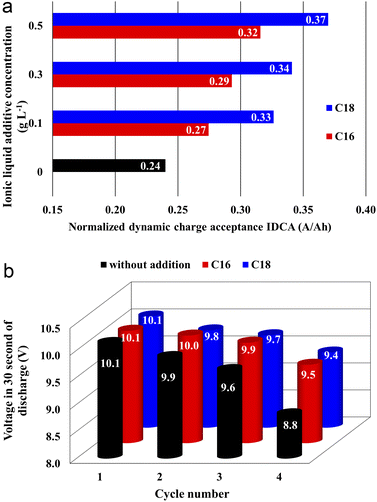
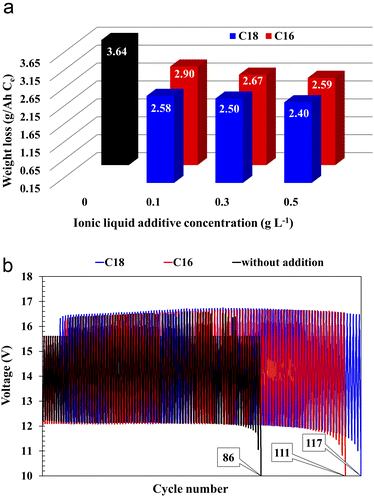
All batteries with the modified electrolytes indicated increased cyclic durability, and an increase in the concentration of the IL additive extends their lifetime (Table 5). Moreover, the battery with the highest C18 concentration reached 116 cycles, which is a 36% increase when compared to the reference system. Higher cyclic endurance of the electrolyte-modified devices is the result of the findings of all previous studies, i.e., increased corrosion resistance of the current collectors (3.2), increased DCA (3.3.4), and reduced water consumption (3.3.6).
3.4. Three-electrode electrochemical studies
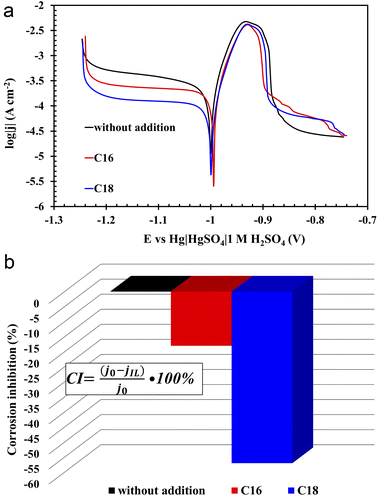
The three-electrode electrochemical analysis was carried out for three electrolyte solutions, i.e. sulfuric acid and sulfuric acid with the addition (0.5 g L−1) of the two above tested ionic liquids. This specific concentration had the most significant impact on improving the operating parameters of the batteries, therefore it was also chosen for three-electrode analysis. Based on the research on lead–acid batteries presented in the previous part of the manuscript, it should be mentioned that the increase in concentration causes a decrease in the solubility of the ionic liquid and formation of foam since these compounds act as a surfactants. Therefore, 0.5 g L−1 was the highest possible applied concentration.According to the PP curves (Fig. 7(a)), there are no significant differences between corrosion potentials (Ecorr), however, the corrosion current density values (jcorr) of the lead alloy samples in modified electrolytes significantly decreased (Fig. 7(a)). Therefore, it can be concluded that the presence of both tested compounds in the solution of sulfuric acid inhibits the rate of lead corrosion (CI – corrosion inhibition, Fig. 7(b)). The improvement of the corrosion resistance of the Pb–Ca–Sn–Al alloy is related to the absorption of ionic liquid molecules into the lead(II) sulphate layer that is formed in sulfuric acid. The presence of this layer was also demonstrated in physicochemical tests (SEM and EDS) (3.3.3) of the grids and NAM samples. It is worth noting that near the corrosion potential, oxidation and reduction reactions on the surface of the tested electrode proceed at the same rate. This is the rate determined by the slower process. In this case, it is a reduction, as indicated by the cathodic polarization curves. Their slopes are higher in relation to the ordinate axis than that of the anodic. In addition, the presence of ILs in the electrolyte solution inhibits the reduction reaction to a much greater extent than the oxidation one. The anodic current density values are slightly higher during lead polarization in the unmodified electrolyte than the values in the case of ILs-modified electrolytes. However, these differences are much more pronounced in the case of cathodic polarization. At this point, it is worth recalling once again that the polarization test was carried out after several hours of lead presence in a 37 wt% solution of sulfuric acid. The lead working electrode undergoes oxidation reactions while striving for the equilibrium state. Lead(II) sulfate is then formed. Considering the fact that the solution is concentrated, hydrogen ions are reduced, of course on the surface of the lead working electrode. The presence of ILs in the electrolyte means that during the anodic polarization of the electrode, the current density values in the potential range from −1 V to approx. −0.88 V are lower compared to the electrode in the unmodified electrolyte. As a result, less amount of the lead(II) sulfate is formed. Taking into account low conductivity values of PbSO4, the values concerning unmodified electrolyte rapidly decrease above the potential of ca. −0.88 V. The same applies to the phenomenon of cathodic polarization, and in this case lead(II) sulfate, which is already produced at the open circuit conditions plays a significant role. Certainly, it covers to a lesser extent the electrodes in solution with ILs. During the cathodic polarization, the rate of hydrogen evolution increases and the reduction of lead(II) sulfate to metallic lead begins. A lower amount of lead(II) sulfate on lead electrodes causes the inhibition of reduction reaction. Hence, the lower current density values are recorded during the cathodic polarization. Comparing the two ILs used, the compound containing 18 carbon atoms in the aliphatic chain is more effective at inhibiting lead corrosion than its lighter counterpart. The use of di(hexadecyldimethylammonium) sulphate resulted in a decrease in the corrosion current density by 18%, and for di(octadecyldimethylammonium) sulphate by 57%. The difference seems to be extremely significant. The above observations are the result of the increase in the length of the aliphatic chain, which may explain the slightly worse anti-corrosive properties of di(hexadecyldimethylammonium) sulphate, which is also evidenced by weight loss corrosion test of current collectors.
All of the above theses are confirmed by the EIS measurements, depicted in the form of Nyquist and Bode curves (Fig. 8(a and b)). The nature of the former indicates the presence of three time constants (semi-circles) appearing sequentially in the range from the highest to the lowest frequency values.36,37 The first semi-circle is by far the smallest for the lead sample in unmodified solution. The impedance test was performed 4 hours after immersion of the lead in the electrolyte solution at open circuit conditions. All this time, the alloy strongly corrodes in an acid environment, thus a mentioned layer of lead(II) sulphate is formed. There is also a layer of lead(II) oxide that forms before the alloy is placed in the electrolyte solution. In the case of modified electrolytes, molecules of ionic liquid containing long aliphatic chains are woven into the resulting sulphate and oxide layers. Therefore the resulting film has better anti-corrosive properties. The presence of ILs compounds on the surface of lead alloy is also confirmed by the previously presented results of physicochemical analysis. The first time constant in the Nyquist curves, which is almost imperceptible for the unmodified sample, concerns the lead(II) sulphate layer, which is in direct contact with the electrolyte solution. The next time constants are the lead(II) oxide and the surface of the lead alloy. It was noticed that in ILs containing electrolyte solution, there was a rapid increase in the diameter of the first time constant, which confirms the absorption of the ionic liquid molecules by the emerging lead(II) sulphate layer. The decrease of the corrosion phenomena rate in modified electrolyte is also indicated by the Bode curves, and more specifically the curves depicting dependence between impedance modulus and the frequency. In the range of the lowest frequency values, the highest impedance modulus values are characteristic for lead samples in solutions with the addition of ILs.
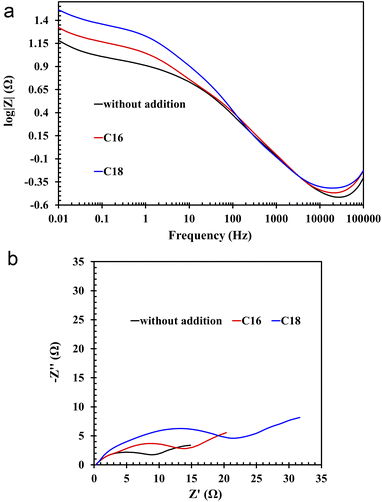 | ||
| Fig. 8 (a) Bode and (b) Nyquist plots of Pb–Ca–Sn–Al alloy in unmodified (without ILs addition) and ILs-modified 37 wt% sulfuric acid electrolyte. | ||
The absorption of ionic liquids causes an increase in the resistance of the entire system, which explains the lower values of capacity (Fig. 2(b)), voltage (Table 4) and discharged time (Table 4) at the beginning of the battery life in comparison to its counterpart without this additives. This does not change the fact that, in the long term, the presence of ionic liquids in the lead(II) sulphate layer inhibits the growth of this layer on the surface of the current collector of the positive electrode and the growth of the active mass on the negative electrode. This is an effect of anti-corrosive properties of the created layer, which is enriched with long-chain ionic liquid molecules. This is evidenced by the results of weight loss corrosion test, lead grid three-electrode corrosion measurements and battery tests, including DCA, cyclic durability, corrosion resistance and water consumption.
4 Conclusions
Electrochemical studies have confirmed the effectiveness of inhibiting the corrosion of Pb–Ca–Sn–Al alloy through modification of electrolyte composition with ionic liquids. Furthermore, the conducted research has also confirmed that the addition of these compounds to the electrolyte significantly affects the performance parameters of SLI batteries. The investigated ionic liquids are absorbed in the layer of lead(II) sulphate, formed on the surface of current collectors and negative electrode active masses. Therefore, electrochemical corrosion of current collectors and sulfation phenomena of negative electrodes are inhibited. Electrical tests of the batteries have shown that the addition of these compounds improves the dynamic charge acceptance capability, reduces water consumption, and inhibits the corrosion of current collectors. All of the above leads to an increase in their service life. The obtained results confirm that the addition of ammonium ionic liquids to the electrolyte in lead–acid battery is a promising direction for improving the durability of these devices.Author contributions
Paweł Kędzior: investigation, methodology, formal analysis, validation, writing – original draft. Waldemar Rzeszutek: writing – review & editing. Jarosław Wojciechowski: conceptualization, methodology, validation, writing – original draft, visualization. Andrzej Skrzypczak: investigation, resources. Grzegorz Lota: supervision, review & editing, project administration, funding acquisition.Conflicts of interest
There are no conflicts to declare.Acknowledgements
This work was supported by the Polish Ministry of Education and Science (Applied Doctorate Program, No. DWD/3/20/2019) and by the National Science Centre, Poland, grant number 2021/41/B/ST5/04047.References
- M. A. Miller, J. Petrasch, K. Randhir, N. Rahmatian and J. Klausner, in Thermal, Mechanical, and Hybrid Chemical Energy Storage Systems, ed. K. Brun, T. Allison and R. Dennis, Elsevier, London, 1st edn, 2020, ch. 5, pp. 249–292 Search PubMed.
- Y. Yu, J. Mao and X. Chen, Sci. Total Environ., 2020, 746, 140763 CrossRef CAS PubMed.
- Y. Zhao, O. Pohl, A. I. Bhatt, G. E. Collis, P. J. Mahon, T. Rüther and A. F. Hollenkamp, Sustainable Chem., 2021, 2, 167–205 CrossRef CAS.
- A. A. Kebede, T. Coosemans, M. Messagie, T. Jemal, H. A. Behabtu, J. Van Mierlo and M. Berecibar, J. Energy Storage, 2021, 40, 102748 CrossRef.
- E. Karden, in Lead-Acid Batteries for Future Automobiles, ed. J. Garche, E. Karden, P. T. Moseley and D. A. J. Rand, Elsevier, Amsterdam, 1st edn, 2017, ch. 1, pp. 3–25 Search PubMed.
- J. Albers and E. Meissner, in Lead-Acid Batteries for Future Automobiles, ed. J. Garche, E. Karden, P. T. Moseley and D. A. J. Rand, Elsevier, Amsterdam, 1st edn, 2017, ch. 6, pp. 185–211 Search PubMed.
- M. Gelbke and C. Mondoloni, in Lead-Acid Batteries for Future Automobiles, ed. J. Garche, E. Karden, P. T. Moseley and D. A. J. Rand, Elsevier, Amsterdam, 1st edn, 2017, ch. 5, pp. 149–184 Search PubMed.
- K. Nakamura, M. Shiomi, K. Takahashi and M. Tsubota, J. Power Sources, 1966, 59, 153–157 CrossRef.
- J. Yang, C. Hu, H. Wang, K. Yang, J. B. Liu and H. Yan, Int. J. Energy Res., 2016, 41, 336–352 CrossRef.
- D. Pavlov, Lead-Acid Batteries Science and Technology, Elsevier, Amsterdam, 2017 Search PubMed.
- J. Lach, K. Wróbel, J. Wróbel, P. Podsadni and A. Czerwiński, J. Solid State Electrochem., 2019, 23, 693–705 CrossRef CAS.
- E. Meissner, J. Power Sources, 1997, 67, 135–150 CrossRef CAS.
- J. Yu, Z. Qian, M. Zhao, Y. Wang and L. Niu, Chem. Res. Chin. Univ., 2013, 29, 374–378 CrossRef CAS.
- N. Boudieb, M. Bounoughaz and A. Bouklachi, Procedia Soc. Behav. Sci., 2015, 195, 1618–1622 CrossRef.
- R. Khayat Ghavami, F. Kameli, A. Shirojan and A. Azizi, J. Energy Storage, 2016, 7, 121–130 CrossRef.
- B. Rezaei and M. Taki, J. Solid State Electrochem., 2008, 12, 1663–1671 CrossRef CAS.
- B. Rezaei, E. Havakeshian and A. R. Hajipour, J. Solid State Electrochem., 2011, 15, 421–430 CrossRef CAS.
- B. Rezaei, A. A. Ensafi and A. R. T. Jahromi, Ionics, 2012, 18, 109–116 CrossRef CAS.
- B. Rezaei, A. A. Ensafi and A. R. T. Jahromi, Int. J. Electrochem., 2011, 2011, 787905 Search PubMed.
- B. Rezaei, S. Mallakpour and M. Taki, J. Power Sources, 2009, 187, 605–612 CrossRef CAS.
- G. Lota, M. Baraniak, K. Kopczyński, J. Pernak, H. Przybyło and W. Majchrzycki, Chemik, 2016, 70, 549–554 CAS.
- M. A. Deyab, J. Power Sources, 2018, 390, 176–180 CrossRef CAS.
- A. Gabryelczyk, K. Kopczyński, M. Baraniak, B. Łęgosz, F. Walkiewicz, J. Pernak, E. Jankowska, W. Majchrzycki, P. Kędzior and G. Lota, J. Solid State Electrochem., 2018, 22, 919–930 CrossRef CAS.
- K. Kopczyński, A. Gabryelczyk, M. Baraniak, B. Łęgosz, J. Pernak, P. Kędzior and G. Lota, Int. J. Electrochem. Sci., 2018, 13, 11058–11073 CrossRef.
- K. Kopczyński, A. Gabryelczyk, M. Baraniak, B. Łęgosz, J. Pernak, P. Kędzior and G. Lota, Int. J. Electrochem. Sci., 2018, 13, 4390–4400 CrossRef.
- K. Kopczyński, A. Gabryelczyk, M. Baraniak, B. Łęgosz, J. Pernak, E. Jankowska, W. Rzeszutek, P. Kędzior and G. Lota, J. Energy Storage, 2019, 26, 100996 CrossRef.
- P. Wasserscheid and T. Welton, Ionic Liquids in Synthesis, Wiley-VCH Verlag GmbH & Co, KGaA, Weinheim, 2008 Search PubMed.
- H. Ohno, Electrochemical Aspects of Ionic Liquids, John Wiley&Sons Inc., New Jersey, 2011 Search PubMed.
- S. Znaniecki, K. Szwabińska, J. Wojciechowski, A. Skrzypczak and G. Lota, ChemElectroChem, 2021, 8, 3685–3694 CrossRef CAS.
- EN 50342-1:2015/A1:2018, Lead-acid starter batteries – Part 1: General requirements and methods of test, CENELEC, Brussels, 2018 Search PubMed.
- EN 50342-6:2015/A1:2018, Lead-acid Starter Batteries – Part 6: Batteries for micro-cycle applications, CENELEC, Brussels, 2018 Search PubMed.
- S. Bauknecht, J. Kowal, B. Bozkaya, J. Settelein and E. Karden, E. Technol., 2022, 10, 2101053 Search PubMed.
- D. Pavlov, J. Power Sources, 1995, 53, 9–21 CrossRef CAS.
- D. Pavlov and G. Petkova, J. Electrochem. Soc., 2002, 149, A644–A653 CrossRef CAS.
- D. Pavlov and G. Petkova, J. Electrochem. Soc., 2002, 149, A654–A661 CrossRef CAS.
- A. Lasia, Electrochemical Impedance Spectroscopy and its Applications, Springer, New York, 2015 Search PubMed.
- E. Barsoukov and J. R. Macdonald, Impedance Spectroscopy: Theory, Experiment, and Applications, Wiley, New Jersey, 2005 Search PubMed.
Footnote |
| † Electronic supplementary information (ESI) available. See DOI: https://doi.org/10.1039/d3ra04386j |
| This journal is © The Royal Society of Chemistry 2023 |

