
 Open Access Article
 This Open Access Article is licensed under a Creative Commons Attribution-Non Commercial 3.0 Unported Licence
Dual-mode luminescence anti-counterfeiting and white light emission of NaGdF4:Ce,Eu,Tb/carbon dot hydrophilic nanocomposite ink
Jie Liangabc,
Ting Fan *abc,
Jian-tao Lü*d,
Tianjie Guanabc,
Ting-ting Dengd and
Bangyun Xiongabc
*abc,
Jian-tao Lü*d,
Tianjie Guanabc,
Ting-ting Dengd and
Bangyun Xiongabc
aSchool of Materials Science and Hydrogen Energy, Foshan University, Foshan, 528000, China. E-mail: fanting@fosu.edu.cn
bGuangdong Key Laboratory for Hydrogen Energy Technologies, Foshan, 528000, China
cFoshan Inorganic Micro-Nano Luminescent Materials Engineering Technology Research Center, Foshan, 528000, China
dSchool of Physics and Optoelectronic Engineering, Foshan University, Foshan, 528200, China. E-mail: keentle@gmail.com
First published on 29th August 2023
Abstract
NaGdF4:Ce,Eu,Tb nanocrystals were successfully prepared by a one-step hydrothermal method with Ce3+ ions as sensitizers, Eu3+ and Tb3+ ions as activators, and polyethylenimine (PEI) as surfactants. Color-adjustable fluorescence emission was achieved by the energy transfer effect between rare earth ions. Blue fluorescent carbon quantum dots (CDs) with a double UV response under 254 nm and 365 nm excitation were synthesized by a one-step hydrothermal method. A hydrophilic NaGdF4:Ce,Eu,Tb/CD composite ink was prepared by an easy physical mixing method. Because of the electrostatic self-assembly effect, the color adjustable luminescence was achieved in a few seconds, and the white light emission with color coordinates of (0.32, 0.32) was obtained. A dual-mode luminescence anti-counterfeiting pattern was designed and achieved by excitation with ultraviolet light at 254 nm and 365 nm.
1. Introduction
In recent years, with the rapid development of market economy, the ways and means of manufacturing and selling counterfeit goods have become more diverse and hidden. With the continuous expansion of anti-counterfeiting demand, the anti-counterfeiting technology faces new opportunities and challenges.1,2Because of the excellent physical and chemical properties such as low phonon energy, high chemical stability and easy modification of surface structure, rare earth-doped fluoride has attracted much attention in the field of luminescent anti-counterfeiting materials.3–5 Hu et al. prepared multicolor luminescent NaGdF4 nanocrystals based on Ce/Yb/Ho triple doping with temperature responses.6 The core nanocrystals can be directly used to manufacture anti-counterfeit inks without further processing, which provides a new idea for anti-counterfeiting technology. Li et al. designed and synthesized hyaluronic acid (HA)–lanthanide (Tb3+, Eu3+) composite anti-counterfeit luminescent materials with different luminescent colors and successfully constructed the luminescence pattern.7 With the illumination of a handheld ultraviolet lamp, the encrypted information can be read quickly.
Carbon quantum dots (CDs) are a class of fluorescent materials with low toxicity, rich surface groups and excellent luminescence properties.8,9 By combining rare earth ion-doped light-emitting materials with CDs, different light-emitting information can be displayed under different excitation light sources. It is a new type of light-emitting anti-counterfeiting material with a high anti-counterfeiting level. Wei et al. prepared NaYF4:Yb/Er@CD nanocomposites via electrostatic interaction.10 In addition to the adjustable upconversion luminescence characteristics, the composite also shows blue emission under 365 nm radiation and excellent dual-mode luminescence performance. Li et al. proposed a new strategy for preparing NaYF4:Er,Yb (Tm) micron particle/CD composite anti-counterfeiting materials by a simple solvothermal method.11 A colorless anti-counterfeiting ink was prepared using a mixture of rare earth upconversion luminescent materials/CDs and polyacrylic acid (PAA) aqueous solutions. Various dual-mode fluorescence patterns have been successfully obtained through screen printing, which has broad application prospects in the advanced optical anti-counterfeiting field. However, rare earth ion-doped micro nanocrystal/CD composite anti-counterfeiting materials mainly focus on upconversion luminescent systems, which have low fluorescence efficiency and need a 980 nm laser with high power for excitation source. The rare earth ion-doped nanocrystal/CD composite ink gets excited by a convenient ultraviolet light source to receive adjustable dual-mode luminescence, which needs further development.
White light-emitting materials have attracted widespread attention for potential applications in displays and lighting. The majority of reported white light-emitting materials have been multicomponent systems that are typically processed with organic solvents, accompanied by complex processing, hydrophobic nature, poor white-light quality and environmental pollution. Ghosh et al.12 designed a single-component transparent white light-emitting nanocomposite composed of Ce, Tb and Sm-doped LaF3 and N-doped C-dots with a dense silica (d-SiO2) shell coating over doped LaF3 nanocrystals, which needs several elaborate preparation steps. Simple synthetic strategies with dual functions of anti-counterfeiting and white light emission of single-component hydrophilic nanocomposite inks need to be developed.
In this paper, using PEI as a surfactant, hydrophilic NaGdF4 nanocrystals doped with rare earth Ce3+, Eu3+, and Tb3+ ions with controllable luminescence from red to yellow were synthesized by a simple one-step hydrothermal method. As sensitizers, Ce3+ ions enhance the visible light emission intensity. Using citric acid and urea as raw materials, CDs with dual-mode ultraviolet excitation were prepared by a one-step hydrothermal method. A hydrophilic nanocomposite ink with white light emission (CIE values of 0.32, 0.32) of NaGdF4:Ce3+,Eu3+,Tb3+/CDs was successfully constructed via electrostatic interaction between carboxylic groups with negative dots on CDs and positively charged amino groups on rare earth nanocrystals. Moreover, a dual-mode luminescence anti-counterfeiting pattern was successfully prepared. The preparation process and dual-mode luminescence design are shown in Scheme 1.
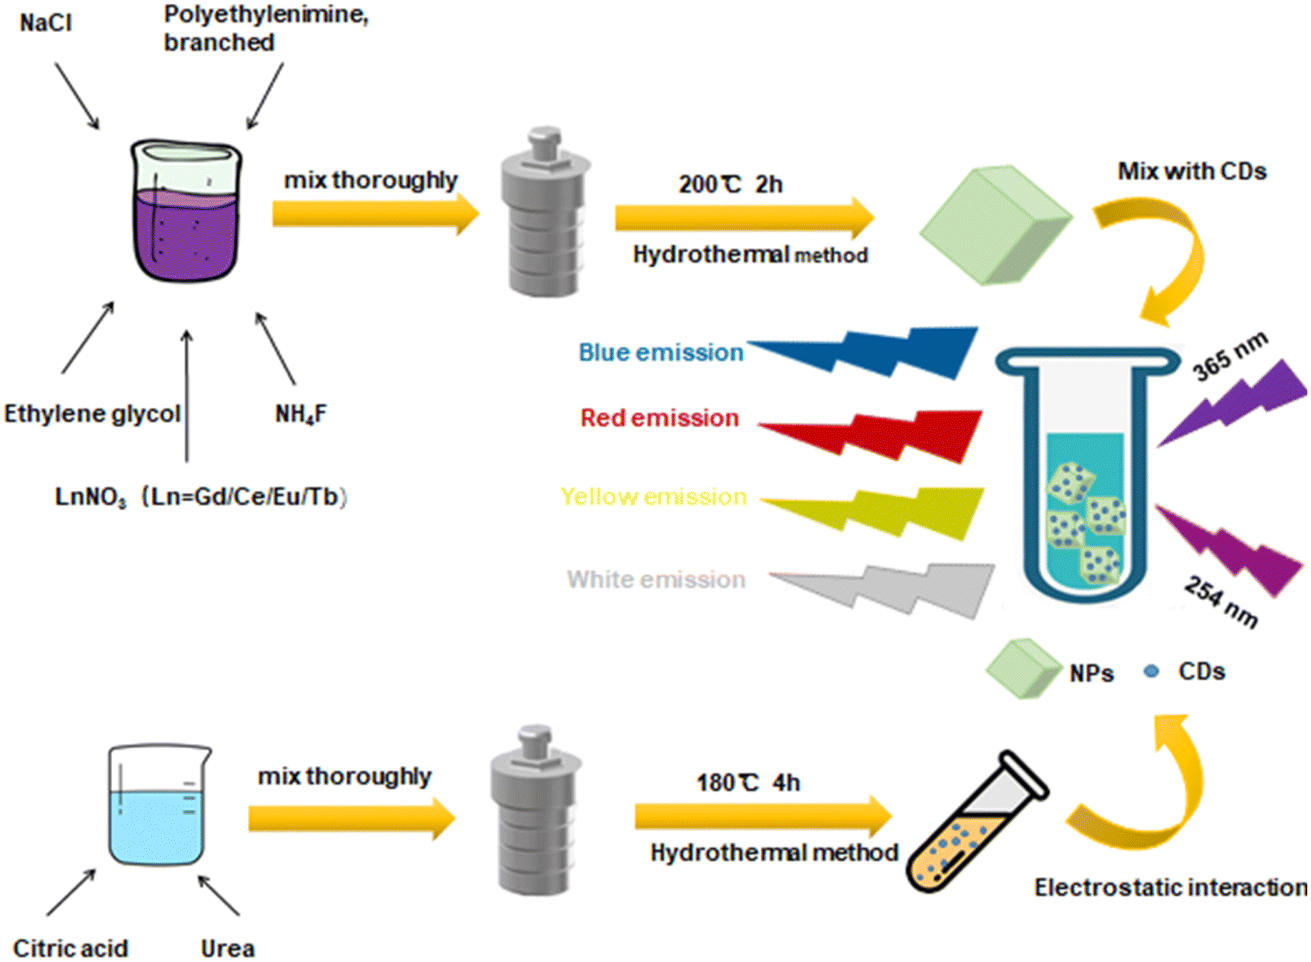 | ||
| Scheme 1 Schematic diagram of the preparation and dual-mode luminescence application. | ||
2. Experiment
2.1 Chemicals and materials
Polyethylenimine (PEI, branched, average MN = 10![[thin space (1/6-em)]](https://www.rsc.org/images/entities/char_2009.gif) 000) was purchased from Sigma-Aldrich. Ln(NO3)3·6H2O (Ln = Gd, Ce, Tb, and Eu) was purchased from Macklin Biochemical Co., Ltd (Shanghai, China). Citric acid, ethylene glycol (EG, 99%) and NH4F (96%) were purchased from Tianjin Yongda Chemical Reagent Company Limited (Tianjin, China). NaCl (99.5%) was purchased from Xilong Scientific. Urea (99%) was purchased from Shanghai Aladdin Biochemical Technology Co., Ltd (Shanghai, China).
000) was purchased from Sigma-Aldrich. Ln(NO3)3·6H2O (Ln = Gd, Ce, Tb, and Eu) was purchased from Macklin Biochemical Co., Ltd (Shanghai, China). Citric acid, ethylene glycol (EG, 99%) and NH4F (96%) were purchased from Tianjin Yongda Chemical Reagent Company Limited (Tianjin, China). NaCl (99.5%) was purchased from Xilong Scientific. Urea (99%) was purchased from Shanghai Aladdin Biochemical Technology Co., Ltd (Shanghai, China).
2.2 Preparation of Ln3+-doped NaGdF4 nanocrystals
The synthesis of 1.2 mmol NaGdF4:20%Ce3+,1%Eu3+,2%Tb3+ nanocrystals is taken as an example. A suitable proportion of rare earth nitrate with a total rare earth ion content of 1.2 mmol, 2.4 mmol NaCl, 6.24 mmol NH4F, and 0.4 g PEI were completely dissolved in 30 ml of ethylene glycol. The solution was transferred to a stainless steel Teflon-lined autoclave after dissolution and maintained at 200 °C for 2 hours. After the reaction, the system naturally cooled down to room temperature. The prepared sample was centrifuged, washed three times with ethanol and deionized water to remove other residual solvents, and dried in vacuum at 60 °C for 12 hours to obtain the sample.8,9 Different concentrations of Ln3+ (Ln = Ce; Ce, Eu; and Ce, Tb, Eu) ion codoped NaGdF4 nanocrystals were prepared following similar steps. The prepared sample was ultrasonically dissolved in 10 ml deionized water for use as an ink for subsequent experiments.2.3 Synthesis of CDs
First, 2.0 g citric acid and 4.0 g urea were dissolved in 20 ml deionized water, stirred for 10 minutes until they were completely dissolved, and the solution was transferred to a stainless steel Teflon-lined autoclave. The reaction took 4 hours at 180 °C. After the autoclave was cooled down to room temperature naturally, the reaction liquid was centrifuged at 10000 rpm for 25 min to remove the precipitate. This centrifugation process was repeated three times. The supernatant was then lyophilized and stored. Finally, 5 mg ml−1 aqueous CD solution was prepared for subsequent experiments.10–12
2.4 Synthesis of NaGdF4:Ce3+,Eu3+,Tb3+@CD nanocomposite inks
First, X μl (X = 100, 200, 300, 400, 500, and 600) CD aqueous solution was dripped into six identical 0.1 g ml−1 NaGdF4:20%Ce3+,1%Eu3+,2%Tb3+ nanocrystalline aqueous solutions, respectively. After continuous stirring, nanocomposite inks with different luminescent colors were obtained. In addition to the fluorescence spectrum, the amount of CDs in the nanocomposites tested was 400 μl.2.5 Characterizations
Fourier transform infrared (FT-IR) spectra of the samples were recorded using an IRAffinity-1s Fourier transform infrared (FTIR) spectrometer (Shimadzu, Japan). The phase composition was recorded by powder X-ray diffraction (XRD) using a D-Max 2500 X-ray diffractometer (XRD, Rigaku, Co., Japan). A transmission electron microscope (TEM) (JEM-F200) was used to characterize the morphology and structure of samples at 120 kV. The zeta potential spectra of the samples were recorded using a zeta potential and particle size analyzer (pHpzc, 90Plus PALS, Brookhaven Instruments Co., USA). Photoluminescence spectra of the samples were recorded using a FLS920P Edinburgh Analytical Instrument. A ZF-2 ultraviolet analyzer was used as the excitation light source of anti-counterfeiting patterns at 365 nm and 254 nm. The anti-counterfeiting pictures were acquired using Huawei mobile phones.3. Results and discussion
The crystal structure of NaGdF4 nanocrystals doped with different Ce3+ concentrations is shown in Fig. 1(a). The diffraction peak of the nanocrystals is consistent with that of the hexagonal phase (PDF#27-0699), when the nanocrystals are undoped with Ce3+ ions. With the increase in Ce3+ ion doping concentration, nanocrystals transform from the hexagonal phase to the cubic phase. Even when the Ce3+ ion doping amount increases to 40%, the crystalline phase of the nanocrystal still matches the standard cubic phase structure (PDF#27-0697), except that the position of the diffraction peak slightly shifts towards a larger lattice parameter direction. The radius of Ce3+ ions (1.01 Å) is slightly larger than that of Gd3+ ions (0.938 Å). The increase in lattice parameters proves that Ce3+ ions replace Gd3+ sites and form Na(Gd,Ce)F4 solid solutions. According to a previous report,13 the crystal structure of hexagonal phase NaGdF4 has three crystal cation sites, namely, a unit point occupied by Gd3+(1a), a unit point randomly occupied by 1/2 Na+ and 1/2 Gd3+(1f), and a double site (2h) partially occupied by Na+. In cubic NaGdF4 crystals, Na+ and Gd3+ ions randomly occupy 4a (0,0,0) positions, and F− ions randomly occupy 8c (1/4,1/4,1/4) positions. Therefore, with the increase in Ce3+ doping concentration, Ce3+ ions in cubic phase NaGdF4 were more likely to replace Gd3+ ions than those in hexagonal phase NaGdF4, thereby forming a cubic phase Na(Gd,Ce)F4 solid solution.14 | ||
| Fig. 1 (a) XRD patterns of NaGdF4:X%Ce3+ (X = 5, 10, 20, 30, and 40). (b) XRD patterns of CDs, NaGdF4:20%Ce3+,1%Eu3+,2%Tb3+ nanocrystals and NaGdF4:20%Ce3+,1%Eu3+,2%Tb3+@CD nanocomposites. | ||
The crystal structure of CDs and NaGdF4:Ce3+,Eu3+,Tb3+ nanocrystals before and after recombination with CDs is shown in Fig. 1(b). As can be seen from the figure, the XRD spectrum of CDs consists of a large broad peak with a center located near 25°, indicating that the synthesized CDs belong to an amorphous form. The crystal phases of NaGdF4:Ce3+,Eu3+,Tb3+ nanocrystals before and after recombination with CDs are consistent with those of NaGdF4 doped with the same Ce3+ concentration in Fig. 1(a), indicating that the codoping ions do not affect the crystal structure. There are two possible reasons why no diffraction peaks of CDs are found in the composite sample: (1) CDs belong to an amorphous form and their addition amount is very small relative to the nanocrystals and (2) the strong crystallinity of nanocrystals cover the weak diffraction peaks of CDs.15,16 The NaGdF4:Ce3+,Eu3+,Tb3+ and NaGdF4:Ce3+,Eu3+,Tb3+@CD nanocomposites were prepared based on NaGdF4:20%Ce3+ nanocrystals due to their optimal luminescence intensity described later.
The transmission electron microscopic (TEM) image of the NaGdF4:20%Ce3+, NaGdF4:20%Ce3+,1%Eu3+, and NaGdF4:20%Ce3+,1%Eu3+,2%Tb3+ nanocrystals are shown respectively in Fig. 2(a)–(c). It can be seen that the prepared nanocrystals exhibit mainly cubic shape with a particle size of about 26 nm. The TEM image of CDs is shown in Fig. 2(d). It can be seen that the prepared CDs are uniformly monodisperse spherical particles with a diameter of about 2.3 nm. The TEM images of NaGdF4:20%Ce3+,1%Eu3+, and 2%Tb3+@CDs displayed in Fig. 2(e) show that CDs adhere to the surface of NaGdF4, and there is no significant change in the morphology and size of the material after composite synthesis. Fig. 2(f) shows the HRTEM diagram of the nanocomposites, with lattice stripes spaced 0.31 nm and 0.25 nm corresponding to the (111) surface of cubic NaGdF4 and the (020) surface of graphite carbon, respectively, further illustrating the successful adsorption of CDs on the surface of NaGdF4 nanocrystals.
 | ||
| Fig. 2 (a–c) TEM images of NaGdF4:20%Ce; NaGdF4:20%Ce3+,1%Eu3+; NaGdF4:20%Ce3+,1%Eu3+, and 2%Tb3+ nanocrystals. (d) TEM images of CDs. (e and f) TEM images of NaGdF4:20%Ce3+,1%Eu3+,2%Tb3+@CDs and the corresponding HRTEM images (the red circles show the CDs attached to the surface of NaGdF4:Ce,Eu,Tb nanocrystals). | ||
The EDS elemental mapping of NaGdF4:20%Ce3+,1%Eu3+,2%Tb3+@CDs is shown in Fig. 3. The Na, Gd, F elements should belong to NaGdF4, while C and N elements might be from carbon quantum dots and PEI, which confirm the distribution of CDs and PEI on the surface of NaGdF4 nanocrystals and also prove the successful doping of Ce3+, Eu3+ and Tb3+ ions.
 | ||
| Fig. 3 EDS elemental mapping of NaGdF4:20%Ce3+,1%Eu3+,2%Tb3+@CDs. | ||
The FT-IR spectra of the CDs, NaGdF4:Ce3+,Eu3+,Tb3+ and NaGdF4:Ce3+,Eu3+,Tb3+@CDs composites are shown in Fig. 4(a). For CDs, the broad absorption band at 3050–3600 cm−1 is due to the stretching vibration of –OH/N–H. The appearance of characteristic peaks at 2300–2410 cm−1, 1640 cm−1, and 1580 cm−1 confirmed the presence of C![[triple bond, length as m-dash]](https://www.rsc.org/images/entities/char_e002.gif) N, C
N, C![[double bond, length as m-dash]](https://www.rsc.org/images/entities/char_e001.gif) O, and CC, respectively. The absorption peak at 1350 cm−1 is due to the vibration of carboxylic acid group (COO−). For NaGdF4:Ce3+,Eu3+,Tb3+, the absorption peaks at 2750–3000 cm−1 are attributed to the stretching vibration and bending vibration of CH2. The broad absorption band at 3150–3650 cm−1 and the absorption peak at 1650 cm−1, which are the vibrations of N–H belonging to positively charged groups in PEI, also further illustrated the successful coating of PEI. The successful introduction of PEI not only provides the conditions for subsequent recombination with CDs, but also makes the nanocrystals well dispersed in water, providing the conditions for subsequent fabrication into inks.17 In addition, it can be seen in NaGdF4:Ce3+,Eu3+,Tb3+@CDs that the absorption peaks of related groups at 3150–3650 cm−1 and 2300–2410 cm−1 as well as 1630 cm−1 are all obviously enhanced, further indicating the successful recombination of CDs.18–20
O, and CC, respectively. The absorption peak at 1350 cm−1 is due to the vibration of carboxylic acid group (COO−). For NaGdF4:Ce3+,Eu3+,Tb3+, the absorption peaks at 2750–3000 cm−1 are attributed to the stretching vibration and bending vibration of CH2. The broad absorption band at 3150–3650 cm−1 and the absorption peak at 1650 cm−1, which are the vibrations of N–H belonging to positively charged groups in PEI, also further illustrated the successful coating of PEI. The successful introduction of PEI not only provides the conditions for subsequent recombination with CDs, but also makes the nanocrystals well dispersed in water, providing the conditions for subsequent fabrication into inks.17 In addition, it can be seen in NaGdF4:Ce3+,Eu3+,Tb3+@CDs that the absorption peaks of related groups at 3150–3650 cm−1 and 2300–2410 cm−1 as well as 1630 cm−1 are all obviously enhanced, further indicating the successful recombination of CDs.18–20
 | ||
| Fig. 4 (a) FT-IR spectra of CDs, NaGdF4:Ce3+,Eu3+,Tb3+ and NaGdF4:Ce3+,Eu3+,Tb3+@CDs. (b) Change in the zeta potential of nanocomposites with the C-dot concentration. | ||
The zeta potential changes of NaGdF4:Ce3+,Eu3+,Tb3+ complexed with different amounts of CDs are shown in Fig. 4(b). The potential of the nanocrystal before the composite was formed is about +43.56, which is caused by the –NH2 groups on the surface of the nanocrystal. The zeta potential shifts from positive to negative with the increase in the amounts of CDs, which is related to the negatively charged groups (COO–) on the surface of CDs, indicating that CDs are successfully conjugated with NaGdF4:Ce3+,Eu3+,Tb3+ due to strong electrostatic interactions.
The excitation and emission spectra of NaGdF4:Ce3+ nanocrystals are shown in Fig. 5(a) and (b). The excitation spectrum of NaGdF4:Ce3+ detected at 340 nm exhibits a strong broad absorption band at 240–310 nm, which is attributed to the 4f → 5d transition of Ce3+ ions. Under excitation at 284 nm, the emission spectrum exhibits a strong absorption peak at 300–420 nm, which is caused by the electronic transition of Ce3+ ions as 5d1 → 4f1. As the Ce3+ ion doping concentration increases, the emission intensity first increases and then decreases. When the Ce3+ ion doping concentration is 20%, the emission intensity reaches the maximum, and the concentration quenching effect occurs when doping continues.
 | ||
| Fig. 5 (a) Excitation spectra of the NaGdF4:x%Ce3+ (x = 5, 10, 20, 30 and 40) nanocrystals (λem = 340 nm). (b) Emission spectra of the NaGdF4:x%Ce3+ (x = 5, 10, 20, 30 and 40) nanocrystals (λex = 284 nm). | ||
The excitation spectra of NaGdF4:20%Ce3+,X%Eu3+ (X = 0.5, 1, 2, and 3) under 618 nm light monitoring are shown in Fig. 6(a). A wide peak at 220–260 nm is caused by the 4f → 5d transition of Ce3+, while the weak peak at 316 nm is caused by 7F0 → 5D4 transition of Eu3+. The excitation peak of Ce3+ ions can be found under the excitation of Eu3+ ion emission light, which confirms the energy transfer between Ce3+ and Eu3+.9,21 In addition, the sharp absorption peak near 275 nm is caused by the 8S7/2 → 6I11/2 transition of Gd3+, which also indicates the energy transfer of Gd3+ → Eu3+.22 The emission spectra of nanocrystals excited at 254 nm are shown in Fig. 6(b). Illustrated are the luminescence effects of NaGdF4:20%Ce3+,1%Eu3+ nanocrystal aqueous solutions. The characteristic emission peaks of Eu3+ ions (5D0 → 7F0 at 588 nm, 5D0 → 7F1 at 594 nm, 5D0 → 7F2 at 610 and 618 nm, 5D0 → 7F3 at 649 nm, and 5D0 → 7F4 at 696 nm) are easily found in the emission spectra. With the increase in Eu3+ doping concentration, the luminescence intensity also increases first and then decreases. When the Eu3+ doping concentration is 1%, the luminescence intensity is the highest. Continuously increasing Eu3+ concentration resulted in concentration quenching and decreased luminescence intensity.
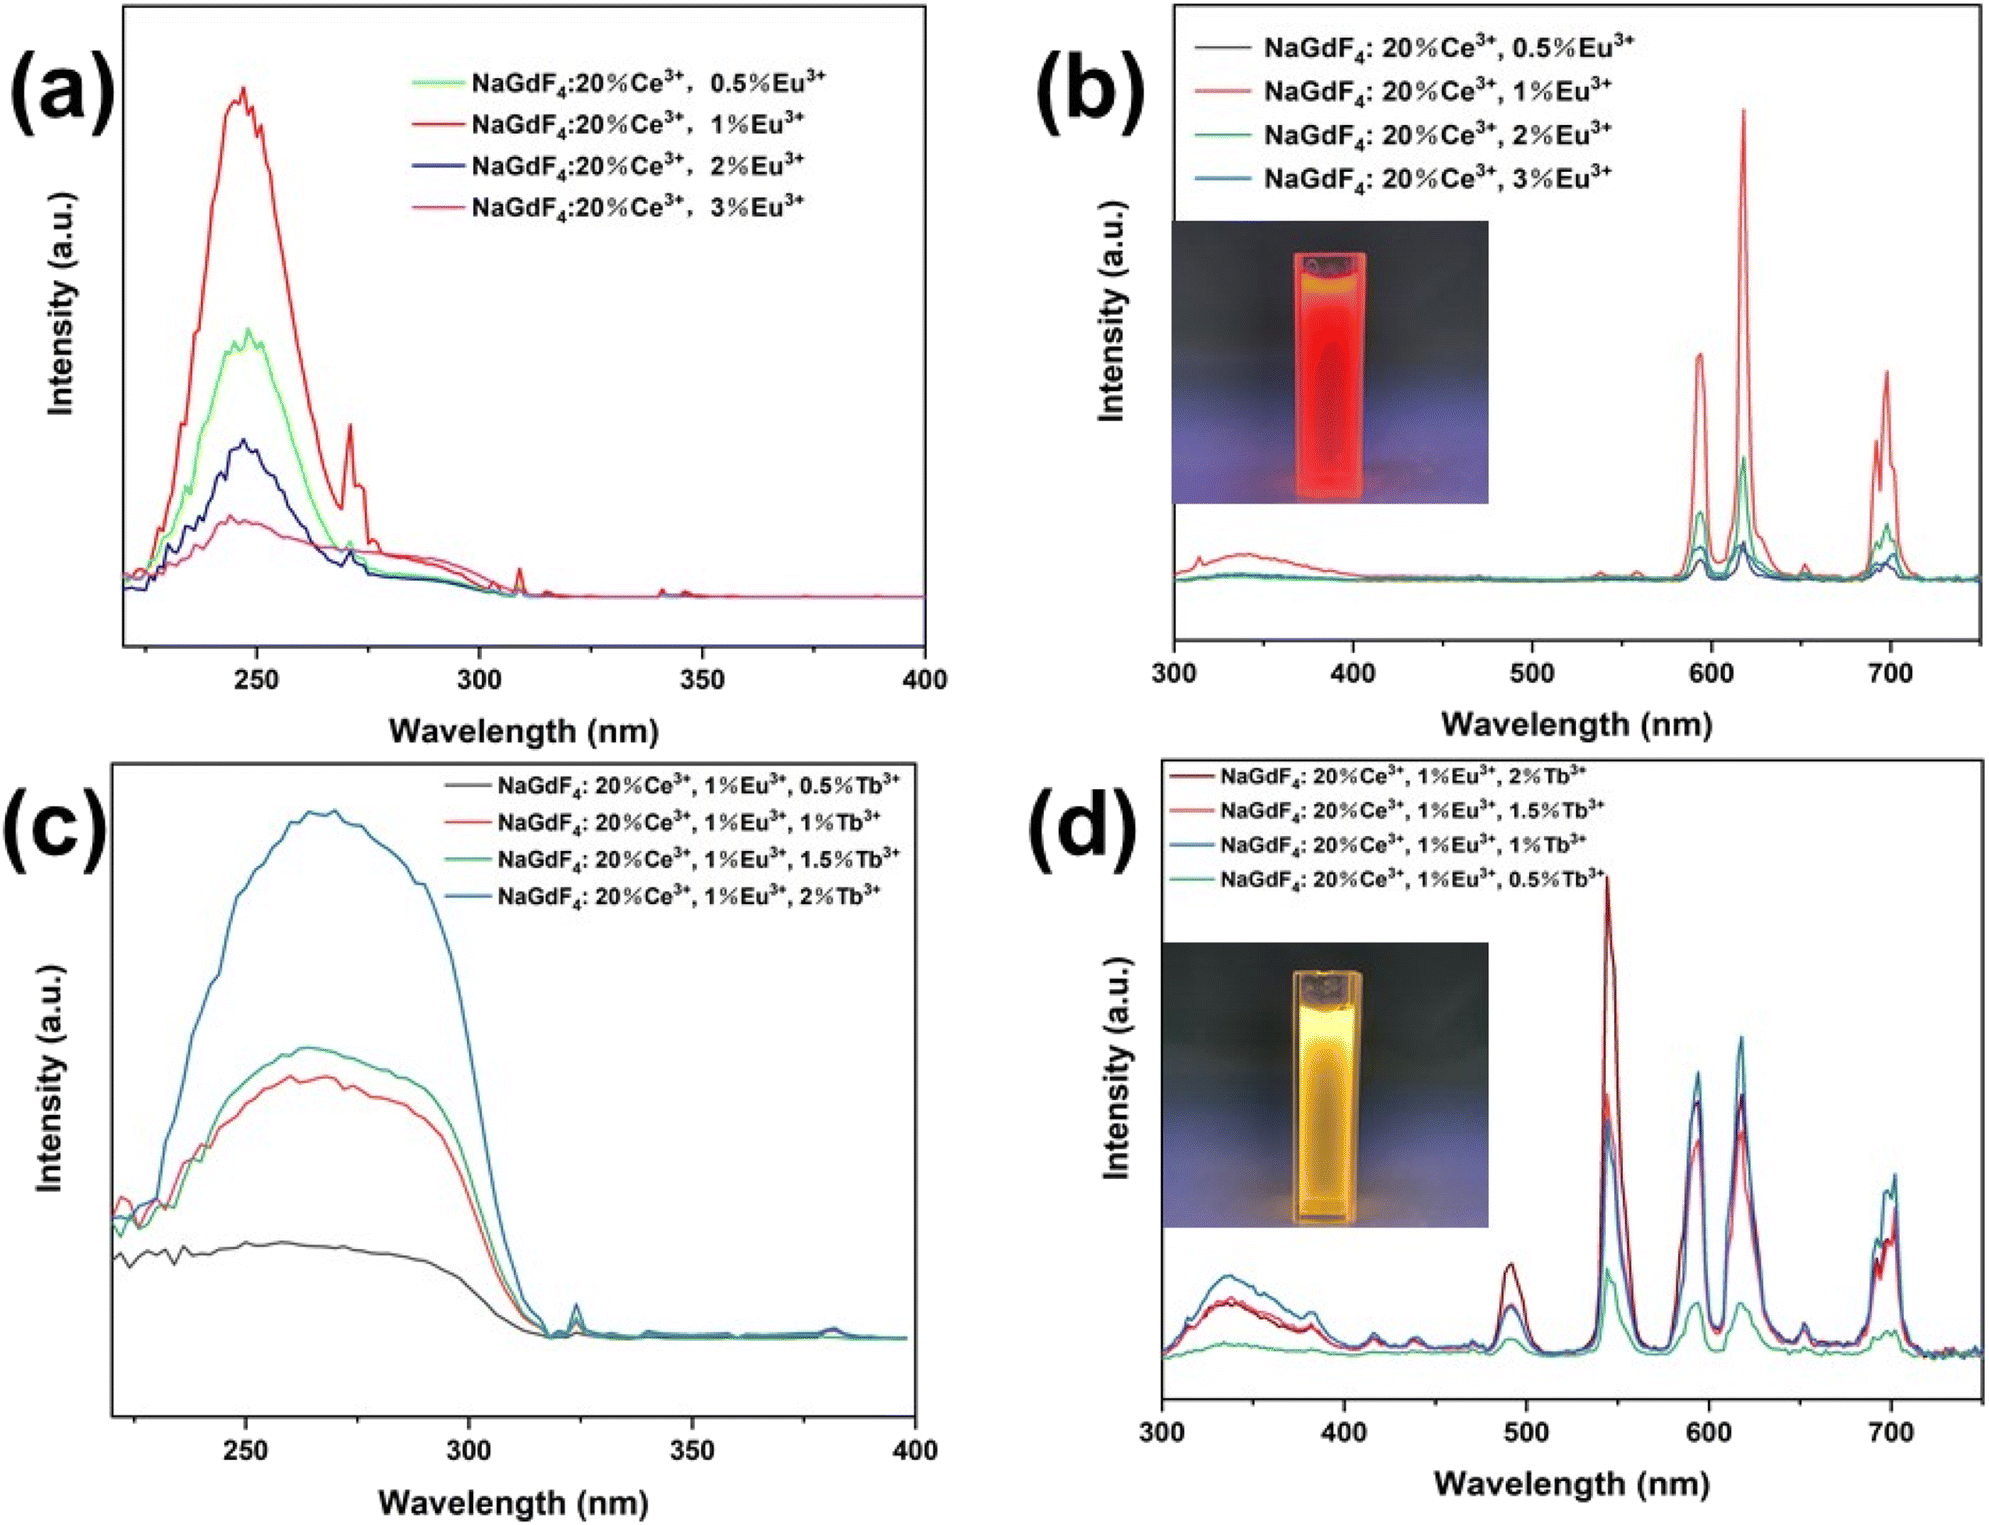 | ||
| Fig. 6 (a) Excitation (λem = 618 nm) and (b) emission spectra of 20%Ce3+/x%Eu3+ (x = 0.5, 1, 2, and 3)-doped NaGdF4 samples (λex = 254 nm). (c) Excitation (λem = 554 nm) and (d) emission spectra of 20% Ce3+/1% Eu3+/Y% Tb3+ (Y = 0.5, 1, 1.5, and 2)-doped NaGdF4 samples (λex = 254 nm). | ||
Fig. 6(c) shows the excitation spectra of NaGdF4:20%Ce3+,1%Eu3+,Y%Tb3+ nanocrystals (Y = 0.5, 1, 1.5, and 2). We can see from the excitation spectra that a 220–320 nm wide peak appears under 544 nm monitoring. This is caused by the f–f transition of Tb3+ and the Ce3+ 4f–5d transition. It is proved that there is an energy conversion between Ce3+ and Tb3+ ions.4,23 Fig. 6(d) shows the emission spectra of nanocrystals excited at 254 nm. Illustrated are the luminescence photos of NaGdF4:20%Ce3+,1%Eu3+,2%Tb3+ nanocrystal aqueous solutions. The characteristic emission peaks of Ce3+ ions at 300–400 nm, Eu3+ ions at 594, 618, and 696 nm and Tb3+ ions at 489 nm and 544 nm (5D3 → 7F4 and 5D4 → 7F5 transition) can be seen in the emission spectrum.24–26 It can be seen that with the increase in Tb3+ ion concentration, the characteristic emission intensity of Tb3+ increases while the intensity of the characteristic emission of Eu3+ ions is obviously enhanced, which indicates that there is energy transfer process of Ce3+ → Tb3+ → Eu3+ ions.27,28 NaGdF4:20%Ce3+,1%Eu3+,2%Tb3+ nanocrystals with the highest luminescence intensity were selected for the follow-up processes.
The excitation spectra of CDs monitored by 449 nm light are shown in Fig. 7(a). There are two strong absorption peaks at 250–400 nm, corresponding to the π–π* and n–π* transitions of functional groups in CDs.29–31 Emission spectra and photographs using common UV excitations at 254 and 365 nm are shown in Fig. 7(b). The inset shows the emission photos excited under 254 and 365 nm from top to bottom. CDs have a strong emission peak at 449 nm, which is stronger at 365 nm than at 254 nm. The luminescence process is that the CDs first absorb the energy of ultraviolet light, and the electrons transit from the Cπ level to the Cπ* level. Then, via the Cπ*–Nπ* and Nπ*–Oπ* processes, the electrons relax to the lowest level, and the energy transits to the Cπ level through blue light emission.32,33
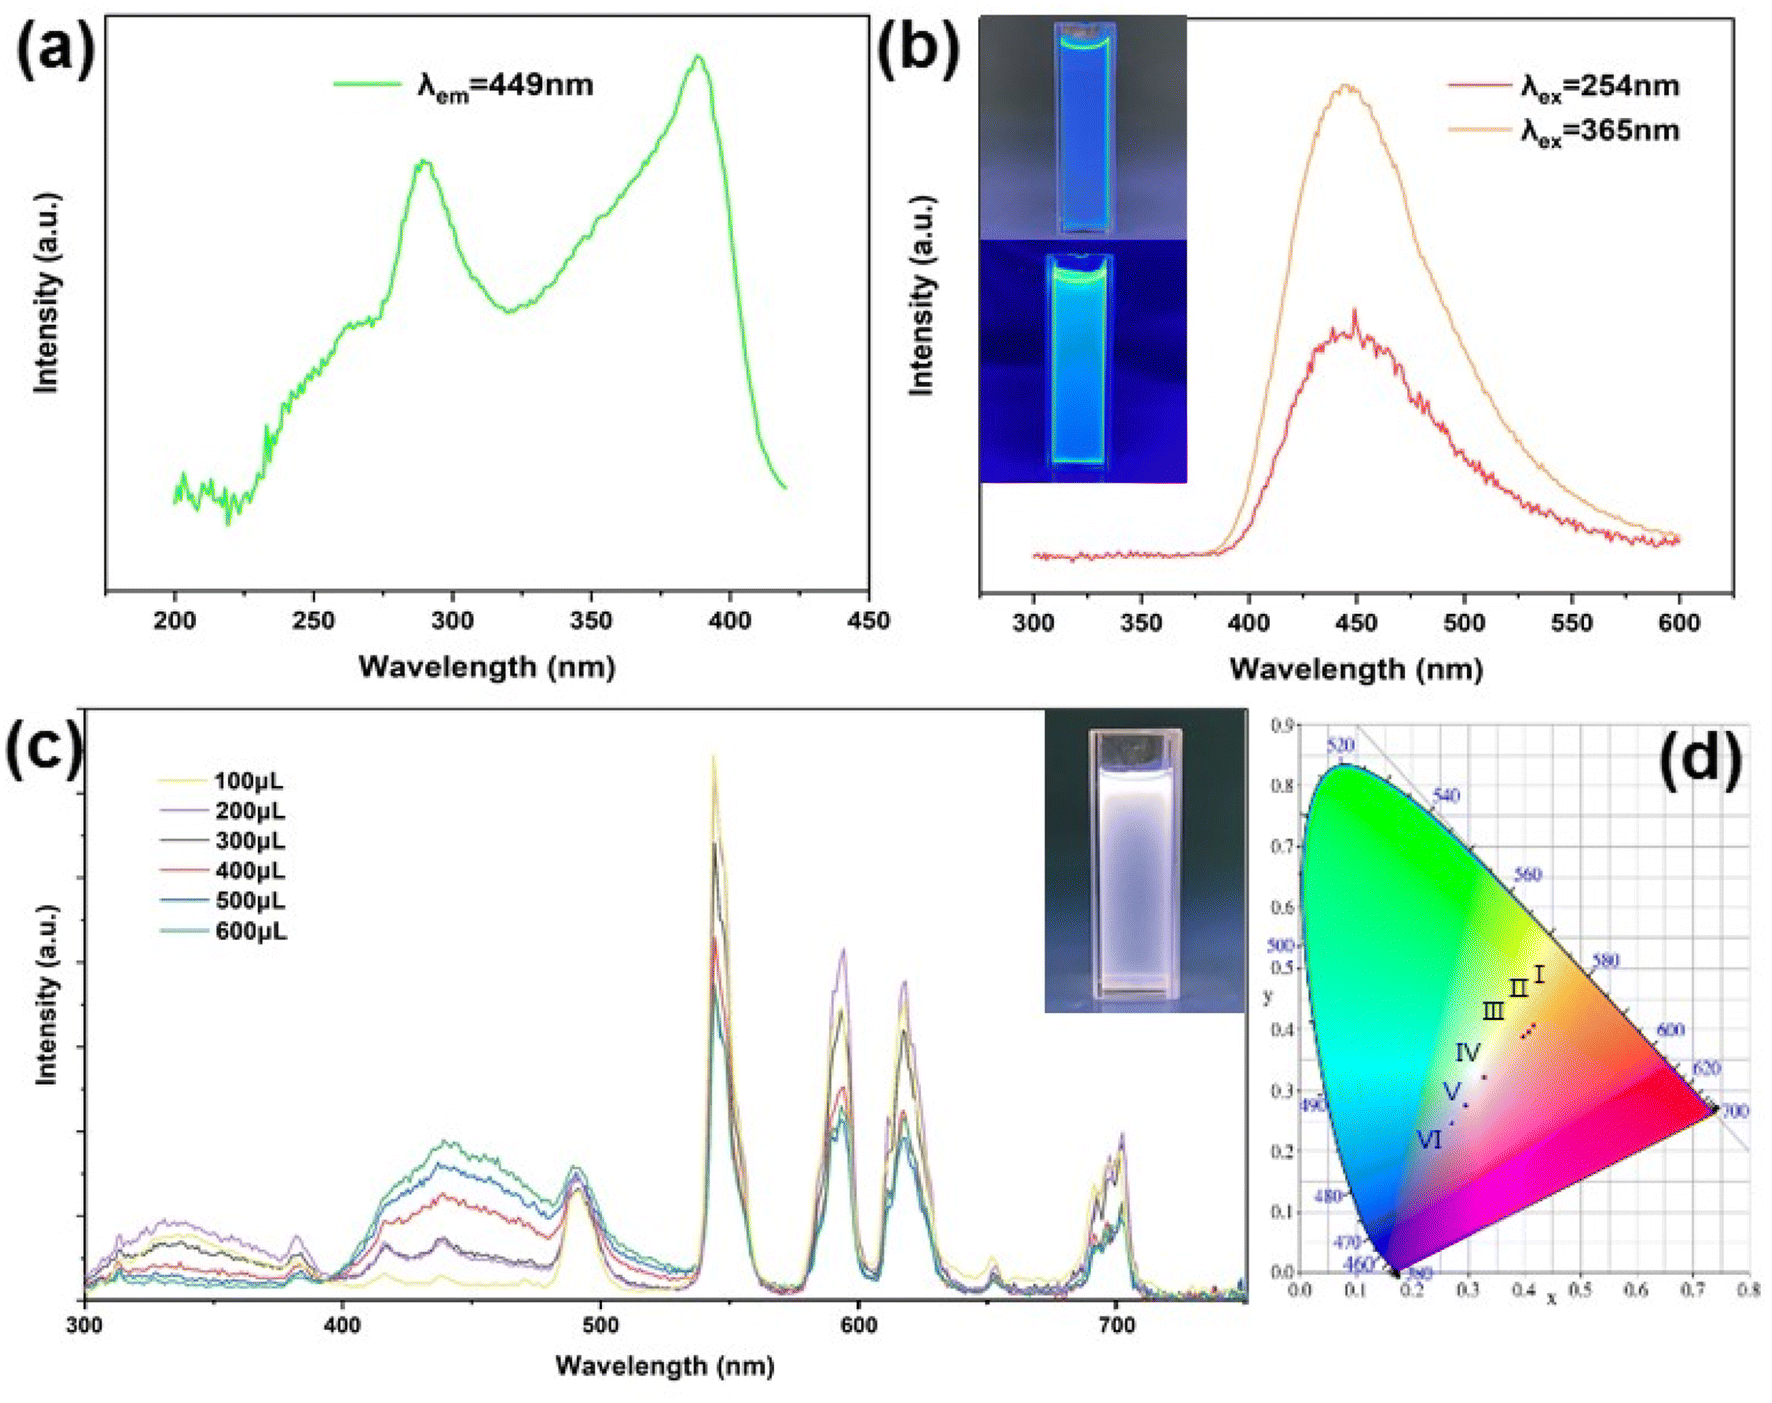 | ||
| Fig. 7 (a) Excitation (λem = 449 nm) and (b) emission spectra of CDs excited by 254 nm and 365 nm light. (c and d) Emission spectra of NaGdF4:20%Ce3+,1%Eu3+,2%Tb3+ with different CD additions (λex = 254 nm) and CIE chromaticity value diagram of the inks. | ||
The emission spectra of NaGdF4:20%Ce3+,1%Eu3+,2%Tb3+@CDs nanocomposite inks with different amounts of CDs excited at 254 nm are shown in Fig. 7(c). It is obvious to find the characteristic emission peaks of Ce3+ ions (300–400 nm), Eu3+ ions (594 nm, 618 nm, 696 nm), Tb3+ ions (489 nm, 544 nm) and CDs (400–500 nm). As the amount of CDs increases, the green light decreases, the red light first increases and then decreases, while the blue light increases significantly. This may be due to the energy transfer from CDs to rare earth ions.34–36 When adding with different amounts of CDs (100–600 μl), the corresponding coordinate points are (0.41, 0.40), (0.40, 0.39), (0.39, 0.38), (0.32, 0.32), (0.29, 0.27), (0.27, 0.24) respectively, which is shown in Fig. 7(d). When the amount of CDs is 400 μl, white light emission is acquired, as shown in the inset in Fig. 7(c). The emission spectra of Ce3+ overlap with the excitation peaks of CDs to some extent, and the emission intensity of Ce3+ decreases with the increase in CDs, which confirms that there is fluorescence resonance energy transfer (FRET) process from Ce3+ emission to the C-dots (N dopant state → π*).37 The energy transfer mechanism in this nanocomposite is shown in Fig. 8.
 | ||
| Fig. 8 Proposed energy transfer mechanism for Ce3+/Tb3/Eu3+ in the NaGdF4 host. | ||
A simple anti-counterfeiting pattern was prepared as shown in Fig. 9. The numbers ‘3’, ‘2’, ‘7’, and ‘1’ were used by CDs, NaGdF4:Ce3+,Eu3+,Tb3+, NaGdF4:Ce3+,Eu3+, and NaGdF4:Ce3+,Eu3+,Tb3+@CDs (400 μl) ink respectively. Blue, yellow, red and white light can be obtained under 254 nm excitation, while only CD-containing inks emit blue light under excitation at 365 nm, resulting in an obvious dual-mode luminescence phenomenon.
 | ||
| Fig. 9 Photographs of graphic security patterns made with CDs, NaGdF4:Ce,Eu, NaGdF4:Ce,Eu,Tb and NaGdF4:Ce,Eu,Tb@CDs (from left to right) inks under 254 nm and 365 nm irradiation for dual-mode anti-counterfeiting. | ||
4. Conclusions
In summary, we studied the change in the crystal phase of NaGdF4 nanocrystals with the increase in Ce3+ doping concentration, explaining the effect of Ce3+ as a sensitizer on the luminescence intensity of NaGdF4:Eu,Tb nanocrystals and the energy transfer process between Ce3+ and Eu3+, Tb3+ ions. The negatively charged blue-emitting CDs were compounded with water-soluble nanocrystal surfaces of NaGdF4:Ce,Eu,Tb modified by PEI by a simple physical mixing method on the basis of electrostatic interactions. By changing the amount of CDs, fluorescent inks with adjustable emission colors were prepared and single-component water-soluble inks with white light emission were obtained. Using 254 nm and 365 nm dual-wavelength excitation effects of CDs, a dual-mode anti-counterfeiting pattern was designed and obtained, which provides a new idea for the development of white light emission and new advanced fluorescence anti-counterfeiting technology.Conflicts of interest
We declare that we have no financial and personal relationships with other people or organizations that can inappropriately influence our work reported in this manuscript.Acknowledgements
This work is supported by the National Natural Science Foundation of China (No. 51702051 and 51902054) and Foshan Inorganic Micro-Nano Luminescent Materials Engineering Technology Research Center.References
- Y. Song, M. Lu, G. A. Mandl, Y. Xie, G. Sun, J. Chen, X. Liu, J. A. Capobianco and L. Sun, Energy migration control of multimodal emissions in an Er3+-doped nanostructure for information encryption and deep-learning decoding, Angew. Chem., Int. Ed., 2021, 60(44), 23790–23796 CrossRef CAS PubMed.
- Pushpendra, I. Suryawanshi, S. Srinidhi, S. Singh, R. Kalia, R. K. Kunchala, S. L. Mudavath and B. S. Naidu, Downshifting and upconversion dual mode emission from lanthanide doped GdPO4 nanorods for unclonable anti-counterfeiting, Mater. Today Commun., 2021, 26, 102144 CrossRef CAS.
- H. Chen, P. Zhang, H. Cui, W. Qin and D. Zhao, Synthesis and luminescence properties of water soluble α-NaGdF4/β-NaYF4:Yb,Er core–shell nanoparticles, Nanoscale Res. Lett., 2017, 12(1), 548 CrossRef PubMed.
- X. Li, Y. Pei, R. Liang, C. Qian and J. Wang, Tunable multicolor and bright white emission in PEG modified β-NaGdF4 nanocrystals by systematic introduction of Ce3+ and Mn2+/Ln3+, RSC Adv., 2022, 12(13), 7883–7891 RSC.
- S. Zeng, M. K. Tsang, C. F. Chan, K. L. Wong and J. Hao, PEG modified BaGdF5:Yb/Er nanoprobes for multi-modal upconversion fluorescent, in vivo X-ray computed tomography and biomagnetic imaging, Biomaterials, 2012, 33(36), 9232–9238 CrossRef CAS PubMed.
- Y. Hu, Q. Shao, X. Deng and J. Jiang, Thermal-responsive multicolor emission of single NaGdF4:Yb/Ce/Ho upconversion nanocrystals for anticounterfeiting application, Nanophotonics, 2020, 9(9), 2879–2885 CrossRef CAS.
- J. Li, D. Xia, M. Gao, L. Jiang, S. Zhao and G. Li, Invisible luminescent inks and luminescent films based on lanthanides for anti-counterfeiting, Inorg. Chim. Acta, 2021, 526, 120541 CrossRef CAS.
- Y. Liu, H. Huang, W. Cao, B. Mao, Y. Liu and Z. Kang, Advances in carbon dots: from the perspective of traditional quantum dots, Mater. Chem. Front., 2020, 4(6), 1586–1613 RSC.
- X.-D. Mai, T. Thi Kim Chi, T.-C. Nguyen and V.-T. Ta, Scalable synthesis of highly photoluminescence carbon quantum dots, Mater. Lett., 2020, 268, 127595 CrossRef CAS.
- H. Wei, Y. Zheng, X. Zhang, P. Liang, X. Xu, C. Hu, X. Zhang, B. Lei, Y. Liu and J. Zhuang, A rapid construction strategy of NaYF4:Yb,Er@CDs nanocomposites for dual-mode anti-counterfeiting, Mater. Adv., 2022, 3(11), 4542–4547 RSC.
- M. Li, W. Yao, J. Liu, Q. Tian, L. Liu, J. Ding, Q. Xue, Q. Lu and W. Wu, Facile synthesis and screen printing of dual-mode luminescent NaYF4:Er,Yb (Tm)/carbon dots for anti-counterfeiting applications, J. Mater. Chem. C, 2017, 5(26), 6512–6520 RSC.
- S. Ghosh, C. Pal, S. Paul, M. Saha, D. Barman and S. K. De, Visible transparent white light emitting ink from a Ce3+ sensitized monodispersed Tb,Sm co-doped LaF3@C-dot nanocomposite, Chem. Commun., 2018, 54(100), 14124–14127 RSC.
- J. H. Burns, Crystal structure of hexagonal sodium neodymium fluoride and related compounds, Inorg. Chem., 1965, 4, 881–886 CrossRef CAS.
- X. Zhang, X. Fan, X. Qiao and Q. Luo, NaGdF4:Ce3+ and (Ce, Gd)F3 nanoparticles: hydrothermal synthesis and luminescence properties, Mater. Chem. Phys., 2010, 121, 274–279 CrossRef CAS.
- J. Huang, W. Lu, J. Wang, Q. Li, B. Tian, C. Li, Z. Wang, L. Jin and J. Hao, Strategy to enhance the luminescence of lanthanide ions doped MgWO4 nanosheets through incorporation of carbon dots, Inorg. Chem., 2018, 57(14), 8662–8672 CrossRef CAS PubMed.
- Y. Wang, F. Hong, L. Yu, H. Xu, G. Liu, X. Dong, W. Yu and J. Wang, Construction, energy transfer, tunable multicolor and luminescence enhancement of YF3:RE3+ (RE = Eu, Tb)/carbon dots nanocomposites, J. Lumin., 2020, 221, 117072 CrossRef CAS.
- F. Li, C. Li, X. Liu, Y. Chen, T. Bai, L. Wang, Z. Shi and S. Feng, Hydrophilic, upconverting, multicolor, lanthanide-doped NaGdF4 nanocrystals as potential multifunctional bioprobes, Chemistry, 2012, 18(37), 11641–11646 CrossRef CAS PubMed.
- B. Ju, H. Nie, X.-g. Zhang, Q. Chen, X. Guo, Z. Xing, M. Li and S. X.-A. Zhang, Inorganic salt incorporated solvothermal synthesis of multicolor carbon dots, emission mechanism, and antibacterial study, ACS Appl. Nano Mater., 2018, 1(11), 6131–6138 CrossRef CAS.
- Z. Yan, J. Chen, A. Xiao, J. Shu and J. Chen, Effects of representative quantum dots on microorganisms and phytoplankton: a comparative study, RSC Adv., 2015, 5(129), 106406–106412 RSC.
- Y. Zhan, T. Geng, Y. Liu, C. Hu, X. Zhang, B. Lei, J. Zhuang, X. Wu, D. Huang, G. Xiao and B. Zou, Near-ultraviolet to near-infrared fluorescent nitrogen-doped carbon dots with two-photon and piezochromic luminescence, ACS Appl. Mater. Interfaces, 2018, 10(33), 27920–27927 CrossRef CAS PubMed.
- F. Wang, X. Fan, M. Wang and Y. Zhang, Multicolour PEI/NaGdF4:Ce3+,Ln3+ nanocrystals by single-wavelength excitation, Nanotechnology, 2007, 18(2), 025701 CrossRef.
- H. Yu, A. Yu, Y. Li, Y. Song, Y. Wu, C. Sheng and B. Chen, Energy transfer processes in electrospun LaOCl:Ce/Tb nanofibres, J. Alloys Compd., 2016, 683, 256–262 CrossRef CAS.
- L. Yu, D. Li, M. Yue, J. Yao and S. Lu, Dependence of morphology and photoluminescent properties of GdPO4:Eu3+ nanostructures on synthesis condition, Chem. Phys., 2006, 326(2–3), 478–482 CrossRef CAS.
- C. Mi, H. Gao, F. Li and S. Xu, Synthesis of surface amino-functionalized NaGdF4:Ce,Tb nanoparticles and their luminescence resonance energy transfer (LRET) with Au nanoparticles, Colloids Surf., A, 2012, 395, 152–156 CrossRef CAS.
- X. G. Juarez, H. Ko and H. S. Jang, Strong upconversion-downshifting green emission from Tb3+ ions in core/shell/shell-structured nanophosphors, Res. Chem. Intermed., 2018, 44(8), 4641–4650 CrossRef CAS.
- X. Ling, R. Shi, J. Zhang, D. Liu, M. Weng, C. Zhang, M. Lu, X. Xie, L. Huang and W. Huang, Dual-signal luminescent detection of dopamine by a single type of lanthanide-doped nanoparticles, ACS Sens., 2018, 3(9), 1683–1689 CrossRef CAS PubMed.
- Y. Song, B. Shao, Y. Feng, W. Lu, G. Liu and H. You, A novel strategy to enhance the luminescence performance of NaGdF4:Ln3+ nanocrystals, Dalton Trans., 2016, 45(23), 9468–9476 RSC.
- M. Ding, M. Xu and D. Chen, A new non-contact self-calibrated optical thermometer based on Ce3+ → Tb3+ → Eu3+ energy transfer process, J. Alloys Compd., 2017, 713, 236–247 CrossRef CAS.
- M. Ding, H. Zhang, D. Chen, Q. H. Junhua Xi and Z. Ji, Color-tunable luminescence, energy transfer and temperature sensing behavior of hexagonal NaYF4:Ce3+/Tb3+/Eu3+ microcrystals, J. Alloys Compd., 2016, 672, 117–124 CrossRef CAS.
- S. B. Aziz, A. Q. Hassan, S. J. Mohammed, W. O. Karim, M. F. Z. Kadir, H. A. Tajuddin and N. Chan, Structural and optical characteristics of PVA:C-dot composites: tuning the absorption of ultra violet (UV) region, Nanomaterials, 2019, 9(2), 216 CrossRef CAS PubMed.
- X. Liu, Z. Xu, C. Chen, D. Tian, L. Yang, X. Luo, A. A. Al Kheraif and J. Lin, Carbon quantum dot-sensitized and tunable luminescence of Ca19Mg2(PO4)14:Ln3+ (Ln3+ = Eu3+ and/or Tb3+) nanocrystalline phosphors with abundant colors via a sol–gel process, J. Mater. Chem. C, 2019, 7(8), 2361–2375 RSC.
- K. Radhakrishnan, P. Panneerselvam and M. Marieeswaran, A green synthetic route for the surface-passivation of carbon dots as an effective multifunctional fluorescent sensor for the recognition and detection of toxic metal ions from aqueous solution, Anal. Methods, 2019, 11(4), 490–506 RSC.
- Z. Gao, C. Sun, H. Liu, S. Shi, C. Geng, L. Wang, S. Su, K. Tian, Z. H. Zhang and W. Bi, White light-emitting diodes based on carbon dots and Mn-doped CsPbMnCl3 nanocrystals, Nanotechnology, 2019, 30(24), 245201 CrossRef CAS PubMed.
- Q. Liu, N. Zhang, H. Shi, W. Ji, X. Guo, W. Yuan and Q. Hu, One-step microwave synthesis of carbon dots for highly sensitive and selective detection of copper ions in aqueous solution, New J. Chem., 2018, 42(4), 3097–3101 RSC.
- K. Jiang, X. Feng, X. Gao, Y. Wang, C. Cai, Z. Li and H. Lin, Preparation of multicolor photoluminescent carbon dots by tuning surface states, Nanomaterials, 2019, 9(4), 529 CrossRef CAS PubMed.
- P. Y. Liyanage, R. M. Graham, R. R. Pandey, C. C. Chusuei, K. J. Mintz, Y. Zhou, J. K. Harper, W. Wu, A. H. Wikramanayake, S. Vanni and R. M. Leblanc, Carbon nitride dots: a selective bioimaging nanomaterial, Bioconjugate Chem., 2019, 30(1), 111–123 CrossRef CAS PubMed.
- X. Xu, X. Zhang, C. Hu, Y. Zheng, B. Lei, Y. Liu and J. Zhuang, Construction of NaYF4:Yb,Er(Tm)@CDs composites for enhancing red and NIR upconversion emission, J. Mater. Chem. C, 2019, 7(21), 6231–6235 RSC.
| This journal is © The Royal Society of Chemistry 2023 |