 Open Access Article
Sensitive detection of cadmium ions based on a quantum-dot-mediated fluorescent visualization sensor†
Qiushuang Ai a,
Yifan Donga,
Xiren Yua,
Peiling Weib,
Dawen Zhang*a and
Suyan Qiu
 *a
*a
aKey Laboratory for Quality and Safety Control of Poultry Products, Ministry of Agriculture and Rural Affairs of the People's Republic of China, Institute for Quality & Safety and Standards of Agricultural Products Research, Jiangxi Academy of Agricultural Sciences, Nanchang, Jiangxi 330200, China. E-mail: zdw3296@163.com; qiusuyan@126.com
bQuality Standards Institute of Animal Husbandry, Xinjiang Academy of Animal Sciences, Urumqi, Xinjiang 830011, China
First published on 30th August 2023
Abstract
A sensitive ratiometric fluorescent sensor for detecting cadmium ions (Cd2+) was constructed based on carbon quantum dots (CQDs)/CdTe quantum dots (CdTe QDs). Red fluorescence (from CdTe QDs) played the role of the signal response and blue fluorescence (from CQDs) served as a reference probe without a color change. The fluorescent sensor showed high selectivity and sensitivity to Cd2+ with a limit of detection (LOD) of 0.018 μM and a range from 0.1 μM to 23 μM. The proposed method was successfully applied to the determination of Cd2+ in real rice samples. In addition, a fluorescent sensor integrated with a smartphone platform was further designed for the visualized and quantitative detection of Cd2+. This work might extend the range of visualization analysis strategies and provide new insights into the rapid quantitative, portable and sensitive detection of Cd2+ in real-time and on-site applications.
Introduction
Environmental and food contamination caused by cadmium (Cd) residues has attracted growing attention over recent years. Cadmium enrichment in crops and aquatic organisms will lead to serious harm to the environment and human health.1,2 It is easily accumulated in human organs, causing damage to the kidney, liver and other organs.3 Long-term exposure to cadmium will damage blood vessels and systems, and even increase the risk of cancer. For these reasons, it is vitally important to establish sensitive methods for the quantitative detection of Cd2+. Most determination of Cd2+ is analysed with traditional techniques such as atomic absorption spectrometry (AAS),4,5 atomic emission spectrometry (AES),6 inductively coupled plasma mass spectrometry (ICP-MS),7 etc. However, these methods cannot meet the demand for the rapid detection of Cd2+ due to the need for professional operation, expensive instruments and time-consuming analysis, which limit their application for real-time and on-site detection. Hence, there is an urgent need to design a rapid, inexpensive and portable strategy for monitoring cadmium both in the environment and in bio-systems.With its advantages of high sensitivity, convenience and cost-effectiveness, fluorescent spectrometry has become a promising sensing method for the visual detection of some hazardous analytes through color change, as well as quantitative analysis. In recent years, numerous researchers have been engaged in designing fluorescence sensors for the sensitive recognition of Cd2+.8,9 Several peptide-based fluorescent “turn-on” chemosensors10 and an AuNP–UCNP nanosensor-based FRET have been developed to detect Cd2+ in drinking water.11 However, the shortcomings of such organic fluorophores can be attributed to their complex synthesis and purification, poor light stability and weak solubility in aqueous media, which limit their practical applications. Quantum dot (QD)-based fluorescence sensors have been extensively investigated due to their reliable luminescence spectra, high quantum yield, and excellent photochemical stability.12–16 Among them, carbon quantum dots (CQDs) and semiconductor quantum dots (QDs) are considered to be the most widely used luminescent agents. Carbon quantum dots, with their good biocompatibility, photostability and broadband optical absorption, serve as popular fluorescence labels.17–20 Cadmium telluride (CdTe) shows unique optoelectronic performance. And CdTe QDs have been considered promising candidates for the determination of analytes.21–24 However, not only organic fluorophore-based fluorescence sensors but also QD-based fluorescence systems are mostly single emitting fluorescence probes which show weak anti-interference capability and low repeatability in real samples. In comparison with a single-wavelength fluorescence probe, a dual-emission fluorescence probe is not likely to suffer interference from the background or fluctuation due to environmental conditions, contributing to an increase in their reliability and sensitivity. Until now, ratiometric fluorescent sensors consisting of a combination of QDs have shown appreciable feasibility for recognition and sensing applications.25–29 Considering the importance of monitoring Cd2+, these ratiometric fluorescence sensing platforms are expected to be integrated with smart analysis devices for practical applications in real-time and on-site use.8,30–32 Smartphone-assisted fluorescence sensors provide a convenient method for the effective and sensitive detection of Cd2+ with miniaturization, low cost and fast data processing. The design of colorimetric or fluorescence sensors is still very critical, especially those that show fast response, are easy to carry and have better visualization.
Here, we have developed a dual-emitting fluorescence sensor for the sensitive detection of Cd2+. The fluorescence sensor consisted of blue CQDs and red-emitting CdTe QDs. Recognition sites for Cd2+ on the surface of CdTe QDs were generated by etching with ethylenediamine tetraacetic acid (EDTA), and the fluorescence was quenched.21 With the addition of Cd2+, CdTe QDs selectively bind Cd2+, the surface defects were repaired and the fluorescence was restored (Fig. 1). The stable blue-emitting CQDs were used as the reference probe for increasing the accuracy as well as enhancing the color richness of the fluorescent sensor. With the combination of QDs, the fluorescence probe showed various responses in the presence of different concentrations of Cd2+. In addition, a smartphone platform was integrated to identify the RGB values of the fluorescence response for the visual and quantitative detection of Cd2+. The fluorescent sensor showed high sensitivity to Cd2+ with a detection limit (LOD) of 0.018 μM. In application, real rice samples were employed to examine the as-prepared fluorescence sensor. This work enriches the visualization analysis strategy and contributes to the development of the rapid, quantitative, and portable detection of Cd2+.
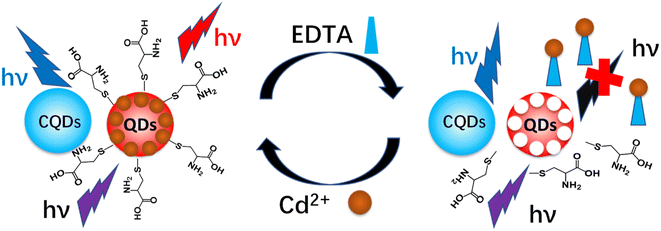 | ||
| Fig. 1 Schematic illustration of the detection of cadmium ions by a CQDs/CdTe QDs ratiometric fluorescent sensor. | ||
Materials and methods
Reagents and chemicals
Citric acid, triethylamine, tellurium powder (Te), sodium borohydride (NaBH4), cadmium chloride (CdCl2·2.5H2O), L-cysteine, sodium hydroxide (NaOH), isopropyl alcohol, ethylenediamine tetraacetic acid disodium (EDTA·Na2), glutathione (GSH), tetrasodium iminodisuccinate (IDS), dithiothreitol (DTT) and tris buffer were purchased from Sinopharm Chemical Reagent Co., Ltd. All chemicals were of analytical grade and used directly without further purification. A standard rice sample (GBW100348) was purchased from the Academy of National Food and Strategic Reserves Administration. Two normal rice samples were purchased from the local supermarket. Deionized water from a Milli-Q water purifying system was used to prepare all of the solutions (18.2 MΩ).Instruments and characterization
X-ray photoelectron spectroscopy (XPS) spectra were acquired using an Escalab 250Xi (Thermo, America). A Talos F200X transmission electron microscope (TEM) (FEI, America) was used to measure the morphology of the as-prepared particles. X-ray powder diffraction (XRD) spectra were recorded on a D8 ADVANCE (Brucker, Germany). Fluorescence measurements were carried out using an RF-5301PC spectrofluorophotometer (Shimadzu, Japan) equipped with a 1 cm path-length quartz cell and a xenon lamp with right-angle geometry.Preparation of CQDs
CQDs were prepared according to the reported procedure.33 Citric acid (2.0 g) was dissolved by mixing in deionized water (25 mL), followed by the addition of 3 mL of triethylamine. The mixture was stirred at room temperature for 5 min, and then transferred into a stainless-steel autoclave and heated at 160 °C for 6 h. After cooling down to room temperature, CQDs were obtained after dialysis and drying. The concentration of the as-prepared CQDs was around 5 mg mL−1.Synthesis of CdTe QDs
CdTe QDs were prepared according to the reported literature.21 First, NaHTe solution was obtained according to the following steps. 151.2 mg of NaBH4 and 25.5 mg of Te powder were added to a small flask to form 5 mL of homogeneous aqueous solution. The mixture was stirred for 6 h at 0 °C under N2 atmosphere. The obtained NaHTe solution was used as a Te precursor for further use.Second, Cd precursor solutions were prepared according to the following steps. CdCl2·2.5H2O (91.3 mg) and L-cysteine (121.2 mg) were placed into a flask, followed by the addition of 95 mL of DI water. The pH value of the aqueous solution was adjusted to 9 with NaOH solution. Then, a freshly prepared NaHTe solution was quickly mixed into the Cd precursor solutions. The solution mixture was refluxed for 7–8 min and then kept under continuous stirring for 1 h in a 60 °C water bath. The obtained solution was treated by centrifugation with isopropyl alcohol at 8000 rpm for 15 min, and resuspended in DI water. The molar concentration of the CdTe QDs solution was estimated to be around 25 mM in the following experiments.
Determination of Cd2+
The CQDs/CdTe QDs aqueous solution was prepared according to the following steps. 10 μL of CQDs solution and 62.5 μL of CdTe QDs solution were mixed with tris buffer (pH = 9), followed by the addition of 5 μL of EDTA (1 mM). After incubating for about 10 min at room temperature, different volumes of Cd2+ (500 μM) were added into the CQDs/CdTe QDs aqueous solutions, where the final volume was 250 μL. The fluorescence spectra of the QD system aqueous solution in the absence and presence of Cd2+ of different concentrations were collected under 375 nm excitation.Selectivity measurements for Cd2+
In the selectivity measurements for Cd2+, several metal ions (Na+, K+, Ca2+, Mg2+, Zn2+, Fe3+, Cu2+, Ba2+, Pb2+ and Mn2+) were selected as interfering ions and used for the investigation. Fluorescence spectra of QD system aqueous solution in the presence of different ions were collected under 375 nm excitation. The concentration of Cd2+ was 10 μM and the other ions were 20 μM; the same detection conditions were selected as detailed above.Application in real samples
Normal and standard rice samples were digested with the acid method. Briefly, rice samples were triturated and sieved by 40 meshes. Rice powder (0.5 g) was placed in a beaker, followed by the addition of 10 mL of HNO3 (5%). The rice powder was immersed in HNO3 for 2 h, and then sonicated for 15 min. The mixture was treated by centrifugation at 3000 rpm for 10 min. The obtained supernatant was diluted to 25 mL and the pH adjusted to 7 with dropwise addition of NaOH solution. The obtained solution was the rice sample for future use.Three rice samples were first analyzed by the QD-based method. Fluorescence spectra of QD system aqueous solution were collected under 375 nm excitation in the absence and presence of 62.5 μL of rice sample solution. For comparison, the standard rice sample was further analyzed using atomic absorption spectroscopy (AAS). The recovery in the spiked samples was calculated based on the linear regression equation obtained in the standard experiment.
Results and discussion
Characterization of CQDs and CdTe QDs
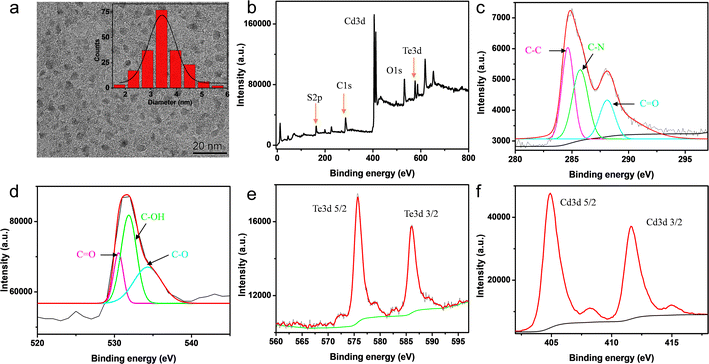
The morphology and particle size distribution of as-prepared CdTe QDs were determined through TEM. As shown in Fig. 2a, CdTe QDs were observed to be well-dispersed nanoparticles with a Gaussian particle size of about 3.4 nm. The TEM image (Fig. S1†) showed that the CQDs were uniformly distributed with an average particle size of about 2.2 nm. XPS spectra were used to gain further structural insights into the CdTe QDs. Fig. 2b showed the full survey XPS spectrum. The peaks at 284.99 eV (C), 351.19 eV (O), 575.7 eV (Te), 404.91 eV (Cd) and 162.02 eV (S) revealed that the CdTe QDs consisted of C, O, Te, Cd and S elements28 and the relative atomic percentage of each element was 60.54%, 1.12%, 3.00%, 18.2% and 17.14%, respectively (Table S1†). The high-resolution C 1s spectrum (Fig. 2c) could be deconvoluted into three peaks, in which the binding energies at 284.6 eV, 285.7 eV, and 288.1 eV could be attributed to C–C, C–N, and C![[double bond, length as m-dash]](https://www.rsc.org/images/entities/char_e001.gif) O, respectively. The peaks in the O 1s spectrum located at 530.6 eV, 531.8 eV and 534.3 eV, indicate the existence of C–O, C–OH and C
O, respectively. The peaks in the O 1s spectrum located at 530.6 eV, 531.8 eV and 534.3 eV, indicate the existence of C–O, C–OH and C![[double bond, length as m-dash]](https://www.rsc.org/images/entities/char_e001.gif) O bonds (Fig. 2d). In the Te 3d spectrum (Fig. 2e), the peaks ascribed to Te 3d5/2 and Te 3d3/2 were found at 575.7 eV and 586.1 eV. The Cd 3d spectrum involved two peaks at 404.9 eV and 411.6 eV, which were assigned to Cd 3d5/2 and Cd 3d3/2, respectively (Fig. 2f). In addition, the peak at 162.3 eV in the S 2p spectrum associated with C–S could be observed in Fig. S2.†
O bonds (Fig. 2d). In the Te 3d spectrum (Fig. 2e), the peaks ascribed to Te 3d5/2 and Te 3d3/2 were found at 575.7 eV and 586.1 eV. The Cd 3d spectrum involved two peaks at 404.9 eV and 411.6 eV, which were assigned to Cd 3d5/2 and Cd 3d3/2, respectively (Fig. 2f). In addition, the peak at 162.3 eV in the S 2p spectrum associated with C–S could be observed in Fig. S2.†
Optimal fluorescence spectra and fluorescence intensity of CQDs and CdTe QDs
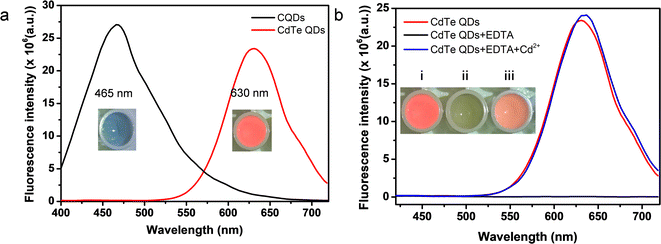
The luminescent properties of CQDs and CdTe QDs were characterized by UV-vis absorption and fluorescence spectroscopy. As shown in Fig. S3,† the absorption peak of CdTe QDs appeared at 400 nm. Fig. 3a showed the representative emission spectra of CQDs and CdTe QDs. CQDs had an emission peak at 465 nm with an excitation wavelength of 375 nm (the black line in Fig. 3a), and a bright blue fluorescence was observed under a 365 nm UV lamp. Upon 375 nm excitation, CdTe QDs emitted bright red emission at 630 nm (red line in Fig. 3a). Also displayed in Fig. 3b, a bright red fluorescence was observed for CdTe QDs aqueous solution under a 365 nm UV lamp (inset image (i)). However, fluorescence quenching was observed with the presence of EDTA (black line in Fig. 3b, inset image (ii)). Here, EDTA played the role of etchant that could combine with Cd2+ to form Cd2+ defects on the surface of CdTe QDs, which induced the quenching of CdTe QDs.21,34 Fluorescence spectra of CdTe QDs in the absence (F0) and presence (F) of different chelating agents were recorded under 375 nm excitation. As shown in Fig. S4,† the emission intensity ratio F/F0 of CdTe QDs with EDTA reached a minimum, indicating that EDTA exhibited the best quenching ability compared with GSH, IDS or DTT. Notably, the addition of Cd2+ contributed to recovery of the fluorescence of CdTe QDs solution (blue line in Fig. 3b, inset image in Fig. 3b(iii)). The introduced Cd2+ could identify the Cd2+ recognition sites and restore the fluorescence of CdTe QDs.Conditions for optimization of the CQDs/CdTe QDs system
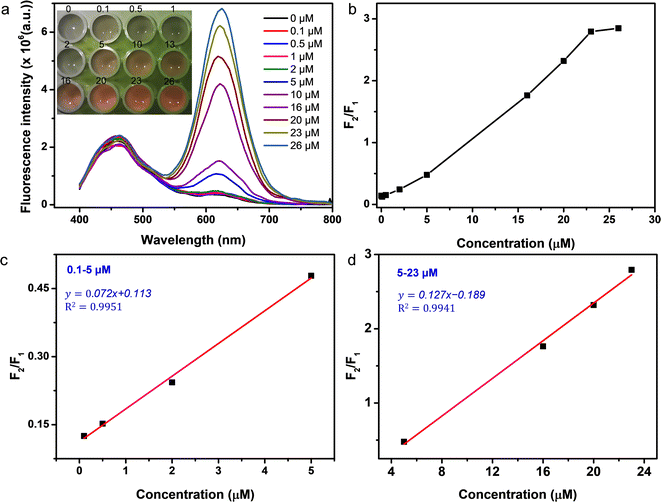
The effect of EDTA concentration was investigated first. Fig. S5† illustrated the fluorescence spectra of the CQDs/CdTe QDs system under various EDTA concentrations. As displayed in Fig. S5,† the fluorescence intensity of CQDs did not change significantly (black line from the inset). The quenching effect of EDTA concentration on the CQDs/CdTe QDs system was explored in Fig. S5a.† The fluorescence intensity of CdTe QDs at 630 nm clearly decreased with increasing concentration of EDTA from 0 to 20 μM (red line from the inset of Fig. S5a†). And the fluorescence emission almost disappeared when the concentration was over 20 μM. Fig. S5b† revealed the effect of EDTA on the recovery of the CQDs/CdTe QDs system in the presence of Cd2+ with the concentration fixed at 10 μM. The inset showed that the intensity of CdTe QDs at 630 nm gradually increased at first and reached a maximum when the concentration of EDTA was 20 μM. Therefore, 20 μM EDTA was the optimum concentration in the following experiments. Moreover, the etching effect on the fluorescence of the CQDs/CdTe QDs system was explored. Basically, a rapid quenching effect of EDTA on the CQDs/CdTe QDs system was observed. As shown in Fig. S6,† the quenching reaction of Cd2+ could be completed within 2 min. And the fluorescence intensity ratio (F2/F1) was almost stable at about 8 min, where F2 and F1 represent the FL intensity of CdTe QDs and CQDs, respectively. Therefore, a total etching time of 10 min was used to prepare the fluorescent probe for further experiments.Cd2+-induced fluorescence turn-on of the CQDs/CdTe QDs system was further studied, as shown in Fig. 4a. The emission intensity of the peak at 630 nm (red line in the inset of Fig. 4a) corresponding to CdTe QDs gradually increased with an increasing concentration of Cd2+ under 375 nm excitation, while a rare change in CQDs was observed (black line in the inset of Fig. 4a). To identify the response time of the ratiometric probe to Cd2+, the restorative effect of the QD system was investigated. As shown in Fig. 4b, a rapid recovery time of the EDTA-etched CQDs/CdTe QDs system in the presence of Cd2+ was observed. The corresponding fluorescence spectra of the CQDs/CdTe QDs system were shown in Fig. S7 in ESI.† The fluorescence intensity ratio (F2/F1) dramatically increased during the first 2 min, and it reached equilibrium around 10 min. Thus, a total recovery time of 10 min was used in the following experiments. Furthermore, XPS studies of EDTA-etched CdTe QDs before and after reacting with Cd2+ were conducted. Fig. S8† revealed two peaks attributed to Cd 3d5/2 and Cd 3d3/2 located at 405.2 eV and 411.9 eV (Fig. S8a†), which indicated around 0.3 eV red shift compared with the CdTe QDs. The Cd 3d spectrum of CdTe QDs after reacting with Cd2+ showed little difference from the Cd 3d spectrum of CdTe QDs (Fig. S8b†). The XPS studies provided evidence that the fluorescent probe CdTe QDs had a response to Cd2+.
The pH was also an important issue that needed to be considered. Fig. S9† illustrated the fluorescence spectra of the CQDs/CdTe QDs system under various pH values. The fluorescence intensity of the CQDs did not change significantly (inset of Fig. S9a†). Here, the intensity ratio (F/F0) of CdTe QDs in the absence (F0) and presence (F) of Cd2+ under different pH was investigated. As shown in Fig. S9b,† the fluorescence intensity of CdTe QDs around 630 nm was quite low when the pH was less than 6. And the value (F/F0) was observed to show little difference from 3 to 6 (Fig. 4c). This might be due to the instability of CdTe QDs under low pH values.13 With the pH increasing from 6 to 11, the intensity of CdTe QDs increased and the value of F/F0 reached a maximum at 9. Considering the high pH value led to less quenching efficiency,21 here 9 was chosen as the optimized pH for further experiments.
Fluorescent visualization detection of Cd2+ based on a QD-mediated system
With a combination of dual photoluminescence emission and colorful responses, the CQDs/CdTe QDs system could be used for the construction of ratiometric fluorescent probes. As pictured in Fig. 5a (inset), the QD-mediated system exhibited various colors in the presence of Cd2+ at different concentrations under 375 nm excitation, which could be discerned by the naked eye. It was found that the colors of the probe could be affected by the volume ratio of CQDs/CdTe QDs (Fig. S10†). The volume ratio 1![[thin space (1/6-em)]](https://www.rsc.org/images/entities/char_2009.gif) :
:![[thin space (1/6-em)]](https://www.rsc.org/images/entities/char_2009.gif) 6 was selected as the optimal parameter in the following experiments. As mentioned above, the intensity of CQDs showed little difference as the concentration of Cd2+ changed. Here CQDs played the role not only of an internal reference but as a toner to create a richer color for the system. The feasibility of QD-based fluorescent sensors for Cd2+ detection was investigated by a Cd2+ titration experiment. Fig. 5a illustrated the emission intensity of the CQDs/CdTe QDs system in the absence and presence of Cd2+ under 375 nm excitation. The intensity response at 630 nm gradually increased with the increasing concentration of Cd2+. The corresponding ratio (F2/F1) versus Cd2+ concentration from 0.1 to 50 μM were calculated, where F2 and F1 represent the FL intensity of CdTe QDs and CQDs, respectively. As illustrated in Fig. 5b, the value of F2/F1 for the QD system reached a maximum at 26 μM. It was found that the emission intensity ratio (F2/F1) showed a good linear relationship with the concentration of Cd2+. As illustrated in Fig. 5c, the linear equation (y = 0.072x +0.113) between (F2/F1) and the concentration of Cd2+ was found in the range from 0.1 to 5 μM with R2 = 0.9951. Furthermore, excellent linear regression (y = 0.127x −0.189) was obtained in the range from 5 to 23 μM with R2 = 0.9941 (Fig. 5d). The limit of detection was estimated as 0.018 μM (0.002 mg L−1) according to 3 times the standard deviation of the blank, which was far lower than the maximum level for rice (1.8 μM, 0.2 mg L−1) permitted by the Chinese National Standard. In addition, the proposed method was found to be comparable with reported fluorescent sensors (Table S2†).
6 was selected as the optimal parameter in the following experiments. As mentioned above, the intensity of CQDs showed little difference as the concentration of Cd2+ changed. Here CQDs played the role not only of an internal reference but as a toner to create a richer color for the system. The feasibility of QD-based fluorescent sensors for Cd2+ detection was investigated by a Cd2+ titration experiment. Fig. 5a illustrated the emission intensity of the CQDs/CdTe QDs system in the absence and presence of Cd2+ under 375 nm excitation. The intensity response at 630 nm gradually increased with the increasing concentration of Cd2+. The corresponding ratio (F2/F1) versus Cd2+ concentration from 0.1 to 50 μM were calculated, where F2 and F1 represent the FL intensity of CdTe QDs and CQDs, respectively. As illustrated in Fig. 5b, the value of F2/F1 for the QD system reached a maximum at 26 μM. It was found that the emission intensity ratio (F2/F1) showed a good linear relationship with the concentration of Cd2+. As illustrated in Fig. 5c, the linear equation (y = 0.072x +0.113) between (F2/F1) and the concentration of Cd2+ was found in the range from 0.1 to 5 μM with R2 = 0.9951. Furthermore, excellent linear regression (y = 0.127x −0.189) was obtained in the range from 5 to 23 μM with R2 = 0.9941 (Fig. 5d). The limit of detection was estimated as 0.018 μM (0.002 mg L−1) according to 3 times the standard deviation of the blank, which was far lower than the maximum level for rice (1.8 μM, 0.2 mg L−1) permitted by the Chinese National Standard. In addition, the proposed method was found to be comparable with reported fluorescent sensors (Table S2†).
Selectivity and anti-interference ability of CQDs/CdTe QDs-based fluorescent probe
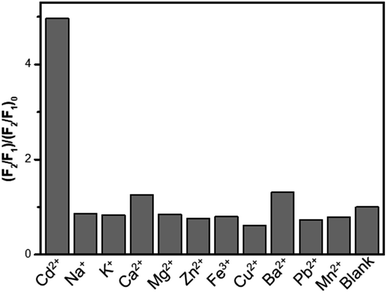
The selectivity of the QD-fluorescence system towards Cd2+ and other interfering ions was investigated, including the cations Na+, K+, Ca2+, Mg2+, Zn2+, Fe3+, Cu2+, Ba2+, Pb2+ and Mn2+. As displayed in Fig. 6, only the presence of Cd2+ led to a significant increase in the fluorescence intensity ratio (F2/F1)/(F2/F1)0 while the addition of other ions had little effect on the value, even when the concentration of these ions was higher than that of Cd2+. Therefore, the CQDs/CdTe QDs system exhibited superiority in the aspects of selectivity for Cd2+ determination, which indicated that the QD-based fluorescence system has great potential in the detection of Cd2+ in real samples.Fluorescent determination of Cd2+ in real samples
The applicability of the proposed method was used for the determination of Cd2+ in the two rice samples purchased from the local supermarket. As shown in Table 1, no Cd2+ was detected in the real samples. In addition, a recovery study was also carried out on samples spiked with standard Cd2+ solutions (2, 5 and 10 μM) to evaluate the proposed method. The obtained recoveries of the samples varied from 84.1% to 105.4%.| Samples | Added (μM) | Found (μM) | RSD (%, n = 3) | Recovery (%) |
|---|---|---|---|---|
| 1 | 0.0 | 0.00 | — | — |
| 2.0 | 1.97 | 6.34 | 98.5 | |
| 5.0 | 5.27 | 1.78 | 105.4 | |
| 10.0 | 8.41 | 8.23 | 84.1 | |
| 2 | 0.0 | 0.00 | — | — |
| 2.0 | 1.90 | 9.01 | 95.0 | |
| 5.0 | 4.23 | 7.52 | 84.6 | |
| 10.0 | 8.88 | 0.60 | 88.8 |
Because of potential unknown interference sources in real samples, compared with the proposed method, atomic absorption spectroscopy (AAS) was explored for the detection of Cd2+ in real rice samples to further explore the applicability and reliability of the methods. The standard rice sample (GBW100348) was investigated with the corresponding 5 μM Cd. The Cd2+ concentrations detected through the FL method and AAS in the real samples were 4.28 and 4.06 μM (Table S3†). Gratifyingly, the detection results from the FL method agreed well with those obtained from AAS, suggesting the applicability of the proposed method to rice samples.
Smartphone application for the detection of Cd2+
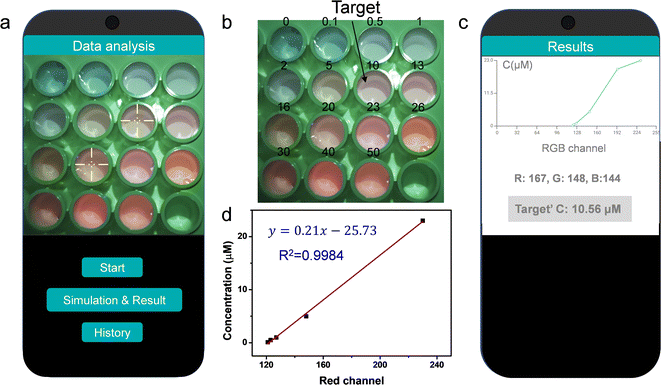
The CQDs/CdTe QDs system presented color changes with increasing Cd2+ from blue to pink under a 365 nm UV lamp, which could be a candidate for smartphone application. A photograph of the CQDs/CdTe QDs solution with various concentrations of Cd2+ was taken under a 365 nm UV lamp (Fig. 7a and b). By importing the photograph of QD-based fluorescent probes in the presence of Cd2+ under ultraviolet light, a (custom-developed) App could recognize the color information and give the result of the concentration of Cd2+ (Fig. 7c). As shown in Fig. 7c, the target concentration was calculated as 10.56 μM, which was very close to the real value of 10 μM. By analyzing the relationship of the RGB values of the CQDs/CdTe QDs system and the concentration of Cd2+, there was good linearity between the concentration of Cd2+ and the red channel in the range from 0.1 to 50 μM with R2 = 0.9984 (Fig. 7d). The corresponding limit of detection is 0.11 μM. This data indicated that the proposed fluorescent system combined with a smartphone could simplify the detection process and enable the portable and semiquantitative detection of Cd2+ in real time.Conclusions
In summary, we developed a ratiometric fluorescence sensing platform for the sensitive detection of Cd2+. The fluorescent probe exhibited a color response from blue to pink with an increase in Cd2+ concentration. The fluorescence sensor showed high selectivity and sensitivity to Cd2+ with a limit of detection (LOD) of 0.018 μM. The fluorescence intensity ratio (F2/F1) was in good linear relationship with the Cd2+ concentration in the range from 0.1 μM to 23 μM. Real rice samples were employed to examine the as-prepared fluorescence method, which agreed well with the AAS method. Furthermore, the fluorescent sensor was successfully integrated with a smartphone for the rapid detection of Cd2+ with an LOD of 0.11 μM. The smartphone-based fluorescent sensor might enable the application of the rapid, portable and sensitive detection of Cd2+.Author contributions
Qiushuang Ai: investigation, methodology, data analysis, writing-original draft, review & editing. Yifan Dong: methodology, characterization. Xiren Yu: data curation, investigation. Peiling Wei: characterization. Dawen Zhang: supervision, funding acquisition. Suyan Qiu: writing & review, supervision, funding acquisition.Conflicts of interest
The authors declare no competing interests.Acknowledgements
This work was financially supported by National Natural Science Foundation of China (No. 21964009), Major Discipline Academic and Technical Leaders Training Program of Jiangxi Province (No. 20204BCJ23012), Jiangxi Special Fund for Agro-scientific Research in the Collaborative Innovation (No. JXXTCX202110), Jiangxi Research and Development Program (No. 20202BBFL63040), Earmarked Fund for Jiangxi Agriculture Research System (No. JXARS-24-03), and Xinjiang Science and Technology Support Project (No. 2021E02031).References
- Y. Safari, M. A. Delavar, C. Zhang, Z. Noori and M. Rahmanian, Int. J. Environ. Sci. Technol., 2018, 15, 887–894 CrossRef CAS.
- A. G. Niño-Savala, Z. Zhuang, X. Ma, A. Fangmeier, H. Li, A. Tang and X. Liu, Front. Agr. Sci. Eng., 2019, 6, 419–430 CrossRef.
- N. Omidifar, A. Nili-Ahmadabadi, A. Gholami, D. Dastan, D. Ahmadimoghaddam and H. Nili-Ahmadabadi, J. Evidence-Based Complementary Altern. Med., 2020, 2020, 7457504 Search PubMed.
- R. Golbedaghi, S. Jafari, M. R. Yaftian, R. Azadbakht, S. Salehzadeh and B. Jaleh, J. Iran. Chem. Soc., 2012, 9, 251–256 CrossRef CAS.
- O. Zvěřina, J. Kuta, P. Coufalík, P. Kosečková and J. Komárek, Food Chem., 2019, 298, 125084 CrossRef PubMed.
- A. Matsumoto, S. Osaki, T. Kobata, B. Hashimoto, H. Uchihara and T. Nakahara, Microchem. J., 2010, 95, 85–89 CrossRef CAS.
- Y. Cao, B. Deng, L. Yan and H. Huang, Talanta, 2017, 167, 520–525 CrossRef CAS PubMed.
- H. Wang, L. Da, L. Yang, S. Chu, F. Yang, S. Yu and C. Jiang, J. Hazard. Mater., 2020, 392, 122506 CrossRef CAS PubMed.
- Y. Zhang, X. Chen, X. Liu, M. Wang, J. Liu, G. Gao, X. Zhang, R. Sun, S. Hou and H. Wang, Sens. Actuators, B, 2018, 273, 1077–1084 CrossRef CAS.
- P. Wang, J. Wu and C. Zhao, Spectrochim. Acta, Part A, 2020, 226, 117600 CrossRef CAS PubMed.
- L. Sun, T. Wang, Y. Sun, Z. Li, H. Song, B. Zhang, G. Zhou, H. Zhou and J. Hu, Talanta, 2020, 207, 120294 CrossRef CAS PubMed.
- Y. J. Zhang, B. Liu, Z. M. Liu and J. K. Li, New J. Chem., 2022, 46, 20515–20539 RSC.
- H. Xu, R. Miao, Z. Fang and X. Zhong, Anal. Chim. Acta, 2011, 687, 82–88 CrossRef CAS PubMed.
- J. Zhou, B. Li, A. Qi, Y. Shi, J. Qi, H. Xu and L. Chen, Sens. Actuators, B, 2020, 305, 127462 CrossRef CAS.
- M. Xiao, Q. Fu, H. Shen, Y. Chen, W. Xiao, D. Yan, X. Tang, Z. Zhong and Y. Tang, Talanta, 2018, 178, 644–649 CrossRef CAS PubMed.
- S. Banerjee, S. Kar and S. Santra, Chem. Commun., 2008, 3037–3039 RSC.
- Y. Song, N. Qi, K. Li, D. Cheng, D. Wang and Y. Li, RSC Adv., 2022, 12, 8108–8118 RSC.
- M. J. Molaei, Talanta, 2019, 196, 456–478 CrossRef CAS PubMed.
- X. Shi, W. Wei, Z. Fu, W. Gao, C. Zhang, Q. Zhao, F. Deng and X. Lu, Talanta, 2019, 194, 809–821 CrossRef CAS PubMed.
- H. Bai, Z. Tu, Y. Liu, Q. Tai, Z. Guo and S. Liu, J. Hazard. Mater., 2020, 386, 121654 CrossRef CAS PubMed.
- S. Wang, J. Zhu, X. Li, J. Li and J. Zhao, Spectrochim. Acta, Part A, 2018, 201, 119–127 CrossRef CAS PubMed.
- Y. Pan, Z. Fang, H. Chen, Z. Long and X. Hou, Luminescence, 2021, 36, 1525–1530 CrossRef CAS PubMed.
- H. Zhou, C. Yang, M. Liao, M. Li, N. Diao, S. Wu and J. Wang, Chem. Phys. Lett., 2022, 792, 139415 CrossRef CAS.
- M. Safari, S. Najafi, E. Arkan, S. Amani and M. Shahlaei, Microchem. J., 2019, 146, 293–299 CrossRef CAS.
- J. Yan, Q. Fu, S. Zhang, Y. Liu, X. Shi, J. Hou, J. Duan and S. Ai, Spectrochim. Acta, Part A, 2022, 282, 121706 CrossRef CAS PubMed.
- Y. Wang, W. Li, X. Hu, X. Zhang, X. Huang, Z. Li, M. Li, X. Zou and J. Shi, Food Chem., 2021, 352, 129352 CrossRef CAS PubMed.
- N. Liang, X. Hu, W. Li, Y. Wang, Z. Guo, X. Huang, Z. Li, X. Zhang, J. Zhang, J. Xiao, X. Zou and J. Shi, Food Chem., 2022, 378, 132076 CrossRef CAS PubMed.
- T. Zhang, Z. Gan, S. Zhen, Y. Hu and X. Hu, Opt. Mater., 2022, 134, 113196 CrossRef CAS.
- R. Gui, X. An and W. Huang, Anal. Chim. Acta, 2013, 767, 134–140 CrossRef CAS PubMed.
- Y. Ye, T. Wu, X. Jiang, J. Cao, X. Ling, Q. Mei, H. Chen, D. Han, J.-J. Xu and Y. Shen, ACS Appl. Mater. Interfaces, 2020, 12, 14552–14562 CrossRef CAS PubMed.
- S. Huang, J. Yao, B. Li, G. Ning and Q. Xiao, Microchim. Acta, 2021, 188, 318 CrossRef CAS PubMed.
- N. Mahmoudian, A. Zamani, A. Fashi, P. Richter and H. Abdolmohammad-Zadeh, Food Chem., 2023, 421, 136193 CrossRef CAS PubMed.
- S. Huang, J. Yao, X. Chu, Y. Liu, Q. Xiao and Y. Zhang, J. Agric. Food Chem., 2019, 67, 11244–11255 CrossRef CAS PubMed.
- L. Li, L. Liao, Y. Ding and H. Zeng, RSC Adv., 2017, 7, 10361–10368 RSC.
Footnote |
| † Electronic supplementary information (ESI) available. See DOI: https://doi.org/10.1039/d3ra04255c |
| This journal is © The Royal Society of Chemistry 2023 |

