
 Open Access Article
 This Open Access Article is licensed under a Creative Commons Attribution-Non Commercial 3.0 Unported Licence
Highly dispersive PEI-modified CDs@ZIF-L dual-emitting fluorescent sensor for detecting metal ions†
Xiaoyun Liua,
Chunyan Suna,
Mingxia Chaib and
Weijun Song *a
*a
aSchool of Chemical Engineering, Qinghai University, Xining, 810016, P. R. China. E-mail: wjsong@qhu.edu.cn
bKey Laboratory of Plateau Ecology and Agriculture, Qinghai University, Xining, 810016, P. R. China
First published on 26th October 2023
Abstract
The leaf-like zeolitic imidazolate framework (ZIF-L) is a promising porous nanomaterial that has attracted increasing attention as an ideal host material to encapsulate functional fluorescent nanoparticles for designing fluorescent sensors. However, owing to the large particle size, gravity readily facilitates the precipitation of the ZIF-L from the aqueous solution, and thus lead to imperfect experimental results. Herein, we report a simple and rapid synthetic method which uses the polyethyleneimine (PEI)-modified ZIF-L as a host to solve the precipitation problem and construct a dual-emitting system that combines its fluorescence with carbon dots (CDs). Furthermore, CDs@ZIF-L/PEI with dual-emitting centres could be utilised as a ratio fluorescence sensor to detect Hg2+ ions. The sensor exhibited excellent dispersibility and good selectivity for sensing Hg2+ ions, with a limit of detection (LOD) of 14.5 nM. Furthermore, experimental results reveal that the CDs@ZIF-L/PEI fluorescent sensor could be effectively dispersed into agarose and less polar organic solvents such as DMF, MeOH, EtOH and CH3CN, expanding the application scope of the fluorescent sensor.
Introduction
There has been extensive interest in the recognition and sensing of metal ions owing to their essential roles in biological and environmental systems. Because of its excellent characteristics of simple equipment, user friendliness, high analysis speed and high sensitivity, fluorescence detection has made substantial progress in sensing metal ions. Simple and effective types of sensing practices have been designed based on the response of fluorescence materials to metal ions. The first essential requirement for the sensor to function as a useful fluorescence sensor is to recognise the target metal ions over competing species and register the recognition event in a quantifiable manner. Different types of fluorescent sensing approaches have been developed for detecting metal ions. In particular, the ratio metric fluorescence sensor has been widely acclaimed for achieving accurate detection. Specifically, this sensor quantifies the target by the fluorescence intensity ratio of the different emission wavelengths; one of the fluorescence signals is selectively suppressed or enhanced and the other reference signal is not affected by the target metal ions.1 Hence, it can be self-calibrated through dual-channel detection to eliminate environmental and instrumental inferences.2,3 Generally, a ratio metric fluorescence sensor comprises fluorescent substances and the host. Zeolitic imidazolate frameworks (ZIFs) are an emerging class of porous materials formed by self-assembling metal ions and organic ligands through coordination interactions.4 ZIFs have attracted considerable interest as an ideal host material to encapsulate functional nano fluorescent substances, such as carbon dots (CDs),5 oligonucleotides,6 proteins7 and DNAzyme,8 owing to the particular nanometre-confined space of porous materials.Most ratio fluorescence sensors consider ZIFs as the hosts, which are always loaded with two different fluorescent substances. Because of the weak fluorescence of ZIFs, it is very rare to simultaneously consider ZIFs as the fluorescence substance and the host. However, based on our previous findings, compared with ZIF-8, the leaf-like ZIF (ZIF-L) has a larger loading capacity and exhibits greater improvement in fluorescence performance, indicating that the ZIF-L can probably be used both as a host and a desirable ratio fluorescent substance, which only needs an extra fluorescent substance. Another problem with using ZIF-L as a host is its poor dispersion. Because of the larger particle size, gravity results in easy precipitation of ZIF-L from the solution, making the detection result imperfect. Although the surface-exposed metal sites of ZIF make it possess some level of hydrophilic property, the ZIF-L tends to distribute only in high polarity solvents, limiting its potential applications to less polar environments. Thus, surface chemistry that can enhance particle–solvent interactions is critical.9
In the existing studies, there are usually two ways to solve the dispersibility problem of ZIF materials. One is to use a shell ligand exchange reaction to change the surface of layered ZIF from hydrophobic to hydrophilic.10,11 The other is a seeding method that achieves oil-repellent performance by coating the surface, such as ZIF-8 film-coated stainless steel meshes (ZFCMs).12 In a ZIF-8-based sensor, polyethylene glycol (PEG), polyethyleneimine (PEI), or other polymer compounds can be used owing to their high hydrophilicity. When PEG and PEI are modified on the ZIF-8 surface, the dispersion of ZIF-8 can be effectively improved.13–15
CDs are popular in fluorescence sensing due to their excellent water solubility, fluorescence stability, low cytotoxicity and environmental friendliness. ZIF materials have been attested as an ideal host material to encapsulate functional nano CDs.16–18 Especially ZIF-8 is popular for encapsulating nanoparticles because of its simple synthesis conditions and adjustable pore.5–8 It has been reported in the literature, rhodamine B, CdZnS quantum dots and GaN had been encapsulated into ZIF-8 to improve the detection selectivity and sensitivity.19–21 However, they are all based on single-peak detection and are easily affected by external factors. Solid-state aggregation-caused quenching (ACQ) is a troublesome problem in developing potential applications for CDs.
In this work, CDs, Zn(NO3)2·6H2O and H-mim were mixed and stirred to prepare CD@ZIF-L using an effective and simple one-pot synthesis method, as shown in Fig. 1. Further, PEI was modified on the CDs@ZIF-L surface. The CDs@ZIF-L/PEI sensor showed dual-emission peaks at 370 and 440 nm, which could detect Hg2+ as a ratiometric fluorescent sensor. Adding the hydrophilic polymer PEI enhanced the dispersion performance of the ZIF material in water. This approach solved the instability problem of ZIF materials and made the sensor perform better at detecting Hg2+ in water.
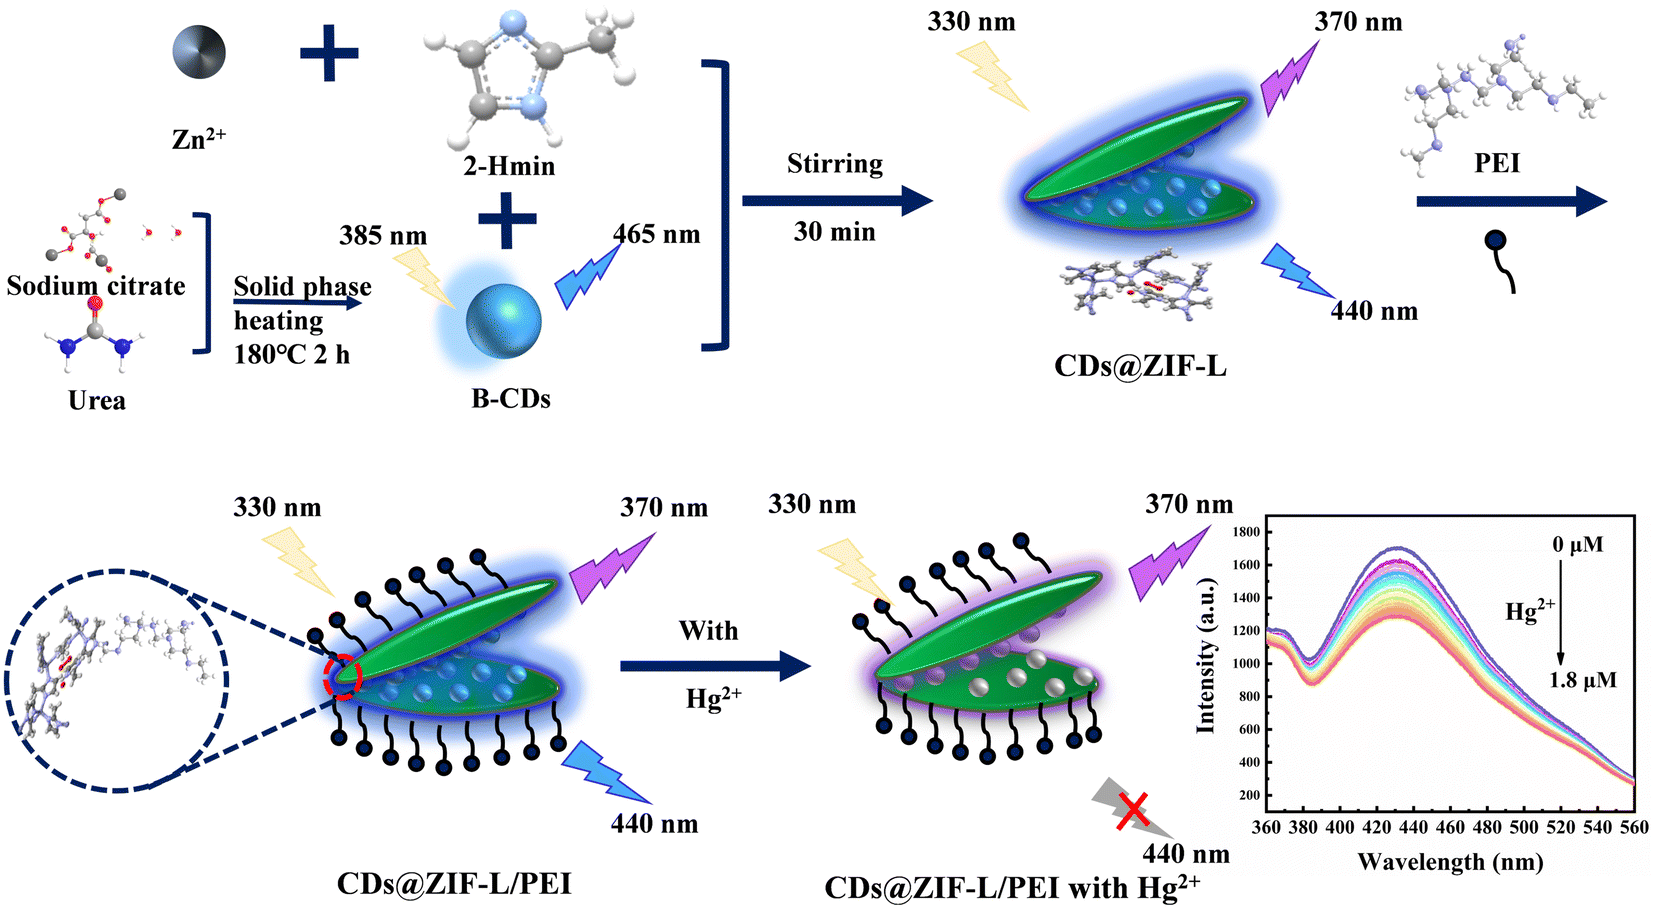 | ||
| Fig. 1 Schematic illustration of the synthetic process of CDs@ZIF-L/PEI and the ratiometric detection of Hg2+. | ||
Experimental
Materials
Urea (CH4N2O, 99.0%) and trisodium citrate dihydrate (Na3C6H5O7·2H2O, 99.0%) were purchased from Aladdin Chemical, Shanghai, China. Zinc nitrate hexahydrate (Zn(NO3)2·6H2O, >99%) was purchased from Shuangchuan Chemical Reagent Factory, Tianjin, China. In addition, 2-methylimidazole (C4H6N2, >99%), MgCl2, NaCl, RbCl, HgCl2, SrCl2, CdCl2, KCl, NiCl2, FeCl3 and CaCl2 were purchased from Aladdin Co., Ltd Shanghai, China. All chemicals of analytical grade reagents were used without further purification. The deionised water used in the test was obtained using the AXLK1820-2 ultra-pure water system (Chongqing, China).Apparatus
Ultraviolet/visible (UV/Vis) absorption and fluorescence spectra were measured on an Agilent T6 spectrophotometer and a Hitachi FL-7100 spectrofluorometer (Tokyo, Japan), respectively. Fourier-transform infrared spectroscopy (FT-IR) spectra were recorded on a PerkinElmer Paragon 1000. The structure and morphology were characterised using ZEISS Sigma 300 scanning electron microscopy (SEM) (Tokyo, Japan). X-ray powder diffraction (XRD) patterns were obtained using an X-ray diffractometer (Rigaku, Kyoto, Japan). X-ray photoelectron spectroscopy (XPS) was conducted on a TMESCALABTM 250Xi X-ray photoelectron spectrometer (Thermo Scientific, Waltham, MA, USA). Photographs were obtained in a dark box quadruple UV analyser (WFH-203C, Shanghai Jingke Industrial Co., Ltd, China). The N2 adsorption experiment was performed by a specific surface and pore size analyser (BeiShiDe Instrument Co., Ltd, China). Roman tests were performed with Raman spectroscopy (HORIBA Scientific LabRAM HR Evolution, Japan).Synthesis of CDs solution
The CDs was synthesised using the solid phase method.22 Typically, 0.06 mol of urea and 0.01 mol of citric acid were thoroughly powdered in an agate mortar for 45 min and then transferred into a crucible. Further the powder was put into a muffle furnace for 2 h at 180 °C. 100 mL of deionised water was added to the carbonised solid and stirred to dissolve sufficiently. Next, it was centrifuged at 9000 rpm for 5 min; the precipitation was discarded, and the supernatant was retained. The supernatant was quadrupled diluted to obtain the CDs solution.Synthesis of CDs@ZIF-L
In a typical synthesis, 3.95 mmol of Zn(NO3)2·6H2O and 27.65 mmol of 2-methylimidazole were dispersed into 100 mL of the CDs solution synthesised in the previous steps. The mixed solution was then vigorously stirred at 25 °C for 0.5 h after ultrasonic dispersion uniformly. The brown solution was vacuum-filtered with a polytetrafluoroethylene (PTFE) membrane with a 0.22 μm pore size. The obtained faint yellow filter cake was put into a vacuum oven and kept at 40 °C for 8 h after being washed three times with deionised water. Finally, the final faint yellow powders were obtained.Synthesis of CDs@ZIF-L/PEI
The synthesis method of CDs@ZIF-L/PEI was almost the same as CDs@ZIF-L. The only difference was that 20 mL of PEI was added to the mixed solution after being vigorously stirred for 0.5 h, and the stirring continued for 10 min. With the completion of separation and drying operations, the final faint yellow powders were obtained.Determination of Hg2+
A stock solution of Hg2+ in deionised water was initially prepared. A Hg2+ concentration of 0.2 mM was prepared by pipetting aliquots of the stock solution of Hg2+ (0.0–100.0 μL) into the CDs@ZIF-L/PEI (1.0 mg mL−1) solution, diluted to 2.0 mL with phosphate buffer solution (PBS) (pH = 7.0, 10 mM) and then transferred to a quartz cell for detection. After 3 min, fluorescence spectra were recorded at an excitation wavelength of 330 nm; the scan rate was 2400 nm min−1; the photomultiplier tube voltage was 500 volts; the slit widths of excitation and emission were set at 10 nm. All experiments were performed in triplicate under the same experimental conditions. The effect of pH on the FL properties of CDs@ZIF-L/PEI was investigated, phosphate buffer solution (PBS) (pH = 7.0, 10 mM) was added to CDs@ZIF-L/PEI to minimize the impact of pH fluctuations. Selectivity studies were conducted under the same experimental conditions using other metal ions, including Mg2+, Na+, Rb+, Hg2+, Sr2+, Cd2+, K+, Ni2+ and Ca2+. During the experiment, 5 μL of other metal ions (0.1 M) were added to the 2 mL CDs@ZIF-L/PEI (1.0 mg mL−1) solution. As a comparison, the anti-interference ability of CDs@ZIF-L/PEI was further investigated by mixing 10 μL Hg2+ with the aforementioned various interfering ions.Results and discussion
Characterisation
The morphological structure of CDs@ZIF-L/PEI was observed using SEM and transmission electron microscopy (TEM). The SEM images shown in Fig. 2a and b indicate single leaf-like structures with a relatively uniform size and length of about 3 μm, demonstrating that the ZIF-L was successfully prepared. Moreover, the addition of CDs and PEI did not change the crystal shape of the ZIF-L. In addition, in the HRTEM image shown in Fig. 2c, uniform CDs are clearly seen. Moreover, the elemental mapping images shown in Fig. 2d–g and the energy-dispersive X-ray spectroscopy (EDS) results shown in Fig. 2h demonstrated that the CDs@ZIF-L/PEI comprised four elements: C, N, O and Zn, indicating that the corresponding elements were uniformly distributed in the composites. The above results indicate that CDs is successfully doped into the ZIF-L using the encapsulation strategy.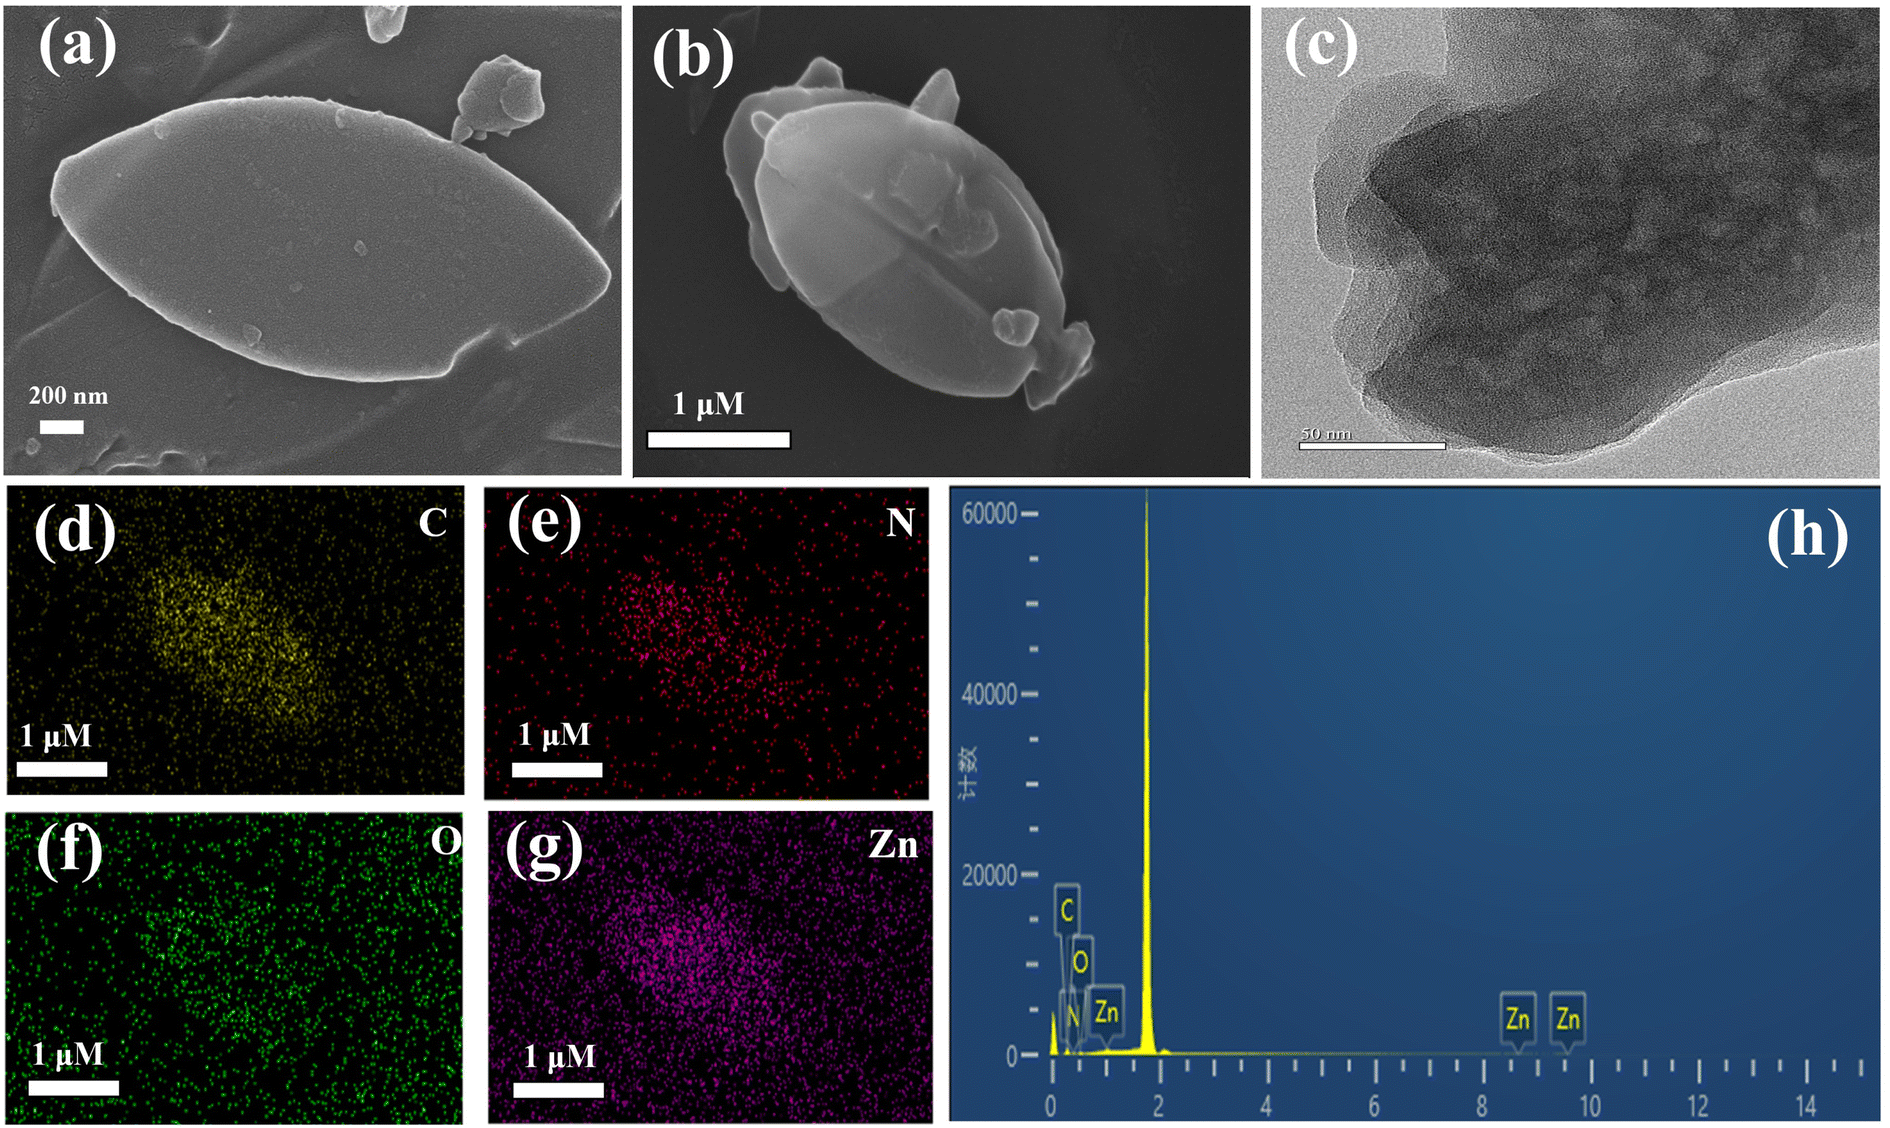 | ||
| Fig. 2 (a and b) SEM images of CDs@ZIF-L/PEI; (c) TEM images of CDs@ZIF-L/PEI; (d–g) elemental mapping; (h) EDS of CDs@ZIF-L/PEI. | ||
Fig. 3a is the characterization of the XRD pattern of H-mim, ZIF-L, CDs@ZIF-L and CDs@ZIF-L/PEI respectively. All peaks in the XRD pattern of powder samples were sharp and consistent with the simulative patterns (CCDC: 1509273) and ZIF-L patterns in previous literature,23 confirming that the ZIF-L host was effectively synthesized. And the dimethylimidazole diffraction peaks further proved that ZIF-L was synthesized successfully. By comparison with the simulative patterns for ZIF-L, it was found that the as-synthesized samples had a relatively weak peak at 2θ = 7.34° of the (011) plane and no significant changes and typical diffraction peaks of PEI species in the XRD pattern of CDs@ZIF-L and CDs@ZIF-L/PEI were observed due to the low amount of PEI in the hybrid, indicating that doping of CDs does not affect the crystal structure of ZIF-L. After doping by CDs, compared with pure ZIF-L, we found an apparent increase of the peak at 2θ = 7.76° illustrates the preferential growth through this lattice plane, which should be result in the change of the particles shape. Thus, speculate addition of CDs could affect the diffraction peaks and the structure of ZIF-L.
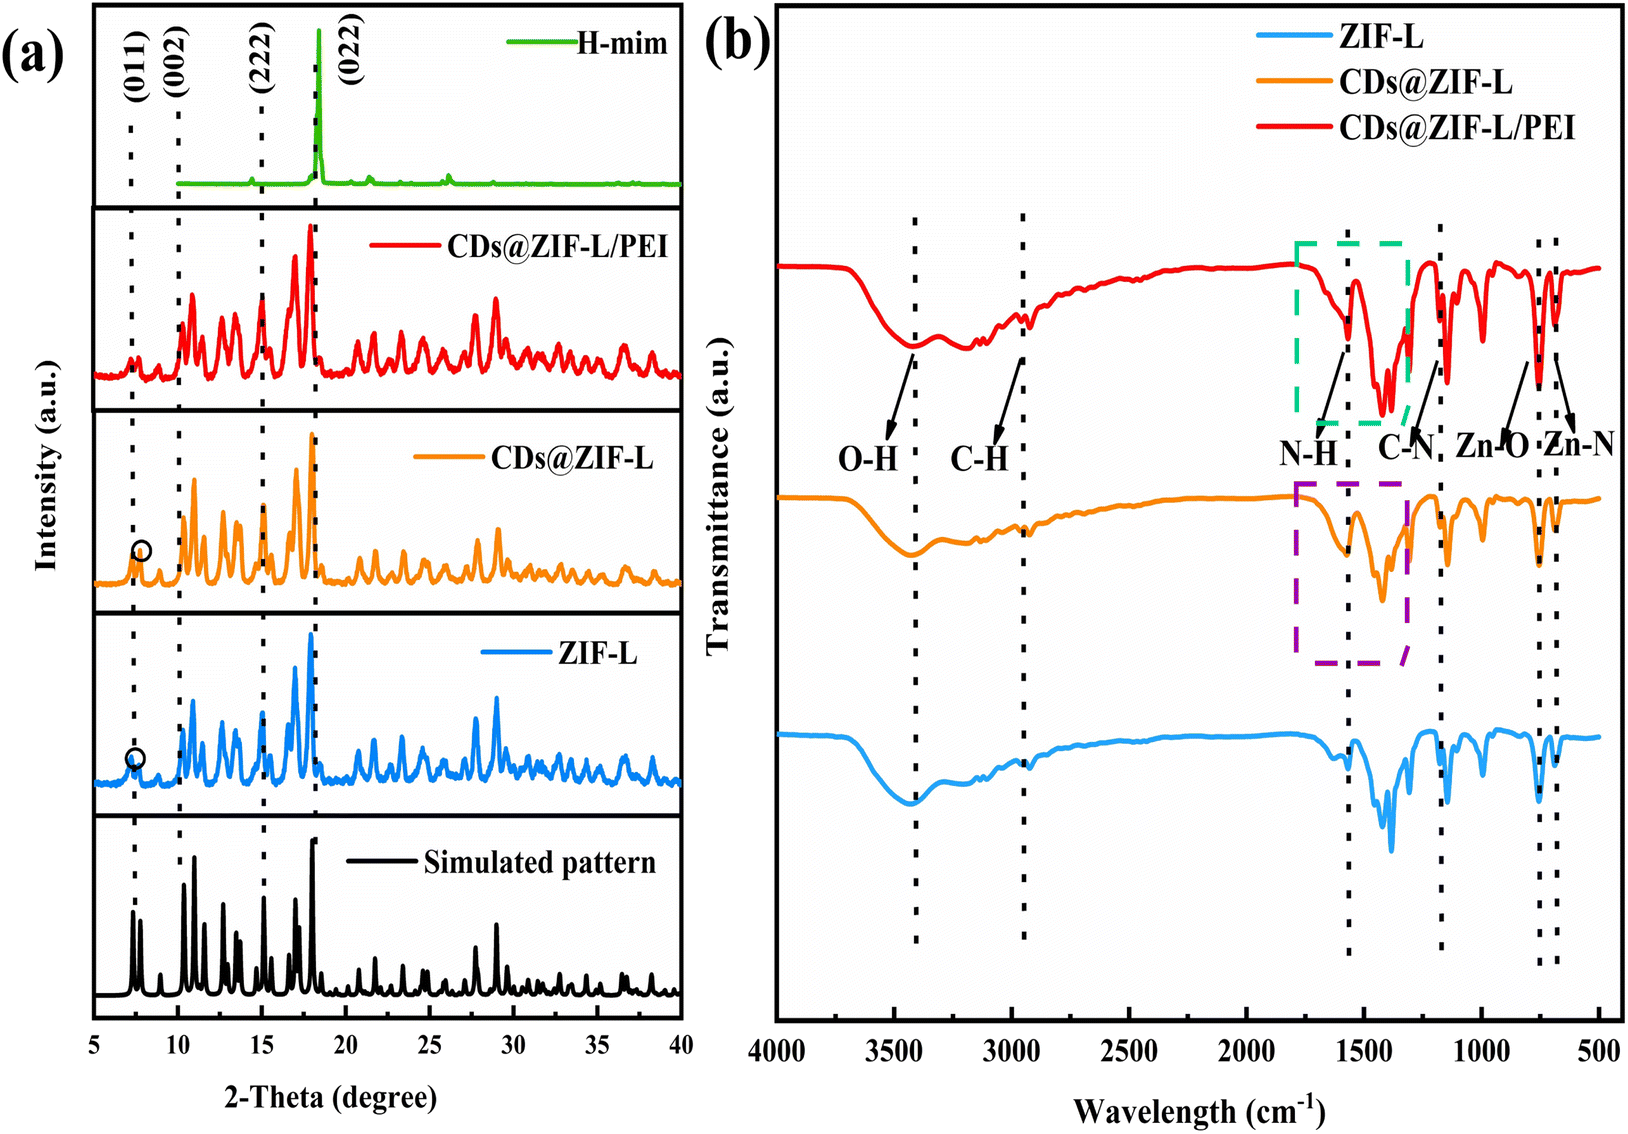 | ||
| Fig. 3 (a) XRD and (b) FT-IR of ZIF-L, CDs@ZIF-L and CDs@ZIF-L/PEI and H-mim. | ||
The FT-IR spectra of ZIF-L, CDs@ZIF-L and CDs@ZIF-L/PEI are shown in Fig. 3b, indicating that the characteristic adsorption peaks of the synthesised CDs@ZIF-L and CDs@ZIF-L/PEI were similar to those of the ZIF-L. The absorption peaks at 3420 cm−1 are attributed to O–H bonds;23 the peaks at 2930 cm−1 represents C–H bonds in the methyl and imidazole rings24 and the peaks at 692 and 754 cm−1 represent Zn–N and Zn–O,25 respectively. Moreover, the absorption peaks at 1148 cm−1 are attributed to the stretching vibration peaks of C–N bonds in imidazole rings, while those at 1566 cm−1 are attributed to C![[double bond, length as m-dash]](https://www.rsc.org/images/entities/char_e001.gif) N.25 In CDs@ZIF-L, framed in purple, the peaks at 1393 and 1580 cm−1 occur due to C–N and CO/CC from CDs,26 indicating that CDs are introduced into the ZIF-L cavity. In CDs@ZIF-L/PEI, the peaks of C–N and CN were stronger owing to the presence of amino groups on the PEI surface. The –NH bond at 1600 cm−1, close to the absorption peak of CN. After PEI doping, the characteristic absorption peak at 692 cm−1 became more obvious, might due to the N–H of PEI could coordinate with Zn2+ to form –N–Zn. The characteristic absorption peaks of CDs@ZIF-L/PEI, framed in green, were sharper and stronger. In previous studies,27 those absorption peaks approaching 1458 and 1585 cm−1 were also associated with the N–H vibration of primary and secondary amino groups, respectively. Meanwhile, these groups could interact with the hydroxyl and carbonyl groups of CDs. The formation of hydrogen bonds could facilitate interfacial compatibility, which indicates excellent stability in water of CDs@ZIF-L/PEI. These analyses confirmed that PEI was successfully linked on the CDs@ZIF-L surface.
N.25 In CDs@ZIF-L, framed in purple, the peaks at 1393 and 1580 cm−1 occur due to C–N and CO/CC from CDs,26 indicating that CDs are introduced into the ZIF-L cavity. In CDs@ZIF-L/PEI, the peaks of C–N and CN were stronger owing to the presence of amino groups on the PEI surface. The –NH bond at 1600 cm−1, close to the absorption peak of CN. After PEI doping, the characteristic absorption peak at 692 cm−1 became more obvious, might due to the N–H of PEI could coordinate with Zn2+ to form –N–Zn. The characteristic absorption peaks of CDs@ZIF-L/PEI, framed in green, were sharper and stronger. In previous studies,27 those absorption peaks approaching 1458 and 1585 cm−1 were also associated with the N–H vibration of primary and secondary amino groups, respectively. Meanwhile, these groups could interact with the hydroxyl and carbonyl groups of CDs. The formation of hydrogen bonds could facilitate interfacial compatibility, which indicates excellent stability in water of CDs@ZIF-L/PEI. These analyses confirmed that PEI was successfully linked on the CDs@ZIF-L surface.
The surface composition and elemental states of powder materials were identified using XPS analysis. Fig. 4a displays the full-scale XPS spectra of CDs@ZIF-L/PEI and CDs@ZIF-L, indicating the same representative peaks at specific positions for Zn 2p, O 1s, N 1s and C 1s. Fig. 4b displays the XPS spectra of Zn 2p, with Zn 2p3/2 and Zn 2p1/2 distinct peaks appearing at 1021 and 1045 eV, respectively. The PEI addition did not affect the binding energy of Zn 2p. For CDs@ZIF-L, as shown in Fig. 4c, the spectrum of C 1s could be deconvoluted into three peaks at 284.8, 286.3 and 287.5 eV, corresponding to C–C/CC,27 CO28 and O–CO/N–CO,29 respectively. After modification by PEI, peaks of O–CO/N–CO shifted to high binding energies at 288.5 eV,28 indicating that O–CO/C–NO3 groups participated in the surface modification. The N 1s spectrum of CDs@ZIF-L could be split into two peaks, as shown in Fig. 4d, with the centre of binding energies at 399.1 and 400.9 eV, while the binding energies for CDs@ZIF-L/PEI shifted to 398.6 and 400 eV, which are assigned to nitrogen atoms of amine groups in PEI, CN,27 and C(O)NH. As shown in Fig. 4e, after modification by PEI, a new peak appeared at 534.1 eV, which could be attributed to the C–O bond of PEI.30 Further proves that PEI was efficient linked on the surface of CDs@ZIF-L.
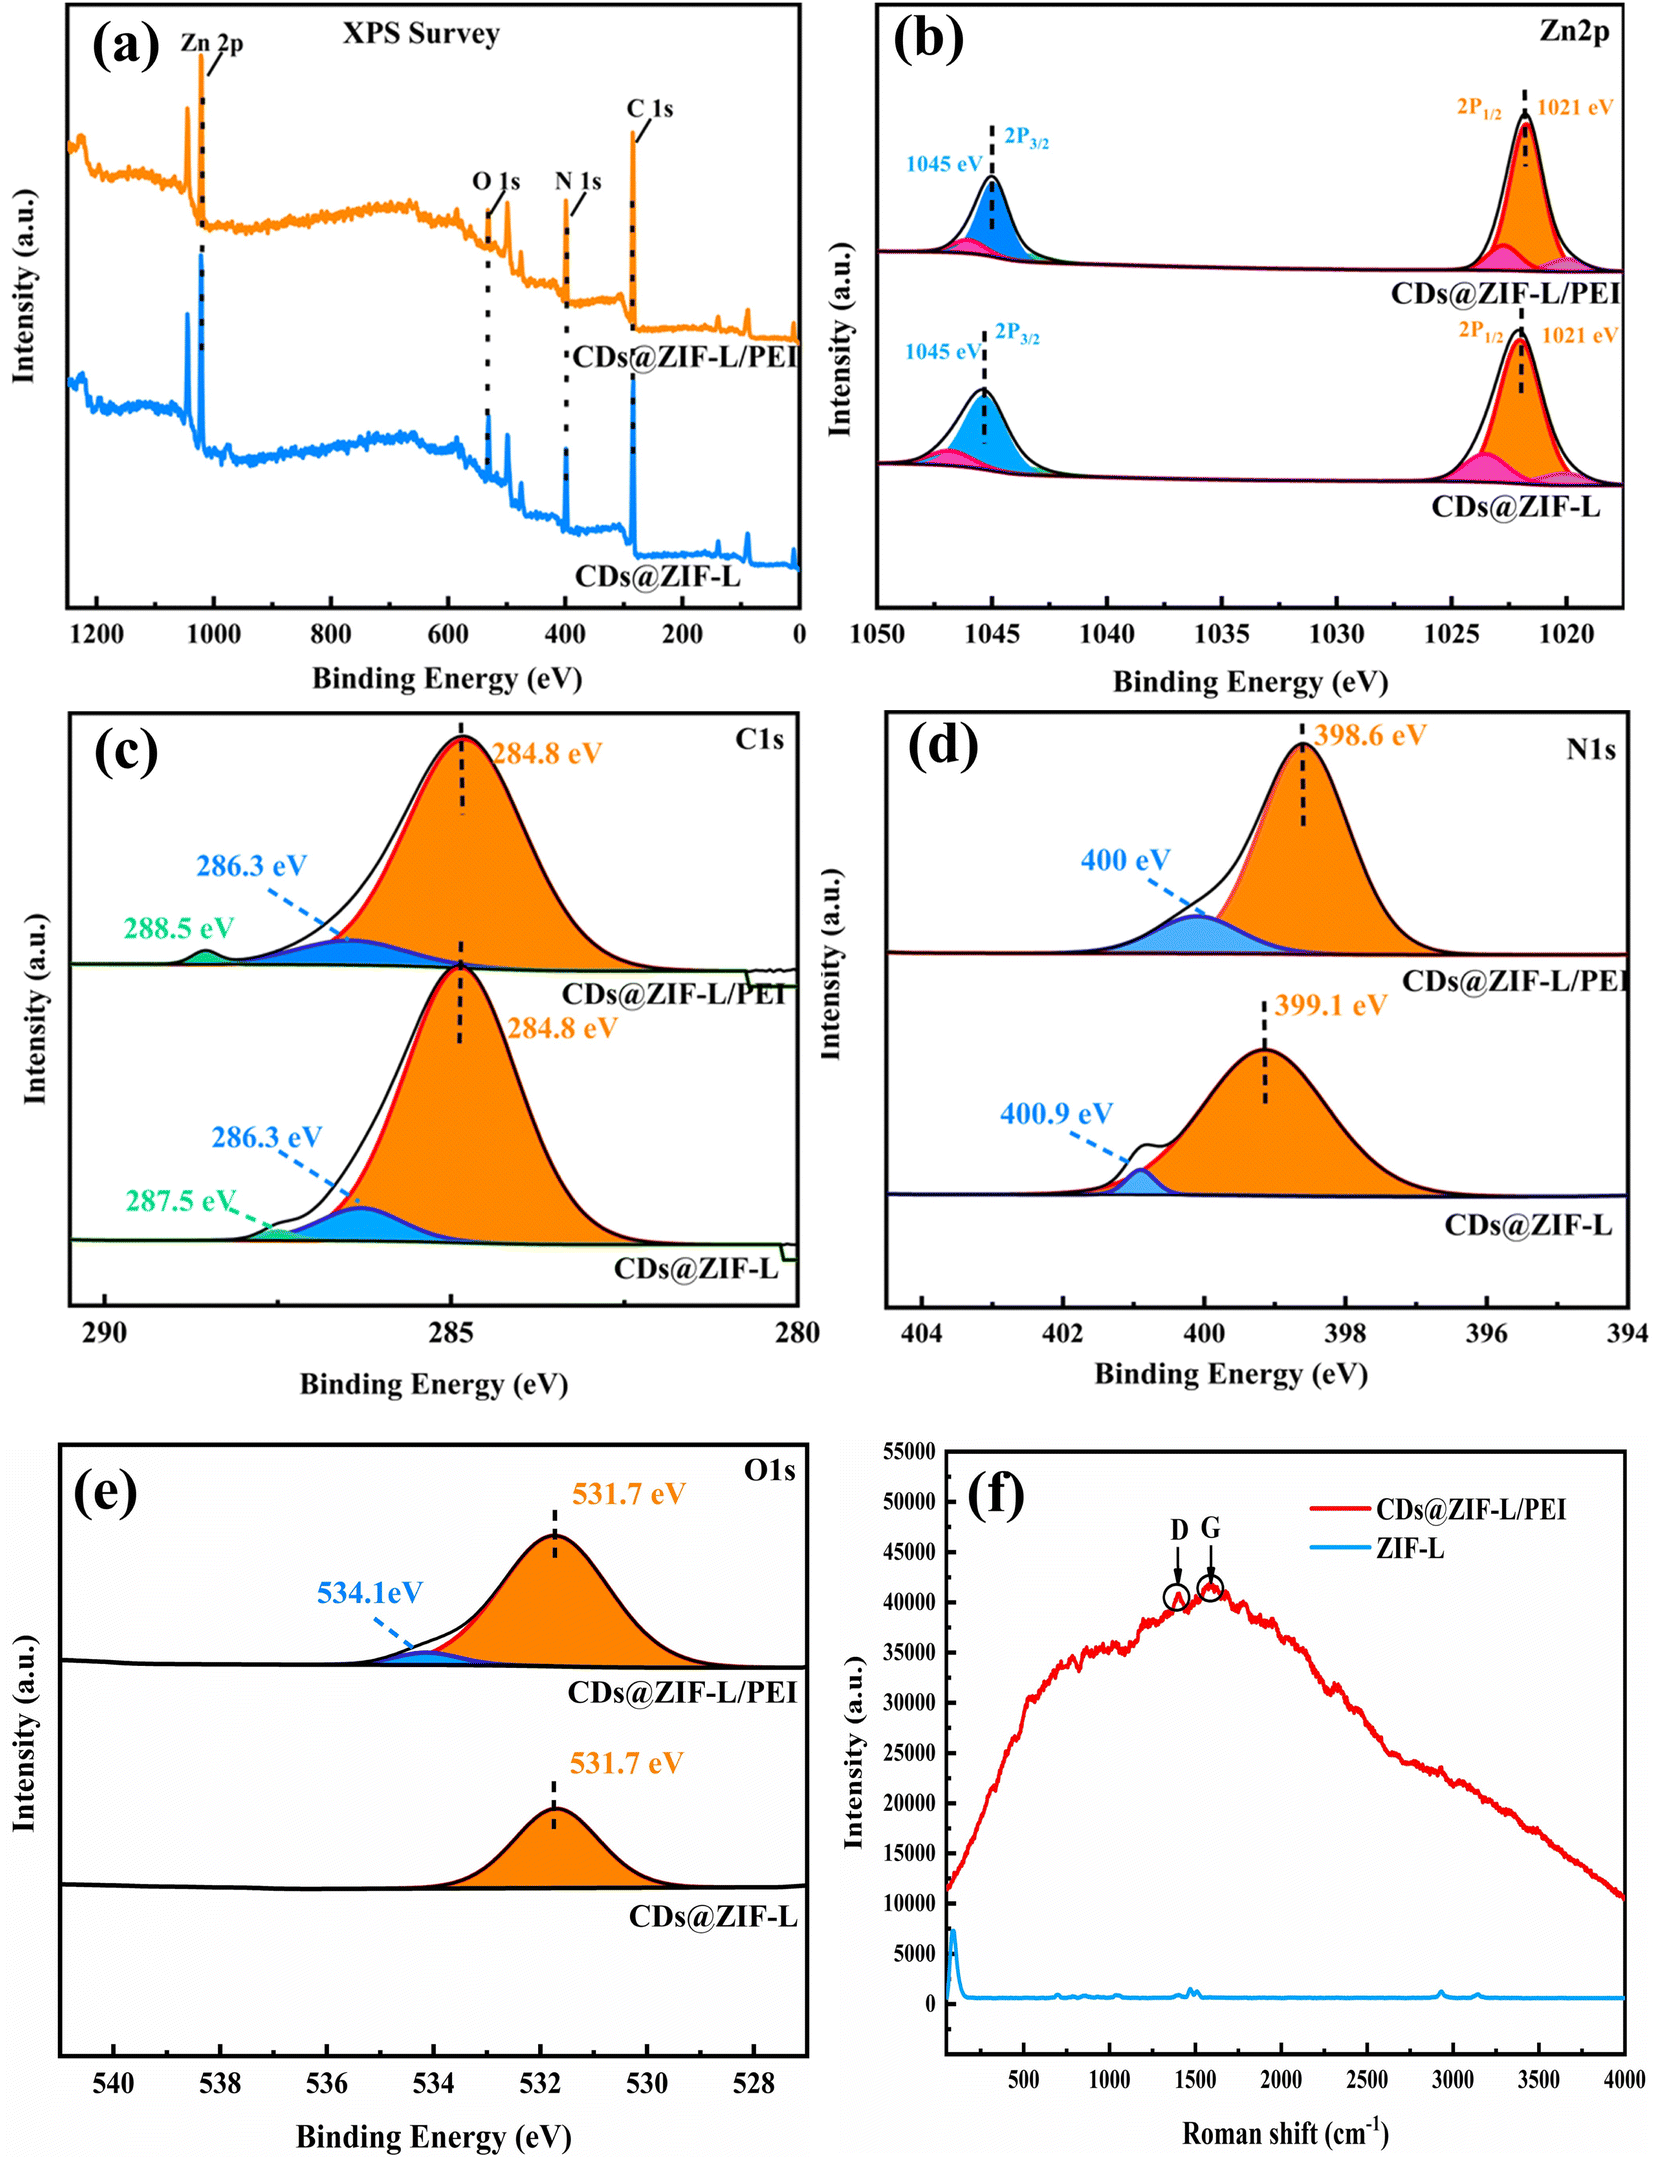 | ||
| Fig. 4 XPS spectrum of CDs@ZIF-L/PEI and CDs@ZIF-L: (a) full XPS spectra, (b) Zn 2p, (c) C 1s, (d) N 1s and (e) O 1s. (f) Roman spectrum of CDs@ZIF-L/PEI and ZIF-L. | ||
The Roman spectrum in Fig. 4f, the relative intensity of the D-band (amorphous) at 1375 cm−1 and G-band (crystalline) at 1580 cm−1. Which also proves that the presence of CDs in CDs@ZIF-L/PEI.31
Fig. 5a–c presents the N2 adsorption–desorption isotherms on the pure ZIF-L and composite materials at 77 K. It can be seen that the isotherm of the ZIF-L was higher than those of CDs@ZIF-L and CDs@ZIF-L/PEI. The specific surface area of CDs@ZIF-L was 37.551 m2 g−1, which decreased slightly compared with the pure ZIF-L. Fig. 5d shows the pore width and pore volume distribution of three materials. It was obvious that doping CDs increased the pore size and volume of the ZIF-L; the average pore width of ZIF-L was 11.611 nm, while the average pore width of CDs@ZIF-L was 17.117 nm. It is revealed that CDs are successfully encapsulated in the ZIF-L channel. This phenomenon may be due to the combination of unsaturated sites on the secondary structural units of the CDs and ZIF-L during the encapsulation, making the crystals slightly larger.32 For CDs@ZIFL/PEI, the BET surface area, average pore volume and average pore size decreased owing to the impregnation of PEI in ZIFs,33 which were 14.594 m2 g−1, 10.868 nm, and 0.036 mL g−1, respectively. The PEI was successfully linked on the CDs@ZIF-L. Identically, zeta-potential testing can verify the CDs doping process of the ZIF-L channel and the modification role of PEI in the ZIF-L surface. As shown in Fig. 5e, the surface of the ZIF-L was positively charged; according to the literature,32 the average zeta potentials of CDs are usually negative. Thus, the zeta potential of CDs@ZIF-L changed to −55 mV, implying that the electrostatic interaction led to the formation of CDs@ZIF-L.32 After PEI was linked on its surface, the potential was positively charged again. This can be attributed to the extensive protonation of amine in PEI molecules.
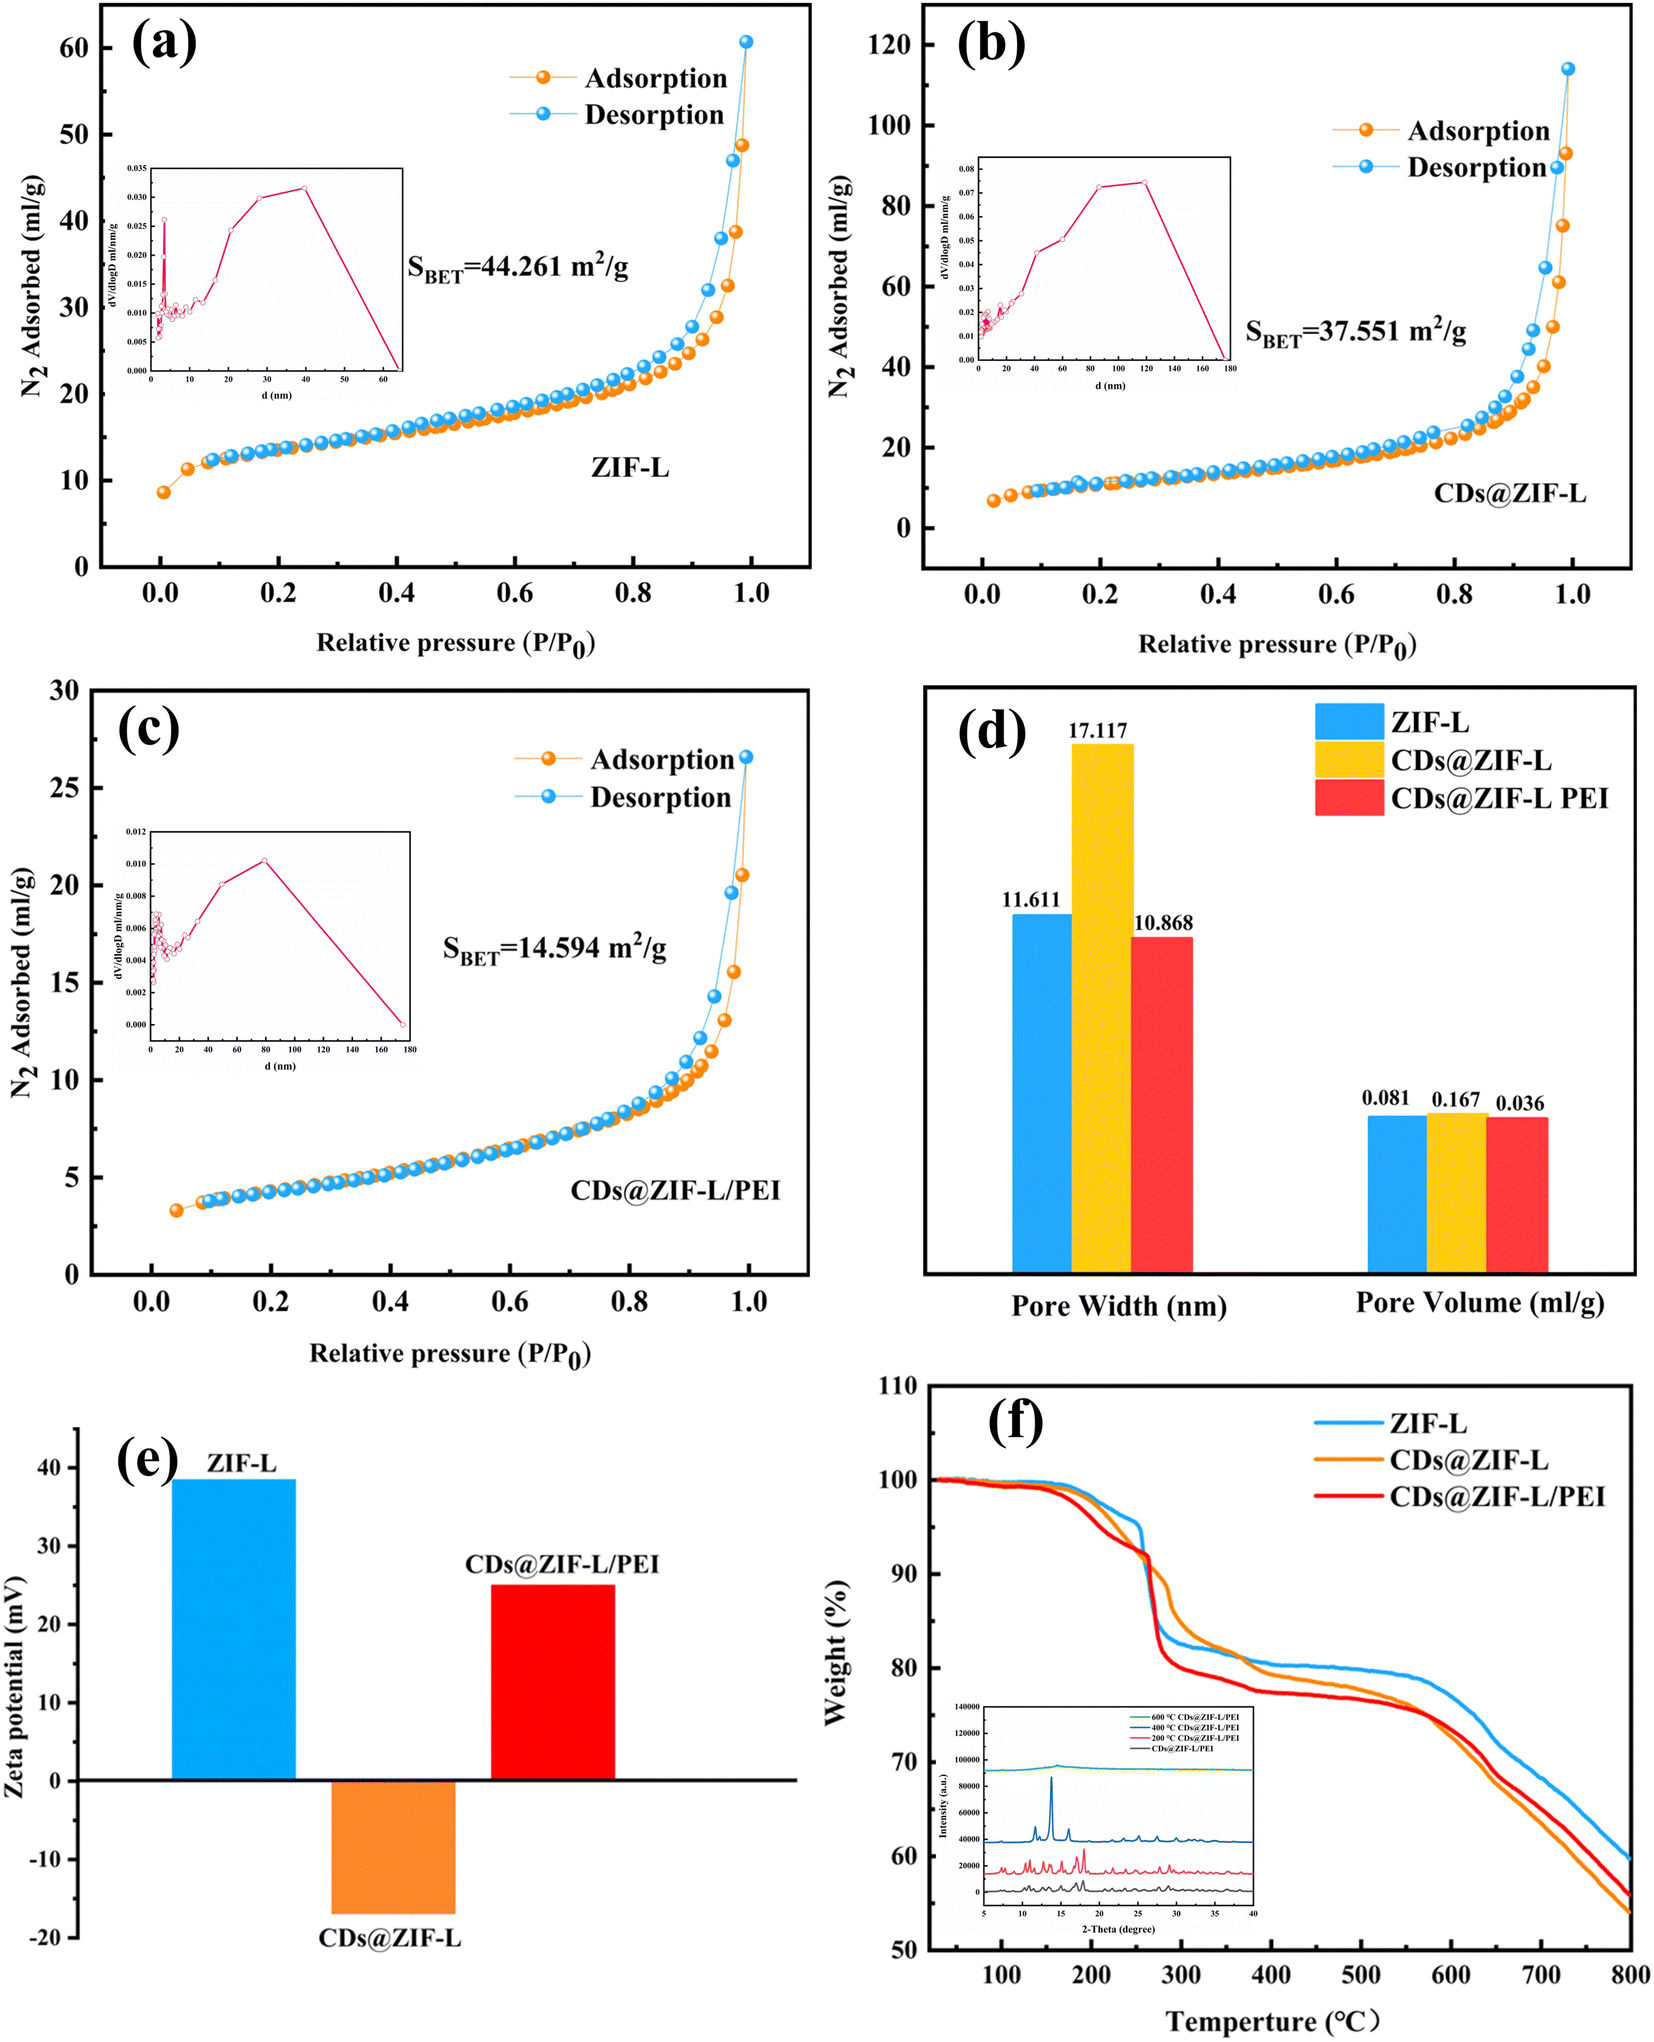 | ||
| Fig. 5 N2-adsorption/desorption isotherms of (a) ZIF-L, (b) CDs@ZIF-L and (c) CDs@ZIF-L/PEI materials at 77 (inset: the pore size distribution image); (d) pore size distribution; (e) zeta potentials; (f) TGA curves of the samples and the inset show the XRD of CDs@ZIF-L/PEI treatment at 200 °C, 400 °C and 600 °C. | ||
Thermogravimetric analysis (TGA) measurements for the ZIF-L, CDs@ZIF-L and CDs@ZIF-L/PEI were performed in the temperature range from 25 °C to 800 °C in the N2 atmosphere. As shown in Fig. 5f, there was a slight loss at 150 –250 °C, indicating the removal of residual H2O molecules and the high water content (PEI, MW = 10![[thin space (1/6-em)]](https://www.rsc.org/images/entities/char_2009.gif) 000, 50% H2O) of three powder samples. For ZIF-L and CDs@ZIF-L, the second stage began at 250 –370 °C, which can be attributed to the removal of residual solvent and the decomposition of the amide groups in CDs. In the case of CDs@ZIF-L and CDs@ZIF-L/PEI, the next weight loss stage was observed up to 560 °C, ascribed to the thermal decomposition of PEI polymer chains.34 The mass loss phase end at 600 °C can be attributed to the collapse of the framework. The specific surface area and aperture of samples can also affirm whether CDs and PEI are successfully encapsulated in the channel of ZIF-L. In addition, a heat stability test was performed as shown in the appended figure of Fig. 5f. After the treatment of CDs@ZIF-L/PEI at 200 °C, 400 °C and 600 °C, the XRD test was performed. According to the XRD results, CDs@ZIF-L/PEI treated at 200 °C exhibited characteristic peaks of ZIF-L. However, at 400 °C, the characteristic peaks of ZIF-L decreased observably. At 600 °C, ZIF-L characteristic peaks disappear completely. Thus it could be concluded that ZIF-L could exhibited good heat stability under 200 °C.
000, 50% H2O) of three powder samples. For ZIF-L and CDs@ZIF-L, the second stage began at 250 –370 °C, which can be attributed to the removal of residual solvent and the decomposition of the amide groups in CDs. In the case of CDs@ZIF-L and CDs@ZIF-L/PEI, the next weight loss stage was observed up to 560 °C, ascribed to the thermal decomposition of PEI polymer chains.34 The mass loss phase end at 600 °C can be attributed to the collapse of the framework. The specific surface area and aperture of samples can also affirm whether CDs and PEI are successfully encapsulated in the channel of ZIF-L. In addition, a heat stability test was performed as shown in the appended figure of Fig. 5f. After the treatment of CDs@ZIF-L/PEI at 200 °C, 400 °C and 600 °C, the XRD test was performed. According to the XRD results, CDs@ZIF-L/PEI treated at 200 °C exhibited characteristic peaks of ZIF-L. However, at 400 °C, the characteristic peaks of ZIF-L decreased observably. At 600 °C, ZIF-L characteristic peaks disappear completely. Thus it could be concluded that ZIF-L could exhibited good heat stability under 200 °C.
Luminescence properties
The powder and dispersion samples were photographed under natural and ultraviolet lamps in a dark box type of quadruple UV analyser. As displayed in the digital photos, the colour of the ZIF-L powder was white and the colours of CDs@ZIF-L and CDs@ZIF-L/PEI powders were slightly yellow in natural light, as shown in Fig. S1a–c.† The fluorescent colour of the ZIF-L was purple and the CDs@ZIF-L was blue, while the CDs@ZIF-L/PEI powders were brighter blue under ultraviolet light (365 nm), as shown in Fig. S1d–f.† Moreover, the powder samples were distributed in the deionised water. As shown in Fig. S2,† the colour of the dispersion samples was milk white in natural light. The fluorescent colour of the ZIF-L was light purple. CDs@ZIF-L and CDs@ZIF-L/PEI were blue under ultraviolet light (365 nm). It is confirmed that CDs@ZIF-L/PEI dispersion had excellent fluorescence properties and water solubility, which could be further studied as a fluorescent sensor.The as-synthesised composites were homogeneously dispersed in an aqueous solution and the optical properties of CDs@ZIF-L/PEI were investigated to investigate the fluorescence properties of CDs@ZIF-L/PEI in detail. As shown in Fig. 6a, the emission spectra at 380 nm of the ZIF-L were measured at a 290 nm excitation wavelength (EX), and the fluorescence emission peak (EM) of CDs was about 450 nm at a 360 nm excitation wavelength. Notably, the ZIF-L and CDs could emit corresponding peaks when EX = 330 nm owing to the excitation wavelength dependence. Hence, the dual-emitter material could be obtained by the reorganisation of the ZIF-L and CDs. Moreover, to find the optimal excitation wavelength of the composite, the emission spectra were explored at 310, 330 and 350 nm excitation wavelengths, as shown in Fig. 6b, indicating that two relatively complete peaks of the ZIF-L (EM = 370 nm) and CDs (EM = 440 nm) appeared simultaneously at EX = 330 nm. Therefore, 330 nm was selected as the optimal excitation wavelength of the composite for subsequent experiments.
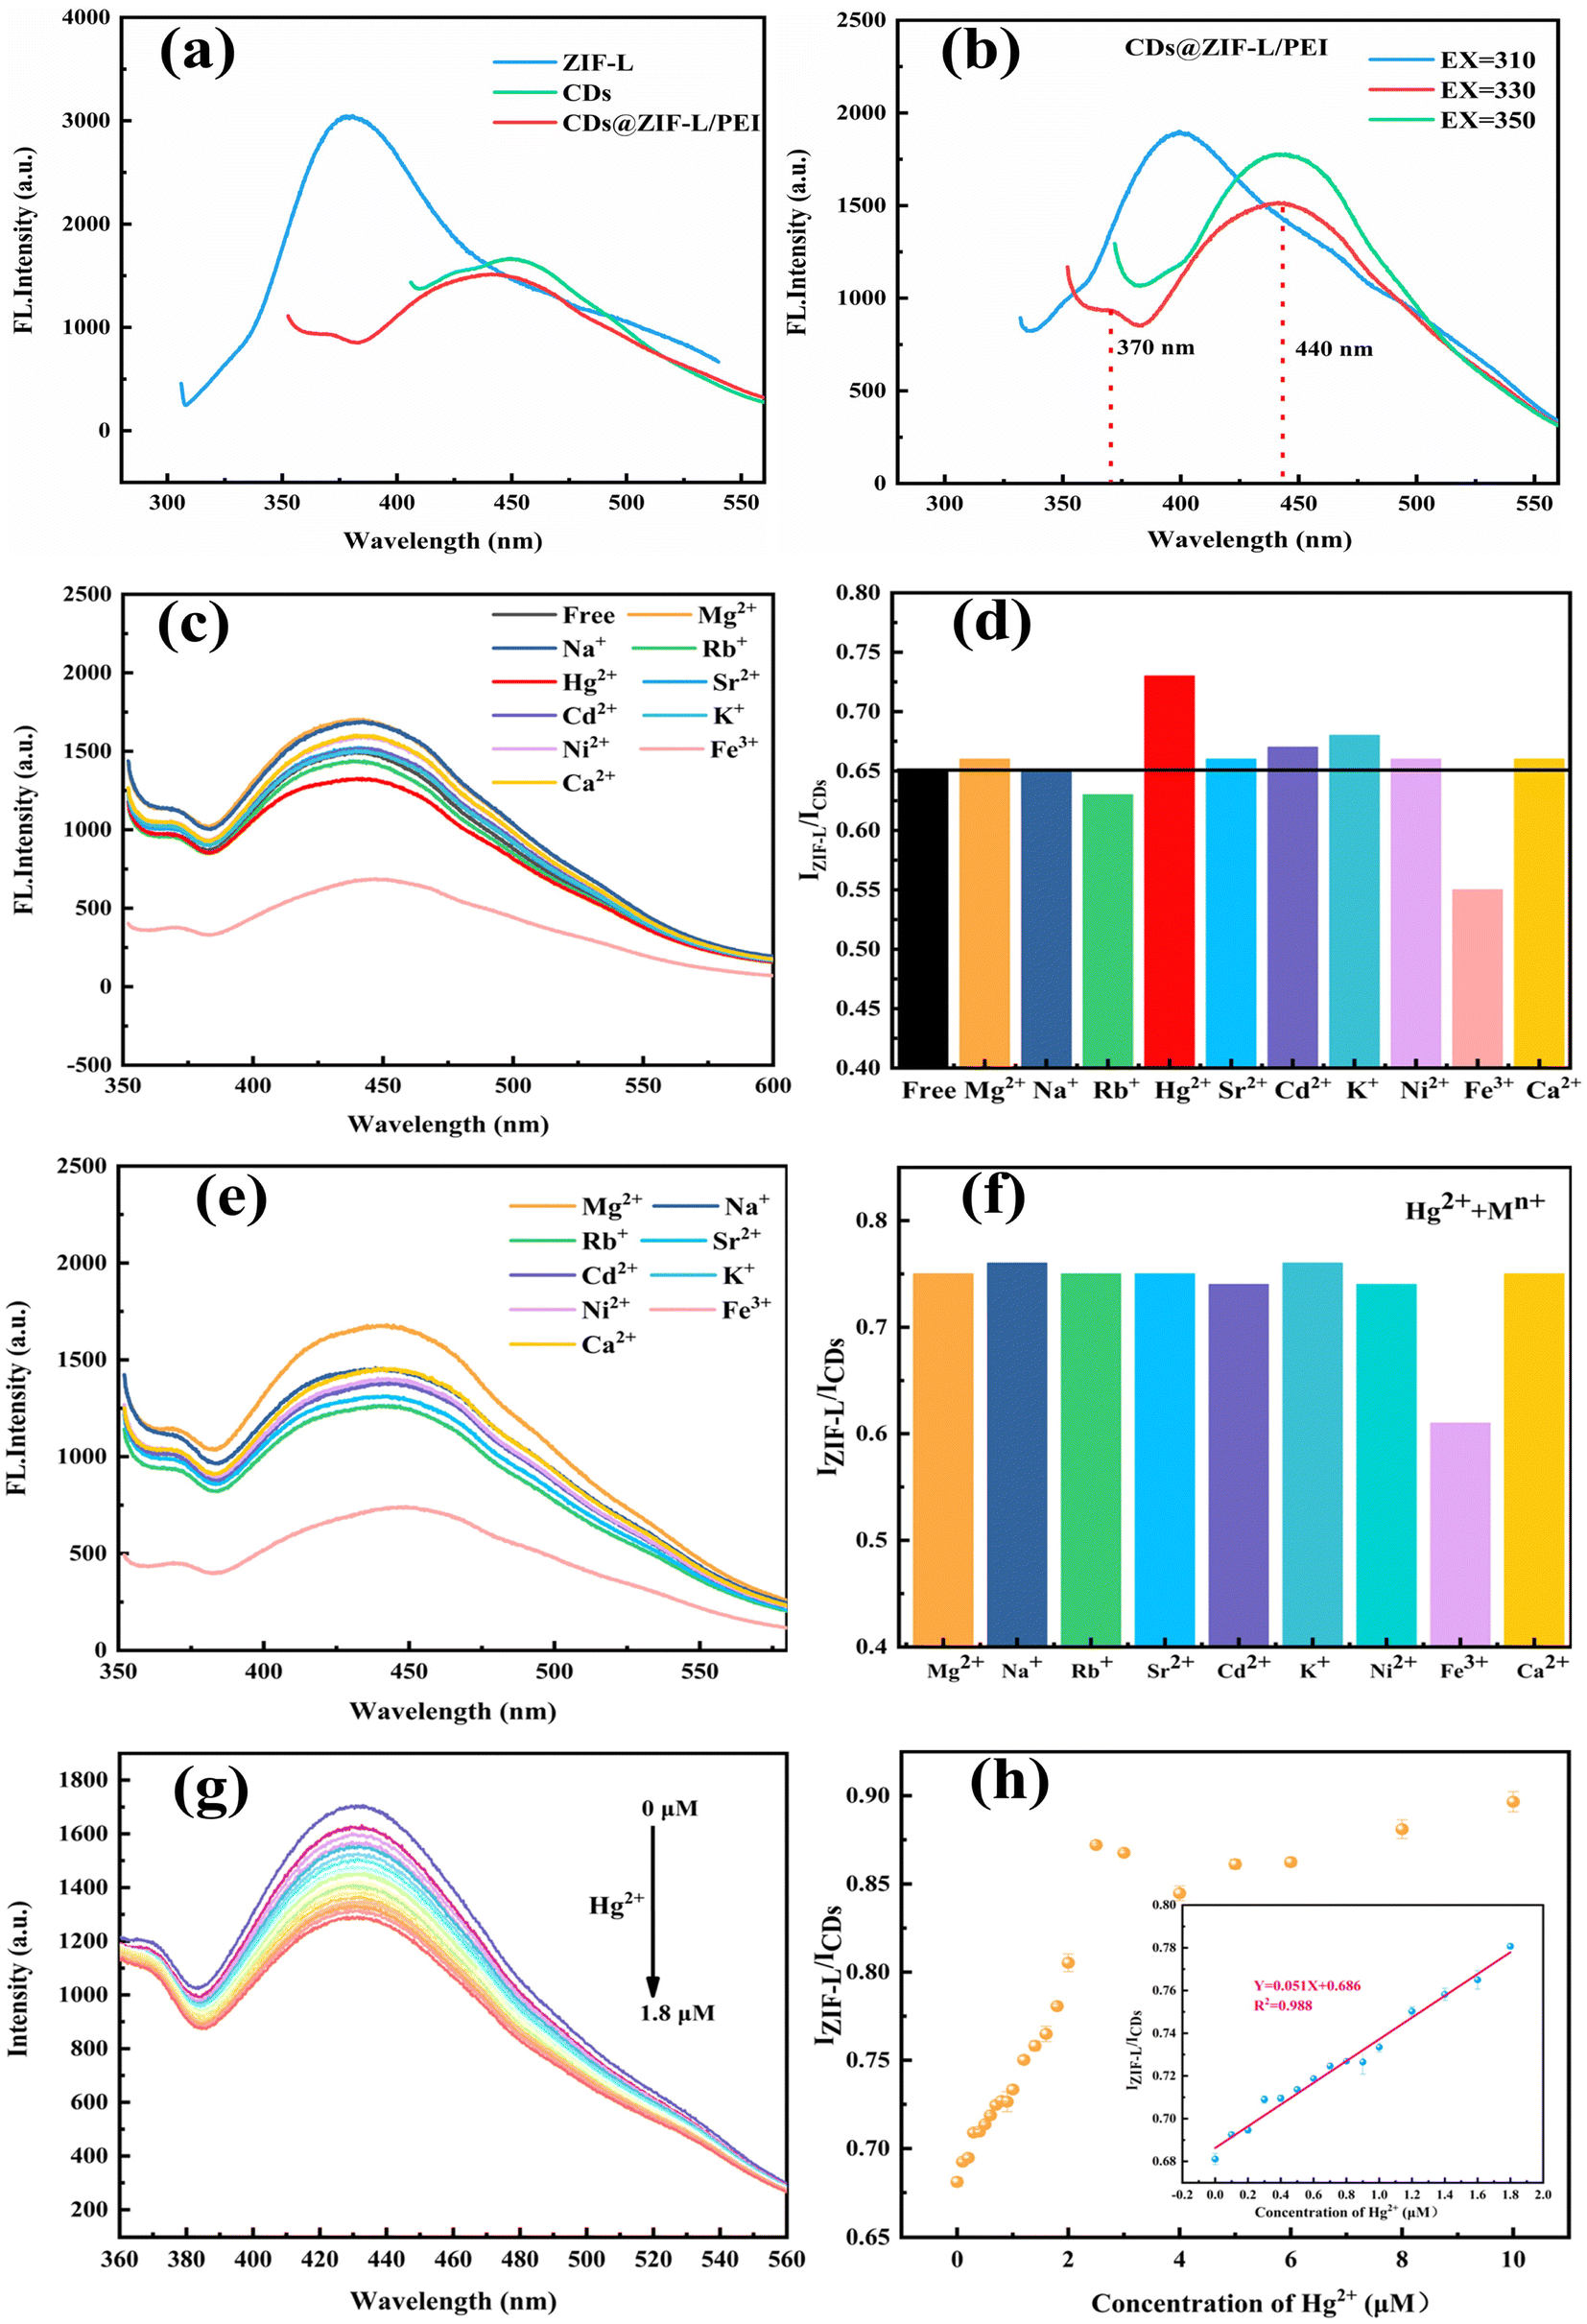 | ||
| Fig. 6 (a) The fluorescence emission spectra of ZIF-L, CDs and CDs@ZIF-L/PEI at the excitation wavelengths of 290, 360 and 330 nm; (b) the fluorescence emission spectrum of CDs@ZIF-L/PEI under 310, 330 and 350 nm excitation wavelengths; (c and d) the fluorescence intensity ratio of CDs@ZIF-L/PEI in different metal cations solution; (e and f) the anti-interference study of CDs@ZIF-L/PEI based Hg2+ sensors on other metal cations; (g) relationship between the FL intensity ratio of the CDs@ZIF-L/PEI at different concentrations of Hg2+ (0–1.8 μM) and (h) the linear equation for the FL quenching ratio in various concentrations of Hg2+. | ||
Selectivity investigation
To evaluate the selective response of CDs@ZIF-L/PEI as a dual-emission sensor, the fluorescence response of CDs@ZIF-L/PEI has been investigated for different metal cation solutions, including Mg2+, Na+, Rb+, Hg2+, Sr2+, Cd2+, K+, Ni2+, Fe3+ and Ca2+, as shown in Fig. 6c and d. It could be found that Hg2+ was the only metal ion that caused a positive change in IZIF-L/ICDs of CDs@ZIF-L/PEI. Additionally, no evident fluorescent responses could be found in the presence of the other ions except for Fe3+. To validate the detection accuracy of CDs@ZIF-L/PEI for Hg2+, the anti-interference ability was further investigated by mixing Hg2+ with various metal ion solutions. As depicted in Fig. 6e and f, whatever metal ion was mixed up with the Hg2+ solution, the IZIF-L/ICDs of CDs@ZIF-L/PEI remained equable and nearly constant, except for Fe3+. The reason for the negative change of IZIF-L/ICDs on Fe3+ is that the CDs and ZIF-L exhibit quenching properties on Fe3+. In addition, the H2O2 solution could reduce Fe3+ to Fe2+. This confirms that CDs@ZIF-L/PEI exhibited a high selectivity as a ratiometric fluorescent sensor for luminescent Hg2+ sensing.Sensitivity evaluation
The feasibility of the detection process was explored under optimal experimental conditions. As displayed in Fig. 6g and h, the CDs fluorescence intensity of CDs@ZIF-L/PEI gradually decreased at 440 nm after adding Hg2+. In contrast, the fluorescence intensity of the ZIF-L at 370 nm changed a little. Thus, Hg2+ in the range of 0.1–1.8 μM could be quantified by CDs@ZIF-L/PEI, indicating a good linear relationship with concentration (R2 = 0.988). In addition, the detection limit for Hg2+ was calculated to be 14.5 nM, which could be calculated using the equation LOD = 3σ/k (where, σ is the standard error for 11 replicate determinations of the blank CDs@ZIF-L/PEI solution and k is the slope of the calibration curve).35 Comparing the CDs@ZIF-L/PEI with other composite material sensors of Hg2+ (Table 1), the CDs@ZIF-L/PEI exhibited a low detection limit. The detection limit of pure CDs was experimentally studied, and Fig. S3a and b† show that the detection limit was 0.22 μM. Therefore, the detection limit of the CDs@ZIF-L/PEI dual-emitting sensor was lower (14.5 nM) in Fig. S3c and d,† indicating the superiority of the dual emitting-fluorescent sensor.| No. | Sensor | Detection limit | Ref. |
|---|---|---|---|
| 1 | 4-((3-(Octadecylthio)-1,4-dioxo-1,4-dihydronaphthalen-2-yl) amino)benzenesulfonamide (4DBS) | 0.451 μM | 36 |
| 2 | Nitrogen doped carbon dots (NCDs) | 0.15 μM | 37 |
| 3 | Novel rhodamine-based fluorescence cellulose nanocrystals (RhB-CNCs) | 237 nM | 38 |
| 4 | Dual-emissive carbon dots (BYCDs) | 0.27 μM | 39 |
| 5 | Zirconium-based MOF [PCN-221] | 0.12 μM | 40 |
| 6 | 7-Nitrobenzo-2-oxa-1,3-diazolyl (NBDP) | 19.2 nM | 41 |
| 7 | CDs@ZIF-L/PEI | 14.5 nM | This work |
Fluorescence stability
Fig. 7a shows the fluorescence intensity changes of CDs@ZIF-L and CDs@ZIF-L/PEI within 1 h to verify the stability of composite materials in water before and after modified by PEI. The inset displays the solution states of CDs@ZIF-L and CDs@ZIF-L/PEI after standing for 1 h to facilitate observation. The result shows that the dispersibility of CDs@ZIF-L without PEI modification was poor, and the IZIF-L/ICDs fluctuated considerably. After 1 h, the precipitation of CDs@ZIF-L occurred obviously while the CDs@ZIF-L/PEI dispersion remains stable. Moreover, the fluorescence intensity of CDs@ZIF-L/PEI dispersion barely changed within 1 h. Thus, it can be concluded that the surface modification by PEI could improve the fluorescence stability of the composite attributed to the outstanding hydrophilicity of PEI. The fluorescence intensity changes of CDs@ZIF-L/PEI under 60 min of UV light exposure (365 nm) are shown in Fig. 7b. The IZIF-L/ICDs of CDs@ZIF-L/PEI slightly changed from 0 to 60 min. This experimental result indicates that CDs@ZIF-L/PEI exhibit excellent UV lamp resistance.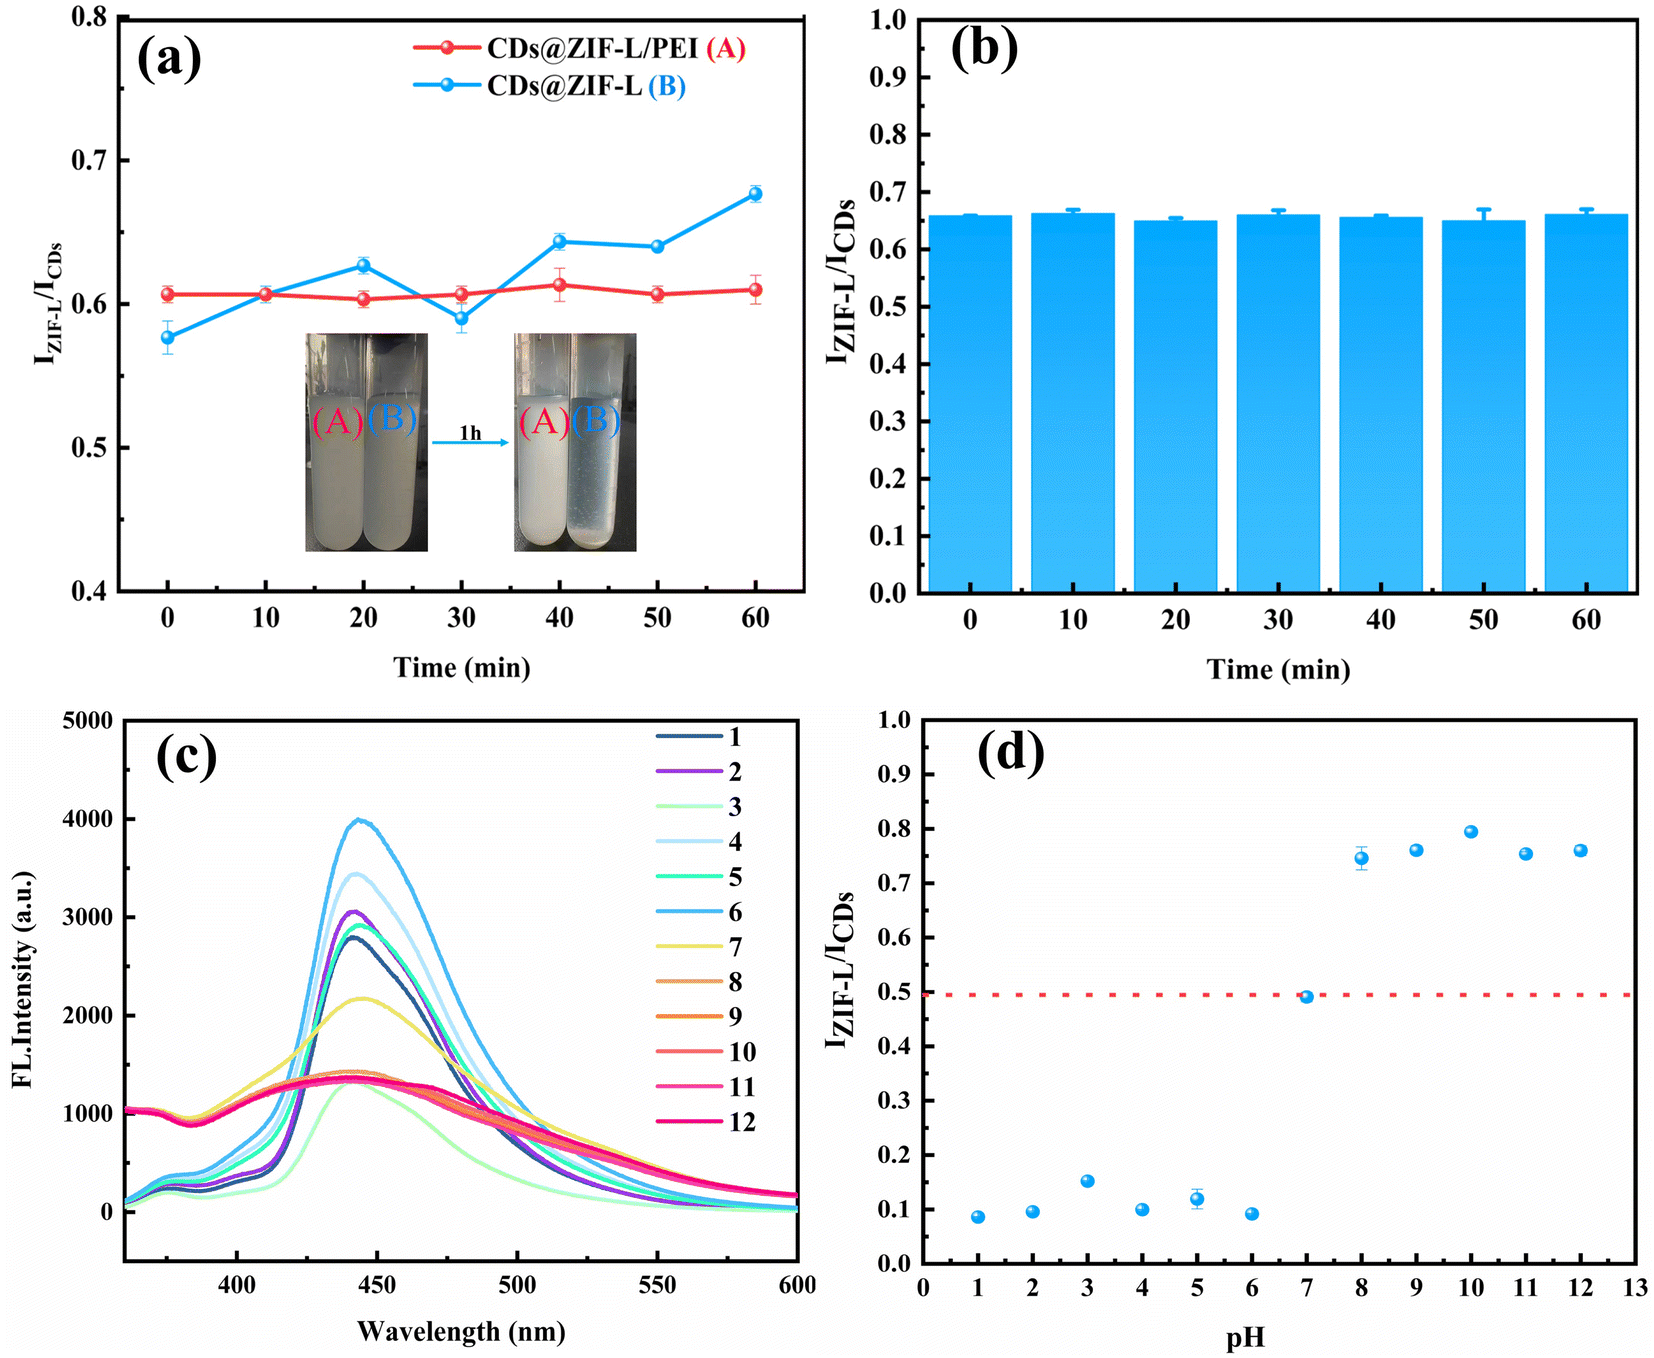 | ||
| Fig. 7 (a) Fluorescence stability of CDs@ZIF-L and CDs@ZIF-L/PEI within 1 h (inset shows the solution state of CDs@ZIF-L and CDs@ZIF-L/PEI after standing for 1 h); (b) UV lamp exposure time on the fluorescence spectra acquired by IZIF-L/ICDs at an excitation wavelength of 330 nm; (c) fluorescence emission and (d) IZIF-L/ICDs variation of CDs@ZIF-L/PEI (1.0 mg mL−1) in different pH aqueous solution. | ||
Because the fluorescence intensity changes with the pH value, it is required to verify the influence of pH values on the detection result. Hydrochloric acid and sodium hydroxide were used to prepare aqueous solutions with 1–12 pH values and then 1 g L−1 CDs@ZIF-L/PEI dispersion was prepared with these aqueous solutions. The pH response of the CDs@ZIF-L/PEI fluorescence dual-emission sensor is displayed in Fig. 7c and d. With the change in pH from 1 to 6, the CDs fluorescence intensity of CDs@ZIF-L/PEI changed considerably, the dual-emission was indistinct and the IZIF-L/ICDs value was close to 0.1. When the pH value of the solution is 7, the dual-emission became apparent and the IZIF-L/ICDs value was 0.5. However, under alkaline conditions, the fluorescence intensity of the CDs and ZIF-L was approximately similar and IZIF-L/ICDs was higher, close to 0.8. It is speculated that under alkaline conditions, CDs and ZIF-L both could exhibit higher fluorescence intensity so can forming a proportional relationship easily.
Application in real samples
The practicability and accuracy of the CDs@ZIF-L/PEI dual-emission sensor for Hg2+ detection in water and foundation solution were evaluated. Tap water, Beichuan Lake water and cosmetics were determined using the standard method and the results are presented in Table 2. The spiked recoveries ranged from 92% to 102%, 92.9% to 100.4% and 98.5% to 103.2% for tap water, Beichuan Lake water and cosmetics, respectively, indicating that the compound could be successfully applied to Hg2+ detection in actual water samples and cosmetics without significant interference. These results demonstrate that CDs@ZIF-L/PEI exhibit high accuracy and precision as a dual-emission sensor for determining Hg2+.| Spiked amounts (mM) | CDs@ZIF-L/PEI found (mM) | Recovery (%) | |
|---|---|---|---|
| Tap water | 0 | 0.018 | |
| 0.2 | 0.216 | 99 | |
| 0.5 | 0.726 | 102 | |
| 1 | 1.646 | 92 | |
| Beichuan Lake | 0 | 0.086 | |
| 0.2 | 0.283 | 98.5 | |
| 0.5 | 0.785 | 100.4 | |
| 1 | 1.714 | 92.9 | |
| Foundation | 0 | 0.111 | |
| 0.2 | 0.208 | 98.5 | |
| 0.5 | 0.724 | 103.2 | |
| 1 | 1.077 | 96.2 |
Fluorescence detection mechanisms
The inner filter effect (IFE) phenomenon occurs when the fluorescence excitation or emission spectra of fluorescent material overlap the absorption spectrum of the quencher. It is believed that the fluorescence of the excitation or emission of the fluorescent compound is absorbed by the quencher. As shown in Fig. S4a,† the UV absorption wavelength range of Hg2+ could absorb most of the excitation and emission spectra, leading to the fluorescence quenching of CDs@ZIF-L/PEI, indicating that the possible fluorescence quenching mechanism between Hg2+ and CDs@ZIF-L/PEI is attributed to IFE. Multiple UV spectra were obtained to further understand the quenching mechanism and verify the fluorescence resonance energy transfer. As shown in Fig. S4b,† curve 4 is the UV spectra of CDs@ZIF-L/PEI, 1–3 are different concentrations of Hg2+ and 5 to 7 are CDs@ZIF-L/PEI with different concentrations of Hg2+. However, the 5-1, 6-2, and 7-3 curves did not overlap with 4, indicating that the fluorescence resonance energy transfer phenomenon probably occurred between CDs@ZIF-L/PEI and Hg2+.Dispersibility test and application
The dispersibility of the CDs@ZIF-L/PEI composite in different solvents was also studied. We chose the solvents with varying polarities: water, DMF, MeOH, CH3CN and EtOH, as shown in Fig. 8a. It can be seen that CDs@ZIF-L/PEI dissolved well in solvents with polarity, which appeared uniformly blue under ultraviolet light. This experiment presumably enabled the Hg2+ detection by CDs@ZIF-L/PEI to be applied to different solvents. To apply the CDs@ZIF-L/PEI in solid phase sensors, agarose was chosen as the base to synthesise the composite hydrogel (HG) CDs@ZIF-L/PEI + HG. As shown in Fig. 8b, the blank hydrogel had no fluorescence under a UV lamp. However, CDs@ZI-L/PEI + HG had fluorescence and double peaks. This result provides the basis for applying CDs@ZIF-L/PEI in the solid phase. The aforementioned experiments broaden the application range of CDs@ZIF-L/PEI and prove that they will have good applicability in the future.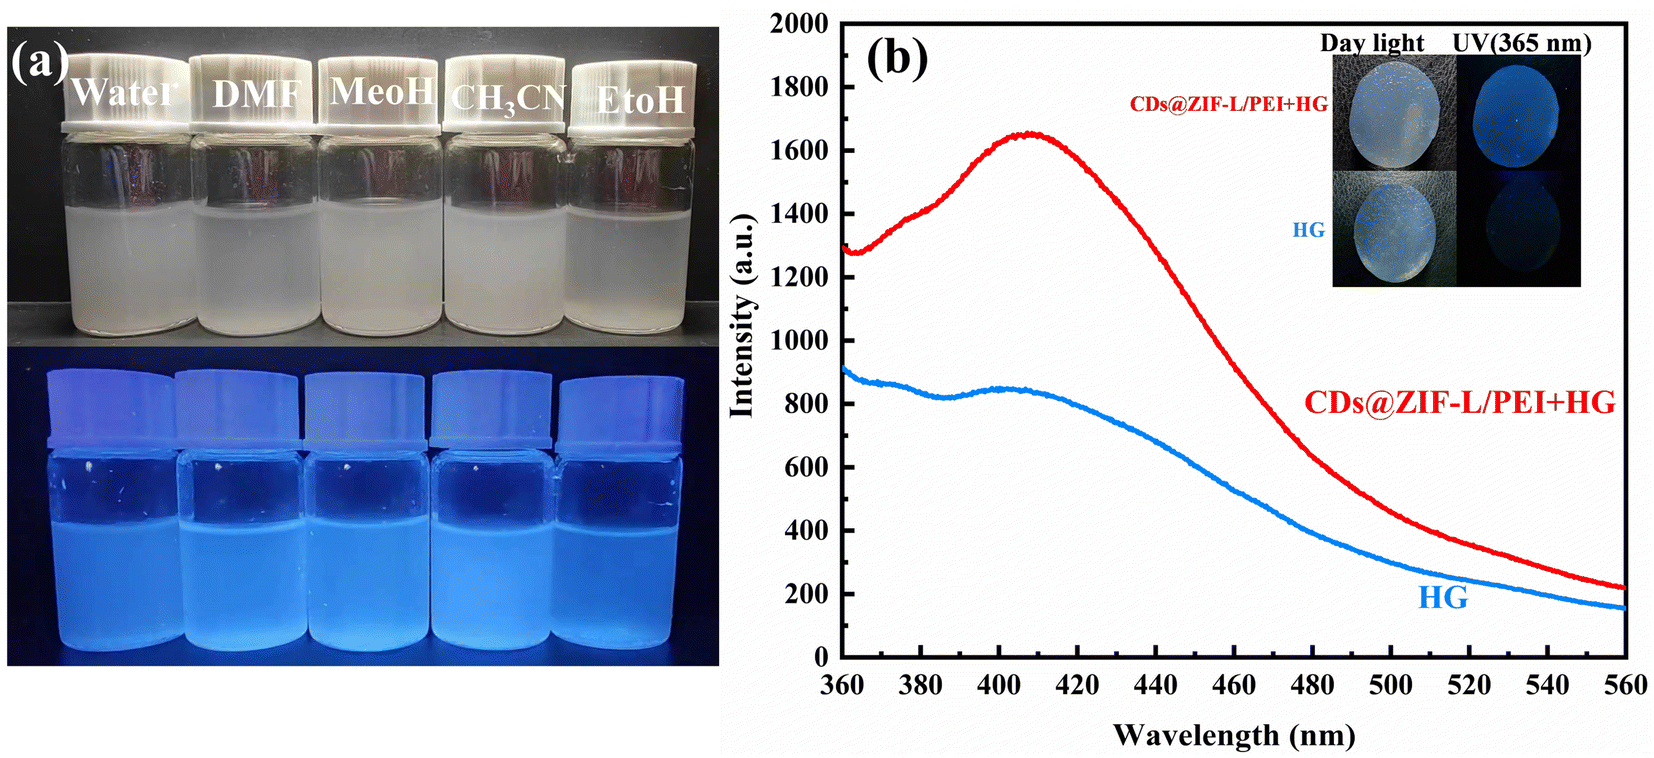 | ||
| Fig. 8 (a) Photographs under natural and UV lamps in different solvents (λ = 365 nm, CDs@ZIF-L/PEI concentration = 1.0 mg mL−1); (b) fluorescent emission spectra of CDs@ZIF-L/PEI + HG and HG (insets are the photographs of CDs@ZIF-L/PEI + HG and HG under natural and UV lamps). | ||
Conclusions
In summary, we presented a simple strategy to synthesise a dual-emission CDs@ZIF-L/PEI sensor that doped CDs into ZIF-L and modified the surface using PEI. The composite exhibited great fluorescence properties and water stability. By doping CDs in the ZIF-L, the composite exhibited dual emissions at 370 and 440 nm for a more sensitive detection of Hg2+. Moreover, compared to CDs@ZIF-L, CDs@ZIF-L/PEI process better solubility and stability. The composite, CDs@ZIF-L/PEI, produced high sensitivity (LOD = 14.5 nM), high stability (no precipitate within 60 min) and great selectivity. The dual wavelength ratiometry-based approach was successfully used for detecting Hg2+ in tap water, Beichuan Lake, and foundation with satisfactory recoveries of 92–102%, 92.9–100.4% and 96.2–103.2%, respectively, indicating CDs@ZIF-L/PEI was applicable and exhibited considerable potential for application in the different environment. In addition, we dissolved it in different solvents and used it to prepare hydrogels, confirming that CDs@ZIF-L/PEI will have a wide range of applications in the future.Author contributions
Weijun Song: validation, investigation, resources, supervision, project administration, funding acquisition. Xiaoyun Liu: validation, data curation, methodology, writing – original draft. Chunyan Sun: writing – review & editing. Mingxia Chai: validation, investigation.Conflicts of interest
The authors declare no competing financial interest.Acknowledgements
This study was supported by the foundation of QingHai Province Science and Technology Department (2020-ZJ-702).Notes and references
- C. M. Tyrakowski and P. T. Snee, Anal. Chem., 2014, 86, 2380–2386 CrossRef CAS PubMed.
- A. Kumar, A. R. Chowdhuri, D. Laha, T. K. Mahto, P. Karmakar and S. K. Sahu, Sens. Actuators, B, 2018, 263, 677 CrossRef CAS.
- Y. Ma, Y. Chen, J. Liu, Y. Han, S. Ma and X. Chen, Talanta, 2018, 185, 249–257 CrossRef CAS PubMed.
- A. M. Nasir, N. A. H. Md Nordin, P. S. Goh and A. F. Ismail, J. Mol. Liq., 2018, 250, 269–277 CrossRef CAS.
- H. Liu, H. Li, K. Du and H. Xu, Mater. Today Commun., 2022, 33, 104880 CrossRef CAS.
- L. Tan, Z. Chen, C. Zhang, X. Wei, T. Lou and Y. Zhao, Small, 2017, 13, 1603370 CrossRef PubMed.
- M. O. Caglayan, Spectrochim. Acta, Part A, 2020, 241, 118682 CrossRef CAS PubMed.
- J. Sreeshma and C. Sudandiradoss, BioMetals, 2021, 34, 621–638 CrossRef CAS PubMed.
- L. Chen, C. Zhou, T. Yang, W. Zhou, Y. Chen, L. Wang, C. Lu and L. Dong, Small, 2023, 2300456 CrossRef CAS PubMed.
- Y.-L. Li, H.-Y. Chi, M.-Y. Kan, S.-Y. Pao, Y.-H. Kang, J.-J. Chen and D.-Y. Kang, ChemNanoMat, 2017, 3, 902–908 CrossRef CAS.
- X. Liu, Y. Li, Y. Ban, Y. Peng, H. Jin, H. Bux, L. Xu, J. Caro and W. Yang, Chem. Commun., 2013, 49, 9140 RSC.
- M. R. Cerón, M. Izquierdo, N. Alegret, J. A. Valdez, A. Rodríguez-Fortea, M. M. Olmstead, A. L. Balch, J. M. Poblet and L. Echegoyen, Chem. Commun., 2016, 52, 64–67 RSC.
- S. Xian, F. Xu, C. Ma, Y. Wu, Q. Xia, H. Wang and Z. Li, Chem. Eng. J., 2015, 280, 363–369 CrossRef CAS.
- H. Wang, T. Li, J. Li, W. Tong and C. Gao, Colloids Surf., A, 2019, 568, 224–230 CrossRef CAS.
- J. S. F. Silva, J. Y. R. Silva, G. F. De Sá, S. S. Araújo, M. A. G. Filho, C. M. Ronconi, T. C. Santos and S. A. Júnior, ACS Omega, 2018, 3, 12147–12157 CrossRef CAS PubMed.
- G. Lu, S. Li, Z. Guo, O. K. Farha, B. G. Hauser, X. Qi, Y. Wang, X. Wang, S. Han, X. Liu, J. S. DuChene, H. Zhang, Q. Zhang, X. Chen, J. Ma, S. C. J. Loo, W. D. Wei, Y. Yang, J. T. Hupp and F. Huo, Nat. Chem., 2012, 4, 310–316 CrossRef CAS PubMed.
- P. Liu, R. Hao, W. Sun, Z. Lin and T. Jing, Luminescence, 2022, 37, 1793–1799 CrossRef CAS PubMed.
- J. Shang, G. Li, R. Singh, Q. Gu, K. M. Nairn, T. J. Bastow, N. Medhekar, C. M. Doherty, A. J. Hill, J. Z. Liu and P. A. Webley, J. Am. Chem. Soc., 2012, 134, 19246–19253 CrossRef CAS PubMed.
- T.-T. Han, J. Yang, Y.-Y. Liu and J.-F. Ma, Microporous Mesoporous Mater., 2016, 228, 275–288 CrossRef CAS.
- W. Yang, Y. Yang, H. Li, D. Lin, W. Yang, D. Guo and Q. Pan, Inorg. Chem. Front., 2020, 7, 3718–3726 RSC.
- D. Esken, S. Turner, C. Wiktor, S. B. Kalidindi, G. Van Tendeloo and R. A. Fischer, J. Am. Chem. Soc., 2011, 133, 16370–16373 CrossRef CAS PubMed.
- J. Zhou, Y. Yang and C. Zhang, Chem. Commun., 2013, 49, 8605 RSC.
- H. Guo, X. Wang, N. Wu, M. Xu, M. Wang, L. Zhang and W. Yang, Anal. Chim. Acta, 2021, 1141, 13–20 CrossRef CAS PubMed.
- D. Li and F. Xu, J. Solid State Chem., 2021, 302, 122406 CrossRef CAS.
- L. Chen, D. Zhao, S. Chen, X. Wang and C. Chen, J. Colloid Interface Sci., 2020, 562, 618 CrossRef CAS PubMed.
- S. Wu, Y. Yin, C. Sun and W. Song, ChemistrySelect, 2022, 7, e202202540 CrossRef CAS.
- G. Li, W. Kujawski, A. Tonkonogovas, K. Knozowska, J. Kujawa, E. Olewnik-Kruszkowska, N. Pedišius and A. Stankevičius, Chem. Eng. Res. Des., 2022, 181, 195–208 CrossRef CAS.
- C. Ma, Z. Yang, X. Guo, Z. Qiao and C. Zhong, J. Membr. Sci., 2022, 663, 121069 CrossRef CAS.
- Y. A. Y. A. Mohammed, A. M. Abdel-Mohsen, Q.-J. Zhang, M. Younas, L.-B. Zhong, J.-C. E. Yang and Y.-M. Zheng, Chem. Eng. J., 2023, 461, 141972 CrossRef CAS.
- P. Louette, F. Bodino and J.-J. Pireaux, Surf. Sci. Spectra, 2005, 12, 144–148 CrossRef CAS.
- J. Wei, D. Hao, L. Wei, A. Zhang, C. Sun and R. Wang, Luminescence, 2021, 36, 472–480 CrossRef CAS PubMed.
- J. Yang, B. Ruan, Q. Ye, L.-C. Tsai, N. Ma, T. Jiang and F.-C. Tsai, Microporous Mesoporous Mater., 2022, 331, 111630 CrossRef CAS.
- C. Jiao, Z. Li, X. Li, M. Wu and H. Jiang, Sep. Purif. Technol., 2021, 259, 118190 CrossRef CAS.
- A. Kasprzak, M. Popławska, M. Bystrzejewski, O. Łabędź and I. P. Grudziński, RSC Adv., 2015, 5, 85556–85567 RSC.
- X.-L. Qu and B. Yan, Inorg. Chem., 2019, 58, 524–534 CrossRef CAS PubMed.
- P. Ravichandiran, V. K. Kaliannagounder, N. Maroli, A. Boguszewska-Czubara, M. Masłyk, A. R. Kim, B.-H. Park, M.-K. Han, C. S. Kim, C. H. Park and D. J. Yoo, Spectrochim. Acta, Part A, 2021, 257, 119776 CrossRef CAS PubMed.
- C. Zhang, S. Wu, Y. Yu and F. Chen, Spectrochim. Acta, Part A, 2020, 227, 117666 CrossRef CAS PubMed.
- X. Ye, Y. Kang and J. Zhou, Cellulose, 2020, 27, 5197–5210 CrossRef CAS.
- Y. Zheng, Y. Wan, Y. Wei and Y. Yu, J. Fluoresc., 2023, 33(5), 1941–1948 CrossRef CAS PubMed.
- E. Moradi, R. Rahimi and V. Safarifard, J. Solid State Chem., 2020, 286, 121277 CrossRef CAS.
- J. H. Wang, Y. M. Liu, Z. M. Dong, J. B. Chao, H. Wang, Y. Wang and S. Shuang, J. Hazard. Mater., 2020, 382, 121056 CrossRef CAS PubMed.
Footnote |
| † Electronic supplementary information (ESI) available. See DOI: https://doi.org/10.1039/d3ra04250b |
| This journal is © The Royal Society of Chemistry 2023 |