 Open Access Article
Creative Commons Attribution 3.0 Unported Licence
NOx degradation ability of S-g-C3N4/MgAl-CLDH nanocomposite and its potential application in cement-based materials
Zhengxian Yang a,
Xiaoli Xionga,
Xueyuan Yana,
Shengyang Luoa,
Yong Zhang
 *a,
Bruno Briseghellaa and
Giuseppe Carlo Maranob
aJoint International Research Laboratory of Deterioration and Control of Costal and Marine Infrastructures and Materials, College of Civil Engineering, Fuzhou University, Fuzhou 350108, China. E-mail: y.zhang@fzu.edu.cn
bDepartment of Structural, Geotechnical and Building Engineering, Politecnico di Torino, Corso Duca degli Abruzzi, 24-10129 Torino, Italy
First published on 18th July 2023
Abstract
In this study a new photocatalytic nanocomposite, S-g-C3N4/MgAl-CLDH, was synthesized and implemented into cement mortar by internal mixing or coating. The photocatalytic NOx degradation efficiency of the S-g-C3N4/MgAl-CLDH and photocatalytic mortar was investigated. The NOx degradation efficiency and photoluminescence spectra of S-g-C3N4/MgAl-CLDH after being immersed in the simulated concrete pore solution were evaluated to assess its chemical stability. The results show that compared with S-g-C3N4, the S-g-C3N4/MgAl-CLDH exhibits a narrower bandgap (2.45 eV), a lower photogenerated electron–hole pair recombination rate and a higher specific surface area (36.86 m2 g−1). After 21 min of visible light irradiation, the NOx degradation rate of S-g-C3N4/MgAl-CLDH achieves 100% as compared to merely 81.5% of S-g-C3N4. After being submerged in simulated concrete pore solution, the S-g-C3N4/MgAl-CLDH exhibits only a slight decrease of 5% in degradation rate after 12 min of irradiation, confirming a good compatibility and stability in cement-based materials. The NOx degradation ability of the internally mixed mortar is enhanced with an increase in the dosage of S-g-C3N4/MgAl-CLDH. For coated mortar, in contrast, a decline in NOx degradation rate is observed after 5 layers of coating owing to the lower porosity of mortar after excessive coating.
1. Introduction
Nitrogen oxides (NOx) represent a notable category of atmospheric pollutants that give rise to substantial environmental issues, such as the emergence of photochemical smog, the occurrence of acid rain and the development of respiratory diseases in human beings.1,2 Adoption of efficacious approaches aiming at preventing or controlling NOx pollution is urgently in need. One approach that has gained considerable attention is the implementation of photocatalytic techniques, in particular incorporating photocatalysts into various construction materials such as cement-based materials.3,4 Currently, TiO2 is known as one of the most widely used photocatalysts. It has however drawbacks such as large band gap width (3.2 eV), high rate of recombination of photogenerated electron–hole pairs, low utilization of visible light and susceptibility to aggregation.5 Compared to TiO2, a new semiconductor photocatalytic material, graphite carbon nitride (g-C3N4), has a smaller band gap width (2.7 eV), a wider range of response to visible light and a lower cost.6 It is reported that g-C3N4 can be stimulated by ultraviolet-visible (UV-vis) light and has been utilized in various depollution fields such as degradation of organic pollutants and the mitigation of air pollution.6 Nevertheless, due to insufficient absorption of UV-vis light, the g-C3N4 exhibits a relatively low photocatalytic efficiency, greatly limiting its practical applications.7 In this respect, researchers have proposed various modification approaches for g-C3N4, including non-metal element doping7 and semiconductor composites.8,9 To begin with, the doping of non-metal elements into g-C3N4 can reduce the band gap width and broaden the range of light response, thereby enhancing its photocatalytic performance. Liu et al.10 reported that compared to pure g-C3N4, Cl-g-C3N4 exhibited approximately a five-fold increase in specific surface area, leading to enhanced photocatalytic performance. Specifically, the degradation efficiency of Rhodamine B (RhB) using Cl-g-C3N4 was approximately 12.9 times higher than that of g-C3N4. Wang et al.11 synthesized sulfur (S) doped g-C3N4 (S-g-C3N4). Compared to g-C3N4, the S-g-C3N4 exhibited an absorption edge shift from 455 nm to 470 nm, indicating enhanced visible light absorption capability. Meanwhile the band gap width also reduced from 2.70 eV to 2.63 eV, indicating a decrease in the recombination rate of photogenerated electron–hole pairs. Notably, the photocatalytic efficiency of S-g-C3N4 in the degradation of methanol (CH3OH) was nearly twice that of g-C3N4.Another modification method is semiconductor composition, which involves combining two different semiconductor materials with distinct band structures. The energy level difference between the two semiconductors allows for the injection of photogenerated charge carriers from one semiconductor to the energy level of the other, facilitating efficient charge separation and promoting enhanced photocatalytic reaction efficiency.12 Gu et al.13 prepared O-g-C3N4/TiO2 heterostructured photocatalysts using an in situ solvothermal method. This composite combines the advantages of both components, such as the higher light utilization efficiency of O-g-C3N4 and the larger surface area of TiO2, effectively enhancing the photocatalytic performance. The results indicate that the optimized O-g-C3N4/TiO2 composite exhibits a photocatalytic performance 6.1 times higher than that of a physical mixture of TiO2 and O-g-C3N4. Xiong et al.14 synthesized g-C3N4/CoAl-LDH using the hydrothermal method, and found that the incorporation of g-C3N4 into CoAl-LDH enhances the photocatalytic activity towards Cr(VI). The enhanced photocatalytic activity is mainly attributed to the synergistic effect of the heterojunction electric field at the interface between g-C3N4 and CoAl-LDH, which accelerates electron transfer and the separation of photogenerated electron–hole pairs. Zheng et al.15 prepared MgAl-LDO@g-C3N4 composite material using a hydrothermal and calcination method and found that MgAl-LDO@g-C3N4 exhibits superior photocatalytic RhB removal capability compared to Mg-Al-LDO. This can be attributed to the narrow bandgap structure for effective visible light response and the intimate interface for rapid charge transfer and migration.
Noteworthy, the incorporation of g-C3N4 in cement-based materials suffers from challenges owing to its chemical instability in highly alkaline environment.16,17 Great opportunities lie in the utilizations of layered double hydroxides (LDH), a group of compounds consisting of laminates made up of metal oxides and possessing high alkaline resistance. Of particular interest is that the LDH phases have a molecular structure that resembles cement hydration products.18,19 As a result, it demonstrates excellent compatibility with cement-based materials. As such, LDH can serve as ideal supportive substrates for photocatalysts.20,21 Huang et al.22 prepared a group of g-C3N4/CoAl-LDH nanocomposites with different g-C3N4 content and immersed them into simulated concrete pore solution. They found only a slight increase in photoluminescence (PL) intensity for g-C3N4/CoAl-LDH after alkaline treatment. In contrast, a significant increase was observed in the case of g-C3N4. This suggests that the alkaline environment has a lesser impact on the g-C3N4/CoAl-LDH nanocomposite as opposed to g-C3N4. Furthermore, the degradation efficiency of NOx improves in the g-C3N4/CoAl-LDH nanocomposites as the g-C3N4 content increases. This improvement can primarily be attributed to the effective combination of g-C3N4 with LDH, which facilitates the separation and transfer of photo-induced charge carriers.
The application of g-C3N4 for the degradation of NOx exhibits considerable promise from both environmental and economic perspectives, particularly when implemented in cement-based materials. In order to improve the disadvantages of g-C3N4 including low visible light utilization, high photogenerated electron–hole pairs recombination rate and poor alkaline resistance, this study employed sulfur for the modification of g-C3N4 through doping. Then, S-g-C3N4/MgAl-CLDH nanocomposite was synthesized using electrostatic self-assembly method. A range of analytical techniques was utilized to characterize the physicochemical properties of S-g-C3N4/MgAl-CLDH, including X-ray diffraction (XRD), X-ray photoelectron spectroscopy (XPS), Fourier transform infrared spectra (FTIR), UV-vis diffuse reflectance spectroscopy (UV-vis DRS), Brunauer–Emmett–Teller (BET), transmission electron microscopy (TEM) and scanning electron microscopy coupled with energy dispersive X-ray (SEM-EDX). Furthermore, the photocatalytic performance of S-g-C3N4/MgAl-CLDH was analyzed through RhB and NOx degradation tests. Lastly, to assess the application potential of S-g-C3N4/MgAl-CLDH in cement-based materials, the stability of its NOx degradation ability in simulated concrete pore solution was examined. The NOx degradation ability of cement mortar loaded with S-g-C3N4/MgAl-CLDH, by internal mixing or coating, was investigated.
2. Experimental
2.1. Raw materials
All chemical reagents were supported from National Medicine Group Chemical Reagent Co., Ltd., China. The main information of each reagent is shown in Table 1. The ordinary Portland cement (OPC), P.O 42.5, compliant with the Chinese standard GB175-2007, was utilized in the study. The chemical compositions of the OPC were determined using X-ray fluorescence (XRF) analysis and are presented in Table 2. Deionized water and standard sand, as per Chinese standard GB/T 14684-2022, were employed for preparation of cement mortar.| Chemical formula | Purity | Molecular mass | |
|---|---|---|---|
| Ethanol anhydrous | C2H6O | AR | 46.07 |
| Thiourea | CH4N2S | AR | 76.12 |
| Calcium hydroxide | Ca(OH)2 | AR | 74.09 |
| Hydrochloric acid | HCl | AR | 34.46 |
| Potassium nitrate | KNO3 | AR | 101.10 |
| Rhodamine B | C28H31CIN3O3 | AR | 479.01 |
| Hydrotalcite | Mg6Al2(OH)16CO3·4H2O | AR | 603.98 |
| Melamine | C3H6N6 | AR | 126.12 |
| CaO | SiO2 | Al2O3 | Fe2O3 | SO3 | Other |
|---|---|---|---|---|---|
| 64.21 | 20.83 | 6.22 | 2.87 | 1.82 | 4.05 |
2.2. Synthesis of S-g-C3N4/MgAl-CLDH composites
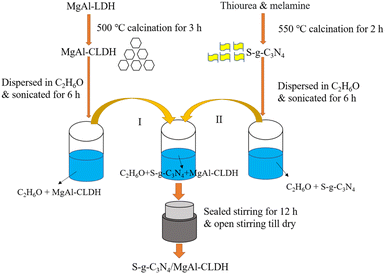
For the preparation of g-C3N4, 2 g of melamine precursor was placed in a muffle furnace, heated up to 550 °C with a heating rate of 3 °C min−1, and held for calcination for 2 h. After cooling to room temperature, the light yellow colored g-C3N4 was obtained, which was then ground into powder. The synthesis of the S-g-C3N4 involved thermal polymerization, employing melamine as the precursor and thiourea as the source of sulfur. A total of 5 g of melamine precursor and 5 g of thiourea were combined and thoroughly ground to obtain blended mixture. The resulting product was subsequently dried at 60 °C, followed by calcination in a muffle furnace. The calcination process involved heating the mixture at a rate of 3 °C min−1 until reaching a temperature of 550 °C, and maintaining this temperature for a duration of 2 h. Subsequently, S-g-C3N4 with a nanosheet structure was obtained. Similarly, MgAl-CLDH was prepared as follows: 3 g MgAl-LDH was placed in a muffle furnace, heated to 500 °C with a heating rate of 5 °C min−1 and held for calcination for 3 h.The S-g-C3N4/MgAl-CLDH photocatalytic composites were synthesized via electrostatic self-assembly. The preparation procedure, as depicted in Fig. 1, involved the following steps. Firstly, 0.2 g of S-g-C3N4 was added to a beaker containing 20 mL of anhydrous ethanol. The beaker was then subjected to ultrasonic treatment (with an ultrasonic intensity of 0.96 kW m−2) in a water bath for 6 h, resulting in the formation of a well-dispersed S-g-C3N4 suspension. Similarly, 0.5 g of MgAl-CLDH powder was dispersed in a beaker containing 50 mL of anhydrous ethanol. Subsequently, the suspensions s of S-g-C3N4 and MgAl-CLDH were combined and placed in an oil bath at 80 °C. The mixture was stirred under sealed conditions for 12 h, followed by open stirring at 80 °C until it was completely dried, resulting in the formation of the desired S-g-C3N4/MgAl-CLDH photocatalytic composites.
2.3. Preparation of photocatalytic cement mortars
Both the internal mixing and coating method were adopted to prepare photocatalytic cement mortars. For the internal mixing method, S-g-C3N4/MgAl-CLDH (accounting for 0 wt%, 3 wt% and 5 wt% of OPC) was mixed with 135 g of deionized water. The mixture was stirred for 60 min to attain a stable suspension. In the meantime, 450 g of OPC and 1350 g of standard sand were placed into the mixer. Then, dry materials were mixed at a slow speed (140 rpm) for 1 min. Subsequently, the photocatalytic suspension was added into the mixer within 30 s, followed by adding another 135 g of deionized water. Then, the mixture was mixed at a slow speed for 90 s and at a fast speed (285 rpm) for another 90 s. Well-mixed fresh mortar was cast into cube molds with dimensions of 40 mm × 40 mm × 40 mm. After that, the molds were put onto a vibration table for vibrating until bubbles no longer emerge on the mortar surface. During the vibration, a scraper was used to flatten the surface. At one day of curing age, mortar specimens were demolded and transferred into a standard curing room (20 ± 2 °C, >95% RH).For the coating method, 0.5 g of Ptb emulsion was weighed and dissolved in 100 mL of deionized water and stirred rapidly for 60 min until the emulsion and water got fully mixed to obtain the binding agent. Next, 2 g of S-g-C3N4/MgAl-CLDH was added to the binding agent and then it was stirred for another 60 min to obtain a uniformly dispersed suspension. Cement mortar with water: cement: sand ratio of 0.6![[thin space (1/6-em)]](https://www.rsc.org/images/entities/char_2009.gif) :
:![[thin space (1/6-em)]](https://www.rsc.org/images/entities/char_2009.gif) 1
1![[thin space (1/6-em)]](https://www.rsc.org/images/entities/char_2009.gif) :
:![[thin space (1/6-em)]](https://www.rsc.org/images/entities/char_2009.gif) 3 was prepared as per Chinese standard GB/T 17671-1999. Until the age of 28 d, the mortar specimen was coated with the photocatalytic slurry. To make the surface suspension spread evenly, a fine toothpick was used to scrape the surface. The S-g-C3N4/MgAl-CLDH content of each layer of coating is about 0.02 g. Then, the mortar specimen was dried in an oven with a constant temperature of 60 °C for 10 min. After the coating was completely dry, the next layer of coating was applied, up to a maximum of six layers.
3 was prepared as per Chinese standard GB/T 17671-1999. Until the age of 28 d, the mortar specimen was coated with the photocatalytic slurry. To make the surface suspension spread evenly, a fine toothpick was used to scrape the surface. The S-g-C3N4/MgAl-CLDH content of each layer of coating is about 0.02 g. Then, the mortar specimen was dried in an oven with a constant temperature of 60 °C for 10 min. After the coating was completely dry, the next layer of coating was applied, up to a maximum of six layers.
2.4. Characterization of physical and chemical properties
Analytical techniques including XRD, FTIR, BET, UV-vis DRS, TEM and SEM-EDX were employed to characterize the photocatalysts. To investigate the crystal plane in each photocatalyst, XRD analysis was conducted using a MiniFlex 600 (Rigaku Co., Ltd., Japan), with a voltage of 40 kV and a current of 40 mA. The diffracted intensity of KαCu radiation was measured across a range of 2θ from 5° to 65°, with a scanning rate of 20° min−1. By FTIR spectroscopy, the functional groups and chemical bonds of dry photocatalysts were investigated using a Nicolet iS50 (Thermo Fisher Scientific China Co., Ltd.). The scanning range was 400–4000 cm−1, with 64 scans and a resolution of 2 cm−1. In addition, the heterojunction structure of the sample was observed by TEM using a TECNAI G2 F20 (ThermoFisher, USA). Before TEM analysis, the sample was dispersed in anhydrous ethanol and then deposited on an amorphous carbon grid. The specific surface area and pore size distribution of samples were obtained through BET test using the ASAP 2020 (Micromeritics, USA) automatic specific surface porosity analyzer. Before BET analysis, each sample was heated at 60 °C for 24 h under vacuum. The optical absorbance of dry photocatalysts was examined using a UV-vis spectrometer (Cary 7000, Agilent, USA) within the range of 200–800 nm, and BaSO4 was used as the reference. Lastly, the morphology and element mapping of the sample was investigated by SEM-EDX, using a Verios G4 UC (ThermoFisher, USA). Prior to SEM-EDX analysis, powder samples were mounted on double-sided carbon tape and gold-plated for 2 min using a fully automatic sputter coater (Emitech K550X, USA).2.5. Characterization of photocatalytic activity
 | (1) |
 | ||
| Fig. 2 Experimental setup for NOx photocatalytic degradation test: (a) cyclic reaction; (b) continuous reaction. | ||
In case of cyclic reaction method, 0.5 g of photocatalytic powder was first placed in a quartz groove (40 mm × 20 mm × 10 mm) and then a small amount of anhydrous ethanol was added for ultrasonic dispersion. Next the powder was dried and cooled to room temperature. The prepared sample was put into the reaction chamber. The mixed gas was injected into the chamber, with a gas flow rate of 0.5 L min−1. In the meantime, the NOx concentration data was recorded every 30 s. When the initial concentration of NOx reached a stable equilibrium state, the ventilation was stopped, and the NOx concentration value [CNOx]in was recorded. To start the photocatalytic oxidation reaction, the xenon lamp was turned on. After illumination for 50 min, the xenon lamp was turn off and the NOx concentration value [CNOx]out was recorded. Using eqn (2), the degradation rate of the photocatalyst to NOx can be calculated.
 | (2) |
 | (3) |
 | (4) |
3. Results and discussion
3.1. Characterization of physicochemical properties of S-g-C3N4/MgAl-CLDH
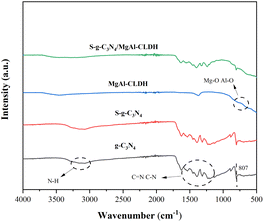
![[double bond, length as m-dash]](https://www.rsc.org/images/entities/char_e001.gif) N and the heterocyclic vibrations of C–N.27 Furthermore, the spectra of g-C3N4 and S-g-C3N4 exhibit a similar profile, indicating that the sulfur doping does not alter the chemical structure of g-C3N4. The peaks observed at 509 cm−1 and 668 cm−1 in MgAl-CLDH can be attributed to the stretching vibrations of Al–O, while the peak at 856 cm−1 can be attributed to the stretching vibrations of Mg–O.28 The characteristic peaks of S-g-C3N4/MgAl-CLDH are similar to those of S-g-C3N4. This indicates that MgAl-CLDH is successfully loaded onto the surface of S-g-C3N4, and the chemical structure of S-g-C3N4 is not disrupted during the composite formation with MgAl-CLDH. However, the relative peak intensities in the range of 1240 cm−1 to 1640 cm−1 are much weaker in S-g-C3N4/MgAl-CLDH than in S-g-C3N4. This could be attributed to the formation of chemical bonding between the Mg in MgAl-CLDH and the N in S-g-C3N4.29 Furthermore, the FTIR spectra of the S-g-C3N4/MgAl-CLDH sample exhibit vibrational bands corresponding to both S-g-C3N4 and MgAl-CLDH, proving the formation of a heterostructure in S-g-C3N4/MgAl-CLDH.
N and the heterocyclic vibrations of C–N.27 Furthermore, the spectra of g-C3N4 and S-g-C3N4 exhibit a similar profile, indicating that the sulfur doping does not alter the chemical structure of g-C3N4. The peaks observed at 509 cm−1 and 668 cm−1 in MgAl-CLDH can be attributed to the stretching vibrations of Al–O, while the peak at 856 cm−1 can be attributed to the stretching vibrations of Mg–O.28 The characteristic peaks of S-g-C3N4/MgAl-CLDH are similar to those of S-g-C3N4. This indicates that MgAl-CLDH is successfully loaded onto the surface of S-g-C3N4, and the chemical structure of S-g-C3N4 is not disrupted during the composite formation with MgAl-CLDH. However, the relative peak intensities in the range of 1240 cm−1 to 1640 cm−1 are much weaker in S-g-C3N4/MgAl-CLDH than in S-g-C3N4. This could be attributed to the formation of chemical bonding between the Mg in MgAl-CLDH and the N in S-g-C3N4.29 Furthermore, the FTIR spectra of the S-g-C3N4/MgAl-CLDH sample exhibit vibrational bands corresponding to both S-g-C3N4 and MgAl-CLDH, proving the formation of a heterostructure in S-g-C3N4/MgAl-CLDH.
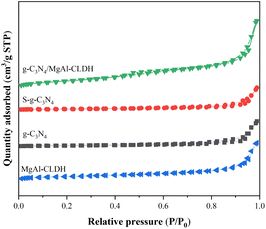 | ||
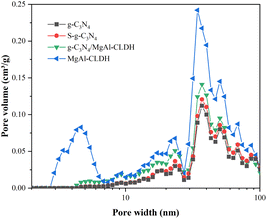
| Fig. 6 Nitrogen adsorption–desorption isotherms of g-C3N4, S-g-C3N4, MgAl-CLDH and S-g-C3N4/MgAl-CLDH. | ||
| Samples | SBET (m2 g−1) | Pore volume (cm3 g−1) | Average pore diameter (nm) |
|---|---|---|---|
| g-C3N4 | 7.54 | 0.014 | 18.55 |
| S-g-C3N4 | 12.55 | 0.023 | 17.32 |
| MgAl-CLDH | 54.79 | 0.047 | 9.68 |
| S-g-C3N4/MgAl-CLDH | 36.86 | 0.091 | 13.63 |
| αhν = K(hν − Eg)2/n | (5) |
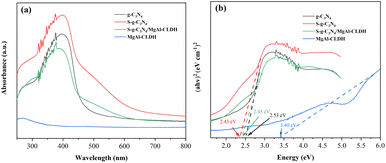
Fig. 8(a) and (b) show the UV-vis diffuse reflectance spectra and bandgap width curve of each photocatalyst, respectively. It can be seen that compared to g-C3N4, S-g-C3N4 exhibits a redshift in the absorption edge. Specifically, the maximum absorption edge positions of g-C3N4 and S-g-C3N4 are 455 nm and 470 nm, respectively. In addition, the widened absorption range and the heightened absorption peak observed in S-g-C3N4 suggest an increased capacity for light absorption. The bandgap widths of S-g-C3N4 and g-C3N4 are determined to be 2.43 eV and 2.53 eV, respectively. This indicates that sulfur doping can reduce the bandgap width of g-C3N4, thereby effectively separating photogenerated electron–hole pairs and enhancing the light response range. On the other hand, the weak absorption phenomenon of the MgAl-CLDH derived metal oxide under UV light (below 400 nm) indicates its low photocatalytic performance. Compared to MgAl-CLDH and g-C3N4, the S-g-C3N4/MgAl-CLDH shows significantly different absorption curves. Firstly, S-g-C3N4/MgAl-CLDH exhibits a noticeable absorption band near 465 nm within the visible light range, and its bandgap width is calculated to be around 2.45 eV. Secondly, S-g-C3N4/MgAl-CLDH demonstrates a redshift in the absorption wavelength. As a result, under the same UV-vis light absorption intensity, S-g-C3N4/MgAl-CLDH exhibits stronger absorption in the visible light range than g-C3N4 and MgAl-CLDH. Additionally, S-g-C3N4/MgAl-CLDH exhibits a wider absorption peak in the range of 450 nm to 550 nm. Accordingly, the electrostatic self-assembly of S-g-C3N4 with MgAl-CLDH effectively improves the material's optical properties and enhances the range of visible light absorption, and meanwhile increases light utilization efficiency and generates more photogenerated electron–hole pairs, thereby significantly enhancing the photocatalytic activity.
3.2. Characterization of photocatalytic activity of S-g-C3N4/MgAl-CLDH
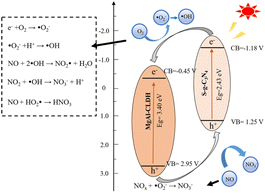
To examine the electronic potentials of S-g-C3N4 and MgAl-CLDH, Mott–Schottky (M–S) tests were performed. The positive slope in the M-S plots indicates that both S-g-C3N4 and MgAl-CLDH have n-type semiconductor properties. According to the intersection point of slope and abscissa of the M–S plots, the flat band potentials (vs. SCE) for S-g-C3N4 and MgAl-CLDH are determined as −1.18 and −0.45 eV, respectively, which are similar to their conduction band (CB) potentials. By employing the formula Eg = EVB − ECB, the valence band (VB) values (vs. SCE) for S-g-C3N4 and MgAl-CLDH were calculated as 1.25 and 2.95 eV, respectively. Then, a possible mechanism of photocatalytic NOx degradation by the S-g-C3N4/MgAl-CLDH is proposed and illustrated in Fig. 12. Under light irradiation, electrons (e−) on the surface of S-g-C3N4 in the nanocomposite are excited and transiting from VB to CB. Furthermore, due to the higher CB position of S-g-C3N4 (−1.18 eV) compared to MgAl-CLDH (−0.45 eV), MgAl-CLDH acts as an efficient electron acceptor, capable of capturing electrons from the conduction band of S-g-C3N4. The photoexcited electrons are then transferred to the CB of MgAl-CLDH, accelerating electron separation and transfer, thereby enhancing the photocatalytic activity. On the surface of MgAl-CLDH, the generated electrons undergo a reduction reaction with absorbed O2, producing superoxide radicals (˙O2−). These radicals are then converted into hydroxyl radical (˙OH), which participates in catalytic oxidation reactions to degrade the target pollutant NOx. In addition, a portion of ˙O2− can directly react with the NOx, thereby enhancing the reaction rate and promoting the separation of electrons and electron–holes (h+).
To this end, S-g-C3N4/MgAl-CLDH and S-g-C3N4 were immersed in two SCPS for a duration of 10 min. Subsequently, they were subjected to three cycles of rinsing with deionized water and vacuum-drying in an oven. The treated sample are denoted as S-g-C3N4/MgAl-CLDH(treated) and S-g-C3N4(treated). The degradation on NOx of treated sample is shown in Fig. 13. After treatment, the degradation rate of S-g-C3N4 decreases significantly. At 12 min, the degradation rate of S-g-C3N4 is about 56.2%, and that of S-g-C3N4(treated) is 40.7%, which decreases by 15.5%. In contrast, the degradation rate of S-g-C3N4/MgAl-CLDH is 86.7%, while that of the S-g-C3N4/MgAl-CLDH(treated) after SCPS treatment is 81.5%, suggesting a gentle decrease by 5.2% only. The poor chemical stability of S-g-C3N4 in SCPS may be due to the adsorption of alkaline metal ions (K+, Na+, Ca2+) on the surface of the photocatalytic material in a strongly alkaline environment, leading to an increase in the rate of recombination of photogenerated electron–hole pairs and thus reducing the activity of the photocatalytic material.39 The direct contact between S-g-C3N4 and the alkaline solution was avoided by combining MgAl-CLDH. As a result, the metal cations were no longer available as compounding centers for the photogenerated electron–hole pairs, effectively mitigating significant loss in photocatalytic activity.
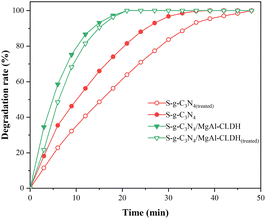 | ||
| Fig. 13 Photocatalytic degradation of NOx by S-g-C3N4 and S-g-C3N4/MgAl-CLDH with or without SCPS treatment. | ||
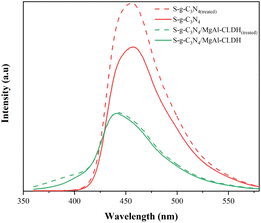
Photoluminescence (PL) spectra serve as an effective measure to characterize the photogenerated electron–hole pair recombination rate of the photocatalyst. Fig. 14 shows the PL spectra of S-g-C3N4 and S-g-C3N4/MgAl-CLDH with or without immersion in the SCPS. It is noticeable that S-g-C3N4/MgAl-CLDH has much lower PL intensity compared with S-g-C3N4, indicating lower photogenerated electron–hole pair recombination rate. In addition, the PL intensity of S-g-C3N4 is significantly enhanced after treatment, indicating that the S-g-C3N4 is susceptible to the strong alkaline environment. The photogenerated electron–hole pair recombination rate of S-g-C3N4(treated) is increased and its photocatalytic activity is adversely affected. Similar result has been reported elsewhere.40 In contrast, the PL intensity of the S-g-C3N4/MgAl-CLDH material was only slightly enhanced after treatment, suggesting that S-g-C3N4/MgAl-CLDH has a high stability in SCPS. This can be attributed to the similarity of the structure of LDH with the hexagonal-layered hydration products of cement, including C2(A,F)H8, C4(A,F)H13 and C4(A,F)H19.41 Thus, MgAl-CLDH demonstrates excellent compatibility with cementitious materials and possesses favorable chemical stability in SCPS. Consequently, the introduction of MgAl-CLDH into S-g-C3N4 ensures that S-g-C3N4/MgAl-CLDH inherits respective advantages, weakening the adverse effects of highly alkaline environment on the photocatalytic activity of S-g-C3N4/MgAl-CLDH.
3.3. Photocatalytic activity in cement mortar
Fig. 15(a) shows the NOx degradation curves of mortars internally mixed with S-g-C3N4/MgAl-CLDH. An instantaneous decrease in NOx gas concentration at the onset of the photocatalytic reaction is observed. As the concentration of the photocatalyst increases, the decline in NOx gas concentration becomes more pronounced. Notably, when the dosage of S-g-C3N4/MgAl-CLDH reaches 5 wt%, the instantaneous reduction in NOx concentration is the highest.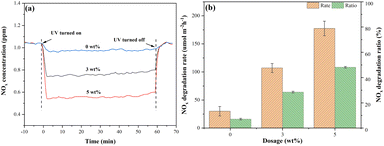 | ||
| Fig. 15 (a) NOx degradation curves and (b) NOx degradation rate and ratio of mortar internally mixed with different S-g-C3N4/MgAl-CLDH concentrations. | ||
Based on the data presented in Fig. 14(a), the NOx degradations for cement mortar with different S-g-C3N4/MgAl-CLDH concentrations were calculated using eqn (3) and (4) given in Subsection 2.5.2. The results are shown in Fig. 15(b). To be specific, the NOx degradation rates for mortars containing 0 wt%, 3 wt% and 5 wt% of S-g-C3N4/MgAl-CLDH are 30.1, 107.1 and 177.5 μmol m−2 h−1, respectively. Similarly, the NOx degradation ratios for the corresponding mortars are 7.2%, 28.53% and 48.2%, respectively. This indicates that the increase in the dosage of S-g-C3N4/MgAl-CLDH results in an increase in the NOx degradation rate of photocatalytic cement mortar. The observed phenomenon can be attributed to the constrained accessibility of active sites of the photocatalyst embedded in the cementitious matrix at lower concentrations of S-g-C3N4/MgAl-CLDH. Nevertheless, with the increase of S-g-C3N4/MgAl-CLDH content, the population of active sites on the surface of the cementitious material increases, thus progressively enhancing its ability to degrade NOx through photocatalysis. Notably, photocatalytic mortar with 5 wt% S-g-C3N4/MgAl-CLDH exhibits the highest NOx degradation rate and ratio.
Fig. 16(a) shows the NOx degradation curves of mortars coated with S-g-C3N4/MgAl-CLDH. With the increase of coating layers, the magnitude of instantaneous NOx concentration reduction shows an initial increase followed by a decrease. To be specific, at 5 layers of coating, the greatest reduction in NOx concentration is achieved. Fig. 16(b) shows the NOx degradation rate and degradation ratio of photocatalytic cement mortar under different coating layers. It is obvious that the photocatalytic cement mortar coated with 5 layers of S-g-C3N4/MgAl-CLDH exhibits the highest NOx degradation rate of 244.41 μmol m−2 h−1 and a degradation ratio of 68.5%. In comparison, the mortar with 3 layers of S-g-C3N4/MgAl-CLDH shows the lowest NOx degradation rate and degradation ratio, as 216.29 μmol m−2 h−1 and 61.5%, respectively.
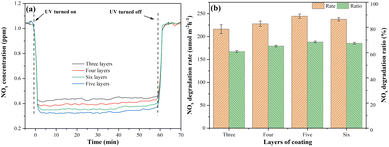 | ||
| Fig. 16 (a) NOx degradation curves and (b) NOx degradation rate and ratio of mortar coated with S-g-C3N4/MgAl-CLDH under different coating layers. | ||
The reason for the aforementioned phenomenon is described as follows. When the surface of the cement mortar is coated with a small quantity of photocatalytic material, the light absorption characteristics of the S-g-C3N4/MgAl-CLDH coating layer are weak, leading to fewer absorbed photons and fewer generated reactive oxygen species (ROS), resulting in low photocatalytic activity. For higher coating amount of S-g-C3N4/MgAl-CLDH on the cementitious substrate surface, the light absorption characteristics of the coating layer is enhanced, resulting in an increased generation of ROS and an improvement in photocatalytic activity. Additionally, the thickness of the S-g-C3N4/MgAl-CLDH coating layer is also a crucial factor controlling the electron transfer and light absorption efficiency. When the coating reaches a certain thickness, the light absorption efficiency of the photocatalytic cementitious material saturates, and the photocatalytic activity reaches a plateau. In addition, multiple coatings on the cementitious surface gradually reduce the porosity, leading to a decline in its adsorption capacity. The degradation of NOx in the cementitious material is a synergistic effect of its adsorption and degradation. A decrease in adsorption performance results in a reduction of internal NOx concentration. Therefore, after 5 layers of coating, the photocatalytic capacity for NOx degradation in the coated mortar gradually declines with further increase of coating.
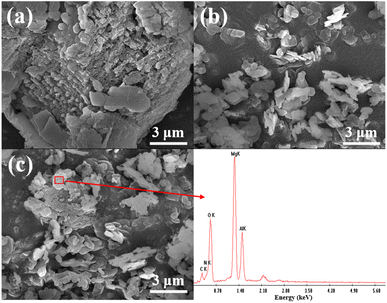
The effects of the internal mixing and coating method on the degradation of NOx in cement mortar were further elucidated by investigating the distribution of S-g-C3N4/MgAl-CLDH on the surface of the cement mortar. Fig. 17 shows the SEM images of mortar coated with 5 layers of S-g-C3N4/MgAl-CLDH and internally mixed with 5 wt% S-g-C3N4/MgAl-CLDH. The surface of the mortar coated with S-g-C3N4/MgAl-CLDH is dominated by nitrogen (N), which is rich in S-g-C3N4/MgAl-CLDH, while the concentration of calcium (Ca) is very low. This indicates that S-g-C3N4/MgAl-CLDH is evenly scattered on the surface of cement mortar and the loading amount is abundant. The increased exposure of S-g-C3N4/MgAl-CLDH on the surface of the cement mortar provides more opportunities for contact with NOx, thereby facilitating the photocatalytic oxidation reaction. Whereas, the surface of mortar internally mixed with S-g-C3N4/MgAl-CLDH is rich in Ca and poor in N, suggesting insufficient loading amount. It is concluded that in terms of photocatalytic performance, the coating method is more efficient, resulting in higher NOx degradation.
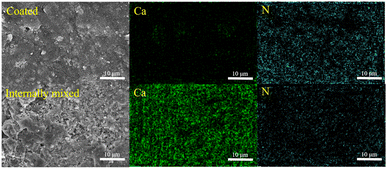 | ||
| Fig. 17 SEM images and elemental mapping analyses of the mortar coated or internally mixed with S-g-C3N4/MgAl-CLDH. | ||
4. Conclusions
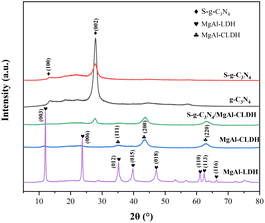
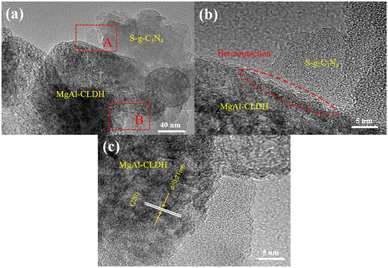
A novel photocatalytic nanocomposite S-g-C3N4/MgAl-CLDH was prepared using electrostatic self-assembly method. The application potential of S-g-C3N4/MgAl-CLDH in cement-based materials was evaluated based on measurements of physicochemical properties, photocatalytic performances and chemical stability of S-g-C3N4/MgAl-CLDH after immersing in simulated concrete pore solution (SCPS). Besides, photocatalytic performances of cement mortars loaded with S-g-C3N4/MgAl-CLDH were investigated. The main conclusions can be drawn as follows:(1) A significant change in the lattice spacing between S-g-C3N4 and MgAl-CLDH was revealed by TEM technique and the formation of a heterogeneous structure between the two materials was confirmed. The successful synthesis of S-g-C3N4/MgAl-CLDH with high degree of crystallinity was demonstrated by XRD and FTIR.
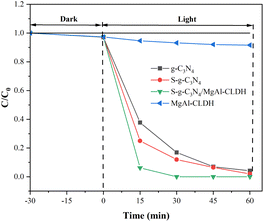
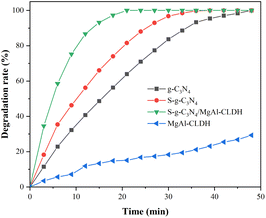
(2) Compared to S-g-C3N4, the S-g-C3N4/MgAl-CLDH exhibited a narrower bandgap (2.45 eV), a lower rate of photogenerated electron–hole pairs recombination and a 1.94-fold increase in specific surface area. After 30 min of visible light irradiation, the degradation rate of RhB by S-g-C3N4 reached 88% only, whereas S-g-C3N4/MgAl-CLDH achieved a complete degradation of NOx. After 21 min of visible light irradiation, the NOx degradation rate of S-g-C3N4/MgAl-CLDH achieved 100% while that of S-g-C3N4 was merely 81.5%.
(3) After being submerged in SCPS, the photocatalytic NOx degradation efficiency of S-g-C3N4 was decreased by 15.5% after 12 min of illumination, whereas S-g-C3N4/MgAl-CLDH exhibited only a slight decrease of 5% in degradation efficiency. The superior photocatalytic stability of S-g-C3N4/MgAl-CLDH is verified, which can be attributed to the excellent compatibility and stability of MgAl-CLDH in SCPS. Meanwhile, MgAl-CLDH serves as a barrier avoiding the direct contact of S-g-C3N4 and alkaline substances.
(4) The photocatalytic performance of the internally mixed mortar in degrading NOx improves gradually with an increase in the dosage of S-g-C3N4/MgAl-CLDH. The mortar with 5 wt% of S-g-C3N4/MgAl-CLDH exhibits the highest NOx degradation rate, reaching 48.2%. The NOx degradation performance of mortar improves as the coating increases up to 5 layers, but a decline in NOx degradation rate after 5 layers of coating is found owing to the reduced porosity of mortar because of excessive coating.
(5) In terms of photocatalytic performance, the coating method is more efficient, enabling higher NOx degradation, than the internal mixing method.
Author contributions
Conceptualization, Z. Y., X. X. and Y. Z.; data curation, Z. Y., X. X. and S. L.; formal analysis, Z. Y. and X. X.; investigation, X. X. and S. L.; methodology, Z. Y. and X. X.; project administration, Y. Z., B. B. and G. C. M.; supervision, Y. Z., B. B. and G. C. M.; validation, Y. Z. and S. L.; writing-original draft, Z. Y. and X. X.; writing-review and editing, Y. Z. All authors have read and agreed to the published version of the manuscript.Conflicts of interest
The authors declare that they have no known competing financial interests or personal relationships that could have appeared to influence the work reported in this paper.Acknowledgements
This work was financially supported by National Natural Science Foundation of China (51978171), Fujian Ocean and Fishery Bureau (FJHJF-L-2022-19) and Fuzhou Science and Technology Bureau (2021-P-031).References
- X. Lu, X. Ye, M. Zhou, Y. Zhao, H. Weng, H. Kong, K. Li, M. Gao, B. Zheng and J. Lin, Nat. Commun., 2021, 12, 5021 CrossRef CAS PubMed.
- B. Gu, L. Zhang, R. Van Dingenen, M. Vieno, H. J. Van Grinsven, X. Zhang, S. Zhang, Y. Chen, S. Wang and C. Ren, Sci, 2021, 374, 758–762 CrossRef CAS PubMed.
- A. Gopalan, J. Lee, G. Saianand, K. Lee, P. Sonar, R. Dharmarajan, Y. Hou, K. Ann, V. Kannan and W. Kim, Nanomater, 2020, 10, 1854 CrossRef CAS PubMed.
- W. Liu, S. Wang, J. Zhang and J. Fan, Constr. Build. Mater., 2015, 81, 224–232 CrossRef.
- H. Yang, J. Zhou, Z. Duan, X. Liu, B. Deng, J. Fang and W. Xu, Appl. Catal., B, 2022, 310, 121299 CrossRef CAS.
- S. Qi, X. Liu, R. Zhang, Y. Zhang and H. Xu, Inorg. Chem. Commun., 2021, 133, 108907 CrossRef CAS.
- H. Fang, X. Zhang, J. Wu, N. Li, Y. Zheng and X. Tao, Appl. Catal., B, 2018, 225, 397–405 CrossRef CAS.
- Z. Wu, Y. Zhao, L. Mi, Y. Guo, H. Wang, K. Liu, K. Zhang and B. Wang, Colloids Surf., 2021, 624, 126756 CrossRef CAS.
- T. Song, X. Yu, N. Tian and H. Huang, Int. J. Hydrogen Energy, 2021, 46, 1857–1878 CrossRef CAS.
- C. Liu, Y. Zhang, F. Dong, A. H. Reshak, L. Ye, N. Pinna, C. Zeng, T. Zhang and H. Huang, Appl. Catal., B, 2017, 203, 465–474 CrossRef CAS.
- K. Wang, Q. Li, B. Liu, B. Cheng, W. Ho and J. Yu, Appl. Catal., B, 2015, 176, 44–52 CrossRef.
- Y. Wang, Z. Wang, S. Muhammad and J. He, CrystEngComm, 2012, 14, 5065–5070 RSC.
- R. Zhong, Z. Zhang, H. Yi, L. Zeng, C. Tang, L. Huang and M. Gu, Appl. Catal., B, 2018, 237, 1130–1138 CrossRef CAS.
- J. Xiong, G. Xiao, H. Zeng, C. Chen and D. An, Appl. Clay Sci., 2020, 193, 105669 CrossRef CAS.
- X. Zheng, Q. Zhu, H. Peng, Y. Quan and J. Wen, Chem. Phys. Lett., 2021, 779, 138846 CrossRef CAS.
- M. Majdoub, Z. Anfar and A. Amedlous, ACS Nano, 2020, 14, 12390–12469 CrossRef CAS.
- T. U. Haq and Y. Haik, ACS Sustainable Chem. Eng., 2022, 10, 6622–6632 CrossRef CAS.
- Z. Yang, H. Fischer and R. Polder, Cem. Concr. Compos., 2014, 47, 87–93 CrossRef CAS.
- Z. Yang, H. Fischer and R. Polder, Cem. Concr. Compos., 2015, 58, 105–113 CrossRef CAS.
- S. Sanati and Z. Rezvani, Chem. Eng. J., 2019, 362, 743–757 CrossRef CAS.
- H. Li, J. Li, C. Xu, P. Yang, D. H. Ng, P. Song and M. Zuo, J. Alloys Compd., 2017, 698, 852–862 CrossRef CAS.
- M. Huang, Z. Yang, L. Lu, J. Xu, W. Wang and C. Yang, Catal, 2022, 12, 443 CAS.
- L. Ge, C. Han and J. Liu, Appl. Catal., B, 2011, 108, 100–107 CrossRef.
- W. Yan, R. Zhang, F. Ji and C. Jing, J. Hazard. Mater., 2020, 392, 122472 CrossRef CAS PubMed.
- G. Gao, Z. Zhu, J. Zheng, Z. Liu, Q. Wang and Y. Yan, J. Colloid Interface Sci., 2019, 555, 1–10 CrossRef CAS PubMed.
- X. Zheng, M. Huang, Y. You, X. Fu, Y. Liu and J. Wen, Chem. Eng. J., 2018, 334, 1399–1409 CrossRef CAS.
- Q. Chen, S. Li, H. Xu, G. Wang, Y. Qu, P. Zhu and D. Wang, Chin. J. Catal., 2020, 41, 514–523 CrossRef CAS.
- D. Ivánová, P. Albert and J. Kavuličová, Appl. Clay Sci., 2018, 152, 65–72 CrossRef.
- L. Ge, Z. Peng, W. Wang, F. Tan, X. Wang, B. Su, X. Qiao and P. K. Wong, J. Mater. Chem. A, 2018, 6, 16421–16429 RSC.
- Q. Song, Y. Zhou, J. Hu, C. Zhou, X. Shi, D. Li and D. Jiang, Appl. Surf. Sci., 2021, 563, 150369 CrossRef CAS.
- H. H. Peng, J. Chen, X. L. Guo, H. Chen and Y. X. Zhang, Dalton Trans., 2016, 45, 10530–10538 RSC.
- J. Li, X. Li, G. Wu, J. Guo, X. Yin and M. Mu, J. Environ. Chem. Eng., 2021, 9, 106723 CrossRef CAS.
- C. Qin, Z. Li, G. Chen, Y. Zhao and T. Lin, J. Power Sources, 2015, 285, 178–184 CrossRef CAS.
- M. Alvarez, T. López, J. A. Odriozola, M. A. Centeno, M. I. Domínguez, M. Montes, P. Quintana, D. H. Aguilar and R. D. González, Appl. Catal., B, 2007, 73, 34–41 CrossRef CAS.
- M. Yu, L. Zhang, J. Wen, H. Zhang, F. Liu, Y. Lv and X. Zhao, J. Inorg. Organomet. Polym., 2021, 1–11 Search PubMed.
- S. Hu, L. Ma, F. Li, Z. Fan, Q. Wang, J. Bai, X. Kang and G. Wu, RSC Adv., 2015, 5, 90750–90756 RSC.
- T. Guan, L. Fang, Y. Lu, F. Wu, F. Ling, J. Gao, B. Hu, F. Meng and X. Jin, Colloids Surf., A, 2017, 529, 907–915 CrossRef CAS.
- E. M. Seftel, M. Niarchos, C. Mitropoulos, M. Mertens, E. F. Vansant and P. Cool, Catal. Today, 2015, 252, 120–127 CrossRef CAS.
- F. Peng, Y. Ni, Q. Zhou, J. Kou, C. Lu and Z. Xu, Constr. Build. Mater., 2018, 179, 315–325 CrossRef CAS.
- P. Liu, Y. Gao, F. Wang, W. Zhang, L. Yang, J. Yang and Y. Liu, Constr. Build. Mater., 2016, 120, 42–47 CrossRef CAS.
- Z. Yang, H. Fischer and R. Polder, Mater. Corros., 2013, 64, 1066–1074 CrossRef CAS.
| This journal is © The Royal Society of Chemistry 2023 |

