 Open Access Article
Neem plant extract-assisted synthesis of CeO2 nanoparticles for photocatalytic degradation of piroxicam and naproxen†
Farah Quddusa,
Afzal Shah *a,
Jan Nisarb,
Muhammad Abid Ziac and
Shamsa Munir
 d
d
aDepartment of Chemistry, Quaid-i-Azam University, Islamabad 45320, Pakistan. E-mail: afzals_qau@yahoo.com
bNational Centre of Excellence in Physical Chemistry, University of Peshawar, Peshawar 25120, Pakistan
cUniversity of Education Attock, Attock, Punjab 43600, Pakistan
dSchool of Applied Sciences and Humanities, National University of Technology, Islamabad 44000, Pakistan. E-mail: smunir@nutech.edu.pk
First published on 22nd September 2023
Abstract
Piroxicam and naproxen are well-known non-steroidal anti-inflammatory drugs that are frequently detected in aquatic environments due to their widespread usage and improper disposal practices. This research investigates the photocatalytic degradation of these drugs by using CeO2 nanoparticles. The nanoparticles were synthesized by using Azadirachta indica plant extract and were characterized through various characterization techniques such as UV-visible spectroscopy, FTIR spectroscopy, SEM, EDX, and XRD. The photocatalytic degradation of piroxicam and naproxen using CeO2 nanoparticles led to the efficient removal of these pharmaceutical drugs in a short time duration with photodegradation efficiencies of 89% and 97% for naproxen and piroxicam, respectively. The photodegradation reaction was found to follow pseudo-order first-order kinetics. The recyclability of the catalyst was also studied for up to six cycles where the degradation efficiency was maintained at 100% till the 2nd cycle and was decreased by 11 and 13% for piroxicam and naproxen respectively after the 6th cycle. The current work focused on the achievement of sustainable development goals (SDGs) for water purification via environmentally benign nanoparticles to remedy water pollution as it is the most prevalent issue in developed and underdeveloped countries throughout the world.
1. Introduction
The world has been facing challenges and threats to aquatic and terrestrial creatures due to the exponential rise in industrialization. Requirements for drugs and medicine-making companies have also increased due to the expanded population worldwide. In underdeveloped countries, there is no proper disposal system for the waste metabolites discharged from hospitals and drug manufacturing units. Moreover, a lack of awareness in public leads to the unwise discharge of expired medicines into open areas. Consequently, these waste products significantly enter water reservoirs making the water unfit for drinking and other purposes. Water-borne diseases lead to fatal health risks and deaths for both aquatic and terrestrial creatures.1 The aquatic life also gets affected by the ingestion of these toxic metabolites leading to the severe destruction of internal organs and alteration in their reproductive pattern. These aquatic creatures such as fish are utilized by human beings as food causing various health hazards such as immunosuppression, endocrine disruption, mutation, etc. Researchers are interested in developing safer and more sophisticated methods for the removal of these toxic moieties from water bodies without the production of any secondary pollutants. Various methods have been employed for this purpose, however, photocatalytic degradation has gained much popularity due to various advantages such as its environmentally friendly nature, cost-effectiveness, and consumption of less energy.2NSAIDs are highly prescribed medicines in health care due to which significant amounts of these drugs and their degraded products are added to water bodies causing the water to be unfit for consumption by aquatic and terrestrial species. They are currently the leading water pollutants among other pharmaceutical compounds and toxicological health hazards are linked with these drugs. They leave various chronic and acute side effects such as endocrine disruption, change in the reproduction pattern of aquatic creatures, failure of internal organs of fish, congestive heart failures in humans, immune suppressions, and genotoxicity.3 Therefore, multiple techniques are being used by researchers to get rid of these water pollutants. However conventional methods are not so effective due to certain associated limitations. Nowadays advanced oxidative techniques are employed to mineralize the persistent metabolites of these NSAIDs.4 The degradation pathway involves various steps such as decarboxylation, dehydrogenation, dichlorination, demethylation, oxidation, etc.5 Optimization of various parameters such as pH and concentration of catalyst and light intensity show great influence on the degradation efficiency of pharmaceutical drugs.
NSAIDs are traditionally removed by physical separation techniques such as adsorption and separating membrane techniques but the conversion of these pollutants into another secondary metabolite is observed during these purification methodologies. To overcome the production of these side products, advanced oxidative processes (AOPs) are adopted such as photocatalysis, electrolysis, sonolysis, ozonation, Fenton reaction etc.6 Photocatalytic mineralization of water contaminants is the most popular technique due to multitudes of benefits such as requirements of mild reaction conditions (temperature and pressure), cost-effectiveness, easy handling, and efficient removal rate. The effectiveness of photocatalysts is determined by various factors such as inertness (biologically and chemically), ability to respond to the absorption and consumption of UV-visible radiation, photostability, cost, and toxicity.7
Metal oxide nanoparticles are gaining immense significance in chemical, biological, and physical sciences due to their unique properties and wide range of applications. The first and foremost of these properties is the tunable size of nanoparticles. The size of the particles at the nanoscale is different from the particles in bulk and gives varying properties to them depending upon their size.8 By tuning their particle size, the electrical, optical, magnetic, and catalytic properties can be precisely controlled. The size-dependent properties are primarily the outcome of quantum confinement and enhanced surface-to-volume ratio. Metal oxide nanoparticles possess enhanced reactivity as compared to their bulk counterparts. This is because the increased surface area offers better interaction giving an improved catalytic performance. As a result, metal oxide nanoparticles can be efficiently employed for the degradation of pollutants, fuel production, chemical synthesis, and organic transformations.9 Cerium oxide (CeO2) is one of the lanthanoid metal oxides with diverse applications.10 CeO2 nanoparticles possess the characteristics of high stability and biocompatibility with applications in photocatalysis, electronics, bio-sensing, antibacterial action, and biomedical properties. They are also used for drug delivery and corrosion protection.11–13 Besides inorganic photocatalysts, a diverse variety of visible-light active organic catalysts are employed for the removal of contagious pollutants. These photocatalysts function via multiple degradation pathways. Some organic compounds are highly porous and abundantly used as photocatalysts for carbon dioxide reduction and water splitting. These organic porous compounds include metal–organic frameworks (MOFs), covalent organic frameworks (COFs), and hydrogen-bonded organic frameworks. The photocatalytic efficiency of these porous frameworks can be enhanced by the formation of their composites with multiple functionalities such as metal, metal oxide, and other photosensitizers.14 To reduce the chances of charge recombination, some other ionic moieties are suggested to be incorporated into the matrix of these covalent organic frameworks. Moreover, two-dimensional nanosheets of these organic frameworks are also synthesized with enhanced surface properties and catalytic efficiencies. In addition to these organic compounds, carbon nanotubes (CNTs) with different dimensions are widely used as an adsorbent of water pollutants.8,15,16
CeO2 NPs can easily be synthesized via chemical synthesis techniques such as sol–gel, hydrothermal and precipitation methods. Although these methods are efficient in achieving the desired morphology, crystallite, and particle size with the use of capping agents, certain drawbacks such as utilization of harmful chemicals as reducing agents lead to the production of secondary taxic metabolites. To tackle these difficulties, green synthesis routes are adopted by the researchers to synthesize environmentally friendly nanomaterials.
This research work is aimed to achieve the sustainable development goals of water purification by the application of plant-assisted synthesis of CeO2 NPs. The synthesis assisted by plant-based extracts is usually known as green or biogenic synthesis. Green synthesis is currently the most reliable synthesis technique through which nanoparticles can be synthesized on a large scale without the use of harmful chemicals.17 In addition no secondary pollutants are produced during the green synthesis process.18,19
1.1. Phytochemicals in Azadirachta indica
Azadirachta indica belongs to the Meliaceae family having therapeutic properties due to the presence of a large number of antioxidants. It is widely used for the preparation of various medicines and remedies to treat different diseases throughout the world. It is frequently found in tropical and subtropical regions. The extract obtained from the neem plant inhibits the formation of free radicals by acting as a scavenger to stop the pathogenic effect inside the human body. It also triggers various pathways of biological systems by stopping the production of cancerous cells. They also possess the characteristics of anti-inflammation, antibacterial, antifungal, antimalarial, antidiabetic, and antiviral.20,21 Literature study revealed the presence of multiple phytochemicals in the leaves extract of the neem plant. The most common of these components are alkaloids, flavonoids, tannins, steroids, and saponins. These compounds lead to the stabilization of nanoparticles as well as act as reducing and capping agents. Azadirachta indica, also known as ‘Neem’, is famous for its antibacterial activities and medicinal properties. It is also used in various cosmetics industries to cure skin problems.4 Owing to its properties and bio-friendly nature, we selected this plant as a reducing and capping agent to synthesize CeO2 nanoparticles.Different plant metabolites perform functions in the binding and reduction of metal ions during the synthesis of nanoparticles. Bio-reduction of metal oxide nanoparticles is usually achieved by phytochemicals including phenolic acid, proteins terpenoids, polyphenols, sugar, and alkaloids. Among all these reducing agents, terpenoids (organic polymers) are most prevalently associated with the synthesis and reduction of nanoparticles. Flavonoids are another class of polyphenolic groups with excellent chelating and reducing properties. They also exhibit a vital role in the growth and nucleation pattern of nanoparticles. Literature study revealed that proteins and amino acids also possess binding and reducing properties for the formation of nanomaterials. The formation of nanoparticles involved three main phases such as nucleation, growth, and termination phase. During the whole process of synthesis, the most stable version of nanoparticles with least surface energy is achieved due to action of plant metabolites. Besides the role of phytochemicals, some other factors such as pH, temperature and reaction conditions also affect the morphology of nanoparticles.22
2. Experimental section
2.1. Reagents and materials
Piroxicam and naproxen were obtained from a pharmaceutical manufacturing unit located in Peshawar, Pakistan. Cerium nitrate hexahydrate was purchased by Sigma-Aldrich. Distilled water and ethanol are used for the preparation of drug solutions. 1 mM HCl was used to adjust pH for photocatalytic experiments.2.2. Instrumentation
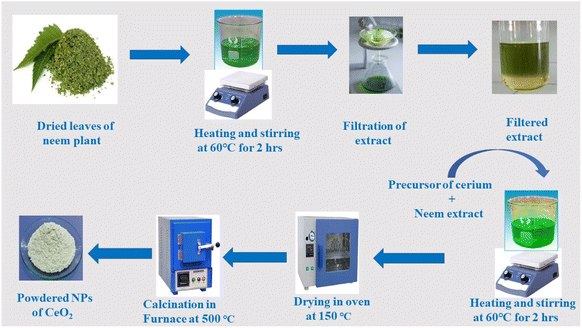
The optical spectra of nanoparticles (NPs) were obtained using a Shimadzu UV-1700 spectrophotometer. X-Ray diffraction (XRD) was used to analyze the structural properties of NPs using an analytical diffractometer 3040/60 X'pert high score with a Cu Kα beam (λ = 0.154 nm). The surface morphology and elemental content of CeO2 NPs were investigated using a JEOL-JAD-2300 scanning electron microscope (SEM) fitted with an energy dispersive. A Fourier transform infrared (FTIR) (BRUKER Platinum ATR) spectrometer was used to characterize the presence of organic functionalities contained in the NPs.2.3. Synthesis scheme of CeO2
3. Results and discussions
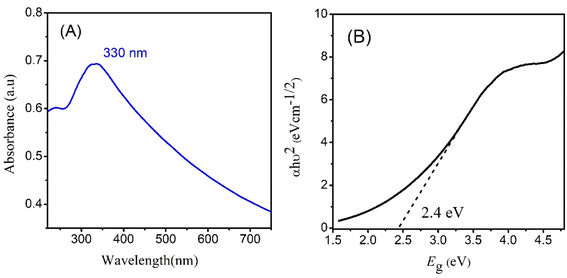
3.1. Optical properties of CeO2 NPs
Optical characterization of CeO2 was done by taking UV-visible absorption spectrum. The absorption spectrum exhibited maximum absorption (λmax) at 330 nm.23 The electronic transition between the valence band and conduction band are responsible for the absorption peak. The intensity and position of the peak depend on the size and shape of NPs. Meanwhile in the visible region, CeO2 NPs can have broad absorption bands related to oxygen vacancies and defects in crystal lattice.24 These defects create energy levels within the bandgap or ‘Urbach tails’ causing absorption of visible light. Other properties, such as surface plasmon resonance, adsorption, and passivation, can also impact the UV-visible spectrum by altering the position and intensity of the absorption peaks. Analyzing the UV-visible spectrum of CeO2 NPs is valuable in understanding their optical properties and behavior in various applications such as biomedical imaging, energy storage, and catalysis.Fig. 2 represents the absorption spectrum and band gap calculation through direct Tauc plot. A direct bandgap of 2.4 eV is observed for CeO2 NPs close to the values reported in literature.25,26 In a direct and gap, the maxima of valence band is aligned with the minima of the conduction band. An optimum bandgap leads to the enhanced excitation of electrons from valence band to conduction band leading to the fast generation of electrons and holes. These electrons and holes are then responsible for the generation of more free radicles which are initiators for photocatalytic degradation of drug molecules.27
3.2. XRD analysis
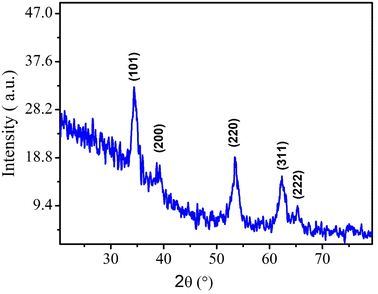
Morphological characterization of NPs was first conducted through XRD technique. The presence of sharp and well-defined peaks indicated the crystallinity of synthesized NPs. The diffraction peaks can be assigned to the following diffraction planes: (101), (200), (220), (311) and (222) which confirm the cubic crystal structure of CeO2 NPs. All the peaks were in complete agreement with crystallographic information and standard JCPDS card no. 96-900-9009.4 (as depicted in Fig. 3).Crystallite size of CeO2 NPs was calculated by using Debye Scherer formula.
 | (1) |
3.3. Fourier transform infrared spectroscopy
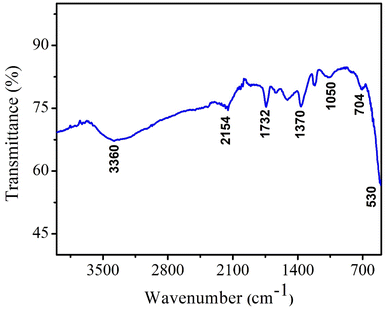
To confirm the formation of CeO2 NPs and the presence of organic functionalities, NPs were analyzed by Fourier transform infrared spectroscopy (FTIR) technique. FTIR is a very useful technique to monitor the presence of any impurities and confirm the chemical bonds in the compound. FTIR spectrum of CeO2 NPs represent various vibrational bands as depicted in Fig. 4. The peaks at 1732 cm−1 and 2154 cm−1 are attributed to the phytochemicals present inside the neem extract which confirmed the successful capping of nanoparticles by the plant metabolites. The vibration frequencies of other functionalities observed in FTIR are presented in Table 1. The broad band at 3360 cm−1 indicates the stretching vibrations of O–H functionality.28,29| Frequency (cm−1) | Organic functionality/vibration |
|---|---|
| 530 | Ce–O bond/stretching vibration |
| 704 | C–H bond/stretching vibration |
| 1050 | C–O/bond stretching vibration |
| 1370 | C–O stretching vibration |
| 1732 | C![[double bond, length as m-dash]](https://www.rsc.org/images/entities/char_e001.gif) O/stretching vibration O/stretching vibration |
| 2154 | C–N/bond vibration |
| 3360 | O–H/stretching vibrations |
3.4. Scanning electron microscopy
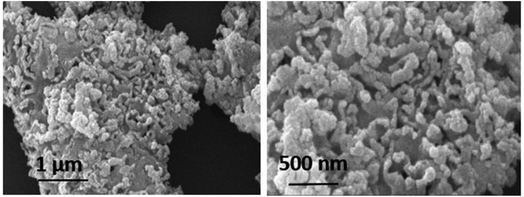
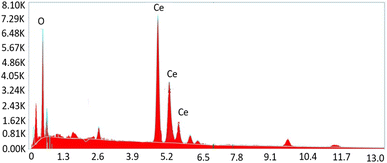
To get insight into the surface morphology of synthesized nanoparticles, scanning electron microscopy (SEM) was performed. Aggregated granular particles are clearly observed in SEM micrographs (see Fig. 5). These granular particles are grown into channel like porous structures which may be responsible for greater surface area to perform better catalytic activities. Spherical shaped nanoparticles appeared to be more aggregated due to high surface energy. Atoms tend to aggregate in order to lower the surface energy. However, these agglomerated particles may also lower the contact sites for drug molecules during the degradation process.30Elemental composition of synthesized nanoparticles was also confirmed by Energy Dispersive X-ray (EDX) analysis. The obtained results confirmed the presence of cerium and oxygen without the presence of any other impurity (Fig. 6).31,32 Table 2 shows the chemical composition of CeO2 NPs.
| Element | Weight% | MDL | Atomic% | Error% |
|---|---|---|---|---|
| O K | 19.78 | 0.18 | 66.7 | 0.7 |
| Ce L | 79.8 | 0.54 | 32.9 | 0.2 |
| Total | 99.58 | — | 99.8 | 0.8 |
3.5. Photocatalytic degradation studies
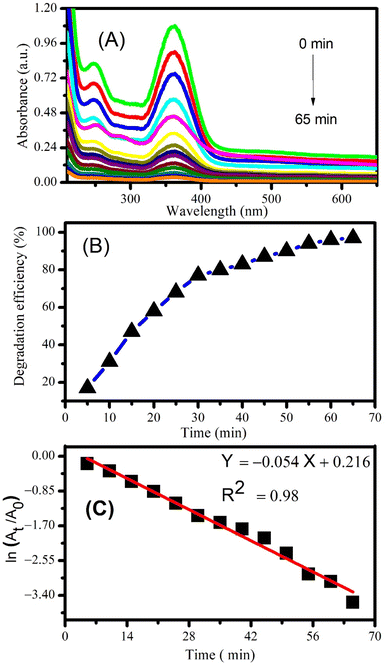
Photocatalytic degradation of piroxicam and naproxen was monitored by taking the 50 mL solutions of drugs separately and adding 2 mg of CeO2 NPs as catalyst. The drug solutions were then exposed to solar radiation at constant magnetic stirring. A small volume of the mixtures was drawn out after sunlight exposure of specific time intervals and absorption spectra were recorded. Fig. 7A shows the decrease in the absorption peak intensity of piroxicam with the passage of time manifesting the successful degradation of the drug.Degradation efficiency was calculated using the following equation:
| % degradation efficiency = A0 − At/A0 × 100 | (2) |
Maximum degradation efficiency of 97% was calculated for piroxicam after 65 minutes of photocatalysis using CeO2 NPs (see Fig. 7B). The order of the degradation reaction was determined by plotting ln(At/A0) vs. time according to the first order kinetic equation:
| ln(At/A0) = −kt | (3) |
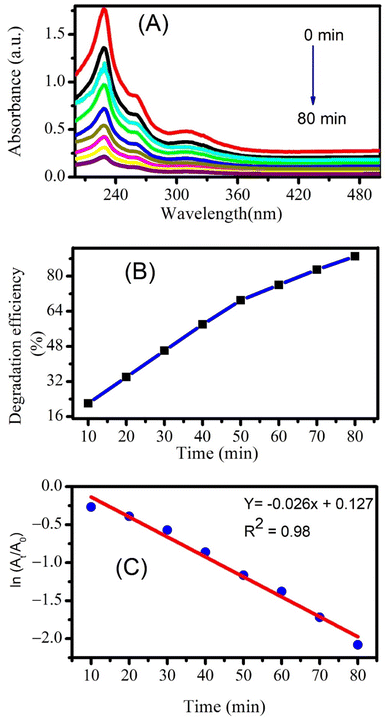
The photocatalytic degradation of naproxen studied through UV-visible absorption spectroscopy is displayed in Fig. 8A. The maximum degradation efficiency was found to be 89% after 80 minutes of photocatalysis as calculated using eqn (2). A comparison of the degradation efficiencies of piroxicam and naproxen from literature is displayed in Table 3. Few studies are reported for the photocatalytic degradation of piroxicam. This comparison shows that our environmentally benign CeO2 nanoparticles can easily substitute other chemically derived nanomaterials for photocatalytic degradation for piroxicam. A number of research studies have reported the photocatalytic degradation of naproxen manifesting degradation efficiencies above 90%. The literature survey displayed that ZnO nanoparticles are best to completely degrade naproxen within a short time of 20 minutes.
| Sr. | Catalytic material | % degradation | Time | Other conditions | Ref | |
|---|---|---|---|---|---|---|
| Piroxicam degradation | ||||||
| 1 | Ag–Fe3O4@Ca–Al layered double hydroxides | 95 | 2.5 h | 25 ppm photocatalyst, 400 W metal halide lamp light source | 33 | |
| 2 | Titania film supported on FTO glass | 70 | 22 h | 20 mg photocatalyst, black light tubes with 1.5 mW cm−2 intensity | 34 | |
| 3 | Iron activated persulfate | 100 | 0.5 h | >2 mg mL−1 catalyst, catalysis was carried out in water bath using cylindrical vessel at 25 °C | 35 | |
| 4 | Electro-Fenton process | 100 | 2 h | Piroxicam concentration 0.08 mM, anode B doped diamond or Pt and cathode tri dimensional C-felt at 23 ± 1 °C in 0.05 M Na2SO4 as supporting electrolyte | 36 | |
| 5 | Ammonia solution | 100 | 8 h | Piroxicam 2 mg mL−1, 250 μg mL−1 and 40 μg mL−1) in 2.5% NH4OH solution (pH ∼11.8), irradiation in the Suntest | 37 | |
| 6 | Plant extract based CeO2 NPs | 97 | 1 h | 1 mM naproxen, 2 mg of CeO2 NPs in sunlight, pH 4 | This work | |
![[thin space (1/6-em)]](https://www.rsc.org/images/entities/char_2009.gif) |
||||||
| Naproxen degradation | ||||||
| 1 | PAN-CNT/TiO2–NH2 composite nanofibers | 100 | 1.5 h | 5 mg L−1 naproxen, visible light (125 W power and intensity of 0.1 W cm−2) irradiation at room temperature. Catalyst was placed into a column (2 cm × 30 cm) | 38 | |
| 2 | ZnO nanoparticles | 100 | 20 min | 200 mg L−1 naproxen, UV light was a 125, 30 mg photocatalyst | 39 | |
| 3 | Bi-modified titanate nanobulks | 99.9 | 3 h | 0.25 mg L−1 naproxen, 500 W metal halogen lamp, 1.0 g L−1 catalyst dosage and 7.0 pH | 40 | |
| 4 | AgBr-α-NiMoO4![[thin space (1/6-em)]](https://www.rsc.org/images/entities/char_2009.gif) composite composite |
84 | 20 min | 10 ppm naproxen, 0.1 g photocatalyst, light source solar simulator 100 mW cm−2 | 41 | |
| 5 | N & S doped TiO2 coated on polycarbonate | 100 | 2 h | 2.5–10 mg mL−1 naproxen, 350 W xenon lamp in photocatalytic reactor photocatalyst with a photocatalyst flow rate of 20 mL min−1 | 42 | |
| 6 | 2D/2D Bi2MoO6/g-C3N4 | 83 | 1 h | 10 mg L−1 naproxen, 20 mg photocatalyst, 300 W xenon | 43 | |
| 7 | TiO2@ZnFe2O4/Cu | 80.73 | 2 h | pH (4–9), catalyst concentrations (0.005–0.1 g L−1, NPX (10–30 mg L−1), sunlight | 44 | |
| 8 | P25 TiO2 | >90 | 4 h | 0.5 g L−1 naproxen, filtered light from a medium pressure Hg lamp giving predominantly 254 nm and 366 nm irradiation | 45 | |
| 9 | SnO2/activated carbon nanocomposite | 94 | 2 h | 5–25 mg L−1 naproxen, 30 mg L−1 photocatalyst, pH 4, direct sunlight | 46 | |
| 10 | Yb-doped TiO2 | 93.89 | 3 h | 10 ppm naproxen, 0.3 g of photocatalyst, UV and blue LEDS light source | 47 | |
| 11 | Pristine Bi2O3 | 40 | 2 h | 0.01 mM naproxen, 20 mg photocatalyst, visible light irradiation 50 mW cm−12 | 48 | |
| 12 | Reduced graphene oxide-bismuth silicate-graphitic carbon nitride composites | >77.52 | 1.5 h | 10 mg L−1 naproxen, 50 mg photocatalyst, 250 W xenon lamp | 49 | |
| 13 | ZrO2/TiO2/Fe3O4 | 100 | 1.5 h | Naproxen 10 mg L−1, pH 3 and catalyst 0.5 g L−1, 150 W UV light source | 50 | |
| 14 | Doped g-C3N4 | 92.9 | 3.5 h | 10 mg mL−1 naproxen, 30 mg of catalysts, visible light illumination from the 300 W compact Xe lamp | 51 | |
| 15 | TiO2–La2O3 | 99.8 | 4 h | 30 mg L−1 naproxen, 200 mg photocatalyst, pH 7, 1 mW cm−2 ultraviolet lamp | 52 | |
| 16 | MIL-53(Al)@TiO2, MIL-53(Al)@ZnO, MIL-53(Al)@TiO2 | 80.3 | 4 h | 6 mg L−1 naproxen, 2 mg of photocatalyst, UV radiation light source | 53 | |
| 17 | Plant extract based CeO2 NPs | 89 | 1.3 h | 1 mM naproxen, 2 mg of CeO2 NPs in sunlight, pH 4 | This work | |
3.6. Mechanism of photodegradation
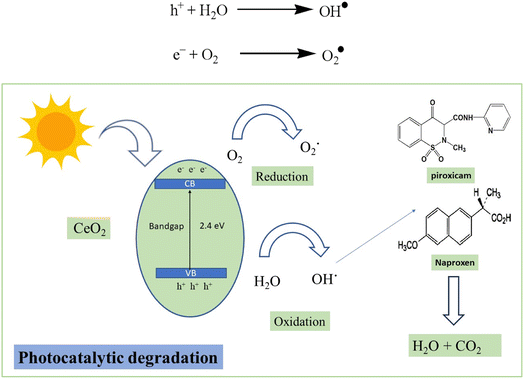
The sunlight excites the electrons present in the valence shell of CeO2 NPs to the conduction band creating electron–hole pairs. These electrons and holes are basically responsible for producing highly reactive species known as free radicals by reduction and oxidation. These OH˙ free radicals are generated when holes react with water molecules. Oxygen present in the atmosphere also reacts with the electrons, residing in the conduction band to form O2˙ free radicals. These free radicals thus formed can attack naproxen and piroxicam leading to decarboxylation, dehydration and ultimately the cleavage of the ring structure. Complete mineralization of these drugs can lead to the formation of carbon dioxide and water molecules.54,55 The proposed photocatalytic degradation mechanism is displayed in Scheme 1.3.7. Catalyst recovery
The reusability of the photocatalyst was studied by taking a significant concentration of CeO2 NPs and adding it to 50 mL drug solutions separately, followed by magnetic stirring under direct solar irradiation. After the first degradation cycle, the suspended particles of catalyst were separated by filter paper followed by washing and drying in oven at 80 °C. These recycled nanoparticles were then subjected to a second round of degradation to monitor their catalytic ability. For this purpose, fresh drug solution was taken into flask and the recycled catalyst was added to it. The solution was then kept under solar radiation with constant magnetic stirring. UV-visible spectrum was taken in the start at zero time and once again after 65 and 80 minutes for piroxicam and naproxen respectively. The degradation efficiency was calculated in a similar way as described earlier using eqn (2). The above procedure was repeated up to 6 times. 11% decrease of percentage degradation was observed for piroxicam after 6 times recycling of CeO2 NPs (Fig. 9A). A 13% decrease in the degradation efficiency of naproxen was observed after the 6th cycle (Fig. 9B). The recyclability study of the catalyst established that the CeO2 NPs maintained 100% efficiency in the 2nd cycle.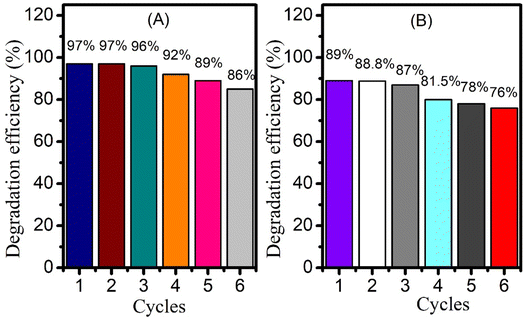 | ||
| Fig. 9 Bar graphs showing CeO2 reusability for the photocatalytic degradation of (A) piroxicam and (B) naproxen. | ||
In order to evaluate the effect of repeated catalysis cycles on the number of defects in CeO2 NPs, we performed UV-visible spectroscopy of NPs after 6th cycle of catalysis. The absorption spectra of the NPs before catalysis and after 6th cycle of catalysis is displayed in Fig. S3.† Urbach energy was calculated for NPs to analyse the increase of defects because of repeated catalysis (Fig. S4†). It was observed that Urbach energy remained almost the same before and after 6th cycle of catalysis for CeO2 NPs indicating that the photocatalysis has not introduced additional defects.58
4. Conclusions
Plant extract-mediated synthesis of CeO2 NPs was successfully accomplished, and the synthesized NPs were characterized by UV-visible spectroscopy, SEM, EDX, XRD, and FT-IR spectroscopy. The crystallite size of nanoparticles was found to be 13 nm as calculated by Scherer formula, and spherical shaped surface morphology was confirmed through SEM micrographs. Elemental composition of CeO2 NPs was analyzed by EDX. Capping of nanoparticles by phytochemicals and confirmation of chemical bonding between cerium and oxygen was studied via FTIR analysis. CeO2 NPs were applied for the photocatalytic degradation of two NSAIDs namely piroxicam and naproxen, monitored using electronic absorption spectroscopy. The synthesized NPs possessed excellent catalytic properties for photodegradation of drugs giving 97% and 89% degradation of piroxicam and naproxen respectively within a short time span. The high catalytic performance may be attributed to the smaller crystallite size of CeO2 manifesting its significance in the removal of pharmaceutical wastes from water samples. Moreover, the degradation data indicated that photocatalytic degradation reactions followed pseudo first order kinetics. The recyclability of the catalyst was also studied for up to six cycles where the degradation efficiency was maintained 100% till the 2nd cycle and was decreased by 11 and 13% for piroxicam and naproxen respectively after the 6th cycle.Conflicts of interest
There are no conflicts of interest to declare.Acknowledgements
The authors gratefully acknowledge the laboratory facilities provided by Quaid-i-Azam University, Islamabad Pakistan.References
- R. P. Schwarzenbach, T. Egli, T. B. Hofstetter, U. Von Gunten and B. Wehrli, Annu. Rev. Environ. Resour., 2010, 35, 109–136 CrossRef.
- F. Aslam, A. Shah, N. Ullah and S. Munir, ACS Appl. Nano Mater., 2023, 6, 6172–6185 CrossRef CAS.
- T. L. da Silva, C. S. D. Costa, M. G. C. da Silva and M. G. A. Vieira, J. Cleaner Prod., 2022, 346, 131226 CrossRef CAS.
- S. Susmitha, K. Vidyamol, P. Ranganayaki and R. Vijayaragavan, Global J. Pharmacol., 2013, 7, 316–320 CAS.
- A. Rastogi, M. K. Tiwari and M. M. Ghangrekar, J. Environ. Manage., 2021, 300, 113694 CrossRef CAS PubMed.
- Z. Frontistis, J. Photochem. Photobiol., A, 2019, 378, 17–23 CrossRef CAS.
- D. S. Bhatkhande, V. G. Pangarkar and A. A. C. M. Beenackers, J. Chem. Technol. Biotechnol., 2002, 77, 102–116 CrossRef CAS.
- J. Theron, J. A. Walker and T. E. Cloete, Crit. Rev. Microbiol., 2008, 34, 43–69 CrossRef CAS PubMed.
- S. Munir, D. D. Dionysiou, S. B. Khan, S. M. Shah, B. Adhikari and A. Shah, J. Photochem. Photobiol., B, 2015, 148, 209–222 CrossRef CAS PubMed.
- K. Hamidian, M. R. Saberian, A. Miri, F. Sharifi and M. Sarani, Ceram. Int., 2021, 47, 13895–13902 CrossRef CAS.
- S. Safat, F. Buazar, S. Albukhaty and S. Matroodi, Sci. Rep., 2021, 11, 14734 CrossRef CAS PubMed.
- J. K. Sharma, P. Srivastava, S. Ameen, M. S. Akhtar, S. Sengupta and G. Singh, Mater. Res., 2017, 91, 98–107 CAS.
- H. E. Ahmed, Y. Iqbal, M. H. Aziz, M. Atif, Z. Batool, A. Hanif, N. Yaqub, W. Farooq, S. Ahmad and A. Fatehmulla, Molecules, 2021, 26, 4659 CrossRef CAS PubMed.
- F. Ma, Q. Tang, S. Xi, G. Li, T. Chen, X. Ling, Y. Lyu, Y. Liu, X. Zhao, Y. Zhou and J. Wang, Chin. J. Catal., 2023, 48, 137–149 CrossRef CAS.
- G. Li, X. Zhao, Q. Yue, P. Fu, F. Ma, J. Wang and Y. Zhou, J. Energy Chem., 2023, 82, 40–46 CrossRef CAS.
- Y.-X. Li and W. Choi, Chem Catal., 2022, 2, 1517–1519 CrossRef CAS.
- S. Ying, Z. Guan, P. C. Ofoegbu, P. Clubb, C. Rico, F. He and J. Hong, Environ. Technol. Innovation, 2022, 26, 102336 CrossRef CAS.
- W. Yiling, G. K. Murakonda and R. Jarubula, Mater. Res. Express, 2021, 8, 075006 CrossRef.
- A. C. Paiva-Santos, A. M. Herdade, C. Guerra, D. Peixoto, M. Pereira-Silva, M. Zeinali, F. Mascarenhas-Melo, A. Paranhos and F. Veiga, Int. J. Pharm., 2021, 597, 120311 CrossRef CAS PubMed.
- M. A. Alzohairy, J. Evidence-Based Complementary Altern. Med., 2016, 2016, 7382506 Search PubMed.
- E. Ali, M. S. Islam, M. I. Hossen, M. M. Khatun and M. A. Islam, Vet. Med. Sci., 2021, 7, 1921–1927 CrossRef CAS.
- V. Makarov, A. Love, O. Sinitsyna, S. Makarova, I. Yaminsky, M. Taliansky and N. O. Kalinina, Acta Nat., 2014, 6, 35–44 CrossRef CAS.
- A. S. Thill, F. O. Lobato, M. O. Vaz, W. P. Fernandes, V. E. Carvalho, E. A. Soares, F. Poletto, S. R. Teixeira and F. Bernardi, Appl. Surf. Sci., 2020, 528, 146860 CrossRef CAS.
- N. N. Dao, M. D. Luu, Q. K. Nguyen and B. S. Kim, Adv. Nat. Sci.: Nanosci. Nanotechnol., 2011, 2, 045013 Search PubMed.
- O. L. Pop, A. Mesaros, D. C. Vodnar, R. Suharoschi, F. Tăbăran, L. Mageruşan, I. S. Tódor, Z. Diaconeasa, A. Balint and L. Ciontea, Nanomater, 2020, 10, 1614 CrossRef CAS.
- G. E. Putri, Y. Rilda, S. Syukri, A. Labanni and S. Arief, J. Mater. Res. Technol., 2021, 15, 2355–2364 CrossRef.
- H.-I. Chen and H.-Y. Chang, Ceram. Int., 2005, 31, 795–802 CrossRef CAS.
- M. Farahmandjou, M. Zarinkamar and T. P. Firoozabadi, Rev. Mex. Fis., 2016, 62, 496–499 CAS.
- P. V. Valsaraj and D. Divyarthana, AIP Conf. Proc., 2019, 2162, 020022 CrossRef.
- G. Jayakumar, A. A. Irudayaraj and A. D. Raj, Mech. Mater. Sci. Eng., 2017, 9, 1–6 Search PubMed.
- P. Latha, K. Prakash and S. Karuthapandian, Optik, 2018, 154, 242–250 CrossRef CAS.
- A. Miri and M. Sarani, Ceram. Int., 2018, 44, 12642–12647 CrossRef CAS.
- M. Dinari, F. Dadkhah, F. Azizollahi, G. Bateni and F. Bagherzadeh, Mater. Sci. Eng., B, 2022, 278, 115630 CrossRef CAS.
- I. Papagiannis, G. Koutsikou, Z. Frontistis, I. Konstantinou, G. Avgouropoulos, D. Mantzavinos and P. Lianos, Catalysts, 2018, 8, 455 CrossRef.
- Z. Frontistis, Int. J. Environ. Res. Public Health, 2018, 15, 2600 CrossRef CAS PubMed.
- L. Feng, E. A. Serna-Galvis, N. Oturan, S. Giannakis, R. A. Torres-Palma and M. A. Oturan, J. Environ. Chem. Eng., 2019, 7, 103400 CrossRef CAS.
- H. Bartsch, A. Eiper and H. Kopelent-Frank, J. Pharm. Biomed. Anal., 1999, 20, 531–541 CrossRef CAS PubMed.
- A. Uheida, A. Mohamed, M. Belaqziz and W. S. Nasser, Sep. Purif. Technol., 2019, 212, 110–118 CrossRef CAS.
- D. Štrbac, C. A. Aggelopoulos, G. Štrbac, M. Dimitropoulos, M. Novaković, T. Ivetić and S. N. Yannopoulos, Process Saf. Environ. Prot., 2018, 113, 174–183 CrossRef.
- G. Fan, R. Ning, J. Luo, J. Zhang, P. Hua, Y. Guo and Z. Li, J. Photochem. Photobiol., A, 2020, 386, 112108 CrossRef CAS.
- S. K. Ray, D. Dhakal and S. W. Lee, J. Chem. Eng., 2018, 347, 836–848 CrossRef CAS.
- A. Eslami, M. M. Amini, A. Asadi, A. A. Safari and N. Daglioglu, Inorg. Chem. Commun., 2020, 115, 107888 CrossRef CAS.
- K. Fu, Y. Pan, C. Ding, J. Shi and H. Deng, J. Photochem. Photobiol., A, 2021, 412, 113235 CrossRef CAS.
- N. Ahmadpour, M. H. Sayadi, S. Sobhani and M. Hajiani, J. Cleaner Prod., 2020, 268, 122023 CrossRef CAS.
- A. Romeiro, M. E. Azenha, M. Canle, V. H. Rodrigues, J. P. Da Silva and H. D. Burrows, ChemistrySelect, 2018, 3, 10915–10924 CrossRef CAS.
- S. Begum and M. Ahmaruzzaman, Appl. Surf. Sci., 2018, 449, 780–789 CrossRef CAS.
- H.-J. Bang, H. Lee, Y.-K. Park, H. Kim, H.-H. Ha, Y. H. Yu, S.-J. Kim and S.-C. Jung, J. Mater. Sci., 2020, 55, 9665–9675 CrossRef CAS.
- P. Kumari, R. K. Das and B. Pal, Mater. Chem. Phys., 2021, 260, 124173 CrossRef CAS.
- A. O. Oluwole and O. S. Olatunji, Chem. Eng. J. Adv., 2022, 12, 100417 CrossRef CAS.
- M. H. Zare and A. Mehrabani-Zeinabad, Sci. Rep., 2022, 12, 1–24 CrossRef PubMed.
- P. J. Mafa, M. E. Malefane, A. O. Idris, D. Liu, J. Gui, B. B. Mamba and A. T. Kuvarega, Sep. Purif. Technol., 2022, 282, 120089 CrossRef CAS.
- A. Marizcal-Barba, I. Limón-Rocha, A. Barrera, J. E. Casillas, O. A. González-Vargas, J. L. Rico, C. Martinez-Gómez and A. Pérez-Larios, Inorganics, 2022, 10, 67 CrossRef CAS.
- S. Z. Murtaza, R. Shomal, R. Sabouni and M. Ghommem, Environ. Technol. Innovation, 2022, 27, 102751 CrossRef CAS.
- T. Velempini, E. Prabakaran and K. Pillay, Mater. Today Chem., 2021, 19, 100380 CrossRef CAS.
- F. Quddus, A. Shah, F. J. Iftikhar, N. S. Shah and A. Haleem, Catalysts, 2023, 13, 511 CrossRef CAS.
- J. V. Pasikhani, N. Gilani and A. E. Pirbazari, Solid State Sci., 2018, 84, 57–74 CrossRef CAS.
- X. Chen, Z. Wu, D. Liu and Z. Gao, Nanoscale Res. Lett., 2017, 12, 1–10 CrossRef CAS PubMed.
- K. J. Archana, A. C. Preetha and K. Balasubramanian, Opt. Mater., 2022, 127, 112245 CrossRef.
Footnote |
| † Electronic supplementary information (ESI) available. See DOI: https://doi.org/10.1039/d3ra04185a |
| This journal is © The Royal Society of Chemistry 2023 |

