DOI:
10.1039/D3RA04175A
(Paper)
RSC Adv., 2023,
13, 27782-27791
Perovskite SrZrO3:Ho3+ phosphors: synthesis, structure, Judd–Ofelt analysis and photoluminescence properties
Received
21st June 2023
, Accepted 7th September 2023
First published on 19th September 2023
Abstract
A series of SrZrO3:xHo3+ (x = 0.01, 0.03, 0.05, 0.07, 0.09, and 0.11 mol) perovskite phosphors have been synthesized by using the sol–gel technique. The structural and optical characteristics of the prepared phosphors have been investigated through powder XRD, FT-IR, UV-visible diffuse reflectance, and photoluminescence analysis. The photoluminescence emission spectra showed a bright characteristic peak at 545 nm (5F4 + 5S2 → 5I8) under the 454 nm excitation, which exhibits emission in the green region of the electromagnetic spectrum. The emission intensity of the phosphors starts decreasing slowly beyond 3 mol% Ho3+ ions concentration due to concentration quenching, which is attributed to the dipole–dipole interaction between Ho3+ ions. The site symmetry of the Ho3+ ions has been studied by estimating the relative Judd–Ofelt intensity parameters (Ωλ, where λ = 2, 4, 6) from the photoluminescence excitation spectrum of the SrZrO3:0.03Ho3+ phosphor. The obtained findings suggest that the synthesized phosphors will be favorable for their bright green emission and thus, can be widely used for different optoelectronic applications.
1. Introduction
Perovskite materials with the general formula ABO3 (where A = Ca, Sr, Ba; and B = Zr, Hf, Ti) have great versatility and outstanding chemical, physical, electrical, and thermo-mechanical properties. These host lattices are getting special attention due to their potential applications as catalysts, photocatalysts, fuel cells, in photovoltaic applications, optoelectronics, and solid oxide fuel cells.1–3 Perovskite materials possess a fascinating feature in which a slight variation in structure and chemical composition may result in enormous changes in their chemical and physical properties.4–7 The doping of a foreign element into these ABO3 type inorganic oxides influences their optical and magnetic properties by creating various defects.8,9 Especially, lanthanide ions as dopants are suitable candidates since they exhibit unique spectroscopic properties.10–12 The coordination geometry and oxidation states of uranium ions in the SrZrO3 perovskite were studied by Gupta et al.,13 although Li et al.14 investigated the spectral characteristics and intrinsic defects of SrZrO3 perovskite. The earlier report published by Knight et al.15 reveals the structural and thermoelastic characteristics of SrZrO3 perovskite.
Perovskites have been reported to be advantageous in high-temperature applications, like hydrogen gas sensors, steam electrolysis, and fuel cells.16–18 Proton conductivity at elevated temperature enables its usage in typical electrochemical devices. Among different perovskite materials, the SrZrO3 host material has been suggested for use as a potential substrate due to its large single crystals.19 In recent years, the structural phase transitions of strontium zirconate perovskites have been studied significantly at room temperature and higher temperatures.20–22 Initially, the structural investigations revealed that the SrZrO3 possesses an orthorhombic phase at room temperature, and later Carlsson23 proposed the presence of additional phases at high temperatures. Mete et al.17 examined the structural and electronic characteristics of 4d-perovskite: the cubic phase of SrZrO3. The electronic and structural performances of selected surfaces of SrZrO3 were investigated by Sambrano et al.24 Singh et al.25 have also published research on the photoluminescence and structural properties of SrZrO3:Sm3+ orange-emitting perovskite phosphors.
Due to long-lived excited states and energy levels, the trivalent lanthanide ions doped luminescent materials (using Tm3+, Er3+, and Ho3+ ions) have been selected as the main subject of interest by several research groups.26–28 Holmium belongs to the lanthanides and its electronic configuration becomes [Xe]4f10 when doped into a crystalline host. Several spectroscopic studies revealed that Ho3+ is the most desirable ion for mid-infrared lasers and has excellent green emission properties other than Tb3+ (green emission only) ions among the rare earth ions due to its various electronic transitions. Ranjan et al.29 reported the enhanced green up-conversion emission of Ho3+ doped Gd2O3 phosphor by co-doping with Yb3+ ions. The luminescence studies of Eu3+ and Ho3+ doped Sr2TiO4 revealed that the Sr2TiO4 could be a suitable material in favor of high-pressure mercury vapor lamps or white light-emitting diodes.30
A literature survey confirms a lack of reports available on Ho3+ doped ABO3 type zirconate perovskites. The Ho3+ is often used as a structural probe because it can be accommodated at the A-place or B-place of perovskite oxides and in-site changes in the optical behavior and local site surrounding these doped oxide materials. Based on these results, our prepared sample possesses excellent thermal and chemical stability, prompting its practical application. Combining trivalent rare-earth metal ions in zirconate perovskites is considered as a promising approach to developing more useful and stable luminescent materials. Shi et al.31 prepared Yb3+, Ho3+, Li+ tri-doped TiO2 up-conversion materials to enhance the efficiency of perovskite solar cells. First, Hou et al.32 investigated the impacts of Ho3+ ion doping over the surface morphology, crystal phase, and magnetic characteristics of BiFeO3 thin films synthesized by the sol–gel technique. Sharif et al.33 investigated surface morphology, structural, magnetic, and dielectric properties in the BiFeO3 with holmium-doped thin films deposited by the pulsed laser deposition technique. Moreover, Hussain et al.34 presented resistive leakage and intrinsic polarization analyses for high-performance piezo/pyroelectric Ho-doped 0.64Pb(Mg1/3Nb2/3)O3-0.36PbTiO3 binary ceramic materials.
Besides the solid-state reaction process, a conventional synthetic route for preparing phosphor particles, several new synthetic methods have already been developed, for example, co-precipitation, sol–gel, solution combustion, microemulsion, spray pyrolysis, and hydrothermal synthesis. The present work uses the sol–gel method to prepare SrZrO3 phosphor. Sol–gel is a synthetic route to synthesize ceramic oxides, which provides reasonable control over stoichiometry, high purity, good homogeneity, and reduced sintering temperature. This method may also enable the production of low-temperature phases. A sol–gel method in a liquid includes a polycondensation reaction, which builds the oxide network of a molecular precursor. Although the process consists of several steps, doping concentration positively impacts the luminescence and crystal structural properties of the prepared phosphor. Wurm et al.35 prepared sol–gel SrZrO3 and SrTiO3 coatings on C and SiC-fibers. Venkatesh et al.36 prepared a novel strontium zirconate perovskite coating on an Inconel substrate using the sol–gel synthesis method. Liu et al.37 reported sol–gel derived SrZrO3 memory thin films with resistance switching properties. In this work, the Ho3+ doped SrZrO3 perovskite phosphors were synthesized by using sol–gel synthesis. The prepared phosphors were characterized structurally and optically. To know the spectral characteristics, the measured photoluminescence excitation spectra were used to calculate the Judd–Ofelt intensity parameters, Ω2, Ω4 & Ω6. Detailed photoluminescence properties are discussed herein.
2. Materials preparation and analysis
The SrZrO3:xHo3+ (x = 0.01, 0.03, 0.05, 0.07, 0.09, and 0.11 mol) perovskite phosphors were fabricated by sol–gel procedure. The quantity of the employed starting materials is reported in Table 1. As per the chemical formulae, the stoichiometric quantities of strontium nitrate (Sr(NO3)2) (Sigma-Aldrich, purity: 99%), zirconium nitrate oxide dihydrate (ZrO(NO3)2·2H2O) (Kanto chemical, purity: 99%), holmium(III) nitrate pentahydrate (Ho(NO3)3·5H2O) (Sigma-Aldrich, purity: 99.9%), citric acid (C6H8O7) (Junsei, purity: 99.5%) and, a mixture of 6 ml of ethanol and 4 ml of water combine in a 150 ml beaker. The molar ratio was kept at 2![[thin space (1/6-em)]](https://www.rsc.org/images/entities/char_2009.gif) :
:![[thin space (1/6-em)]](https://www.rsc.org/images/entities/char_2009.gif) 1 according to citric acid and total metal ions. Next, the mixture was stirred for 1 h to achieve a clear homogeneous solution; after that, put the resultant in the oven until the solution dried. A hot temperature furnace maintained at 400 °C preheated the acquired gels for 2 h in air. After preheating, the samples were granulated and fired for 4 h at 1050 °C in the ambient condition, giving the fine powder samples. Fig. 1 presents a pictorial view of the synthesis process.
1 according to citric acid and total metal ions. Next, the mixture was stirred for 1 h to achieve a clear homogeneous solution; after that, put the resultant in the oven until the solution dried. A hot temperature furnace maintained at 400 °C preheated the acquired gels for 2 h in air. After preheating, the samples were granulated and fired for 4 h at 1050 °C in the ambient condition, giving the fine powder samples. Fig. 1 presents a pictorial view of the synthesis process.
Table 1 Detailed information of sample composition and starting materials
| Sample compositions |
Weight of starting materials (g) |
| Sr(NO3)2 |
ZrO(NO3)2·2H2O |
C6H8O7 |
Ho(NO3)3·5H2O |
| SrZrO3:0.01Ho |
0.8464 |
1.0688 |
3.0738 |
0.0176 |
| SrZrO3:0.03Ho |
0.8464 |
1.0688 |
3.0738 |
0.0592 |
| SrZrO3:0.05Ho |
0.8464 |
1.0688 |
3.0738 |
0.0882 |
| SrZrO3:0.07Ho |
0.8464 |
1.0688 |
3.0738 |
0.1243 |
| SrZrO3:.0.09Ho |
0.8464 |
1.0688 |
3.0738 |
0.1578 |
| SrZrO3:0.11Ho |
0.8464 |
1.0688 |
3.0738 |
0.1940 |
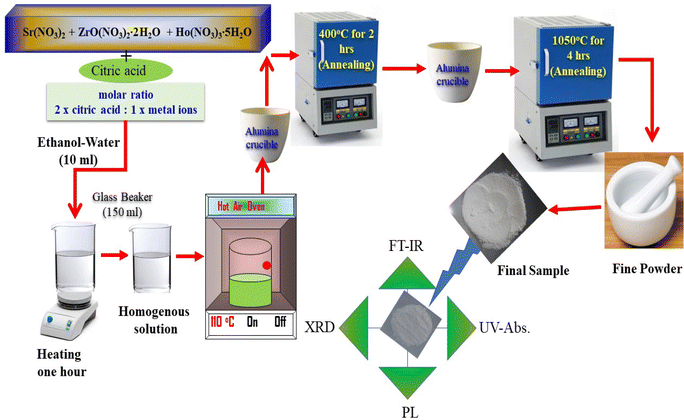 |
| | Fig. 1 Systematic diagram of synthesis process of the sample. | |
The X-ray diffraction patterns were monitored by a RIGAKU (Miniflex-II) diffractometer attached to an X-ray source (Cu-Kα radiation, λ = 1.5406 Å); the scan rate was set at 5° per minute between 10° −80° for 2θ angle. To identify the functional group present in the prepared samples, a Fourier transform infrared (6700, Thermo Fisher Nicolet) spectrometer was operated in a range of 400–4000 cm−1. A small quantity of prepared SrZrO3:Ho3+ phosphor powder is used to measure diffuse reflectance with A Cary-5000 (UV-VIS-NIR) spectrophotometer coupled to a Praying Mantis diffuse reflectance accessory. Photoluminescence (PL) spectra were analyzed by a Shimadzu (RF-5301PC) spectrofluorophotometer fitted with a Xenon-flash lamp. The emission and excitation spectra were recorded using a spectral slit width of 1.5 nm. The above characterizations were performed at room temperature.
3. Results and discussion
3.1 Crystal structure
The XRD measurement was conducted to study the structural phase and crystallinity of the prepared samples. Fig. 2 displays the XRD patterns of the SrZrO3:xHo3+ powders. For the synthesized phosphors, the major diffraction peaks matched with JCPDS (Joint Committee for Powder Diffraction Standards Card) File No. 76-0167 corresponding to SrZrO3. The effect of Ho3+ ions (at the studied concentrations i.e. 0.01, 0.03, 0.05, 0.07, 0.09, and 0.11 mol) on the structure of the SrZrO3 lattice seems to be negligible as XRD patterns remain the almost same at different doping concentrations. However, we believe the actual doping level can be clarified by Le Bail method to find the evolution trend of the cell lattice parameters. To calculate the crystalline size, the FWHM (full width at half maximum) of dominant (110) diffraction peaks are considered in leading Scherrer's equation, D = 0.9λ/β![[thin space (1/6-em)]](https://www.rsc.org/images/entities/char_2009.gif) cos
cos![[thin space (1/6-em)]](https://www.rsc.org/images/entities/char_2009.gif) θ, in which the wavelength of incident X-rays is denoted as λ, the corresponding Bragg's diffraction angle is θ, and the FWHM of the (110) peak is β. The determined crystal sizes were approximately within the range of 24–31 nm. Various oxides with the ABO3 chemical formula follow the perovskite structure. Fig. 3 showed the simplified crystal lattice of the SrZrO3 perovskite. The SrZrO3 has cubic symmetry with a Pm
θ, in which the wavelength of incident X-rays is denoted as λ, the corresponding Bragg's diffraction angle is θ, and the FWHM of the (110) peak is β. The determined crystal sizes were approximately within the range of 24–31 nm. Various oxides with the ABO3 chemical formula follow the perovskite structure. Fig. 3 showed the simplified crystal lattice of the SrZrO3 perovskite. The SrZrO3 has cubic symmetry with a Pm![[3 with combining macron]](https://www.rsc.org/images/entities/char_0033_0304.gif) m[221] space group. In the SrZrO3 perovskite structure, the Sr atoms are situated on the edges of the cubic unit cell, and the 12 closest neighbor O atoms surround the Sr atoms. Similarly, the Zr atom is situated in the centrum of the unit cell and is six-fold integrated with the O closed-neighbor atoms, making an octahedron. The cubic unit cell faces have O atoms, which are two-fold coordinated with Zr neighbor atoms. The Zr-ion and Sr-ion have the coordination numbers 6 and 8, respectively.1,11
m[221] space group. In the SrZrO3 perovskite structure, the Sr atoms are situated on the edges of the cubic unit cell, and the 12 closest neighbor O atoms surround the Sr atoms. Similarly, the Zr atom is situated in the centrum of the unit cell and is six-fold integrated with the O closed-neighbor atoms, making an octahedron. The cubic unit cell faces have O atoms, which are two-fold coordinated with Zr neighbor atoms. The Zr-ion and Sr-ion have the coordination numbers 6 and 8, respectively.1,11
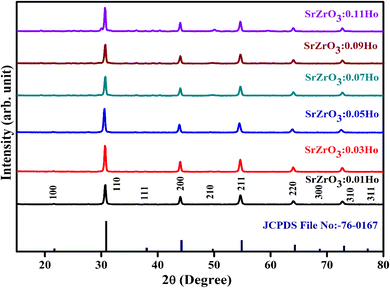 |
| | Fig. 2 Powder XRD patterns of SrZrO3:xHo3+ phosphors. | |
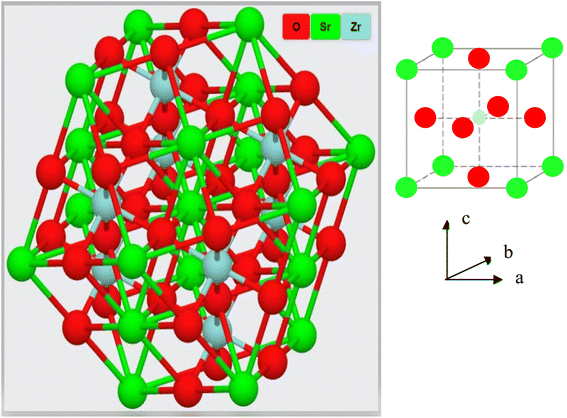 |
| | Fig. 3 Crystal structure of the SrZrO3 perovskite. | |
3.2 Vibrational analysis
Fig. 4 shows a typical vibrational feature of the SrZrO3:0.03Ho3+ powder sample. An intense absorption band at 558 cm−1 is attributed to the Zr–O stretching vibration. We have also observed a sharp peak at 857 cm−1. Katyayan and Agrawal8 studied SrZrO3:Eu3+, Tb3+ system and several peaks reported in the range of 509–895 cm−1 were due to the vibrational stretching modes of metal–oxygen bond, i.e., Zr–O bond. However, few peaks lie between 1000 and 1270 cm−1 due to the active modes of asymmetric stretching of impurity ions. Further, sharp peaks were reported within 1302–1588 cm−1 due to the symmetrical stretching of Sr–O bonds. We have also observed bands at 1018 and 1458 cm−1. The observed bands and their assignments can be confirmed with the previous literature.8,38–41
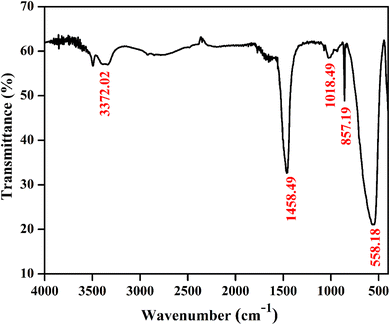 |
| | Fig. 4 FTIR spectrum of SrZrO3:0.03Ho3+ phosphor. | |
3.3 Diffuse reflectance spectra and optical band gap
The UV-diffuse reflectance spectra were recorded between the wavelength regions of 200–800 nm for the 3 mol% Ho3+ doped SrZrO3 phosphor. Fig. 5 shows the diffuse reflectance spectrum and extracted absorption coefficient with the Kubelka–Munk function. It can be seen that few bands around 365, 421, 454, 468, 489, 542, and 645 nm are related to the 4f–4f configuration of Ho3+ transitions: 5I8 → 5G5 + 3H6, 5I8 → 5G5, 5I8 → 5G6, 5I8 → 5F1, 5I8 → 5F2 + 3K8, and 5I8 → 5F3, respectively. The extracted optical-absorption coefficient (α cm−1) was calculated by the consecutive expression:42| |
 | (1) |
where R stands for sample reflectance. The Eg (optical band gaps) for the Ho3+ doped SrZrO3 phosphor can be estimated with the Tauc relation:43where A is a constant, F(R) is the absorption coefficient with photon energy (ℏω) and n represents the power factor: n = 1/2 allowed direct transitions, and n = 2 allowed an indirect transition. Fig. 6 shows plots of (F(R)ℏω)n as a function of ℏω (eV). After assuming (F(R)ℏω)2 = 0 and (F(R)ℏω)1/2 = 0 for the linear region within the plot, the energy band gaps of the direct allowed and indirectly allowed transitions were observed to be 5.21 eV and 5.43 eV, correspondingly for the SrZrO3:0.03Ho3+ phosphor.
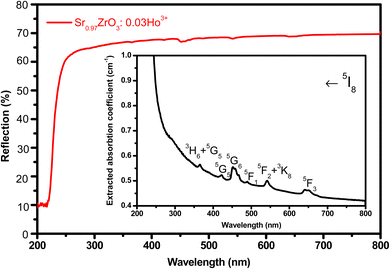 |
| | Fig. 5 UV-visible diffuse reflectance spectrum of SrZrO3:0.03Ho3+ phosphor. Inset of the figure shows extracted absorption spectrum. | |
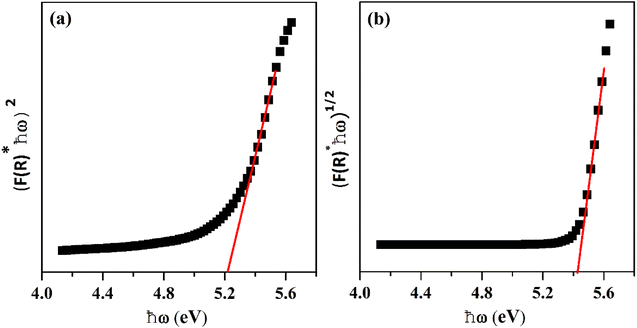 |
| | Fig. 6 Plots of (F(R)ℏω)n versus ℏω (eV): (a) direct allowed transition and (b) indirect allowed transition. | |
3.4 Photoluminescence analysis
Fig. 7(a) demonstrates the photoluminescence excitation (PLE) spectra for the produced Ho3+ doped SrZrO3 phosphors. The PLE spectra were acquired using the emission band at 545 nm. It can be read that the narrow bands owing to the 4f–4f transitions of Ho3+ ions and originated from 5I8 to 3K6 + 3F4 (334 nm), 3L9 + 5G3 (346 nm), 3H6 + 5G5 (361 nm), 3K7 + 5G4 (387 nm), 5G5 (418 nm), 5G6 (454 nm), 5F2 + 3K8 (472 nm) and 5F3 (486 nm). The highest PLE intensity was observed at 454 nm; this would be suitable as the excitation wavelength for all prepared phosphors. The PLE band intensity is saturated at 3 mol% of Ho3+ ions in the SrZrO3 phosphor. Usually, the doping of Ho3+ ions in place of Sr2+ ions will create positive charge defects that would negatively affect luminescence. Therefore, the expected emission intensity is maximum for 3 mol% of Ho3+ ions, and then the subsequent decrease of emission intensity is due to the HoSr+ defects.44
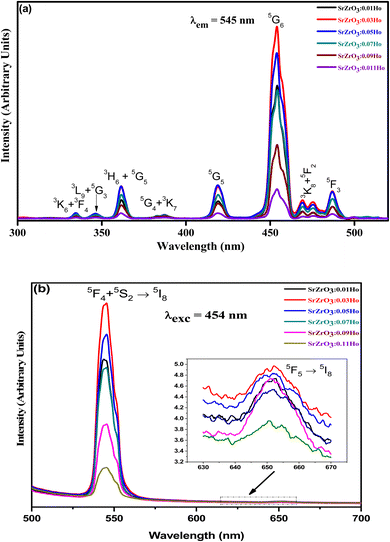 |
| | Fig. 7 (a) Photoluminescence excitation spectra of SrZrO3:xHo3+ phosphors (λem = 545 nm) and (b) photoluminescence emission spectra of SrZrO3:xHo3+ phosphors (λexc = 454 nm). | |
The emission spectra were monitored using 454 nm as the excitation wavelength for all phosphors and are presented in Fig. 7(b). Strong green and weak red emission bands have been seen around 545 nm and 652 nm. The obtained bands are possibly defined as transitions of Ho3+ ions for 5F4 + 5S2 → 5I8 and 5F5 → 5I8, respectively. The intensity of green emission at 545 nm is ∼35 times more substantial than the red emission at 652 nm. Upon excitation of 454 nm, the ions are excited from 5I8 to 5G4, then most of the excited ions decay the lower levels 5F4 + 5S2 and 5F5 levels non-radiatively, and subsequently, radiatively transit to 5I8 level with emission of green (5F4 + 5S2 → 5I8) and red (5F5 → 5I8), respectively. The energy gap difference for the 5F4 and 5F5 to the next lower levels are around 3400 cm−1 and 2400 cm−1, thus the observed difference of green and red emission intensities depends on the population of excited states and multiphonon relaxation rates (Wmpr) since the Wmpr is increasing with the decrease of the energy gap between excited state to the next lower state. Fig. 8 shows a schematic energy level diagram for Ho3+ ions with possible radiative and non-radiative relaxation processes.
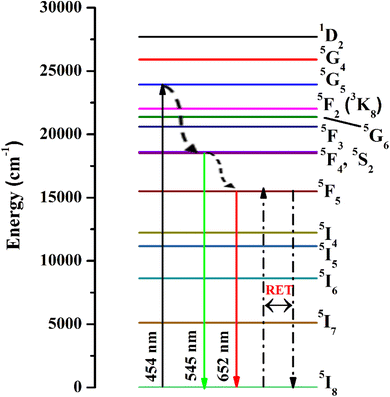 |
| | Fig. 8 Schematic energy level diagram for Ho3+ ions with possible radiative and non-radiative transitions. | |
As seen in Fig. 9, the highest emission intensity was noticed when the Ho3+ ions concentration was 3 mol%, and it was decreased according to the increasing concentration of Ho3+ ions in the SrZrO3 phosphor because of concentration quenching. Generally, it is recognized that the Ho–Ho distance reduces with an enhancement of Ho3+ ion concentration, leading to fluorescence quenching that comes from an increase in the resonant transfer probability between Ho3+ ions. The chances of energy transmission distance between Ho–Ho ions are termed the critical distance (Rc) obtained by the Blasse expression:45
| |
 | (3) |
where
V is the unit cell volume, critical ion concentration is
χc and
N is the number of Zr ions of a unit cell. For our Ho
3+ doped SrZrO
3 phosphor,
V = 552.175 (Å)
3,
46 N = 4, and
χc = 0.03. The calculated critical transfer distance (
Rc) is ∼20 Å, far greater than 5 Å that favors exchange interaction; thus, it can be established that the observed concentration quenching in Ho
3+ doped SrZrO
3 samples is attributed to the multipole–multipoleelectric interaction.
42 In addition, the interaction strength can also be calculated using the following equation:
47| |
 | (4) |
where
K and
β are constants,
I is emission intensity, and
x is activator ion concentration. The dipole–dipole (d–d), dipole–quadruple (d–q), quadruple–quadruple (q–q) interactions take place with
Q = 6, 8, and 10, respectively.
Fig. 10 shows the log(
I/x) based on log(
x) for the SrZrO
3:0.03Ho
3+ phosphor. It can be observed that −
Q/3 = - 2.24, so
Q = 6.72. Thus, the quenching in emission intensity of Ho
3+ doped SrZrO
3 host lattices is due to dipole–dipole interactions. The concentration quenching of Ho
3+ doped SrZrO
3 phosphor that occurred beyond the optimized concentration (3 mol%) is most useful for emitting green light in optoelectronic devices.
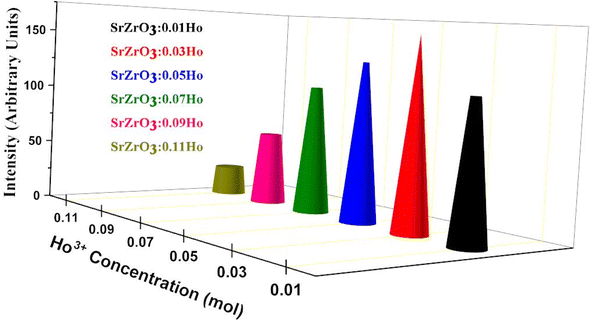 |
| | Fig. 9 Variation of emission intensity (I545 nm) as a function of Ho3+ ions in the SrZrO3:Ho3+ phosphor. | |
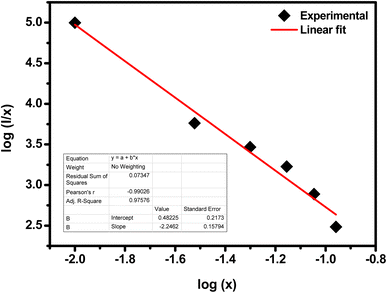 |
| | Fig. 10 Plot of log(I/x) as a function of log(x) of the SrZrO3:0.03Ho3+ phosphor (where I is the green emission peak intensity, and x is the Ho3+ ion concentration). | |
The CIE chromaticity coordinates were determined by the emission spectrum (λexc = 454 nm) of optimized Ho3+ (3 mol%) doped SrZrO3 phosphor using 1931 CIE (Commission International de l’Eclairage France) technology, which is an accepted standard for the LED industry in matters related to colors, such as color mixing and color rendering. The chromaticity coordinates were found to be (0.322, 0.671) and this is situated in the green region of the CIE chromaticity diagram (see Fig. 11). The correlated color temperature (CCT) was also estimated by the McCamy experimental equation:48
| | |
CCT = −437n3 + 3601n2 − 6861n + 5514.31
| (5) |
where

with chromaticity epicenter being
xe = 0.3320 and
ye = 0.1858. The obtained CCT is 5654 K for the Ho
3+ (3 mol%) doped SrZrO
3 phosphor. Thus, this could be useful for w-LEDs because a CCT < 5000 K gives warm-white LEDs for home gadgets.
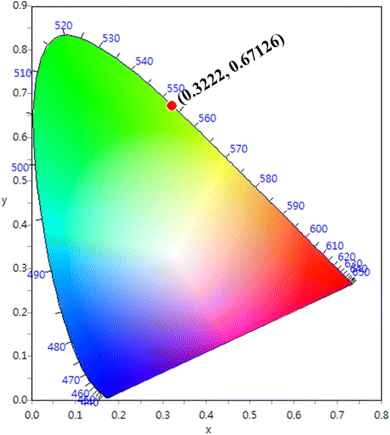 |
| | Fig. 11 CIE chromaticity diagram of SrZrO3:0.03Ho3+ phosphor. | |
3.5 Judd–Ofelt intensity parameters from PLE and radiative properties
The familiar Judd–Ofelt intensity parameters (Ωλ with λ = 2, 4, and 6) were adopted to figure out the fluorescence branching ratios, spontaneous emission probabilities, and radiative lifetimes of the excited multiplets to assess the undertaking of lasers and luminescent materials. As per Judd–Ofelt (J–O) theory,49,50 the J–O intensity parameters (Ωλ with λ = 2, 4, and 6) can be examined conventionally from absorption spectra by evaluating the measured and computed spectral line strengths of the excited 4f–4f electronic transitions using least-square or chi-square fit methods. However, in recent decades,42,51,52 a simple approach has been proposed to evaluate J–O intensity parameters from the assessment of excitation spectra. This approach is successfully applied to Nd3+, Er3+ and Dy3+ doped various phosphor powders.
Normally, the excitation and absorption spectral difference lies in the intensity ratio of the fluorescence excitation to the absorption (i.e., relative fluorescence quantum efficiency). Therefore, the excitation and absorption spectra will coincide exactly while relative fluorescence quantum efficiency maintains to be constant at different wavelengths. Once the experimental excitation spectrum is corrected to the corresponding absorption spectrum in which the excited states are followed by a very fast non-radiative relaxation to the monitored level.53,54 In this work, the excited multiplets of Ho3+: 5G5, 5F2(3K8), 5G6, 5F3 levels are nonradiatively relaxed to 5F4 + 5S2 monitored level may satisfy the above statement, and excited multiplets chosen as ideal ones for the determination Judd–Ofelt parameters. The calculated and measured relative excited line strength for the attended electric-dipole transitions across the aJ and bJ′ levels are determined using the following expressions,55,56
| |
 | (6) |
| |
 | (7) |
where
Ωλ is the J–O intensity parameter, which is used in the environmental field effect of intermixing states,
i.e., 4f
N−15d and 4f
N−15g.
U(
λ) is the doubly reduced matrix tensor operator and it is found in the coupling approximations approach, which is taken from the literature.
56 The term
n ∼2.12 is the refractive index of SrZrO
3 material.
57 The average wavelength of the excitation band is denoted as
![[small lambda, Greek, macron]](https://www.rsc.org/images/entities/i_char_e0cc.gif)
,
N0 is the ion concentration and
![[capital Lambda, Greek, macron]](https://www.rsc.org/images/entities/i_char_e0bb.gif)
is the integrated relative excitation intensity of each band.
Ωλ parameters were predicted by a least square fitting technique.
43 Table 2 shows relative spectral line strengths of excited transitions for Ho
3+ ions (3 mol%) in the SrZrO
3 phosphor.
55 The root average square deviation (
δrms) between experimental line strengths is,
| |
 | (8) |
where
q and
p are fitting parameters as transition number, and it has been used in our case as
q = 8 and
p = 3 in the best least square fitting procedure. The observed small
δrms value (see
Table 2) is indicative of the validity and fit quality in J–O theory.
Table 2 Doubly reduced matrix elements ‖U2‖λ (λ = 2, 4 and 6), relative line strengths (Sed) (×10−20 cm2) for the observed excitation/absorption bands of Ho3+ doped various host matrices
| Transitions from 5I8 → |
Excitation band wavenumber (ν cm−1) |
‖U2‖2 |
‖U2‖4 |
‖U2‖6 |
aSrZrO3:0.03Ho3+ |
YLiF55 |
GdLiF4 (ref. 55) |
LuLiF4 (ref. 55) |
| Sedmeas |
Sedcal |
Sedmeas |
Sedmeas |
Sedmeas |
| Present work. |
| 3K6 + 3F4 |
29![[thin space (1/6-em)]](https://www.rsc.org/images/entities/char_2009.gif) 922 922 |
0.0026 |
0.1263 |
0.0073 |
0.101 |
0.024 |
0.309 |
0.341 |
0.251 |
| 3L9 + 5G3 |
28![[thin space (1/6-em)]](https://www.rsc.org/images/entities/char_2009.gif) 902 902 |
0.0185 |
0.0052 |
0.1169 |
0.080 |
0.031 |
0.394 |
0.379 |
0.300 |
| 3H6 + 3H5 |
27![[thin space (1/6-em)]](https://www.rsc.org/images/entities/char_2009.gif) 685 685 |
0.254 |
0.2337 |
0.1609 |
0.059 |
0.173 |
1.310 |
4.377 |
1.276 |
| 5G4 + 3K7 |
25![[thin space (1/6-em)]](https://www.rsc.org/images/entities/char_2009.gif) 846 846 |
0.0058 |
0.0361 |
0.0697 |
0.012 |
0.021 |
0.325 |
0.345 |
0.307 |
| 5G5 |
23![[thin space (1/6-em)]](https://www.rsc.org/images/entities/char_2009.gif) 872 872 |
0 |
0.5338 |
0.0002 |
0.087 |
0.085 |
1.161 |
1.199 |
1.120 |
| 5G6 |
22![[thin space (1/6-em)]](https://www.rsc.org/images/entities/char_2009.gif) 020 020 |
1.5201 |
0.8410 |
0.1535 |
0.809 |
0.791 |
3.893 |
4.177 |
4.014 |
| 5F2 + 3K8 |
21![[thin space (1/6-em)]](https://www.rsc.org/images/entities/char_2009.gif) 186 186 |
0.0208 |
0.0334 |
0.3576 |
0.094 |
0.083 |
0.392 |
0.446 |
0.248 |
| 5F3 |
20![[thin space (1/6-em)]](https://www.rsc.org/images/entities/char_2009.gif) 542 542 |
0 |
0 |
0.3464 |
0.084 |
0.067 |
0.716 |
0.811 |
0.375 |
| δrms |
|
|
|
|
± 0.011 |
± 0.117 |
± 0.114 |
± 0.108 |
Table 3 describes the J–O intensity parameters considering various host matrices.58–62 The Ω2 parameter indicates ionicity (or covalence) of RE-O bonds and is related to the local structure. Ω4 and Ω6 are non-sensitive to the dependence structure and are attributed to the stiffness of the host; however, the various active ions alter the characteristics of the evaluated spontaneous emission transitions. For example, from Table 3, the Ho3+ doped SrZrO3 phosphor shows a lower ionic nature between Ho–O bonds compared with other oxide-based host matrices. On the other hand, when compared with a fluoride-based host, the Ho3+ doped SrZrO3 phosphor shows a higher ionic nature between the Ho–O bonds because of the lesser values of the J–O intensity parameter, Ω2.
Table 3 Relative Judd–Ofelt intensity parameters, (Ωλ ×10−20 cm2, λ = 2, 4 and 6) of various host matrices
| Host |
Ω2 |
Ω4 |
Ω6 |
Order |
| Present work. |
| aSrZrO3:0.03Ho3+ |
0.41 |
0.16 |
0.19 |
Ω6 > Ω4 > Ω2 |
| Y3Al5O15(YAG)58 |
0.04 |
2.67 |
1.89 |
Ω4 > Ω6 > Ω2 |
| Lu3Al5O12 (ref. 59) |
0.17 |
2.08 |
1.92 |
Ω4 > Ω6 > Ω2 |
| LaF3 (ref. 60) |
1.16 |
1.38 |
0.88 |
Ω2 > Ω4 > Ω6 |
| LiYF4 (ref. 61) |
1.01 |
1.71 |
1.21 |
Ω4 > Ω6 > Ω2 |
| LiYF4 (ref. 62) |
0.96 |
2.05 |
1.43 |
Ω4 > Ω6 > Ω2 |
4. Conclusions
The SrZrO3:Ho3+ phosphors were produced by a sol–gel system and were analyzed by X-ray diffraction, FTIR, UV-visible and photoluminescence spectroscopic techniques. We have identified absorption bands around 365, 421, 454, 468, 489, 542, and 645 nm from the UV-visible diffuse reflectance spectrum of the 4f-4f configuration of Ho3+ transitions. The optical band gaps (Eopt) were found to be 5.21 eV (direct transition), 5.43 eV (indirect transition), respectively for the Ho3+ doped SrZrO3 phosphor. Upon 454 nm excitation, the Ho3+ doped SrZrO3 phosphor exhibits high green and low red emission bands that are connected to the respective 5F4 + 5S2 → 5I8 (545 nm) and 5F5 → 5I8 (652 nm) transitions of Ho3+ ions. The fluorescence quenching of the studied phosphor samples was evaluated by looking at the critical distance between Ho–Ho ions as well as the strength of dipole–dipole (d–d), dipole–quadruple (d–q) and quadruple–quadruple (q–q) interactions. The obtained CCT was 5654 K for the optimum concentration of Ho3+ (3 mol%) doped in the SrZrO3 phosphor suggesting that it may be useful for w-LEDs. In addition, using excitation spectrum of the optimized phosphor, the Judd–Ofelt intensity parameters (Ωλ with λ = 2, 4 and 6) for Ho3+ were estimated and compared with other hosts. The observed results of photoluminescence properties suggested that the SrZrO3:0.03Ho3+ phosphor may be advantageous for green emitting optoelectronic applications.
Conflicts of interest
There are no conflicts to declare.
Acknowledgements
This work was supported by the National Research Foundation of Korea (NRF) grant funded by the Korea government (MSIT) (2018M2B2A9065656). This paper was also supported by the KU Research Professor Program of Konkuk University.
References
- S. K. Gupta, A. K. Yadav, D. Bhattachary, S. N. Jha and V. Natarajana, Visible light emitting Ln3+ ion (Ln=Sm, Eu and Dy) as a structural probe: A case study with SrZrO3, J. Lumin., 2015, 164, 1–22 CrossRef CAS.
- K. Nonaka, M. Akiyama, C.-N. Xu, T. Hagio, M. Komatsu and A. Takase, Enhanced photovoltaic response in lead lanthanum zirconate-titanate ceramics with A-Site deficient composition for photostrictor application, Jpn. J. Appl. Phys., 2000, 39, 9A CrossRef.
- E. Caetano, C. Souza and R. Muccillo, Properties and applications of perovskite proton conductors, Mater. Res., 2010, 13, 385–394 CrossRef.
- M. Kubicek, A. H. Bork and J. L. M. Rupp, Perovskite oxides - a review on a versatile material class for solar-to-fuel conversion processes, J. Mater. Chem. A, 2017, 5, 11983–12000 RSC.
- M. Sukumar, L. John Kennedy, J. Judith Vijaya, B. Al-Najar, M. Bououdina and G. Mudhana, Structural, optical, and magnetic properties of Ca2+ doped La2CuO4 perovskite nanoparticles, Vacuum, 2019, 167, 407–415 CrossRef CAS.
- M. A. Peña and J. L. G. Fierro, Chemical structures and performance of perovskite oxides, Chem. Rev., 2001, 101, 1981–2018 CrossRef PubMed.
- J. Etourneau, J. Portier and F. Ménil, The role of the inductive effect in solid state chemistry: how the chemist can use it to modify both the structural and the physical properties of the materials, J. Alloys Compd., 1992, 188, 1–7 CrossRef CAS.
- S. Katyayan and S. Agrawal, Study of optical behaviour of Eu3+ and Tb3+ doped zirconate perovskite phosphors prepared by molten salt technique, Opt. Quantum Electron., 2020, 52, 18 CrossRef CAS.
- N. R amadass, ABO3-type oxides-Their structure and properties-a bird's eye view, Mater. Sci. Eng., 1978, 36, 231–239 CrossRef CAS.
- G. Pan, X. Bai, D. Yang, X. Chen, P. Jing, S. Qu, L. Zhang, D. Zhou, J. Zhu, W. Xu, B. Dong and H. Song, Doping lanthanide into perovskite nanocrystals: highly improved and expanded optical properties, Nano Lett., 2017, 17, 8005–8011 CrossRef CAS PubMed.
- S. K. Gupta, P. S. Ghosh, A. K. Yadav, N. Pathak, A. Arya, S. N. Jha, D. Bhattacharyya and R. M. Kadam, Luminescence properties of SrZrO3/Tb3+ perovskite: host-dopant energy-transfer dynamics and local structure of Tb3+, Inorg. Chem., 2016, 554, 1728–1740 CrossRef PubMed.
- S. K. Gupta, N. Pathak and R. M. Kadam, an efficient gel-combustion synthesis of visible light emitting barium zirconate perovskite nanoceramics: probing the photoluminescence of Sm3+ and Eu3+ doped BaZrO3, J. Lumin., 2016, 169, 106–114 CrossRef CAS.
- S. K. Gupta, N. Pathak, R. Gupta, S. K. Thulasidas and V. Natarajan, Probing the oxidation state and coordination geometry of uranium ion in SrZrO3 perovskite, J. Mol. Struct., 2014, 1068, 204–209 CrossRef CAS.
- Z. Li, H. Duan, Y. Jin, S. Zhang, Y. Lv, Q. Xu and Y. Hu, Intrinsic defects and spectral characteristics of SrZrO3 perovskite, Phys. B, 2018, 534, 105–112 CrossRef CAS.
- K. S. Knight and C. L. Bullc, Low temperature and high pressure thermoelastic and crystallographic properties of SrZrO3 perovskite in the Pbnm phase, Solid State Sci., 2016, 62, 90–104 CrossRef CAS.
- A. Mai, V. A. C. Haanappel, S. Uhlenbruck, F. Tietz and D. Stöver, Ferrite-based perovskites as cathode materials for anode-supported solid oxide fuel cells: Part I. variation of composition, Solid State Ionics, 2005, 176, 1341–1350 CrossRef CAS.
- E. Mete, R. Shaltaf and Ş. Ellialtıoğlu, Electronic and structural properties of a 4d perovskite: Cubic phase of SrZrO3, Phys. Rev. B: Condens. Matter Mater. Phys., 2003, 68, 035119 CrossRef.
- L. Bi, S. Boulfrad and E. Traversa, Steam electrolysis by solid oxide electrolysis cells (SOECs) with proton-conducting oxides, Chem. Soc. Rev., 2014, 43, 8255–8270 RSC.
- D. Souptel, G. Behr and A. M. Balbashov, SrZrO3 single crystal growth by floating zone technique with radiation heating, J. Cryst. Growth, 2002, 236, 583–588 CrossRef CAS.
- C. J. Howard, K. S. Knight, B. J. Kennedy and E. H. Kisi, The structural phase transitions in strontium zirconate revisited, J. Phys.: Condens. Matter, 2000, 12, 45 CrossRef.
- R. E. A. McKnight, C. J. Howard and M. A. Carpenter, Elastic anomalies associated with transformation sequences in perovskites: I. Strontium zirconate, SrZrO3, J. Phys.: Condens. Matter, 2000, 12, L677–L683 CrossRef.
- S. Yamanaka, K. Kurosaki, T. Oyama, H. Muta, M. Uno, T. Matsuda and S. -I. Kobayashi, Thermophysical properties of perovskite-type strontium cerate and zirconate, J. Am. Ceram. Soc., 2005, 88, 1496–1499 CrossRef CAS.
- L. Carlsson, High-temperature phase transitions in SrZrO3, Acta Crystallogr., 1967, 23, 901–905 CrossRef CAS.
- J. R. Sambrano, V. M. Longo, E. Longo and C. A. Taft, Electronic and structural properties of the (001) SrZrO3 surface, J. Mol. Struct.: THEOCHEM, 2007, 813, 49–56 CrossRef CAS.
- N. Singh, M. Seshadri, M. S. Pathak and V. Singh, Structural and photoluminescence properties of orange emitting perovskites SrZrO3:Sm3+ phosphors for solid-state lighting, Solid State Sci., 2019, 87, 163–170 CrossRef CAS.
- R. Lisiecki, M. Głowacki, M. Berkowski and W. Ryba-Romanowski, Contribution of energy transfer processes to excitation and relaxation of Yb3+ ions in Gd+(Al,Ga)5O12:RE3+, Yb3+ (RE3+ = Tm3+, Er3+, Ho3+, Pr3+), J. Lumin., 2019, 211, 54–61 CrossRef CAS.
- T. V. Gavrilović, D. J. Jovanović, K. Smits and M. D. Dramićanin, Multicolor upconversion luminescence of GdVO4:Ln3+/Yb3+ (Ln3+ = Ho3+, Er3+, Tm3+, Ho3+/Er3+/Tm3+) nanorods, Dyes Pigm., 2016, 126, 1–7 CrossRef.
- H. Huang, H. Zhou, J. Zhou, T. Wang, D. Huang, Y. Wu, L. Sun, G. Zhou, J. Zhana and J. Hu, Enhanced anti-stocks luminescence in LaNbO4:Ln3+ (Ln3+ = Yb3+, Er3+/Ho3+/Tm3+) with abundant color, RSC Adv., 2017, 7, 16777–16786 RSC.
- S. K. Ranjan, A. K. Soni and V. K. Rai, Enhanced green upconversion emission in Ho3+:Gd2O3 phosphor by codoping of Yb3+ ions, Mater, Mater. Today: Proc., 2017, 4, 5593–5598 CrossRef.
- M. Zhongfei, H. Yihua and J. Guifang, Luminescence properties of Eu3+ and Ho3+ in Sr2TiO4, J. Rare Earths, 2012, 30, 744–747 CrossRef.
- W. Shi, Z. Zhang, J. Qin, Y. Zhang, Y. Liu, Y. Liu, H. Gao and Y. Mao, Interface modification by up-conversion material of Ho3+-Yb3+-Li+ tri-doped TiO2 to improve the performance of perovskite solar cells, J. Alloys Compd., 2018, 754, 124–130 CrossRef CAS.
- P. Hou, B. Liu, Z. Guo, P. Zhou, B. Wang and L. Zhao, Effect of Ho doping on the crystal structure, surface morphology and magnetic property of BiFeO3 thin films prepared via the sol-gel technology, J. Alloys Compd., 2019, 775, 59–62 CrossRef CAS.
- S. Sharif, G. Murtaza, T. Meydan, P. I. Williams, J. Cuenca, S. H. Hashimdeen and F. Shaheen, Structural, surface morphology, dielectric and magnetic properties of holmium doped BiFeO3 thin films prepared by pulsed laser deposition, Thin Solid Films, 2018, 662, 83–89 CrossRef CAS.
- A. Hussain and B. Kumar, Intrinsic polarization and resistive leakage analyses in high performance piezo-/pyroelectric Ho-doped 0.64PMN-0.36PT binary ceramic, Adv. Powder Technol., 2018, 29, 3124–3137 CrossRef CAS.
- R. Wurm, O. Dernovsek and P. Greil, sol-gel derived SrTiO3 and SrZrO3 coatings on SiC and C-fibers, J. Mater. Sci., 1999, 34, 4031–4037 CrossRef CAS.
- G. Venkatesh, B. Blessto, C. S. K. Rao, R. Subramanian and L. John Berchmans, Novel perovskite coating of strontium zirconate in Inconel substrate, Mater. Sci. Eng., 2018, 314, 012010 Search PubMed.
- C.-Y. Liu and T.-Y. Tseng, Resistance switching properties of sol-gel derived SrZrO3 based memory thin films, J. Phys. D: Appl. Phys., 2007, 40, 7 Search PubMed.
- A. Zhang, M. Lu, S. Wang, G. Zhou, S. Wang and Y. Zhou, Novel photoluminescence of SrZrO3 nanocrystals synthesized through a facile combustion method, J. Alloys Compd., 2007, 433, L7–L11 CrossRef CAS.
- C. Chen, W. Zhu, T. Yu, X. Chen, X. Yao and R. G. Krishnan, F. T.-I. R., structure and dielectric property investigation of strontium zirconate thin films prepared by MOD technique, Surf. Coat. Technol., 2003, 167, 245–248 CrossRef CAS.
- G. Cabello, L. Lillo, C. Caro, G. E. Buono-Core, B. Chornik, M. Flores, C. Carrasco and C. A. Rodriguez, Photochemical synthesis of AZrO3-X thin films (A=Ba, Ca and Sr) and their characterization, Ceram. Interfaces, 2014, 40, 7761–7768 CrossRef CAS.
- V. B. Reddy and P. N. Mehrotra, Infrared and thermal studies of strontium zirconyl oxalate hexahydrate, Thermochim. Acta, 1979, 31, 349 CrossRef CAS.
- C. Shivakumara, R. Saraf and P. Halappa, White luminescence in Dy3+ doped BiOCl phosphors and their Judd-Ofelt analysis, Dyes Pigm., 2016, 126, 154–164 CrossRef CAS.
- C. R. Kesavulu, H. J. Kim, S. W. Lee, J. Kaewkhao, N. Wantana, S. Kothan and S. Kaewjaeng, Optical spectroscopy and emission properties of Ho3+-doped gadolinium calcium silicoborate glasses for visible luminescent device applications, J. Non-Cryst. Solids, 2017, 474, 50–57 CrossRef CAS.
- L. Wang, B. K. Moon, S. H. Park, J. H. Kim, J. Shi, K. H. Kim and J. H. Jeong, Photoluminescence properties, crystal structure and electronic structure of a Sr2CaWO6:Sm3+ red phosphor, RSC Adv., 2015, 5, 89290–89298 RSC.
- G. Blasse, Energy transfer in oxidic phosphors, Phys. Lett. A, 1968, 28, 444–445 CrossRef CAS.
- S. Das, S. Som, C. Y. Yang, S. Chavhan and C. H. Lu, Structural evaluations and temperature dependent photoluminescence characterizations of Eu3+ activated SrZrO3 hollow spheres for luminescence thermometry applications, Sci. Rep., 2016, 6, 25787 CrossRef CAS PubMed.
- L. G. V. Uitert, Characterization of energy transfer interactions between rare earth ions, J. Electrochem. Soc., 1967, 114, 1048–1053 CrossRef.
- X. C. S. McCamy, Correlated color temperature as an explicit function of chromaticity coordinates, Color Res. Appl., 1992, 17, 142–144 CrossRef.
- B. R. Judd, Optical absorption intensities of rare-earth Ions, Phys. Rev., 1962, 127, 750 CrossRef CAS.
- G. S. Ofelt, Intensities of crystal spectra of rare-earth ions, J. Chem. Phys., 1962, 37, 511 CrossRef CAS.
- W. Luo, J. Liao, R. Li and X. Chen, Determination of Judd-Ofelt intensity parameters from the excitation spectra for rare-earth doped luminescent materials, Phys. Chem., 2010, 12, 3276 CAS.
- S. Dutta, S. Som and S. K. Sharma, Excitation spectra and luminescence decay analysis of K+ compensated Dy3+ doped CaMoO4 phosphors, RSC Adv., 2015, 5, 7380–7387 RSC.
- X. Y. Chen, M. P. Jensen and G. K. Liu, Analysis of energy level structure and excited-state dynamics in a Sm3+ complex with soft-donor ligands: Sm(Et2Dtc)3(bipy), J. Phys. Chem. B, 2005, 109, 13991 CrossRef CAS PubMed.
- X. Y. Chen, E. Ma and G. K. Liu, Energy levels and optical spectroscopy of Er3+ in Gd2O3 nanocrystals, J. Phys. Chem. C, 2007, 111, 10404 CrossRef CAS.
- B. M. Walsh, G. W. Grew and N. P. Barnes, Energy levels and intensity parameters of Ho3+ ions in GdLiF4, YLiF4 and LuLiF4, J. Phys.: Condens. Matter, 2005, 17, 7643–7665 CrossRef CAS.
- W. T. Carnall, H. Crosswhite and H. M. Crosswhite, Energy level structure and transition probabilities in the spectra of the trivalent lanthanides in LaF3, Argonne National Laboratory Report, 1977 Search PubMed.
- R. D. Shannon, R. C. Shannon, O. Medenbach and R. X. Fischer, Refractive index and dispersion of fluorides and oxides, J. Phys. Chem. Ref. Data, 2002, 31, 931–970 CrossRef CAS.
- M. Malinowski, Z. Frukacz, M. Szuflinskaa, A. Wnuk and M. Kaczkan, Optical transitions of Ho in YAG, J. Alloys Compd., 2000, 300–301, 389–394 CrossRef CAS.
- D. N. Patel, B. R. Reddy and S. K. Nash-Stevenson, Spectroscopic and two-photon upconversion studies of Ho3+-doped Lu3Al5O12, Opt. Mater., 1998, 10, 225–234 CrossRef CAS.
- M. J. Weber, B. H. Matsinger, V. L. Dolan and G. Surratt, Optical transition probabilities for trivalent holmium in LaF3 and YAlO3, J. Chem. Phys., 1972, 57, 562 CrossRef CAS.
- A. A. Kaminskii, Crystalline lasers: physical process and operating schemes, CRC, Florida, 1996 Search PubMed.
- C. Li, Y. Guyot, C. Linares, R. Moncorge and M. F. Joubert, Radiative transition probabilities of trivalent rare-earth ions in LiYF4, ASSL Proc, 1993, 15, 91 Search PubMed.
|
| This journal is © The Royal Society of Chemistry 2023 |
Click here to see how this site uses Cookies. View our privacy policy here.  Open Access Article
 *a and
M. Seshadrib
![[thin space (1/6-em)]](https://www.rsc.org/images/entities/char_2009.gif) :
:![[thin space (1/6-em)]](https://www.rsc.org/images/entities/char_2009.gif) 1 according to citric acid and total metal ions. Next, the mixture was stirred for 1 h to achieve a clear homogeneous solution; after that, put the resultant in the oven until the solution dried. A hot temperature furnace maintained at 400 °C preheated the acquired gels for 2 h in air. After preheating, the samples were granulated and fired for 4 h at 1050 °C in the ambient condition, giving the fine powder samples. Fig. 1 presents a pictorial view of the synthesis process.
1 according to citric acid and total metal ions. Next, the mixture was stirred for 1 h to achieve a clear homogeneous solution; after that, put the resultant in the oven until the solution dried. A hot temperature furnace maintained at 400 °C preheated the acquired gels for 2 h in air. After preheating, the samples were granulated and fired for 4 h at 1050 °C in the ambient condition, giving the fine powder samples. Fig. 1 presents a pictorial view of the synthesis process.
![[thin space (1/6-em)]](https://www.rsc.org/images/entities/char_2009.gif) cos
cos![[thin space (1/6-em)]](https://www.rsc.org/images/entities/char_2009.gif) θ, in which the wavelength of incident X-rays is denoted as λ, the corresponding Bragg's diffraction angle is θ, and the FWHM of the (110) peak is β. The determined crystal sizes were approximately within the range of 24–31 nm. Various oxides with the ABO3 chemical formula follow the perovskite structure. Fig. 3 showed the simplified crystal lattice of the SrZrO3 perovskite. The SrZrO3 has cubic symmetry with a Pm
θ, in which the wavelength of incident X-rays is denoted as λ, the corresponding Bragg's diffraction angle is θ, and the FWHM of the (110) peak is β. The determined crystal sizes were approximately within the range of 24–31 nm. Various oxides with the ABO3 chemical formula follow the perovskite structure. Fig. 3 showed the simplified crystal lattice of the SrZrO3 perovskite. The SrZrO3 has cubic symmetry with a Pm![[3 with combining macron]](https://www.rsc.org/images/entities/char_0033_0304.gif) m[221] space group. In the SrZrO3 perovskite structure, the Sr atoms are situated on the edges of the cubic unit cell, and the 12 closest neighbor O atoms surround the Sr atoms. Similarly, the Zr atom is situated in the centrum of the unit cell and is six-fold integrated with the O closed-neighbor atoms, making an octahedron. The cubic unit cell faces have O atoms, which are two-fold coordinated with Zr neighbor atoms. The Zr-ion and Sr-ion have the coordination numbers 6 and 8, respectively.1,11
m[221] space group. In the SrZrO3 perovskite structure, the Sr atoms are situated on the edges of the cubic unit cell, and the 12 closest neighbor O atoms surround the Sr atoms. Similarly, the Zr atom is situated in the centrum of the unit cell and is six-fold integrated with the O closed-neighbor atoms, making an octahedron. The cubic unit cell faces have O atoms, which are two-fold coordinated with Zr neighbor atoms. The Zr-ion and Sr-ion have the coordination numbers 6 and 8, respectively.1,11


 with chromaticity epicenter being xe = 0.3320 and ye = 0.1858. The obtained CCT is 5654 K for the Ho3+ (3 mol%) doped SrZrO3 phosphor. Thus, this could be useful for w-LEDs because a CCT < 5000 K gives warm-white LEDs for home gadgets.


![[small lambda, Greek, macron]](https://www.rsc.org/images/entities/i_char_e0cc.gif) , N0 is the ion concentration and
, N0 is the ion concentration and ![[capital Lambda, Greek, macron]](https://www.rsc.org/images/entities/i_char_e0bb.gif) is the integrated relative excitation intensity of each band. Ωλ parameters were predicted by a least square fitting technique.43 Table 2 shows relative spectral line strengths of excited transitions for Ho3+ ions (3 mol%) in the SrZrO3 phosphor.55 The root average square deviation (δrms) between experimental line strengths is,
is the integrated relative excitation intensity of each band. Ωλ parameters were predicted by a least square fitting technique.43 Table 2 shows relative spectral line strengths of excited transitions for Ho3+ ions (3 mol%) in the SrZrO3 phosphor.55 The root average square deviation (δrms) between experimental line strengths is,
![[thin space (1/6-em)]](https://www.rsc.org/images/entities/char_2009.gif) 922
922![[thin space (1/6-em)]](https://www.rsc.org/images/entities/char_2009.gif) 902
902![[thin space (1/6-em)]](https://www.rsc.org/images/entities/char_2009.gif) 685
685![[thin space (1/6-em)]](https://www.rsc.org/images/entities/char_2009.gif) 846
846![[thin space (1/6-em)]](https://www.rsc.org/images/entities/char_2009.gif) 872
872![[thin space (1/6-em)]](https://www.rsc.org/images/entities/char_2009.gif) 020
020![[thin space (1/6-em)]](https://www.rsc.org/images/entities/char_2009.gif) 186
186![[thin space (1/6-em)]](https://www.rsc.org/images/entities/char_2009.gif) 542
542


