
 Open Access Article
 This Open Access Article is licensed under a
 Creative Commons Attribution 3.0 Unported Licence
Efficient full solar spectrum-driven photocatalytic hydrogen production on low bandgap TiO2/conjugated polymer nanostructures†
Edith Mawunya Kutorglo *ab,
Michael Schwarzea,
Anh Dung Nguyena,
Simon Djoko Tameua,
Shahana Huseyinovaac,
Minoo Tasbihia,
Oliver Görked,
Matthias Primbse,
Miroslav Šoóšb and
Reinhard Schomäckera
*ab,
Michael Schwarzea,
Anh Dung Nguyena,
Simon Djoko Tameua,
Shahana Huseyinovaac,
Minoo Tasbihia,
Oliver Görked,
Matthias Primbse,
Miroslav Šoóšb and
Reinhard Schomäckera
aDepartment of Chemistry, Technische Universität Berlin, Straße des 17. Juni 124, TC8, Berlin 10623, Germany. E-mail: kutorgle@vscht.cz
bBioengineering and Advanced Materials Laboratory, Department of Chemical Engineering, University of Chemistry and Technology Prague, Prague 166 28, Czech Republic
cUniversity of Santiago de Compostela, Department of Chemistry, Avenida do Mestre Mateo 25, Santiago de Compostela 15706, Spain
dDepartment of Ceramic Materials, Faculty III: Process Sciences, Technische Universität Berlin, Berlin 10623, Germany
eThe Electrochemical Energy, Catalysis, and Materials Science Laboratory, Department of Chemistry, Chemical Engineering Division, Technische Universität Berlin, Berlin 10623, Germany
First published on 10th August 2023
Abstract
The development of photocatalysts that can utilize the entire solar spectrum is crucial to achieving efficient solar energy conversion. The utility of the benchmark photocatalyst, TiO2, is limited only to the UV region due to its large bandgap. Extending the light harvesting properties across the entire spectrum is paramount to enhancing solar photocatalytic performance. In this work, we developed low bandgap TiO2/conjugated polymer nanostructures which exhibit full spectrum activity for efficient H2 production. The highly mesoporous structure of the nanostructures together with the photosensitizing properties of the conjugated polymer enabled efficient solar light activity. The mesoporous TiO2 nanostructures calcined at 550 °C exhibited a defect-free anatase crystalline phase with traces of brookite and high surface area, resulting in the best performance in hydrogen production (5.34 mmol g−1 h−1) under sunlight simulation. This value is higher not only in comparison to other TiO2-based catalysts but also to other semiconductor materials reported in the literature. Thus, this work provides an effective strategy for the construction of full spectrum active nanostructured catalysts for enhanced solar photocatalytic hydrogen production.
1. Introduction
Solar energy-driven hydrogen (H2) production from water has been the focus of much current research.1,2 This is because sunlight, which is used to activate semiconductor photocatalysts, is a clean and inexhaustible natural resource and the photocatalytic process emits little to no greenhouse gases.3,4 Therefore, wide-scale adoption of solar light-driven photocatalytic H2 production will be a critical step towards attaining net zero emissions by 2050 (UN sustainable development goals). However, developing full spectrum responsive photocatalysts capable of efficiently utilizing the entire solar spectrum is still a problem for attaining this goal.TiO2 is an effective benchmark photocatalyst due to its non-toxicity, high stability and low cost.5,6 Despite its capability to catalyze H2 production, the overall efficiency is still far below the minimum requirement for practical applications7,8 due to some inherent weaknesses. Firstly, the charge transfer process in TiO2 is very slow leading to fast recombination of photoinduced electron–hole pairs.9,10 Secondly, TiO2 can only be activated under ultraviolet (UV) light irradiation (λ < 387 nm) due to its large band gap (∼3.2 eV). To tackle the charge transfer limitation, various sacrificial agents such as ethanol, methanol, and glycerol have been employed to capture the photogenerated holes.11 Similarly, metal co-catalysts such as Pd, Ni, Pt, or Cu nanoparticles have been used as electron sinks thereby facilitating efficient electron transfer across the catalyst and preventing electron–hole recombination.12,13 Regarding the limitation in light utilization, ultraviolet light constitutes only a small fraction (<5%) of the total solar energy, leading to a low solar-to-hydrogen (STH) conversion efficiency. The STH conversion efficiency describes how much solar energy is converted into chemical energy stored in hydrogen and is calculated using the formula:
 | (1) |
 | (2) |
 is the Gibbs free energy of formation of hydrogen (237 kJ mol−1).14 This means that if TiO2 with a band edge of <400 nm is used, the highest theoretical solar-to-hydrogen (STH) conversion efficiency is <2%.15 Therefore, there is still a tremendous interest in developing effective solar light-active photocatalysts to improve its photocatalytic performance for practical applications.
Various strategies have been explored to obtain visible light active TiO2 including doping, bandgap engineering, metal deposition, surface modifications, composites etc.16–18 For instance, several researchers9 have doped transition metals and non-metals into TiO2 structure to enhance the visible light photocatalytic activity. However, doped materials often suffer from thermal or crystal instability and dopant-induced charge recombination, which can decrease the activity.15,19 Non-metal doping shows comparably higher promise with nitrogen being the most commonly used dopant.20,21
Recently, one of the most studied approaches for enhancing photocatalytic performance is the formation of highly porous nanostructures. Various TiO2 nanostructures including nanocrystals,16 nanowires,22 nanoparticles,23 flower-like structures24 and hybrid nanoparticles25 have been developed, among which, nanostructured catalysts with pores in the nano-to meso range show great promise.12,26 This is because their large specific surface areas enhance rapid diffusion of reactants and products and expose more active sites for catalytic reactions thereby enhancing performance.27,28 Several researchers have also reported enhanced visible light utilization in highly porous nanostructures because the light bounces back and forth in the cavities allowing more time for absorption and the photoinduced carriers have a higher mobility inhibiting charge recombination.29,30 However, till date, harvesting solar light in the entire spectrum (UV to NIR) has still not been fully solved and the practical application of TiO2 under solar irradiation remains unrealized. Therefore, it is believed that preparing a highly mesoporous TiO2 (m-TiO2) catalyst that allows sunlight to diffuse faster through its pores and coupling this catalyst with a visible light-active conjugated polymer such as polypyrrole (PPy)31 will be a particularly promising way to enhance solar light response of the photocatalyst for H2 production. Conjugated polymers are promising for improving solar energy utilization because of their excellent light harvesting properties in the visible and NIR regions.32 Among the conjugated polymers, polypyrrole is the most investigated because of its strong light absorption, low oxidation potential, simple synthesis in aqueous media, good redox properties and low cost.33
Herein, we report the synthesis of mesoporous TiO2 and TiO2-PPy nanostructures by a combined sol–gel and colloidal approach using polyvinyl alcohol as polymeric stabilizer. The as-prepared nanostructures show very high surface areas of greater than 400 m2 g−1 with a highly mesoporous structure and a very high hydrogen production rate under solar light simulation. This high activity is attributed to a synergistic effect of efficient charge transfer in the highly mesoporous nanostructure and the improved light absorption. A combination of results from in situ XRD and H2 production measurements, N2 adsorption, XRD, XPS, SEM, and UV-vis enabled us to understand how the structural and morphological properties influence photocatalytic activity under simulated sunlight irradiation. The hydrogen production rate obtained under solar simulation is higher compared to previous studies reported in the literature.21,34,35 Contrary to other reports about improved H2 production performance upon defect introduction and surface area increase,2,36 our defect-free anatase mesoporous TiO2 with an average surface area performed better than the mesoporous TiO2 containing Ti3+ and other defects. Thus, this work also provides new viewpoints into the role of textural properties of nanostructures and the presence of defects in enhancing photocatalytic hydrogen production.
2. Experimental
2.1 Materials
All chemicals were of analytical reagent grade and used without further purification. Hexachloroplatinic(IV) acid hydrate (H2PtCl6·H2O, 8 wt% in H2O) was used as Pt precursor. As sacrificial agents for hydrogen production, ethanol (99%, SupraSolv), ascorbic acid (AA, >98%, Sigma Aldrich, Hamburg, Germany), methanol (99.8% purity, VWR chemicals), glycerol, triethanolamine (TEAO, 98% purity, Sigma Aldrich) were used. Titanium tetraisopropoxide (TTIP), poly(vinyl alcohol) PVA (MW 146000–186000 g mol−1), pyrrole (Py, 98% purity, Sigma-Aldrich), iron(III) chloride (FeCl3, 97–98% purity, Sigma-Aldrich) and sodium dodecyl sulfate (SDS) were used to synthesize the composites. Platinum ICP standard (Sigma-Aldrich, Hamburg, Germany, 1000 mg L−1) was used for calibration of the ICP-OES instrument (Varian ICP-OES 715 ES, radial configuration).2.2 Preparation of m-TiO2 and m-TiO2/PPy nanostructures
Mesoporous TiO2 nanostructures were synthesized by a combined sol–gel and colloidal method using PVA or SDS as stabilizers. In a typical preparation, PVA (100 mg) was dissolved in 20 mL of distilled water at 85 °C. After cooling, the PVA solution was transferred into a 100 mL volumetric flask and the volume was made up to the mark with distilled water. The stabilizer solution was then transferred into a three-neck flask equipped with a condenser and thermometer and heated up to 85 °C. Then 10 mL of TTIP was added under stirring and the pH of the reaction mixture was adjusted to 9 by adding NH4OH solution (200 μL). To prepare the TiO2-PPy nanostructures, 20 μL of pyrrole monomer was added simultaneously with TTIP to the surfactant solution as in the case of pure m-TiO2 preparation. The reaction was left to run for a total of 1 hour resulting in a gelatinous solution. After cooling, the solution was centrifuged and the particles were washed with distilled water several times until the supernatant was clear and the solid was dried at 60 °C for about 12 h. After calcination in air at different temperatures from 200 to 600 °C, the highly crystalline mesoporous TiO2 nanostructures were obtained. For the calcination treatments, the temperature was increased by 5 °C min−1 from room temperature to the desired temperature and held there for 3 hours.2.3 Deposition of Pt NPs co-catalysts onto the m-TiO2 nanostructures
For the deposition of platinum nanoparticles (Pt NPs) on m-TiO2 nanostructures, two methods were employed: in situ and ex situ deposition. In situ photodeposition method: the Pt salt precursor H2PtCl6·H2O (60 μL) was added to the reaction mixture containing 120 mL of 10% ethanol solution and 60 mg of m-TiO2 nanostructures. The suspension was irradiated for 3 hours using a sunlight simulator (L.O.T. Oriel Quantum Design, Germany) equipped with AM 1.5 filter. After the irradiation step, the dark product was separated by centrifugation, washed 3 times with distilled water, and dried at 60 °C overnight. Ex situ reductive deposition method: for comparison, Pt NPs were deposited on m-TiO2 nanostructures by the Pt seeded growth method according to a previously published procedure37 with slight modifications. The mesoporous TiO2 particles were suspended in deionized water containing ascorbic acid and PVA. The mixture was kept under stirring for 10 minutes at 90 °C followed by the addition of the Pt precursor solution. After 10 minutes, a change in colour was observed from cloudy to black, confirming the deposition of Pt onto the TiO2 nanostructures. The mesoporous TiO2 with Pt NPs deposited were labelled as m-TiO2/Pt NPs. The reaction was left to run for another 30 minutes at 90 °C. After the reaction was completed, the resulting particles were washed with distilled water several times by centrifugation and dried at 60 °C overnight.2.4 Materials characterization
The morphology of the photocatalysts was characterized by scanning electron microscopy (SEM). The images were obtained using a JEOL microscope FEG-SEM JSM 6330F operated at 5 kV. Prior to the analysis, the samples were prepared by drop-casting an aqueous suspension of the nanostructures on a Si wafer, followed by drying under ambient conditions. The size distribution profile was determined by individually measuring the size of 200 particles from SEM images. Transmission electron microscopy (HRTEM) images were obtained using a Tecnai FEI G20 instrument operated at 200 kV. Samples were prepared by drop-casting an alcoholic suspension of each particle in a carbon-coated copper grid followed by drying under ambient conditions. The X-ray photoelectron spectroscopy (XPS) analyses were performed using omicron nanotechnology using a monochromatic radiation Al Kα source (E = 1486.7 eV) working at 12 kV, Epass = 40 eV, with a 0.2 eV energy step in constant analyzer energy (CAE) mode. The BET surface area (SBET) of the photocatalysts was analyzed using nitrogen adsorption–desorption isotherms with a Micromeritics TriStar 3000 instrument and the data were collected at liquid nitrogen temperature, 77 K. Prior to each measurement, the samples were degassed at 150 °C for at least 2 hours. The specific surface areas were determined using the multipoint BET method using adsorption data in the relative pressure range P/P0 of 0.1–0.3. The total pore volume and average pore size were calculated using the Barrett–Joyner–Halenda (BJH) method38 at the relative pressure of 0.996. Powder X-ray diffraction (XRD) patterns of the samples were recorded on an advanced diffractometer (Bruker AXS D8) equipped with a position-sensitive detector (PSD) and a curved germanium (111) primary monochromator. The radiation used was Cu Ka (λ¼ 1.5418 Å) and the diffraction patterns were acquired in the range 2θ = 10–80° with a 1° min−1 scanning speed. Pt atomic percentages were measured by inductively coupled plasma optical emission spectrometry (ICP-OES) using a Varian ICP-OES 715 ES (radial configuration). The samples were prepared by digesting them in aqua regia under stirring for 24 hours at room temperature. After digestion, samples were diluted with distilled water. The optical absorption spectra of the solid samples were measured at room temperature using a Varian Cary 300 UV vis spectrophotometer.2.5 Photocatalytic activity tests (H2 production)
The photocatalytic performance of the m-TiO2 and m-TiO2-PPy nanostructures was examined by the solar-driven H2 production conducted in a 250 mL glass photoreactor with a top irradiation window fitted with quartz glass (Fig. S1A in ESI†). The setup was operated at room temperature (approximately 25 °C). Ethanol was used as a renewable sacrificial agent with Pt NPs as co-catalyst for the tests and all experiments were run under simulated solar light conditions. For a typical test, 20 mg of the photocatalyst was placed into the reactor followed by the addition of 40 mL aqueous solution containing 10 vol% of the sacrificial agent. The reactor was closed with a septum fitted cap, connected to a Schlenk line, and purged with argon for 15–20 minutes to replace the air in the headspace with argon. The reaction mixture was irradiated with a solar simulator equipped with an AM 1.5 filter (from L.O.T. Oriel Quantum Design, Germany) under constant stirring for 6 h. The H2 produced at the end of the reaction was determined by gas chromatography. For this analysis, 8 mL of gas sample was collected from the headspace using a syringe that has been purged/cleaned with argon. Two samples of 4 mL each were manually injected into a gas chromatograph (GC Agilent 7890 A) equipped with a thermal conductivity detector (TCD). The amount of H2 produced in mmol was calculated as follows:where the Vm (H2) is the molar volume of hydrogen = 24.5 L mol−1 (at 25 °C) and VHeadspace is the headspace volume = 210 mL.

The solar to hydrogen conversion efficiency was evaluated by  as detailed in the introduction (eqn (2)).
3. Results and discussion
3.1 Preparation and structure control of nanostructured catalysts
The mesoporous TiO2 and TiO2-PPy nanostructures denoted as m-TiO2 and m-TiO2-PPy, respectively, were developed by a combined sol–gel and colloidal method to achieve high photocatalytic activity in the entire solar spectrum. The dried m-TiO2 nanostructures appeared white after drying (Fig. 1a), whereas an orange-coloured powder was obtained for the m-TiO2-PPy nanostructured catalysts (Fig. 1b). The appearance of both m-TiO2 and m-TiO2-PPy nanostructures remained unchanged after calcination in air (Fig. 1c and d), whereas an obvious colour change from white or orange to black was observed when the powders were calcined under N2 atmosphere (Fig. 1e and f). This colour change from white or orange to black is associated with the changes in the lattice structure of TiO2 as discussed subsequently. Many researchers have reported on the preparation of defective TiO2 (Ti3+ sites) which is usually accompanied by a color change from white to black, blue or yellow, among others.39,40 | ||
| Fig. 1 Photos of (a) as prepared m-TiO2, (b) as prepared m-TiO2/PPy, (c) m-TiO2 and (d) m-TiO2/PPy calcined in air, (e) m-TiO2 and (f) m-TiO2/PPy calcined in nitrogen. | ||
Electron microscopy images SEM (Fig. 2a) and high-resolution TEM (Fig. 2c) confirmed the highly mesoporous structure of the m-TiO2 nanostructures with large surface areas. After incorporation of polypyrrole, the nanostructures were still mesoporous but with a slight increase in the grain sizes as observed in the TEM image (Fig. 2d).
 | ||
| Fig. 2 SEM images of (a) m-TiO2 (b) m-TiO2/PPy nanostructures and the corresponding TEM images of (c) m-TiO2 (d) m-TiO2/PPy nanostructures. | ||
Fig. 3a and b show N2 adsorption data of the m-TiO2 nanostructures, showing an average pore diameter of 1.7 nm in the BJH pore size distribution, suggesting the mesoporous nature of the material. These results match well with the SEM and TEM results. The increase in average pore size from 1.7 nm to 7.6 nm after incorporation of PPy can further be seen in Fig. 2d. The increase in average pore size of the m-TiO2-PPy can be attributed to the deposition of a layer of PPy around the TiO2 structures which also corresponded with a decrease in surface area from 411 m2 g−1 to 363 m2 g−1. Investigation of the influence of varying stabilizer amounts (1–5 wt%) on the porous properties of m-TiO2 nanostructures revealed that a PVA concentration of 1 wt% was adequate to obtain the highest surface area and a further increase in the stabilizer amount led to a decrease in the surface areas (Fig. S2a in ESI†). Interestingly, when either PVA or SDS was used as a stabilizer in the synthesis of m-TiO2, similar BET surface areas and crystal properties were obtained (Fig. S2b†). The hydrolysis temperature also played a key role in the thermal stability and crystalline properties of the resulting m-TiO2 during the calcination step. When the hydrolysis step was performed at 85 °C, the resulting m-TiO2 showed higher stability to sintering during the calcination process compared to the one synthesized at room temperature (Fig. S3a in ESI†). In addition, the m-TiO2 obtained by hydrolysis at room temperature ∼25 °C was amorphous (Fig. S3b,† blue line), whereas the preparation performed at 85 °C yielded the crystalline form of m-TiO2. Typically, TiO2 materials prepared by traditional sol–gel approach yield amorphous products, which require additional calcination steps to achieve high activity.28 Thus, the high crystallinity of the as-prepared m-TiO2 (85 °C) without any calcination treatment can be advantageous for sustainably produced catalysts with no high energy input for calcination and no release of poisonous gases. Therefore, 1 wt% stabilizer (PVA) concentration and hydrolysis temperature of 85 °C was used for all the subsequent experiments.
 | ||
| Fig. 3 N2 sorption isotherms and corresponding pore size distribution curve of m-TiO2 (a and b) and m-TiO2/PPy nanostructures (c and d). | ||
To understand the source of the efficient solar light utilization of the m-TiO2 and m-TiO2-PPy nanostructures, especially in the visible region and NIR regions, absorption spectra were measured on solid materials (Fig. 4). Commercial TiO2 P25 shows strong absorption in the UV region absorbing mainly below 350 nm (red curve in Fig. 4a). The spectrum of the m-TiO2 nanostructures synthesized in this study showed an absorbance shift to higher wavelengths around 400 nm (orange curves). After calcination of this material, the colour changed to off-white and the absorbance increased in the entire region (blue curve). This implies that the m-TiO2 nanostructures can absorb more light in the entire light spectrum when compared to commercial TiO2. Upon the introduction of PPy to form the nanostructure with m-TiO2, a remarkable increase in absorption is observed in the visible and NIR region (purple curve) in comparison to pure TiO2. This enhancement in the light absorption is also consistent with the colour change from white (m-TiO2) to orange (m-TiO2-PPy) in Fig. 1. After calcination of m-TiO2-PPy, the absorption range was mainly between 400 and 800 nm, still confirming good visible light absorption properties. The enhanced absorption can be attributed to the synergistic absorption from the presence of the conjugated polymer PPy32 and the highly mesoporous structure of the nanostructures offering more light exposure, which agrees with previous reports.41,42 Highly porous structures have also been previously reported to not only enhance efficient diffusion of reactants but also improve visible light absorption.29,43
 | ||
| Fig. 4 (a) UV-vis spectra of m-TiO2 and m-TiO2/PPy (in solution) showing enhancement in light absorption in the entire spectrum of light (b) UV-DRS measurements with evaluated bandgap values (c) UV-vis spectra on solid samples and (d) comparison of bandgap of m-TiO2 calcines with and without Pt. | ||
To further confirm the lowering of bandgap and improvement in the light absorption of the materials after the incorporation of PPy, UV-DRS measurements have been conducted and the bandgaps of the materials was estimated (Fig. 4b–d). It was observed that incorporation of PPy resulted in a significant lowering of the bandgap energy of the composites from 3.2 to 2.7 eV. The mesoporous TiO2 materials also saw a decrease in bandgap energy from 3.19 to 3.02 eV, further confirming their improved photocatalytic performance.
3.2 Photocatalytic hydrogen production tests
As observed from the light absorption spectra, the m-TiO2 and m-TiO2-PPy nanostructures predict enhanced photocatalytic activity in the vis and NIR range. Thus, the photocatalytic activity was evaluated for the production of H2 under a sunlight simulator using Pt NPs as co-catalyst and ethanol (10%) as the sacrificial agent in a homemade glass photoreactor (Fig. S1A, ESI†). As seen in a typical gas chromatograph of a sample stream (Fig. S1B, ESI†), high amount of H2 was detected after just 3 hours of irradiation. Because of the penetration of small amounts of air into the gas syringe used for the sampling, oxygen and nitrogen peaks were observed at low intensity. A steady linear hydrogen production rate was observed for up to 12 hours without any decline (Fig. 5). By performing control experiments with the nanostructured catalysts in the dark without irradiation (Fig. S1B,† black line), no hydrogen was detected. Similarly, irradiation of the reaction in the absence of catalyst yielded no H2 confirming that the H2 produced comes from the photocatalytic reaction and the m-TiO2 and m-TiO2-PPy nanostructures show full solar spectrum photocatalytic activity. | ||
| Fig. 5 Kinetic studies of hydrogen production on m-TiO2 nanostructures over 12 hours using Pt NPs as co-catalyst. | ||
The as-prepared m-TiO2 nanostructures showed a very good hydrogen evolution rate of 1.36 mmol g−1 h−1. The hybrid m-TiO2-PPy nanostructures exhibited a slightly higher H2 production rate of 1.58 mmol g−1 h−1, which could be due to the enhanced light absorption from the as-prepared PPy hybrid nanostructures, considering that only 0.2 wt% of PPy was incorporated. After the calcination process, the H2 evolution activity of the m-TiO2-PPy nanostructures increased slightly from 1.58 to 1.95 mmol g−1 h−1 compared to that of the m-TiO2, whose activity increased about 4 times after calcination in air (1.36 to 5.34 mmol g−1 h−1). The slower increase in photocatalytic activity of the m-TiO2-PPy after the calcination could be due to the inherent instability of conjugated polymers under the calcination conditions (550 °C, air), which is in line with previous reports.32,44 Overall, the m-TiO2 calcined at 550 °C for 3 hours in air exhibited the highest photocatalytic H2 production rate of 5.34 mmol g−1 h−1 under sunlight simulated conditions using ethanol as a sacrificial agent and Pt NPs as co-catalyst. This value is very high compared to other TiO2-based materials reported so far for solar-driven H2 production.7,17,45
3.3 Structure–property relationships
To better understand the factors influencing the activity of the materials, we investigated how the nanostructure properties affect the hydrogen production rate. Fig. 6 shows the comparative photocatalytic hydrogen production using nanostructures of different textural properties to understand the influence of the surface area and pore volume on H2 production. Detailed description of the process for tuning of material properties for a series of m-TiO2 and m-TiO2-PPy samples and subsequent H2 production analysis has been given in the Text S1 in ESI.† | ||
| Fig. 6 Relationship between (a) BET surface area and hydrogen production, (b) pore volume and hydrogen production, (c) calcination temperature and surface area, and (d) surface-specific activity vs. calcination temperature (PPy = 0.2 wt%). | ||
No strong correlation was observed between high specific surface areas in m2 g−1 calculated based on the amount of catalyst used (Fig. 6a), but the hydrogen production increased with increasing pore volumes (Fig. 6b). This could be due to enhanced mass transfer at higher pore volumes. Although calcination treatment of catalysts has been reported to result in crystallization, which further leads to enhanced photocatalytic activity, calcination is also known to induce sintering and aggregation of the catalyst particles which can compromise the photocatalytic activity.46 Evaluation of the effect of temperature on the surface area revealed a linear decrease in surface areas with calcination temperature (Fig. 6c). Nevertheless, the surface-specific activity in μmol m−2 h−1 increased with increasing calcination temperature with the maximum activity at 550 °C for both m-TiO2 and m-TiO2-PPy nanostructures (Fig. 6d). Comparison of the H2 evolution rate for m-TiO2/Pt NPs and m-TiO2-PPy/Pt NPs with similar pore volume revealed that m-TiO2 shows better performance. However, the TiO2-PPy has better absorption for the whole solar spectrum. This observation points to the fact that neither the pore volume nor light absorption properties alone control the photocatalytic performance. The crystalline properties also play a crucial role as seen in Fig. 7c and d that the crystalline properties (anatase content and crystallite size) of the m-TiO2-PPy are lower compared to that of the pure m-TiO2. Overall, these results suggest that having either a high specific surface area or pore volume is not the most critical requirement for enhancing the catalytic activity. Rather, other factors contribute to the hydrogen production such as a more appropriate phase structure and thus, a balance between the porous properties (pore volume), light absorption, and optimal crystallite sizes is required for optimal performance.
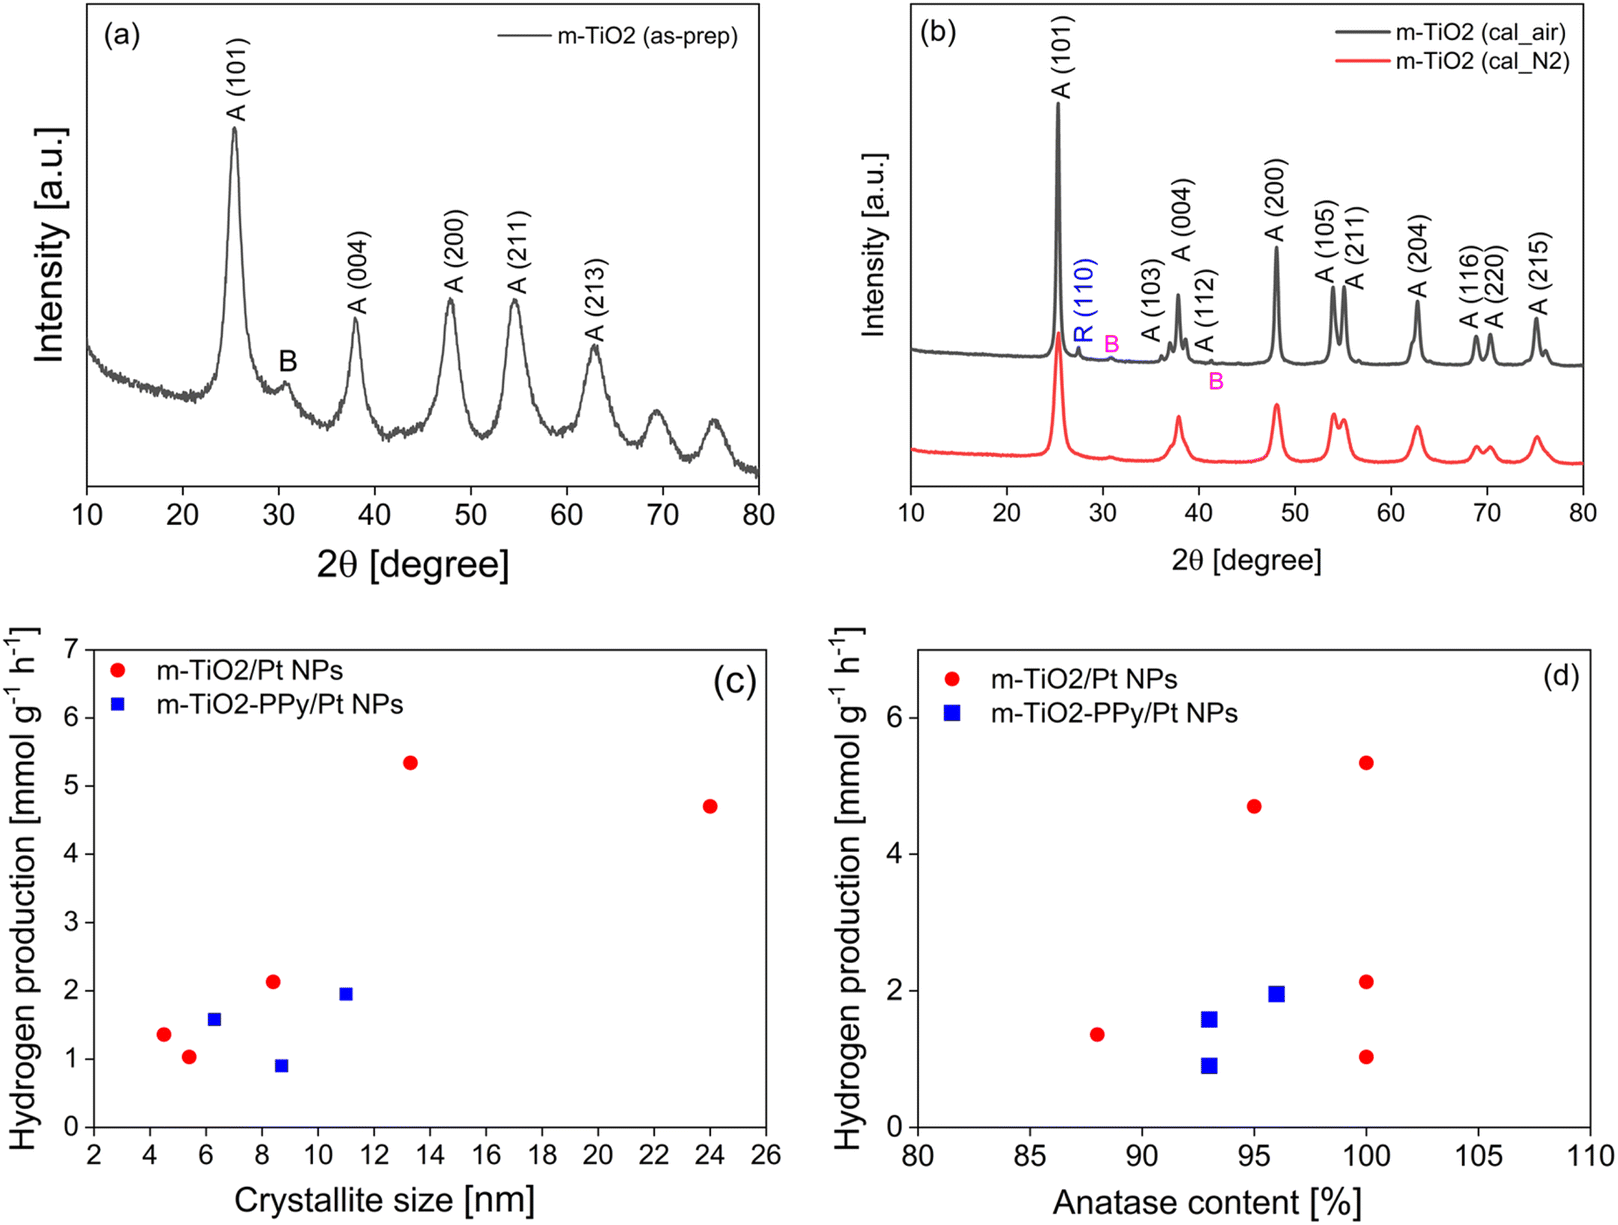 | ||
| Fig. 7 XRD spectra of (a) as-prepared m-TiO2 and (b) m-TiO2 after calcination under air and N2. Relationship between (c) crystallite size and H2 production and (d) anatase content and H2 production. | ||
To understand the textural changes occurring due to the thermal treatments, the full N2 adsorption–desorption isotherms were measured for three conditions where the main changes in the photocatalytic activity occurred (the as-prepared m-TiO2, m-TiO2 calcined at 550 °C and m-TiO2 calcined at 600 °C). The as-prepared m-TiO2 shows a type IV isotherm with a characteristic hysteresis loop, which confirms the mesoporous structure (Fig. S5, ESI†). In addition, the isotherm also exhibits high adsorption at low relative pressure, indicating the presence of very small mesopores. In the relative pressure (P/P0) range of 0.9 to 1.0, the materials exhibited very high adsorption, which also points to the simultaneous presence of interparticle macropores. This material exhibited a very high surface area and pore volume of up to 363 m2 g−1 and 0.34 cm3 g−1, respectively. Pore size distributions were analyzed using the BJH method from the desorption branch of the isotherm (Fig. S5b, d and f†). After the calcination step, the surface areas decreased to 49 m2 g−1 and 24 m2 g−1 for the samples calcined at 550 °C and 600 °C, respectively. Compared to the pore size distribution of the as-prepared m-TiO2 with the average pore size of 1.7 nm (Fig. S6b†), the calcined materials (Fig. S6d and f†) exhibited a shift to a broader pore size distribution and larger average pore sizes of 15 nm at 550 °C and >100 nm at 600 °C due to sintering of the catalyst particles. Therefore, the optimum calcination temperature for these TiO2 materials was 550 °C which was used in all subsequent experiments. The reduction in the porous properties of the catalyst materials at higher temperatures due to the sintering of the particles has been reported by other researchers.47 As presented in Table S1 in ESI,† the catalysts with optimum photocatalytic H2 production activity exhibited medium surface areas of about 45–52 m2 g−1 when compared to the as-prepared materials with surface areas as high as 411 m2 g−1. Based on these results, we concluded that having extremely high surface area alone is insufficient to control the photocatalytic activity, despite exposing more catalytic active sites.
| Catalyst | Anatase (%) | Rutile (%) | Brookite (%) | Crystallite size (nm) | BET surface (m2 g−1) | H2 productionb (mmol g−1 h−1) |
|---|---|---|---|---|---|---|
| a Calcinations were performed at 550 °C in air or N2 for 3 hours.b The H2 production (last column) was performed using Pt NPs as co-catalyst. | ||||||
| 1. m-TiO2 as-prepared | 88 | — | 12 | 4.5 | 363 | 1.36 |
| 2. m-TiO2 calcined_air | 100 | - | <1 | 13.3 | 42 | 5.34 |
| 3. m-TiO2 calcined_N2 | 100 | — | <1 | 8.4 | 123 | 2.13 |
| 4. m-TiO2/PPy as-prepared | 93 | — | 7 | 6.3 | 240 | 1.58 |
| 5. m-TiO2/PPy calcined_air | 96 | — | 4 | 11 | 105 | 1.95 |
| 6. m-TiO2/PPy calcined_N2 | 93 | — | 7 | 8.7 | 110 | 0.90 |
| 7. m-TiO2 2 as-prepared | 100 | — | <1 | 5.4 | 362 | 1.03 |
| 8. m-TiO2 2 calcined_air | 95 | 3 | 2 | 24 | 49 | 4.7 |
The m-TiO2 in anatase phase with traces of brookite (<1%) was obtained after calcination in both air and nitrogen. However, the sample calcined in air for 3 hours exhibited a higher H2 production rate of 5.34 mmol g−1 h−1 (Table 1, entry 2) compared to the one calcined under nitrogen atmosphere which was 2.13 mmol g−1 h−1 (Table 1, entry 3). Similar observations were made in the case of the TiO2/PPy composites (Table 1, entries 4–6). Transition between the different TiO2 phases has previously been reported after calcination of TiO2 at temperatures exceeding 400 °C or 600 °C.48,49 In addition, the crystallite size of all the catalysts increased after the calcination. The cross-section of the catalyst particles became larger due to the sintering as also confirmed by the SEM images (Fig. S6 in ESI†). These results together with the series of materials presented in ESI (Table S1†) suggest that the calcination temperature and atmosphere have a strong influence on the crystalline properties and subsequently the photocatalytic activity. Because the surface area of the best material was lower than that of the material calcined under N2 whereas both materials are composed of 100% anatase, we investigated the influence of the crystallite size and anatase content on H2 production. When plotting the relationship between crystallite size and hydrogen production (Fig. 7c) and it was observed that the photocatalytic activity increased with increasing crystallite size up to 13.3 nm for the m-TiO2 materials whereas in the case of the composites, not so obvious changes were observed. The increase in H2 production with increasing crystallite size could be due to the suppression of electron–hole recombination. Akinobu Miyoshi et al.45 have emphasized that larger crystallite sizes mean efficient spatial separation of the redox sites which suppresses electron–hole recombination and enhances photocatalytic activity. The decrease at crystallite size of 24.3 nm could point to the fact that there is a crystal size limit at which the electron transfer is effective and above which the activity decreases or other factors such as the surface area and the type of crystal phase also influenced the activity. The highly crystalline nature of the catalysts containing a mixture of both anatase and traces of brookite phases can also make it possible for interphase charge transfer, which could contribute to the inhibition of charge recombination.11,50 Ultimately, a balance between the improved light absorption, crystalline phase structure and an average specific surface area appears to be the optimal conditions for an effective visible light active TiO2 photocatalyst for H2 production. Evaluating the effect of anatase composition on the photocatalytic activity revealed at first glance that the activity increases with increasing anatase composition (Fig. 7d). However, comparing the three samples with 100% anatase (Table 1, entries 2, 3 and 7), we can say that the anatase composition is only one of the contributing factors that account for the activity.
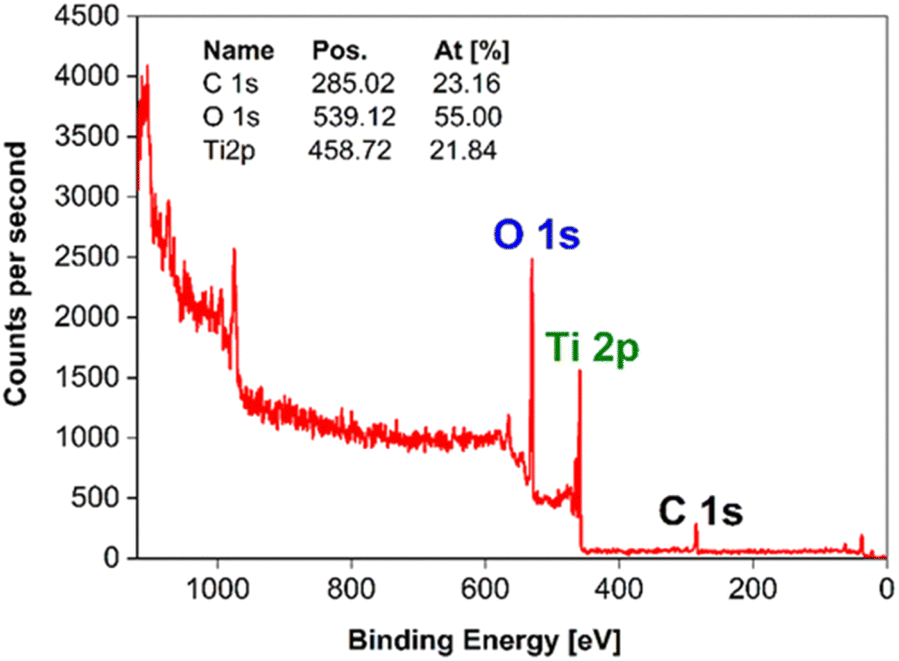 | ||
| Fig. 8 XPS survey spectrum of the m-TiO2 nanostructure surface. | ||
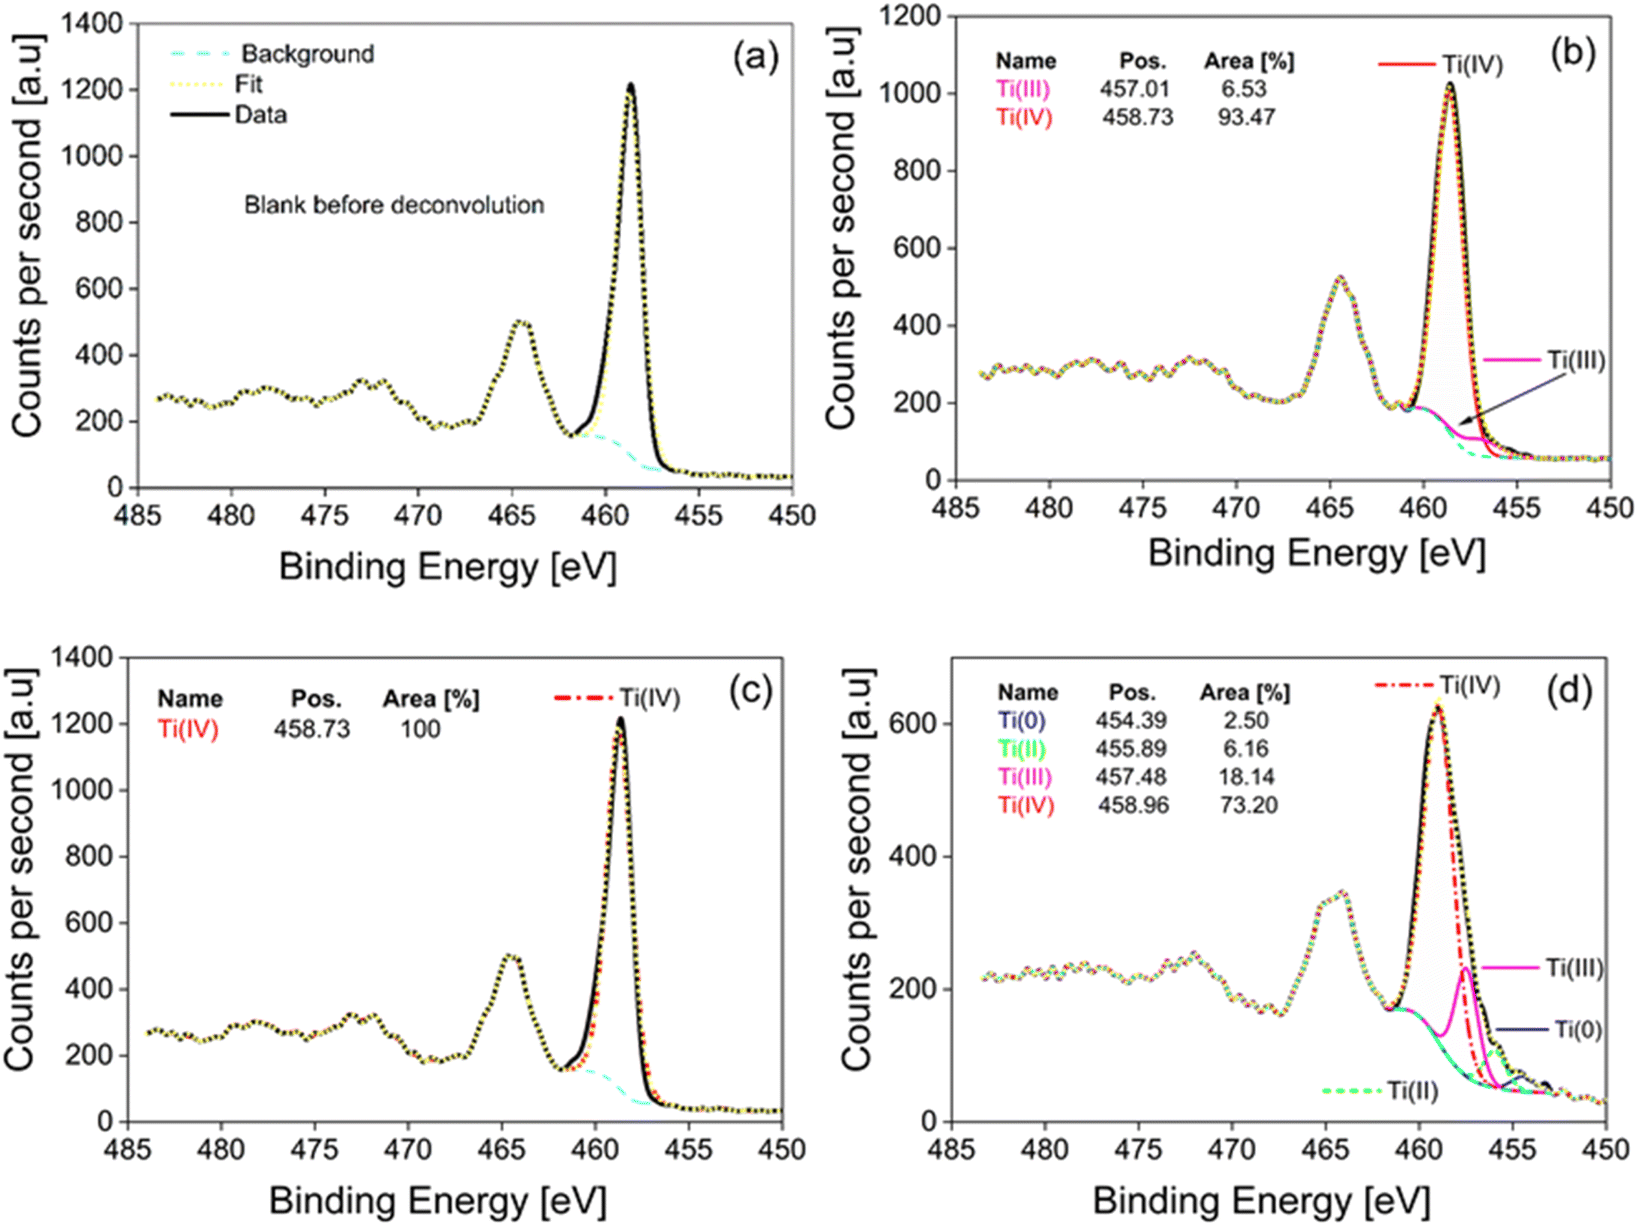 | ||
| Fig. 9 (a) Sample of measurements before deconvolution, (b) m-TiO2 as-prepared, (c) m-TiO2 calcined in air, and (d) m-TiO2 calcined in N2. | ||
![[thin space (1/6-em)]](https://www.rsc.org/images/entities/char_2009.gif) a
a
| Parameter | Ti 2p | O 1s | C 1s | Ti 2p3/2 | Ti 2p3/2 | Ti 2p3/2 | Ti 2p3/2 | H2 productionb (mmol g−1 h−1) |
|---|---|---|---|---|---|---|---|---|
| Position | 458.72 | 530.12 | 285.28 | 454.39 | 455.89 | 457.48 | 458.96 | |
| Ti0 | Ti2+ | Ti3+ | Ti4+ | |||||
| a All values are expressed as a percentage (%).b Hydrogen production tests were conducted with Pt NPs as co-catalyst. | ||||||||
| 1. m-TiO2 as-prepared | 16.81 | 51.59 | 31.61 | — | — | 6.53 | 93.47 | 1.36 |
| 2. m-TiO2 calcined_air | 21.84 | 55.00 | 23.16 | — | — | — | 100 | 5.34 |
| 3. m-TiO2 calcined_N2 | 24.93 | 56.04 | 19.03 | 2.50 | 6.16 | 18.14 | 73.20 | 2.13 |
 | ||
| Fig. 10 SEM images of mesoporous m-TiO2 loaded with Pt NPs by the (a) in situ method and (b) ex situ method and the corresponding TEM images of in situ method (c) and ex situ method (d). | ||
ICP-OES analysis showed that the in situ deposited material had 2.99% Pt whereas the ex situ deposited catalyst had 3.28 wt%. EDX was also employed to confirm the presence of Pt NPs deposited on TiO2 (Fig. S7 in ESI†). To understand the influence of the Pt amount on the H2 production rate, the correlation between the H2 production rate and Pt content was analyzed. The as-prepared TiO2 materials without Pt co-catalyst showed only moderate H2 production rates of 93 μmol g−1 h−1 (Table 3, entry 1). When Pt was added, the activity increased by about 15 times to 1360 μmol g−1 h−1 (entry 2). After calcination, the production rate without Pt was 335 μmol g−1 h−1 (about 3.6 × compared to the as-prepared) because the catalyst particles are crystallized during the calcination process (entry 2). When Pt was loaded onto the calcined sample by the in situ approach, the activity increased about 16 times (entry 3). Previous studies have reported that when Pt NPs are loaded onto TiO2, they act as an electron sinks, enhancing the separation of photogenerated electron–hole pairs.50,60 Moreover, Pt NPs have been reported to act as sensitizers under visible light transferring electrons to the catalyst.50 The sample with ex situ deposited Pt NPs showed lower activity compared to the in situ deposited one despite the higher wt% of Pt in the ex situ sample. This could be due to the high degree of aggregation of Pt NPs observed in the ex situ deposited catalyst (Fig. 10b and d), which is in line with other studies.5 To confirm that the H2 produced actually comes from the photocatalyst and not the co-catalyst (Pt NPs), a control experiment using only Pt NPs was conducted. After irradiation of the Pt NPs for about 3 hours, no hydrogen was detected, which confirmed that the H2 evolution does not come from the co-catalyst, but rather from the photocatalyst (see Fig. S8 in ESI†). These results indicate that although the presence of Pt NPs is important for improving the catalytic performance, the quantity of Pt present is not the main factor accounting for enhancing the activity, but also the homogeneity of the deposition and size of the particles. Kowalska et al.50 have reported similar findings that 1 wt% loading of Pt as the optimum and that increasing Pt amount from 1 to 2 wt% did not enhance the performance of the catalyst any further.
| Treatments | Catalyst | Pt content (wt%) | H2 production (μmol g−1 h−1) |
|---|---|---|---|
| As-prepared samples | 1. m-TiO2 as-prepared no Pt | 0 | 93 |
| 2. m-TiO2 as-prepared + Pt | 2.99 | 1360 | |
| Calcined samples | 3. m-TiO2 calcined at 550 °C, 3 h in air no Pt | 0 | 335 |
| 4. m-TiO2 calcined at 550 °C, 3 h in air + Pt (in situ) | 2.99 | 5340 | |
| 5. m-TiO2 calcined at 550 °C, 3 h in air + Pt (ex situ) | 3.28 | 3410 |
To evaluate the role of the sacrificial agent in the H2 production activity as hole scavengers, we tested the best catalyst in pure water with and without Pt co-catalyst and compared the results to that performed with the sacrificial agent (Table 4). We observed that even without any sacrificial agent or Pt added, the m-TiO2 was able to produce 28 μmol g−1 h−1 of H2 (entry 1) whereas, with the sacrificial agent and no Pt added, the activity increased to 335 μmol g−1 h−1 (entry 3). The H2 produced from the reaction without a sacrificial agent can only come from water splitting, which demonstrates the capability of the synthesized m-TiO2 nanostructures to catalyze overall water splitting but the efficiency needs to be improved. Ideally, the goal is to perform overall water splitting without adding any sacrificial agents, however, to date, only a small number of the developed photocatalysts are capable of driving overall water splitting with good efficiency.60,61 Moreover, most of the overall water splitting photocatalysts are structurally complex and their preparation involves multiple steps which can cause environmental pollution. From the point of view of sustainability and life cycle assessment, cheap and simple photocatalysts that utilize renewable sacrificial agents to generate H2 are preferable. To evaluate the capability of various renewable sacrificial agents in trapping holes and enhancing the activity, we tested different types of sacrificial agents. As shown in Fig. 11, ethanol was found to produce the highest amount of hydrogen followed by methanol. The differences in the evolution rate of different renewable sacrificial agents could be due to their different capabilities in binding to the catalyst and preventing charge recombination.
| Catalyst | Sacrificial agent | Pt | H2 production (μmol g−1 h−1) |
|---|---|---|---|
| 1. m-TiO2 calcined no Pt, pure water | None | No | 28 |
| 2. m-TiO2 calcined + Pt + pure water | None | Yes | 59 |
| 3. m-TiO2 calcined + no Pt + 10% ethanol | Ethanol | No | 335 |
| 4. m-TiO2 calcined + Pt + 10% ethanol | Ethanol | Yes | 5340 |
| 5. m-TiO2 calcined + Pt + 10% methanol | Methanol | Yes | 4163 |
 | ||
| Fig. 11 Influence of different sacrificial agents on hydrogen production for m-TiO2 nanostructures. | ||
With more focus on sustainable production and processes nowadays, the simple and low-cost photocatalysts which catalyze HER in the presence of renewable sacrificial agents such as methanol, ethanol, and glycerol, are promising alternatives. These agents aid in enhancing photocatalytic efficiencies by trapping photo-induced holes and thereby prolonging the lifetime of charge carriers to be used in water splitting.1,11 Moreover, they can be advantageous over the overall water splitting systems because an additional step would be required as a future challenge for the separation of an explosive O2/H2 mixture from overall water splitting, which would be unnecessary in the case of sacrificial HER.
Based on all the above analyses, it was demonstrated that there was no hydrogen detected when the developed nanostructured catalysts were placed in the reaction system in the dark. The hydrogen signal was only detected when the nanostructures were irradiated under a solar simulator. This demonstrates the solar activity of the prepared nanostructures, compared to conventional TiO2 which shows no vis-NIR activity due to the large bandgap. The best material showed a high H2 production rate (5.34 mmol g−1 h−1), this value is higher for sunlight-driven H2 production compared to other semiconductor materials reported in the literature. More effort is however needed to improve the STH efficiency.
Contrary to previous reports2,30,62 that the introduction of defects enhances photocatalytic activity, we observed that the presence of these defect states rather compromised the activity, and the defect-free pure anatase phase exhibited the highest activity. The high full solar spectrum activity of the nanostructures can be attributed to several factors:
Both the m-TiO2 and m-TiO2/PPy nanostructures have a high specific surface area, which can offer more active sites for light absorption and efficient diffusion, thereby improving the photocatalytic properties. Incorporation of the PPy which has excellent absorption properties enhanced the absorption properties in the entire UV-vis spectrum improved the solar light absorption of the nanostructures. And finally, deposition of well dispersed co-catalyst particles onto the surface of the m-TiO2 nanostructures can ensure efficient separation of photogenerated charge carriers. The calcination conditions also strongly influence the crystalline properties of the nanostructures and subsequently the photocatalytic activity (Table 5).
| Catalyst system | Co-catalyst | STH conversion efficiency (%) | Ref. |
|---|---|---|---|
| 1. Al-doped SrTiO3 (SrTiO3:Al) |
Rh/Cr2O3, CoOOH (impregnation) | 0.51 | 62 |
| 2. Y2Ti2O5S2 | Ru/Cr2O3, IrO2 | 0.007 | 63 |
| 3. B-doped, N-deficient C3N4 | Pt, Co(OH)2 | 1.16 | 64 |
| 4. Ta3N5 | Rh/Cr2O3 | 0.014 | 65 |
| 5. SrTiO3:Al |
Rh/Cr2O3, CoOOH | 0.65 | 66 |
| 6. m-TiO2 and m-TiO2/PPy | Pt | 0.60 | This work |
It is an indisputable fact that high surface areas can provide more exposed sites for surface reactions whereas large pore size can shorten diffusion paths to enhance the reaction kinetics. Nevertheless, detailed structure–function investigation from H2 production, XRD, BET and XPS results confirmed that high surface area alone is not sufficient to enhance the photocatalytic activity. Rather, a balance of crystalline phase structure, good dispersity of Pt NPs on the surface of the m-TiO2, good light absorption properties, and pore architecture (high mesoporosity) are responsible for the high performance.
4. Conclusions
We have successfully prepared new mesoporous TiO2 and m-TiO2-PPy nanostructures with full solar spectrum activity using a simple combination of colloidal and sol–gel method. The high solar photocatalytic activity is attributed to the synergistic effect of the highly mesoporous structure coupled with enhanced light absorption. The as-prepared nanostructured catalysts even prior to calcination treatment showed high crystallinity with very high surface areas up to 400 m2 g−1 and a reasonably good hydrogen production rate of 1.36 mmol g−1 h−1 which increased to 5.34 mmol g−1 h−1 after calcination. This presents a good opportunity for sustainably producing catalysts with no need for high energy input for calcination and its consequent release of poisonous gases. Based on the understanding obtained from this work, the presented approach provides an effective strategy for the design of effective mesoporous TiO2-based nanostructured catalysts. Beyond their application in hydrogen production, these catalysts are being tested in CO2 reduction to ethane, methane and carbon monoxide confirming their use in a wide range of fields such as fuel cells, and photovoltaics.Conflicts of interest
The authors declare that they have no known competing financial interests or personal relationships that could have appeared to influence the work reported in this paper.Acknowledgements
E. M. K is grateful to the Ministry of Education, Youth and Sports of the Czech Republic for the financial support. All authors acknowledge support from the Deutsche Forschungsgemeinschaft (DFG, German Research Foundation) under Germany's Excellence Strategy (UniSysCat) and the Technology Agency of the Czech Republic & the Research Council of Norway. We are also grateful to the following people from the Department of Chemistry, Technische Universität Berlin: Ms. Gabriele Vetter, Ms. Biljana Nikolovska and Ms. Astrid Mueller-Klauke for the technical support, as well as Ms. Doris Esser for the administrative support. The research leading to these results was funded by the European Structural and Investment Funds OP RDE-funded project 'CHEMFELLS IV' (Project No. CZ.02.2.69/0.0/0.0/20_079/0017899) and by the Deutsche Forschungsgemeinschaft (DFG), German Research Foundation under Germany's Excellence Strategy – EXC 2008/1 (UniSysCat) – 390540038. The authors also gratefully acknowledge support from the Technology Agency of the Czech Republic & the Research Council of Norway through the project METAMORPH (EEA & Norway Grant project TO01000329) and specific university grants (A1_FCHI_2022_006) and (A2_FCHI_2022_020). The APC was funded by the European Structural and Investment Funds, 'CHEMFELLS IV' (Project No. CZ.02.2.69/0.0/0.0/20_079/0017899).Notes and references
- P. Niu, J. Dai, X. Zhi, Z. Xia, S. Wang and L. Li, InfoMat, 2021, 3, 931–961 CrossRef CAS.
- L. J. Gao, L. Chen, J. T. Ren, C. C. Weng, W. W. Tian and Z. Y. Yuan, J. Colloid Interface Sci., 2021, 589, 25–33 CrossRef CAS PubMed.
- Y. Li, J. Tang, Y. Wei, W. He, Z. Tang, X. Zhang, J. Xiong and Z. Zhao, J. CO2 Util., 2021, 51, 101648 CrossRef CAS.
- X. Liu, P. Wang, X. Liang, Q. Zhang, Z. Wang, Y. Liu, Z. Zheng, Y. Dai and B. Huang, Mater. Today Energy, 2020, 18, 100524 CrossRef CAS.
- G. Jeantelot, M. Qureshi, M. Harb, S. Ould-Chikh, D. H. Anjum, E. Abou-Hamad, A. Aguilar-Tapia, J. L. Hazemann, K. Takanabe and J. M. Basset, Phys. Chem. Chem. Phys., 2019, 21, 24429–24440 RSC.
- F. A. Soria, C. Daldossi and C. Di Valentin, Mater. Today Energy, 2022, 28, 101085 CrossRef CAS.
- B. Luo, Y. Zhao and D. Jing, Front. Energy, 2021, 15, 600–620 CrossRef.
- Z. Wang, C. Li and K. Domen, Chem. Soc. Rev., 2019, 48, 2109–2125 RSC.
- L. Gomathi Devi and R. Kavitha, RSC Adv., 2014, 4(54), 28265 RSC.
- S. Wei, S. Ni and X. Xu, Chin. J. Catal., 2018, 39, 510–516 CrossRef CAS.
- P. A. K. Reddy, P. V. L. Reddy, K.-H. Kim, M. K. Kumar, C. Manvitha and J.-J. Shim, J. Ind. Eng. Chem., 2017, 53, 253–260 CrossRef CAS.
- X. Li, Y. Fang, Y. Hu, H. Huo, S. Zhao, X. Long, J. Ma and R. Li, RSC Adv., 2015, 5(86), 69962 RSC.
- L. Ding, Z. Yu, L. Sun, R. Jiang, Y. Hou, J. Huang, H. Zhu, T. Zhong, H. Chen and C. Lian, J. Colloid Interface Sci., 2022, 623, 660–673 CrossRef CAS PubMed.
- R. van de Krol and M. Grätzel, Photoelectrochemical Hydrogen Production, Springer, 2012 Search PubMed.
- B. Dong, J. Cui, Y. Qi and F. Zhang, Adv. Mater., 2021, 33(29), e2004697 CrossRef PubMed.
- X. Chen, L. Liu, Y. P. Yu and S. S. Mao, Science, 2011, 331, 746–750 CrossRef CAS PubMed.
- J. Schneider, M. Matsuoka, M. Takeuchi, J. Zhang, Y. Horiuchi, M. Anpo and D. W. Bahnemann, Chem. Rev., 2014, 114(19), 9919 CrossRef CAS PubMed.
- D. M. Tobaldi, L. Lajaunie, D. Dvoranová, V. Brezová, B. Figueiredo, M. P. Seabra, J. J. Calvino and J. A. Labrincha, Mater. Today Energy, 2020, 17, 100460 CrossRef.
- M. Xing, W. Fang, M. Nasir, Y. Ma, J. Zhang and M. Anpo, J. Catal., 2013, 297, 236–243 CrossRef CAS.
- X. Han, P. Liu, R. Ran, W. Wang, W. Zhou and Z. Shao, Mater. Today Energy, 2022, 23, 100896 CrossRef CAS.
- B. Qiu, C. Wang, J. Wang, Z. Lin, N. Zhang, L. Cai, X. Tao and Y. Chai, Mater. Today Energy, 2021, 21, 100720 CrossRef CAS.
- S. Hoang, S. P. Berglund, N. T. Hahn, A. J. Bard and C. B. Mullins, J. Am. Chem. Soc., 2012, 134, 3659–3662 CrossRef CAS PubMed.
- T. Tachikawa, S. Tojo, K. Kawai, M. Endo, M. Fujitsuka, T. Ohno, K. Nishijima, Z. Miyamoto and T. Majima, J. Phys. Chem. B, 2004, 108, 19299 CrossRef CAS.
- Q. Chen, C. Chen, H. Ji, W. Ma and J. Zhao, RSC Adv., 2013, 3(38), 17559 RSC.
- J. Yu, Q. Xiang and M. Zhou, Appl. Catal., B, 2009, 90, 595–602 CrossRef CAS.
- P. J. Sugumaran, J. Zhang and Y. Zhang, J. Colloid Interface Sci., 2022, 628, 121–130 CrossRef CAS PubMed.
- W. Halim, S. Coste, S. Zeroual, A. Kassiba and S. Ouaskit, J. Mater. Sci. Mater. Electron., 2020, 31, 4161–4169 CrossRef CAS.
- H. Lee, H. S. Jang, N. Y. Kim and J. B. Joo, J. Ind. Eng. Chem., 2021, 99, 352–363 CrossRef CAS.
- D. Li, X. Ma, P. Su, Z. Jiang and Z. Jin, Int. J. Energy Res., 2022, 46(6), 7479 CrossRef CAS.
- Y. Li, R. He, P. Han, B. Hou, S. Peng and C. Ouyang, Appl. Catal., B, 2020, 279, 119379 CrossRef CAS.
- E. M. Kutorglo, F. Muzika, F. Hassouna, G. Storti, D. Kopecký, R. Bleha, A. Synytsya, I. Sedlářová and M. Šoóš, Micropor. Mesopor. Mater., 2021, 311, 110690 CrossRef CAS.
- J. Park, Visible and near infrared light active photocatalysis based on conjugated polymers, J. Ind. Eng. Chem., 2017, 51, 27–43 CrossRef CAS.
- P. Camurlu, RSC Adv., 2014, 4, 55832–55845 RSC.
- T. Di, B. Cheng, W. Ho, J. Yu and H. Tang, Appl. Surf. Sci., 2019, 470, 196 CrossRef CAS.
- X. Guo, S. Liu, W. Wang, C. Zhu, C. Li, Y. Yang, Q. Tian and Y. Liu, J. Colloid Interface Sci., 2021, 600, 838 CrossRef CAS PubMed.
- W. Yang, M. Li, K. Pan, L. Guo, J. Wu, Z. Li, F. Yang, K. Lin and W. Zhou, J. Colloid Interface Sci., 2021, 586, 75–83 CrossRef CAS PubMed.
- E. C. M. Barbosa, L. S. Parreira, I. C. de Freitas, L. R. Aveiro, D. C. de Oliveira, M. C. dos Santos and P. H. C. Camargo, ACS Appl. Energy Mater., 2019, 2(8), 5759 CrossRef CAS.
- E. P. Barrett, L. G. Joyner and P. Halenda, J. Am. Chem. Soc., 1951, 73, 373–380 CrossRef CAS.
- S. Lettieri, M. Pavone, A. Fioravanti, L. Santamaria Amato and P. Maddalena, Materials, 2021, 14, 1645 CrossRef CAS PubMed.
- L. Sun, W. Liu, R. Wu, Y. Cui, Y. Zhang, Y. Du, S. Liu, S. Liu and H. Wang, Nanoscale, 2020, 12, 746–754 RSC.
- T. Tao, A. M. Glushenkov, Q. Chen, H. Hu, D. Zhou, H. Zhang, M. Boese, S. Liu, R. Amal and Y. Chen, CrystEngComm, 2011, 13, 1322–1327 RSC.
- S. S. Muniandy, N. H. Mohd Kaus, Z.-T. Jiang, M. Altarawneh and H. L. Lee, RSC Adv., 2017, 7(76), 48083 RSC.
- Q. Guo, J. Zhao, Y. Yang, J. Huang, Y. Tang, X. Zhang, Z. Li, X. Yu, J. Shen and J. Zhao, J. Colloid Interface Sci., 2020, 560, 359–368 CrossRef CAS PubMed.
- Z. Ahmad, M. A. Choudhary, A. Mehmood, R. Wakeel, T. Akhtar and M. A. Rafiq, Macromol. Res., 2016, 24, 596–601 CrossRef CAS.
- A. Miyoshi, S. Nishioka and K. Maeda, Chemistry, 2018, 24(69), 18204 CrossRef CAS PubMed.
- K. Al-Attafi, A. Nattestad, Q. Wu, Y. Ide, Y. Yamauchi, S. X. Dou and J. H. Kim, Chem. Commun., 2018, 54, 381–384 RSC.
- J. Fang, F. Wang, K. Qian, H. Bao, Z. Jiang and W. Huang, J. Phys. Chem. C, 2008, 112, 18150 CrossRef CAS.
- A. Gil, A. M. García, M. Fernández, M. A. Vicente, B. González-Rodríguez, V. Rives and S. A. Korili, J. Ind. Eng. Chem., 2017, 53, 183 CrossRef CAS.
- M. Pelaez, N. T. Nolan, S. C. Pillai, M. K. Seery, P. Falaras, A. G. Kontos, P. S. M. Dunlop, J. W. J. Hamilton, J. A. Byrne, K. O'Shea, M. H. Entezari and D. D. Dionysiou, Appl. Catal., B, 2012, 125, 331–349 CrossRef CAS.
- E. Kowalska, H. Remita, C. Colbeau-Justin, J. Hupka and J. Belloni, J. Phys. Chem. C, 2008, 112, 1124–1131 CrossRef CAS.
- S. A. Abdullah, M. Z. Sahdan, N. Nafarizal, H. Saim, Z. Embong, C. H. Cik Rohaida and F. Adriyanto, Appl. Surf. Sci., 2018, 462, 575–582 CrossRef CAS.
- D. Nanda Gopala Krishna, R. P. George and J. Philip, J. Phys. Chem. C, 2021, 125, 16136–16146 CrossRef CAS.
- L. Pan, J. J. Zou, S. Wang, Z. F. Huang, A. Yu, L. Wang and X. Zhang, Chem. Commun., 2013, 49, 6593–6595 RSC.
- G. Yang, T. Wang, B. Yang, Z. Yan, S. Ding and T. Xiao, Appl. Surf. Sci., 2013, 287, 135–142 CrossRef CAS.
- S. Mohajernia, S. Hejazi, A. Mazare, N. T. Nguyen and P. Schmuki, Chemistry, 2017, 23, 12406–12411 CrossRef CAS PubMed.
- Z. Wan, G.-F. Huang, W.-Q. Huang, C. Jiao, X.-G. Yan, Z.-M. Yang and Q. Zhang, Mater. Lett., 2014, 122, 33–36 CrossRef CAS.
- D. Zhang, X. Ma, H. Zhang, Y. Liao and Q. Xiang, Mater. Today Energy, 2018, 10, 132–140 CrossRef.
- Y. Yang, P. Gao, X. Ren, L. Sha, P. Yang, J. Zhang, Y. Chen and L. Yang, Appl. Catal., B, 2017, 218, 751–757, DOI:10.1016/j.apcatb.2017.07.014.
- L. Jing, D. Wang, Y. Xu, M. Xie, J. Yan, M. He, Z. Song, H. Xu and H. Li, J. Colloid Interface Sci., 2020, 566, 171–182 CrossRef CAS PubMed.
- Z. Pan, Y. Zheng, F. Guo, P. Niu and X. Wang, ChemSusChem, 2017, 10(1), 87 CrossRef CAS PubMed.
- H. Nishiyama, T. Yamada, M. Nakabayashi, Y. Maehara, M. Yamaguchi, Y. Kuromiya, Y. Nagatsuma, H. Tokudome, S. Akiyama and T. Watanabe, Nature, 2021, 598, 304–307, DOI:10.1038/s41586-021-03907-3.
- L. Si, Z. A. Huang, K. Lv, D. Tang and C. Yang, J. Alloys Compd., 2014, 601, 88 CrossRef CAS.
- Q. Wang, M. Nakabayashi, T. Hisatomi, S. Sun, S. Akiyama, Z. Wang, Z. Pan, X. Xiao, T. Watanabe and T. Yamada, Nat. Mater., 2019, 18, 827–832 CrossRef CAS PubMed.
- D. Zhao, Y. Wang, C.-L. Dong, Y.-C. Huang, J. Chen, F. Xue, S. Shen and L. Guo, Nat. Energy, 2021, 6, 388–397 CrossRef CAS.
- Z. Wang, Y. Inoue, T. Hisatomi, R. Ishikawa, Q. Wang, T. Takata, S. Chen, N. Shibata, Y. Ikuhara and K. Domen, Nat. Catal., 2018, 1, 756–763 CrossRef CAS.
- T. Takata, J. Jiang, Y. Sakata, M. Nakabayashi, N. Shibata, V. Nandal, K. Seki, T. Hisatomi and K. Domen, Nature, 2020, 581, 411–414 CrossRef CAS PubMed.
Footnote |
| † Electronic supplementary information (ESI) available. See DOI: https://doi.org/10.1039/d3ra04049f |
| This journal is © The Royal Society of Chemistry 2023 |