
 Open Access Article
 This Open Access Article is licensed under a Creative Commons Attribution-Non Commercial 3.0 Unported Licence
Geographical heterogeneity and dominant polymer types in microplastic contamination of lentic ecosystems: implications for methodological standardization and future research†
Lindys Miranda-Peña
a,
Laura Buitrago-Duque
 a,
Nelson Rangel-Buitrago
b,
Adriana Gracia C.
a,
Victoria Andrea Arana
c and
Jorge Trilleras
*c
a,
Nelson Rangel-Buitrago
b,
Adriana Gracia C.
a,
Victoria Andrea Arana
c and
Jorge Trilleras
*c
aPrograma de Biología, Facultad de Ciencias Básicas, Universidad del Atlántico, Puerto Colombia, Atlántico, Colombia. E-mail: lymiranda@mail.uniatlantico.edu.co; mariaadrianagracia@mail.uniatlantico.edu.co
bPrograma de Física, Facultad de Ciencias Básicas, Universidad del Atlántico, Puerto Colombia, Atlántico, Colombia. E-mail: nelsonrangel@mail.uniatlantico.edu.co
cPrograma de Maestría en Ciencias Químicas, Facultad de Ciencias Básicas, Universidad del Atlántico, Puerto Colombia, Atlántico, Colombia. E-mail: victoriaarana@mail.uniatlantico.edu.co; jorgetrilleras@mail.uniatlantico.edu.co; Tel: +57-3165288489
First published on 11th September 2023
Abstract
This study examines the prevalence and distribution of microplastic polymer types in lentic ecosystems, revealing significant heterogeneity across different geographical regions and ecosystems. The most dominant type of microplastic observed was polyethylene (PE), followed by polypropylene (PP) and polystyrene (PS), which aligns with global production rates. North America, Asia, and Europe were identified as the regions with the highest microplastic contamination, with the United States, China, Italy, and Spain being the most affected countries. The physical characteristics of each ecosystem, such as wind speed, depth, and eutrophication, alongside seasonal variations, and anthropogenic activities, contributed to the observed heterogeneity in microplastics concentrations. The study highlights the need for further research on microplastics in lentic ecosystems, considering their unique physical characteristics and anthropogenic influences. A significant lack of methodological standardization in microplastics research was identified, leading to underestimation of microplastics prevalence and high heterogeneity in meta-analyses.
 Lindys Miranda-Peña | Lindys Miranda Peña earned her Bachelor's degree in Biology from Universidad del Atlántico (Puerto Colombia, Colombia). She is currently pursuing a Master's degree in Environmental Sciences as a member of the Caribbean Environmental Studies Network (RED Sue Caribe). Her research focuses on environmental contaminants and various environmental compartments, particularly within the biota. Lindys is affiliated with Universidad del Atlántico as a researcher, where she is actively involved in a project investigating microplastic pollution along the Colombian Caribbean coast. |
 Laura Buitrago-Duque | Laura Nathalia Buitrago Duque graduated from the Universidad del Atlántico (Puerto Colombia–Colombia) with a specialization in Medical Microbiology from the Pontificia Universidad Javeriana de Colombia (2022). She is a technologist in industrial chemistry. She has worked on the evaluation of hydrobiological communities in Colombia and is currently finishing a master's degree in molecular approaches in health sciences at the Universitat de València, Spain. |
 Nelson Rangel-Buitrago | Nelson Guillermo Rangel-Buitrago (Bsc. Geology, Msc. Earth Sciences, PhD Sea Sciences) full Professor in the Geology, Geophysics, and Marine-Research Group at the Universidad del Atlántico, he has been teaching at the university level since 2003. Her research and teaching are focused on Coastal Geology, Coastal Geomorphology, Coastal Hazards, Marine Pollution, and Coastal Management. Besides his teaching experience, he has participated in diverse multidisciplinary research projects and has served as an expert consultant for national and international organizations. |
 Adriana Gracia C. | Adriana Gracia C. earned a BSc in Marine Biology in 2001, followed by a Master of Science in 2010 and a Doctorate in Sciences in 2020, all from the National University of Colombia. Since 2001, she has engaged in marine research through various projects, focusing on coastal and deep-sea biodiversity. Her areas of expertise encompass extreme ecosystems, such as cold seeps, deep-sea corals, and turbid environments, as well as invasive species and marine pollution. From 2006 to 2013, she served as the curator of a marine molluscs collection. She has been a full-time professor in the Biology program at Universidad del Atlántico, Colombia, since 2014. Her academic contributions include over 55 peer-reviewed papers on topics such as marine invertebrates (molluscs, cnidarians, brachiopods, etc.), extreme ecosystems, artificial substrates, and marine pollution. |
 Victoria Andrea Arana | Victoria Andrea Arana Rengifo graduated from Universidad del Valle (Cali, Colombia) with a degree in Chemistry, a master's degree in Sanitary and Environmental Engineering (2007), and a PhD in Chemical Sciences (2015). She is a professor at the Basic Sciences Faculty of the Universidad del Atlántico, and since 2016 has been the coordinator of a master's degree in Chemical Sciences at the same University. She does research in environmental pollution, water treatment, and spectroscopy-based metabolomics applied to food and health. |
 Jorge Trilleras | Dr Jorge Trilleras was born in Palmira (Valle del Cauca, Colombia), and after graduating in Chemistry, he received his PhD in Chemical Sciences in 2009 from Universidad del Valle (Cali, Colombia). He has 13 years of research experience and holds over 50 original research papers published in journals. His research focuses on the synthesis of heterocyclic compounds. In the last five years, he has participated in identifying and characterizing microplastic particles and emerging pollutants in different environmental matrices. Currently, he is working as a Titular Professor in the Department of Chemistry at Universidad del Atlántico. |
Introduction
A lentic ecosystem (also called the lacustrine ecosystem) is defined as a system that includes living organisms (plants, animals, microorganisms) together with their physical environment, respectively, a water body.1 These ecosystems entail a body of standing water, ranging from ditches, seeps, ponds, seasonal pools, basin marshes, lakes, and lagoons.2From an environmental point of view, lentic ecosystems are one of the earth's most dynamic and vulnerable environments. They are also areas of significant importance due to their diversity of ecological functions.3 A lentic ecosystem itself provides multiple environmental services such as provisioning (i.e., freshwater), regulation (i.e., soil fertility), support (i.e., primary production), habitat (i.e., refuge), and recreation (i.e., cognitive development).
Societal development leads to the creation of products aimed at lifestyle improvement, as is the case with the production of synthetic polymers, also known as plastics. Plastics, characterized by the unique set of properties that make them extremely popular,4,5 are probably the most abundant solid wastes in water bodies.6 In this regard, the Plastics Europe report7 establishes that in 2018, 9.4 tons of plastic litter were collected inside and outside the European Union.
The amounts of such material will inevitably increase due to the degradation of large individual plastic items which fragment into millions of smaller pieces called microplastics (<5 mm).8 These microplastics also reach water bodies as “microplastics by design”, which are typically resin pellets and microbeads associated with industrial spills,9 or from the use of cosmetics and personal care products.10,11 Another important source comes from synthetic clothing, as a single synthetic garment can release up to 1900 fibers per wash cycle.12
Once the microplastics are present in the water bodies, they are differentially distributed depending on their density, buoyancy, suspension in the water column, or deposition to become part of the bottom sediment, so that these areas become important sinks.13 One of the main mechanisms involved in the modification of density and the consequent sinking of plastic is biofouling, which accelerates deposition and eventual sedimentary burial of previously floating plastic.4,8
Despite the fact that continental water bodies are major sources of retention and transport of microplastics, most studies on plastic-waste pollution still focus on oceans,14,15 with limited information available on continental water ecosystems.16,17 The entry of microplastics into the aquatic system is a product of the direct action of waste dumping by people living near water bodies, or indirectly by the discharge of wastewater from sewage systems, or direct connections to this source.14,18 The problem is aggravated when no treatment is applied to this wastewater prior to deposition in continental water bodies.19
The main objective of this study is to identify prevalence patterns of the most common types of microplastics and their distribution in lentic ecosystems (lakes and lagoons) at a global level, offering a clear and mathematical comparison of the typologies of microplastics (polymer type) in each study area, analyzing which places contribute greater quantities of microplastics. The result of this type of research allows generating new perspectives for future restoration projects that can mitigate the levels of environmental contamination.
Methods
An extensive literature review was carried out to retrieve published articles on microplastics in lentic ecosystems using the electronic databases Scopus, Science direct, Springer, and the following keywords: “microplastic” AND “sediment” OR “water” OR “lakes” OR “lagoons” AND “FTIR” OR “Raman”. After the selection of articles in the keyword search, a second selection was made by discarding duplicate articles. The next selection step for the meta-analysis and systematic review articles was to scan the titles of each article, verifying that the focus of the studies was microplastics in lentic systems. Subsequently, a full text review of the articles obtained was carried out. For the creation of the databases for this study, articles containing the characterization and quantification of microplastic polymer types in lentic systems (lakes and lagoons) were chosen. The study area was not delimited; this analysis was carried out with studies conducted worldwide in which microplastics of less than 5 mm were identified.A database was created in which the information from the selected articles was extracted. In addition, for the elaboration of the database used for the analysis and development of this meta-analysis, a selection of the articles was made establishing criteria such as the chemical characterization of the microplastics found in each lentic system, and the size of the samples used (n) for the chemical identification of the microplastics. Results were further specified according to sample type (littoral sediment, deep sediment, and surface water). For articles with missing data, the authors were contacted by electronic mail to complete the information; in case of lack of response, the article was not included because of the insufficiency of the information.
The spreadsheets designed for the creation of the databases contain boxes for the extraction of the following information: sample type (water, sediment), water type (freshwater), sample depth (in meters), sampling region (littoral, depth, surface), extraction method, density (in case they used a solution in the extraction), maximum size considered for the microplastic, polymer type, quantity (of each type), percentage (of each type), total number of samples, reference, sampling year, lentic system name, country, density in m3 kg−1 and polymer concentration. To ensure the quality of the information presented, the databases were individually reviewed by each of the persons responsible for this meta-analysis. In addition, the process used to obtain the results was considered, highlighting that most of the authors assured that the procedures were performed with Quality Assurance/Quality Control (QA/QC). If quality control was not recorded in the article, the description of the procedure was verified.
The analysis was carried out using the double arcsine transformed ratio as the outcome measure. A random effects model was fitted to the data. The amount of heterogeneity was estimated using the Paule-Mandel estimator,20 along with the τ2 estimate, Q-test for heterogeneity21 and I2 index.22 In case some amount of heterogeneity is detected (i.e., τ2 > 0, regardless of the Q-test results) a credibility/prediction interval for the actual results is also provided.23 Four categorical covariates were evaluated as potential sources of heterogeneity using mixed-effects meta-regression models for each of the polymer types to find significant estimates for prevalence. The following covariates were used: geographic region (these are the country groupings that make up the continents of studies that reported the prevalence of microplastic types), microplastic extraction substance (chemical substance to separate microplastic by density difference methodology), sampling area (reported location of microplastic sample collection in lentic ecosystems) and sampling season (period of microplastic sample collection: rainy and dry). To find the simplest possible model, explanatory variables were discarded stepwise and likelihood ratio tests were used to assess whether the simplified models were significantly different from their previous versions. All analyses and plots were performed using R version 4.0.2 (ref. 24) with the packages meta,25 metafor,26 magick,27 ggmap,28 scales29 and ggplot2.30
Results and discussion
Studies selection and synthesis of results
Fig. 1A shows totals of the records examined, the articles evaluated, full texts and articles included in the meta-analysis. Similarly, Fig. 1B contains information equivalent to the qualitative review used in the systematic review. | ||
| Fig. 1 Prism model for the inclusion and exclusion of articles. (A) Diagram for meta-analysis (quantitative). (B) Diagram for the systematic review of the information used for background and discussion (qualitative). | ||
The keyword search yielded a total list of 229 articles for the meta-analysis, and 195 for the systematic review. The result of the review of duplicate titles was 176 articles for the meta-analysis and 168 for the review. In the exploration of the titles of each article, verifying that the focus of the studies was microplastics in lentic systems, a total of 128 articles were obtained for the meta-analysis, and 168 for the systematic review. Following this, a summary review was performed to obtain the articles for the full-text review, from which a first database was obtained, containing a list of 100 articles for the meta-analysis and 130 for the systematic review. After the full-text reading in the meta-analysis, 21 studies were selected (Table 1S†) and a total of 92 articles included in the systematic review.
For the analysis of prevalence of microplastic polymer types (Fig. 2), 34 independent effect sizes were calculated from 21 studies, divided into three regions of distribution in lentic systems: 16 effect sizes for surface water, 14 effect sizes for sediment in littoral region, and 4 effect sizes for deep sediments.
 | ||
| Fig. 2 Forest plot showing the observed results and the estimation of the random effects model of the microplastic polymer types. PE (polyethylene), PP (polypropylene), and PS (polystyrene). | ||
Thirteen studies contained data from samples collected in rainy seasons, and 9 studies for dry seasons. In total, 33 different types of polymers were identified for lakes, but due to the low prevalence of most of these, a meta-regression analysis was performed to study the most abundant polymers: PP (polypropylene), PE (polyethylene) and PS (polystyrene). Pooled prevalence confirmed that PE is the most common type of microplastic that contaminates lentic ecosystems with a predicted relative abundance of 28% (95% CI = 20–36%), followed by PP with 18% (95% CI = 13–23%) and PS with 7% (95% CI = 3–12%). Heterogeneity between studies was high (I2 = 80–89%) for the type of microplastic polymer. The p-value of Egger's test is not significant (PP Z = −1.51, p = 0.13; PE Z = −1.53, p = 0.13; PS Z = −0, 35, p = 0.72), which means that there is no asymmetry is the funnel plot (Fig. 3) and therefore no significant publication bias.
 | ||
| Fig. 3 Funnel plot for publication bias of microplastics polymers type. PE (polyethylene), PP (polypropylene) and PS (polystyrene). The white dots are the predictions of the trim and fill method. | ||
Prevalence of microplastics in the different distribution zones of lentic ecosystems and evaluation of sources of heterogeneity
The summary of the mean prevalence of the microplastic polymer type in the different distribution zones of lentic ecosystems is shown in Fig. 4. The mean prevalence data confirm that PE is the dominant type of microplastic that contaminates lentic ecosystems. This study found a mean prevalence for the surface water region of 28% for PE, 24% for PP and 9% for PS with narrow confidence intervals indicating less variation in effect size for this subgroup (Fig. S1–S3†). In the littoral sediment region, the mean prevalence remains similar to the surface water region with 27% for PE, and with lower proportions for PP (12%) and PS (5%). In the deep sediment region, the polymers that dominated were PE (24%) and PS (13%), this region presented a higher distribution of PS compared to the other regions, in this region the polymer with the less dominance was PP with a value of 11%. Although PE dominated in all regions of distribution in lentic ecosystems, its confidence interval for the deep sediment region was wide (95% CI = 0–70%), indicating a larger effect size for this region. This same effect was present for PS (95% CI = 0–70%) (Fig. S1 and S2†). For all regions, heterogeneity between studies was high for PE (I2 = 84–92%) and PS (I2 = 80–92%). PP polymer was the only polymer that showed variability in heterogeneity between studies, for surface water region was high (I2 = 83%), for littoral sediment region was medium (I2 = 66%) and for deep sediment region was low (I2 = 0%) (Fig. S3†).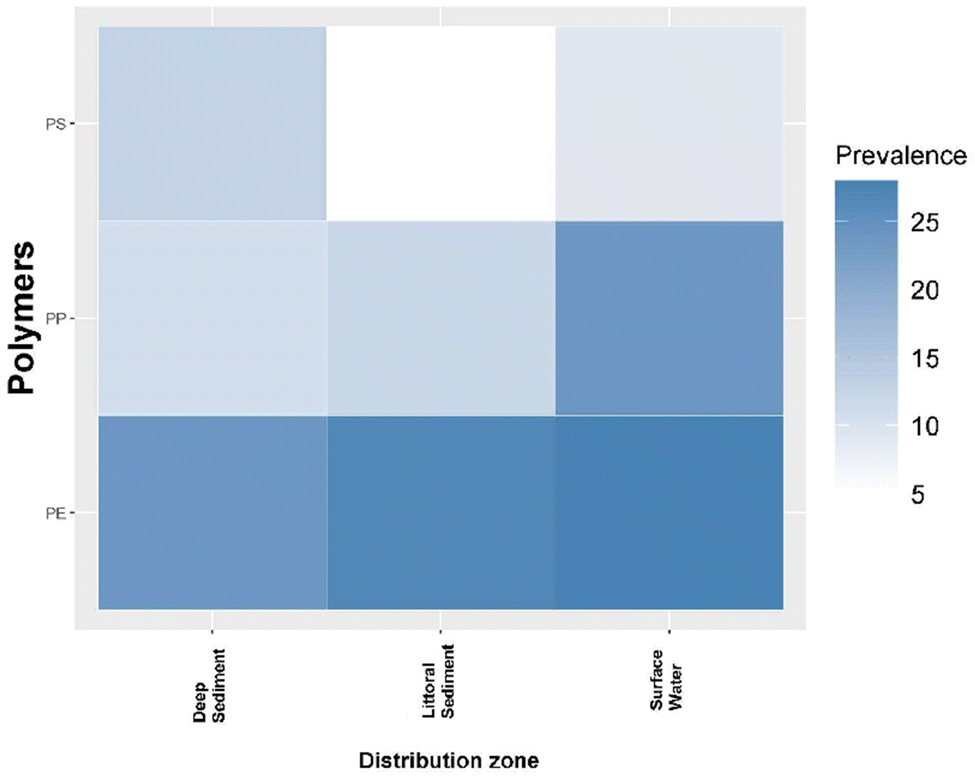 | ||
| Fig. 4 Prevalence of the types of microplastic polymers distributed in the different zones of lentic ecosystems. | ||
Possible sources of heterogeneity were evaluated with mixed-effects meta-regressions with four categorical moderators: geographic region where the study was conducted, microplastic extraction substance, sample collection season (dry or rainy), and sampling region (surface water, littoral sediment, and deep sediment). Meta-regression analysis for multivariate models (Table 1) found that some pooled and reduced models [model 1 (geographic region + extraction substance + sampling region + sampling season), model 2 (geographic region + extraction substance + sampling region), model 3 (geographic region + extraction substance) and model 4 (geographic region)] can explain part of the high heterogeneity presented in the mean prevalence of microplastic polymer types.
| Models | Polymers | LRT | p-Value | Test | R2 (%) |
|---|---|---|---|---|---|
| 1 | PP | 4 | 0.046 | 0.02 | 62.3 |
| PE | 0.83 | 0.36 | 0.22 | 12.9 | |
| PS | 1.5 | 0.21 | 0.004 | 65.2 | |
| 2 | PP | 2.9 | 0.22 | 0.01 | 54.7 |
| PE | 0.21 | 0.89 | 0.19 | 13.4 | |
| PS | 6.3 | 0.04 | 0.003 | 64.2 | |
| 3 | PP | 18 | 0.0012 | 0.01 | 52.1 |
| PE | 4.6 | 0.33 | 0.11 | 19.1 | |
| PS | 12.6 | 0.01 | 0.005 | 56.1 | |
| 4 | PP | 3.3 | 0.34 | 0.57 | 1.6 |
| PE | 8.1 | 0.04 | 0.04 | 17.2 | |
| PS | 13.8 | 0.03 | 0.005 | 35.4 |
For PP and PS, model 3 largely explains part of the high heterogeneity in the mean prevalence of these meta-analyses with a high value of R2 (52.1% and 56.1%, respectively). This model demonstrates that the mean effect size is affected by the covariate extraction substance, indicating the high variability of methodologies used between studies. The simplest model to explain part of the heterogeneity in the mean prevalence was model 4 for PE and PS (R2 = 17.2% and 35.4%, respectively) which includes a single significant moderator geographic region, indicating that this moderator could explain part of the heterogeneity presented in the mean prevalence of these polymers. Finally, the total heterogeneity could not be explained with the covariates addressed for this meta-analysis.
Model reduction by testing its significance for PP (polypropylene), PE (polyethylene) and PS (polystyrene) with likelihood ratio tests (LRT with its p-value), model validation with Permutation tests (test) and percentage of variation of the effect size contributed by each model R2. Model 1 (geographic region + extraction substance + sampling region + sampling season), model 2 (geographic region + extraction substance + sampling region), model 3 (geographic region + extraction substance) and model 4 (geographic region). Values in bold indicate the significance of the model in explaining part of the heterogeneity of the effect size.
Prevalence of polymers in the different areas of distribution of lentic ecosystems
The results obtained in the prevalence study of the different types of polymers found agree with the expected results, given that PE and PP represent 62% of the production of plastics worldwide.31 Geyer et al.32 reported that the largest microplastic fiber production groups were PE (36%) and PP (21%). Erni-Cassola et al.33 meta-analysis of marine and continental aquatic systems reported that the polymer types with the highest prevalence are PE, PP, PS and PP&A.In addition to the high production demand for these polymers in general, PE, PP and PET (polyethylene terephthalate) are the most used polymers in the textile industry.34 This fact is important when assessing the prevalence of MP, as Sanchez-Vidal et al.35 found that each textile garment releases between 1900 and 700![[thin space (1/6-em)]](https://www.rsc.org/images/entities/char_2009.gif) 000 microfibers in a single wash, which establishes domestic wastewater as a major source of contamination. Further evidence is given by Mason et al.,36 who reported that municipal effluent wastewater at 17 sampling points in the San Francisco Bay Area shed an average of 4 million microplastic particles per day into the environment. Suaria et al.37 found similar results in Mediterranean surface waters. Abidli et al.38 indicated that this pattern is due to the low density of PE and PP, which gives them buoyancy and in turn ease of transport. However, as shown in Fig. 3, the prevalence of PE, PP and PS remains almost constant in surface water, littoral sediment, and deep sediment regions. This has been analyzed by different authors, finding that there are several mechanisms by which low-density microplastics can move within the water column and even reach the sediment. These transport mechanisms can be physical, chemical, or biological.39–42
000 microfibers in a single wash, which establishes domestic wastewater as a major source of contamination. Further evidence is given by Mason et al.,36 who reported that municipal effluent wastewater at 17 sampling points in the San Francisco Bay Area shed an average of 4 million microplastic particles per day into the environment. Suaria et al.37 found similar results in Mediterranean surface waters. Abidli et al.38 indicated that this pattern is due to the low density of PE and PP, which gives them buoyancy and in turn ease of transport. However, as shown in Fig. 3, the prevalence of PE, PP and PS remains almost constant in surface water, littoral sediment, and deep sediment regions. This has been analyzed by different authors, finding that there are several mechanisms by which low-density microplastics can move within the water column and even reach the sediment. These transport mechanisms can be physical, chemical, or biological.39–42
Physical phenomena, specifically, clays can adhere to microplastic particles, because the negative charges of the silicate layers that make up the clays, adding greater density to the particles causing sinking. Although some types of polymers are characterized by their low density, in some cases additives to these materials through chemical processes (for specialized products) modify their physical properties, causing changes such as improved structural strength, added color, increased brightness, among others, that can generate increases in density, so these materials can be found in different sampling areas.43
Minerals also may be adsorbed on the surface of polymers while in the water column or on the lake bottom.43 Biological processes can affect the transport of particles through the water column by the ingestion and subsequent excretion of microplastics. This association with feces gives the particles a higher density that favors sedimentation along with their individual distribution to different areas.35,40,44
Heterogeneity assessment
The meta-analysis in general showed high heterogeneity for the prevalence of microplastics with I2 > 80%, all polymers evaluated presented significant Q value, rejecting the null hypothesis of homogeneity, both in the overall mean by typology and the mean by distribution groups. The moderating variables evaluated cannot fully explain these high degrees of heterogeneity. This implies that it would not be possible to generalize by averaging all the effect sizes of the individual studies as an overall effect size, due to their remarkable quantitative and conceptual heterogeneity, lacking representativeness when combining effect sizes of different natures.This heterogeneity may be due to the unevenness of ecosystems among themselves,45–47 to the current lack of a standardized sampling methodology,33,48,49 and the number of published studies for these ecosystems may be a potential source for this unexplained heterogeneity.50,51
Global distribution of microplastics in lentic ecosystems
Analysis of the mean prevalence of microplastic polymer type addressed in the meta-regressions indicated that geographic region is significant in explaining part of the heterogeneity in most typologies (Fig. S4–S6†). Although the percentage of heterogeneity reported by this covariate is not high enough (Table 1), the evidence shows that the geographic region can completely influence this high heterogeneity, as factors such as industrial and cultural activity vary greatly from one country to another. Fig. 5 shows the global distribution of the polymers evaluated in this review for lentic ecosystems. Few studies (n = 21) were found divided over 12 countries, which may substantially bias the actual result. Some studies reported inputs from industrial effluents and wastewater,43,52–54 others reported potential sources of pollution, such as activities developed in nearby areas, like agriculture, river traffic, industrial and fishing,42,55,56 and still others report tourism as the main source.55,57,58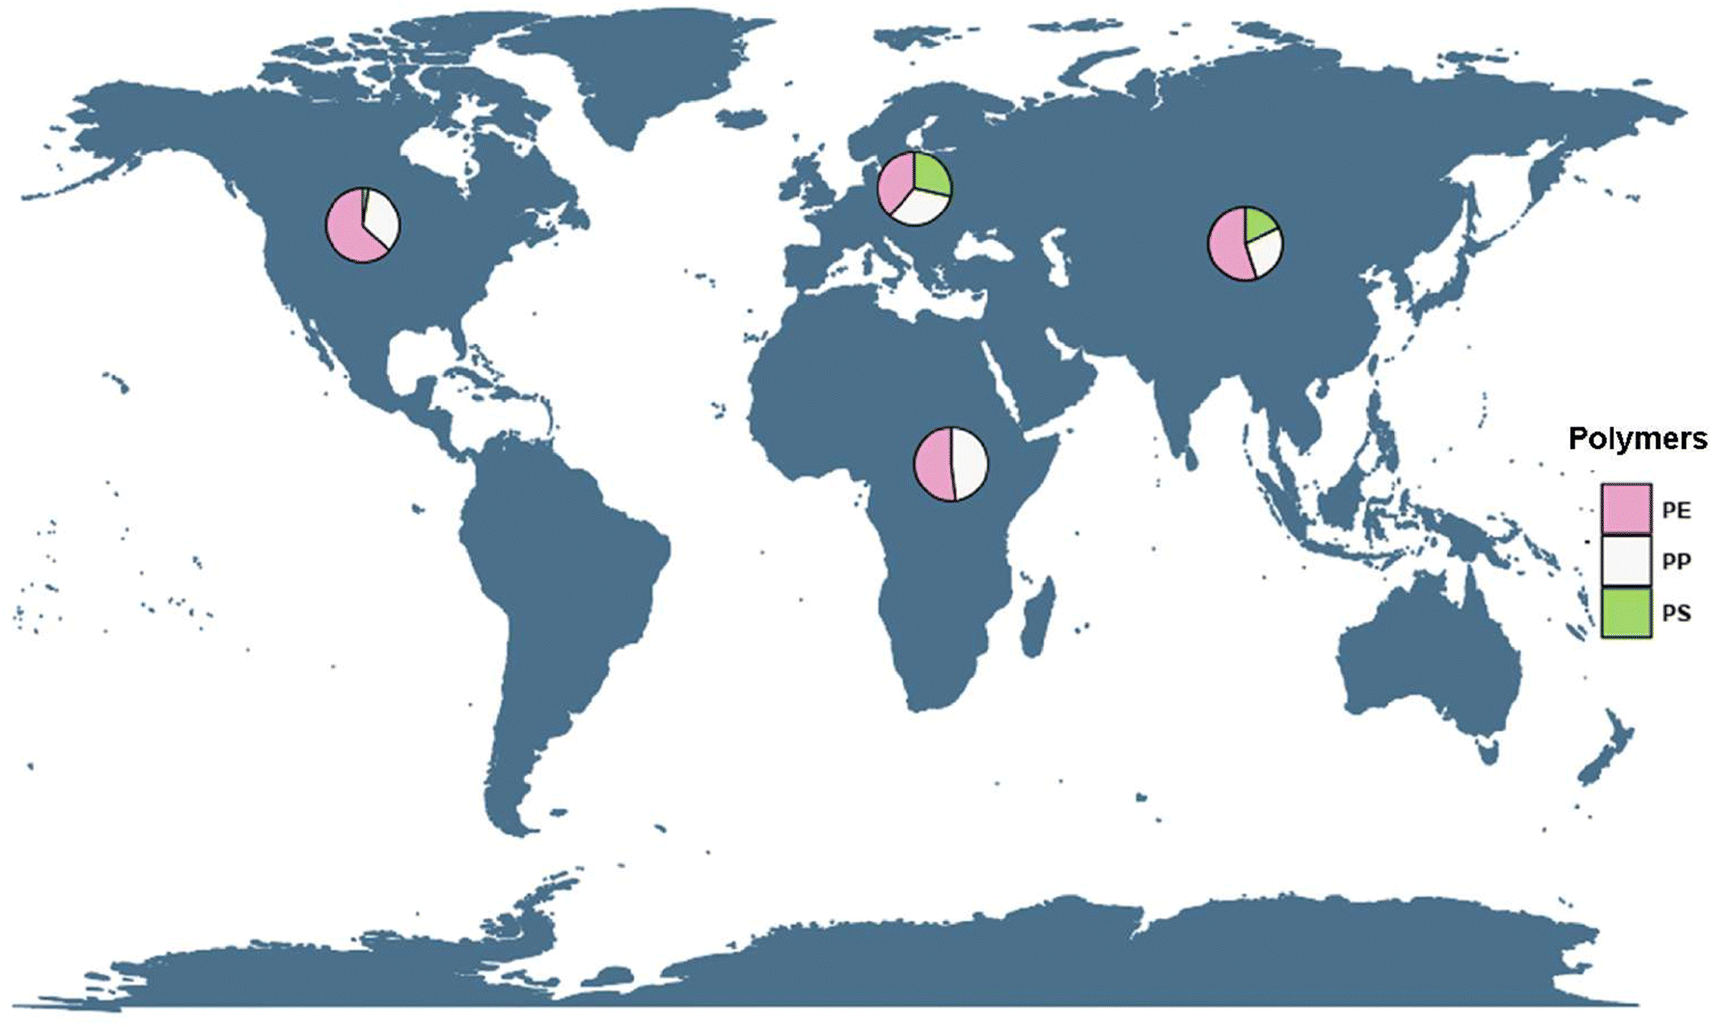 | ||
| Fig. 5 Global distribution of microplastic polymer types in lentic ecosystems. | ||
All reported ecosystems are surrounded by urban and rural areas except for Lake Kallavesi in Finland which is in a sparsely populated area57 and Lake Superior in the United States.59
The geographic region with the highest prevalence of microplastics was for North America, with two representatives: United States and Canada. However, the highest proportion is the one registered by the United States; the country with the largest studies of microplastics in its freshwater sources,51 but as this work shows its main efforts to evaluate this pollutant are based on the Laurentian Great Lakes, including Lake Ontario, which presented the largest number of investigations,60 its importance lies in the fact that these lakes are among the largest lakes worldwide and these are surrounded by industrial areas that are a major focus of pollution and evaluation of the impact exerted to these water bodies,61,62 being the majority of waste fibers, fragments and pellets. Generally, these microplastics are made up of PE (0.91–0.96 g cm−3) and PP (0.91 g cm−3), which are low density polymers and are mainly distributed on the water surface, as indicated by the meta-analysis performed in this study (Fig. 2), which may largely explain the concentration of these polymers for this region.63,64
PE and PP are mainly used as sandblasting and abrasive cleaning media in consumer products, and these lakes are bounded by large population concentrations.60–62,65 The resulting volumes of wastewater entering these lakes, even though treated in wastewater treatment plants (WWTP), are charged with fibers and microbeads that can pass the filters of these plants due to their small sizes (<1 mm). Many of these WWTP filters are composed of plastic materials such as polyethylene (PE), polyether sulfone (PES), polyvinyl chloride (PVC) and polyvinylidene fluoride (PVDF)62,66 which over time wear and liberate microplastic particles.
At the same time, the organic membranes of some WWTPs can represent a risk due to their wear, and the polarity of their walls that increases their size under exposure to certain cleaning agents (NaClO and NaOH) that can cause the leaching of microplastics as a contaminant into the aquatic environment.67,68 Polyethylene is so persistent in the environment that in relatively pristine lakes such as Lake Superior it still presents microplastic contaminants, mainly fibers. Although the abundance of these contaminants was low, essentially for microparticles (particles < 4 mm) of different origin (plastics and non-plastics), this contamination is attributed to the activities carried out in certain areas of this lake such as tourism, the residence time of the water mass within the lake, and the long life of these polymers.69
After North America, the geographic regions that accounted for high microplastic contamination in this analysis were Asia and Europe. The countries with the highest contribution were China,42,49,56,58,70 Italy71–73 and Spain.52 European plastics production for 2019 was 57.9 million tons with a reduction for 2018 of 6.3% in its annual production. The countries that presented the highest demand for this polymer were Germany, Italy, France, and Spain.7 The major pollutants were PE, PP, PS and PET. Although Europe manages its restriction policies for certain microplastics such as microbeads in cosmetics and other personal care products with a reduction of up to 80% in their use, microplastic contamination persists in the lentic environments of this geographical region.74 In Oceania, no studies were found that met the parameters used in this study.
China is the largest developing country in the world, by 2019 its annual plastic production was 368 million tons, equivalent to 31% of production worldwide. Thus China has the highest production of microplastics in the entire planet.7 Most of the studies there have been conducted in Dongting Lake and Taihu Lake, because these lakes are the largest in the country and are important sources of water input to the Yangtze River which is considered one of the most polluted rivers in the world.75 Despite this, the contamination found in Dongting Lake is moderate in the sediments, and somewhat high in the surface water,58 with sediment values similar to those of Taihu Lake.56
Most PE and PP compounds are present in the fragments and some fibers, but polystyrene (PS) was mainly found in the pellets. These lakes are surrounded by large industrial, rural and tourist areas. The greatest contamination of these lakes is represented by fibers, which may be because these lakes are potential fishing sources so that waste from nets can be deposited in these ecosystems, as well as the entry of wastewater from all sources.49,53,70,76 Taihu Lake presented the highest pollution of all the lakes evaluated.
The geographic region that contributed the lowest prevalence in the three types of polymers considered in this study was Africa, which coincides with the average abundance reports presented by Abidli et al.38 Egessa et al.55 and Migwi et al.76 The UN reports that African countries such as Kenya, Nigeria, Morocco, among others, have conducted a comprehensive campaign (#BeatPlasticPollution) which seeks to clean both terrestrial and aquatic ecosystems through processes of collection, recycling, and disposal of waste and plastic products.
In some cases, a ban on the manufacture and use of plastic bags has been implemented (UN, 2018).77 The few studies used for this meta-analysis,54,55,76 show that (i) microplastic contaminants are found in a similar prevalence among them, (ii) the interest in the investigation of these contaminants in lentic ecosystems is very little and very recent, and (iii) the African continent has only 9% of freshwater. Africa does have one of the largest lakes in the world (Lake Victoria) in which the major pollutant is PE, representing 60% of the plastic particles analyzed. This plastic waste is mostly secondary microplastics, occurring where the most populated areas had the highest concentration of this pollutant.55 Ox Bow Lake in Nigeria is located in the area with the worst plastic waste management in the world,78 and accordingly, this lake had the highest prevalence of microplastics as evidenced in this study.54
Physical characteristics in lentic ecosystems
Lentic ecosystems are considered potential sinks for microplastics,46 therefore the physical characteristics of each of the 34 lakes evaluated may contribute to the source of unexplained heterogeneity found in this study. These characteristics may modify the prevalence of microplastics, depending on the activities occurring around these areas.46,79Wind speed can influence the prevalence of polymers in different distribution zones. In lakes reporting high wind speeds, the prevalence is mainly modified in floating microplastics PP and PE because they have lower densities than freshwater (ρ < 1.0 g cm−3). Generally, these microplastics will be at the surface, and under these conditions can be transported by currents and waves to other distribution zones within the lake, such as shoreline sediments, or releasing the particles to another environment.80
In turn, shallow lakes generally have accumulations of organic matter on the surface, which can combine with microplastics of lower density, leading them to sink.56,80 Highly eutrophicated shallow lakes present higher rates of sediment re-suspension, with two important zones where such processes occur: the littoral and deep zones due to high winds and wave motion. These water bodies are dynamic systems in which there may be cycling and/or transport of microplastics, so these particles could be concentrated in a small area or diluted within larger areas or water volumes.79 Fischer et al.80 presented a good example in Lake Chiusi (Italy) which has severe eutrophication and rapid sedimentation.
The heterogeneity in the results could also be due to the different sampling seasons in which microplastics were collected by the different authors. Different studies have shown that seasons (rainy and dry) potentially influence mean microplastic concentrations that generate significant variations in sampling sites in these ecosystems.54,81 Corcoran et al.43 reported high amounts of microplastics during rainy seasons, which could suggest that with higher amounts of precipitation there will be a greater inflow that will transport larger amounts of debris into the water body. In the present study, an iteration analysis was performed, which compares the prevalence of microplastics between dry and rainy seasons, however, the results are not significant; this can be explained by the low number of comparable studies for the seasons (rainy and dry), as only one study evaluated this variable with the same methodology at the same sampling site.54
Even though the assessment data of domestic and/or industrial wastewater cited allow inferring a relationship between anthropization and the level of pollution. Free et al.79 suggest that because microplastics are persistent particles, due to their long degradation process,82 the time of accumulation of microplastics in each water body is determinant in the concentration of the specific type of pollution. Therefore, comparing lakes that have been waste recipients for 70 years with more recently contaminated lakes is not suitable for drawing conclusions. Additionally, Edo et al.52 emphasized that endorheic lagoons, fed by wastewater, that have no outflow to another aquatic system will have higher microplastics contamination values than water bodies fed by other sources.
Each of the above approaches leads to the conclusion that it is not relevant to conclude a direct relationship between a single possible source and the amount of pollution in lakes at the global level. Evaluation of the particularities in each area to provide a correct perspective on the origin of these pollutants is important. However, the review of the prevalence of each type of microplastics, and the evaluation of their origin and possible causes of predominance, provide a broader and more complete perspective to address the important problems that this type of pollution brings.
Heterogeneity between sampling methodologies
Heterogeneity among sampling methodologies is one of the most discussed issues in the majority of primary studies and systematic reviews. The lack of standardization among methodologies for microplastic extraction in both marine ecosystems33,34,83 and freshwater ecosystems46,47,84 is since such studies are still in the pioneer stage of gaining knowledge about microplastics in the environment.For the most part, no unified methods for the collection, sample treatment and identification of microplastics, have developed or been adopted. Some studies used in this meta-analysis followed the methodology of the National Oceanic and Atmospheric Administration NOAA,85 but all the studies had their respective modifications of this standard, depending on the objectives of the works and the inputs they presented.49,57,59,70
Sampling methodology
In our review, sampling methods were found to be highly variable for both water and sediment. Although water samples are mostly large in volume, these vary in extraction methodology: three studies extracted microplastics by means of a 0.45 μm pore size sapling net,61,71,73 and eight studies reported the use of trawl net with pore size between 300 to 355 μm.56–59,63,72,86,87 Another study used reduced samples (20–50 L) for microplastic extraction: bucket water collection with pore size of 75 μm;53 and flow sampler with pore size of 45 μm.76In the case of sediments, the collection variability is greater, for this reason sampling methodologies cannot be addressed in common for the present study. The result is an underestimation in the mean concentration and typological prevalence of microplastics for these ecosystems, as can be observed in the meta-analyses of the littoral region with I2 > 63% (Fig. S1–S3†). These studies can only be grouped by the initial sieving size for the collection of microplastic samples; with pore size 500 μm;72 other studies with pore size 350 μm,58 and microplastic extraction in sediment with smaller pore sizes 45 μm to 0.45 μm.42,52,54,55,61
Sampling methodologies in freshwater bodies are very important and influential in the prevalence of microplastic composition typologies, because more than 70% of polymers found in this study have a density greater than 1 g cm−3 and in most of these works only sampled microplastics at the water surface. A systematic review of microplastic methodologies in freshwater sediments report that mesh variability is a potential source of heterogeneity in the abundance and possibly prevalence of microplastics in lentic ecosystems because increasing pore size substantially reduces the concentration of microplastics found.88
Extraction methodology
For the processing of microplastics collected in the field, they must be separated from the type of sample of origin (water and sediment), either by filtration only, as is generally done in water samples, or separation by densities for sediment samples. The latter method consists of taking a subsample of sediment and mixing it with a substance of a defined density. The choice of the substance is subject to various factors such as economy, performance, and efficiency, among others. The purpose of this methodology is to extract microplastics from sediments with a substance of higher density than that normally found in the water bodies of origin.In this study, the covariate type of densities was found to be significant in the evaluation of the meta-regressions (Table 1), explaining part of the heterogeneity in the prevalence of these polymers. Five different density types were found for the extraction of microplastics in sediments, the densities used were as follows: lithium tungstate (Li2WO4)44 with ρ = 3.2 g cm−3, sodium chloride (NaCl)43,52,55,56,59,71,80,89–91 with ρ = 1.2 g cm−3, sodium iodide (NaI)54 with ρ = 1.6 g cm−3, sodium polytungstate (SPT)61 with ρ = 1.5 g cm−3, and zinc chloride (ZnCl2)58,70,72,79 with ρ = 1.5 g cm−3.
Sodium chloride (NaCl) is the most widely used substance for the extraction of microplastics from sediment samples in lentic and marine ecosystems, due to its low cost, easy acquisition and environmental friendliness, but NaCl can present difficulties as it is not efficient in recovering high-density polymeric particles (ρ > 1.2 g cm−3), which leads to reporting biased prevalence of microplastics.59 In addition, this method requires a higher number of washes per sample (minimum 3) to increase extraction efficiency. Despite these disadvantages, sodium chloride was identified as the most used compound; in turn it presented the highest efficacy in the diversity of polymers recovered (n = 17).52 Sodium polytungstate (SPT), like NaCl, is environmentally friendly and has high recovery rates. Although SPT was evaluated in only one study, it presented a high diversity in the recovery of different types of polymers (n = 13). SPT's main disadvantage is the high cost, generating a decrease in the use of this compound in most research.87
Another substance for the extraction of microplastics in sediment is sodium iodide (NaI), which separates polymers of high density (1.6 g cm−3). This substance is highly recommended for its high recovery rate with 99%, and polymers of higher density are recovered as compared to NaCl. This salt requires a single washing of the sediment. NaI is mainly recommended for use in elutriation columns, and can be reused in up to ten cycles, through evaporation and elevation stages, making its price comparable to that of NaCl. The main disadvantages of this substance are: (1) it is environmentally unfriendly, so special care must be taken during use and disposal, and (2) it reacts with cellulose, generating dark and sometimes confusing identifications when using filters with this composition. The use of ZnCl2 as a separation fluid presents a recovery rate of 100% for large macro- and microplastics (>1 mm), and a rate of 95.5 ± 1.8% for microplastics (<1 mm). This substance is environmentally harmful, therefore it must be handled with care, as with NaI and Li2WO4.72
Heterogeneity of studies
Research on microplastics in freshwater bodies has been increasing since about 2015.51 In our analysis, 229 studies were initially found, but only 21 met the selection criteria to address the study of the prevalence of microplastic typologies. Most studies were discarded due to the absence of concise data on the number of particles found and their respective typological classifications. This result is comparable to an analysis by Blettler et al.92 in which they found only 13% of the freshwater microplastic reports met their search criteria. At the same time, they showed that the average number of studies on freshwater bodies varied from marine microplastic studies with a publication rate of 7 out of 41 studies focused on marine water sources. Freshwater bodies are potential sources of microplastics research because of very different characteristics of these ecosystems from each other. The absence or paucity of information in many countries on the status of their water sources generates a knowledge bias in trying to establish the global behaviour of microplastic typologies in lentic ecosystems. Therefore, this absence of information is considered as an unexplained, but potential, source of the heterogeneity presented in our study.Note that lentic ecosystems commonly present a high variability in the sample variance because some sampling zones are surrounded by industrial areas and/or high population density, and are receptors of WWTP, as well as other inputs. The high heterogeneity also may be related to the fact that many studies have large sample sizes, which are considered outliers for the mean value of prevalence.
Conclusions
In conclusion, the present study sheds light on the prevalence of various microplastic polymer types in different distribution zones of lentic ecosystems, emphasizing the dominance of PE, PP, and PS. These findings align with global polymer production rates, which contribute to the ubiquity of these plastics in aquatic environments. The study also highlights the significant role of geographic regions in microplastic prevalence, with North America, Asia, and Europe experiencing the highest contamination levels due to industrial activities and other anthropogenic factors.This study emphasizes the importance of understanding the unique physical characteristics of lentic ecosystems, such as wind speed, depth, and eutrophication, as well as the impact of seasonal variations and human activities on microplastic distribution. Additionally, the need for methodological standardization in microplastics research and the development of standardized sampling and extraction techniques is crucial to accurately assess microplastic prevalence and address the high heterogeneity found in the data.
Moreover, the scarcity of studies that meet the selection criteria underscores the need for more comprehensive research on microplastics in freshwater ecosystems, particularly in regions with high population densities or industrial activities. This knowledge gap highlights the importance of expanding research efforts to gain a more accurate understanding of global microplastic behaviour in lentic ecosystems, which will in turn facilitate the development of effective mitigation strategies.
To sum up, further research on microplastics in lentic ecosystems is essential, considering the unique physical characteristics and anthropogenic influences present in each ecosystem. By standardizing sampling and extraction methodologies, researchers can generate more accurate and comparable data on microplastic prevalence in these ecosystems. Ultimately, a more comprehensive understanding of microplastics in lentic ecosystems will help inform policy interventions, global collaboration, and the development of effective strategies to mitigate this emerging environmental threat.
Author contributions
Project conceptualization, methodology, and supervision, N. R-B., A. G. C., V. A. A., and J. T.; administration, funding acquisition, V. A. A., and J. T.; methodology, investigation, data analysis, L. M.-P., L. B.-D., N. R.-B., A. G. C., V. A. A., and J. T.; writing – original draft preparation, L. M-P., and L. B.-D.; writing – review and editing, N. R.-B., A. G. C., V. A. A., and J. T. All authors contributed to the discussion, reviews, and approval of the manuscript for publication.Conflicts of interest
There are no conflicts to declare.Acknowledgements
This work is a contribution from “Geología, Geofísica y Procesos Marino-Costeros”, “Investigación Ciencias, Educación y Tecnología-CETIC” and “Investigación en Compuestos Heterocíclicos”. We recognize the institutional support of the Universidad del Atlántico and MINCIENCIAS (Ministerio de Ciencia, Tecnología e Innovación).Notes and references
- I. Aoki, Entropy Principle for the Development of Complex Biotic Systems, the Earth, Elsevier, 2012 Search PubMed.
- Millennium Ecosystem Assessment, Ecosystems and Human Well-Being: Synthesis, Island Press, 2005 Search PubMed.
- N. Rangel-Buitrago, Coastal Scenery: Evaluation and Management, Springer, Amsterdam, 2019 Search PubMed.
- A. L. Andrady, Mar. Pollut. Bull., 2011, 62, 1596, DOI:10.1016/j.marpolbul.2011.05.030.
- A. L. Andrady and M. A. Neal, Philos. Trans. R. Soc. London, Ser. B, 2009, 364, 1977, DOI:10.1098/rstb.2008.0304.
- K. Law and R. C. Thompson, Science, 2014, 345, 144, DOI:10.1126/science.1254065.
- PlasticsEurope, Plastics – the Facts 2020. An Analysis of European Plastics Production, Demand, and Waste Data, EPRO, 2020, https://www.plasticseurope.org/es/resources/publications/4312-plastics-facts-2020 Search PubMed.
- A. Cózar, F. Echevarría, J. I. González-Gordillo, X. Irigoien, B. Úbeda, S. Hernández-León, Á. T. Palma, S. Navarro, J. García-de-Lomas, A. Ruiz, M. L. Fernández-de-Puelles and C. M. Duarte, Proc. Natl. Acad. Sci. U.S.A., 2014, 111, 10239, DOI:10.1073/pnas.1314705111.
- United States Environmental Protection Agency [USEPA], Plastic Pellets in the Aquatic Environment: Sources and Recommendations. EPA Oceans and Coastal Protection Division Report 842-B-92-010, EPA, Washington, DC, 1992, DOI:10.1017/CBO9781107415324.004.
- L. S. Fendall and M. A. Sewell, Mar. Pollut. Bull., 2009, 58, 1225, DOI:10.1016/j.marpolbul.2009.04.025.
- V. Zitko and M. Hanlon, Mar. Pollut. Bull., 1991, 22, 41, DOI:10.1016/0025-326X(91)90444-W.
- M. A. Browne, P. Crump, S. J. Niven, E. Teuten, A. Tonkin, T. Galloway and R. Thompson, Environ. Sci. Technol., 2011, 45, 9175, DOI:10.1021/es201811s.
- P. Vermeiren, C. C. Muñoz and K. Ikejima, Mar. Pollut. Bull., 2016, 113, 7, DOI:10.1016/j.marpolbul.2016.10.002.
- A. Tursi, M. Baratta, T. Easton, E. Chatzisymeon, F. Chidichimo, M. De Biase and G. De Filpo, RSC Adv., 2022, 12, 28318, 10.1039/d2ra04713f.
- E. Watt, M. Picard, B. Maldonado, M. A. Abdelwahab, D. F. Mielewski, L. T. Drzal, M. Misra and A. K. Mohanty, RSC Adv., 2021, 11, 21447, 10.1039/d1ra00353d.
- M. C. M. Blettler, E. Abrial, F. R. Khan, N. Sivri and L. A. Espinola, Water Res., 2018, 143, 416, DOI:10.1016/j.watres.2018.06.015.
- M. Wagner, C. Scherer, D. Alvarez-Muñoz, N. Brennholt, X. Bourrain, S. Buchinger, E. Fries, C. Grosbois, J. Klasmeier, T. Marti, S. Rodriguez-Mozaz, R. Urbatzka, A. D. Vethaak, M. Winther-Nielsen and G. Reifferscheid, Environ. Sci. Eur., 2016, 26, 12, DOI:10.1186/s12302-014-0012-7.
- N. Rangel-Buitrago, A. Gracia C., A. Vélez-Mendoza, E. Mantilla-Barbosa, V. Arana, J. Trilleras and H. Arroyo-Olarte, Mar. Pollut. Bull., 2018, 136, 435, DOI:10.1016/j.marpolbul.2018.09.040.
- S. Du, R. Zhu, Y. Cai, N. Xu, P.-S. Yap, Y. Zhang, Y. He and Y. Zhang, RSC Adv., 2021, 11, 15762, 10.1039/d1ra00880c.
- R. C. Paule and J. Mandel, J. Res. Natl. Bur. Stand., 1982, 87, 377, DOI:10.6028/jres.087.022.
- W. G. Cochran, Biometrics, 1954, 10, 417–451, DOI:10.2307/3001616.
- J. P. T. Higgins and S. G. Thompson, Statist. Med., 2002, 21, 1539, DOI:10.1002/sim.1186.
- R. D. Riley, J. P. T. Higgins and J. J. Deeks, BMJ, 2011, 342, d549, DOI:10.1136/bmj.d549.
- R Core Team, R: A language and environment for statistical computing (4.0.2). R Foundation for Statistical Computing, 2020, https://www.r-project.org/ Search PubMed.
- S. Balduzzi, G. Rücker and G. Schwarzer, BMJ Mental Health, 2019, 22, 153, DOI:10.1136/ebmental-2019-300117.
- W. Viechtbauer, J. Stat. Softw., 2010, 36, 1, DOI:10.18637/jss.v036.i03.
- J. Ooms, magick: Advanced Graphics and Image-Processing in R. R package version (2.4.0), 2020, https://cran.r-project.org/package=magick Search PubMed.
- D. Kahle and H. Wickham, ggmap: Spatial Visualization with ggplot2, R J., 2013, 5(1), 144 CrossRef , https://journal.r-project.org/archive/2013-1/kahle-wickham.pdf.
- H. Wickham and D. Seidel, Scales: Scale Functions for Visualization (1.1.1), https://cran.r-project.org/package=scales Search PubMed.
- V. Gómez-Rubio, ggplot2 - Elegant Graphics for Data Analysis (2nd edition), J. Stat. Softw., 2017, 77(Book Review 2), 1–3, DOI:10.18637/jss.v077.b02.
- A. L. Andrady, Plastics and Environmental Sustainability, J. Wiley & Sons, ed., Wiley, 2015 Search PubMed.
- R. Geyer, J. R. Jambeck and K. L. Law, Sci. Adv., 2017, 3, e1700782, DOI:10.1126/sciadv.1700782.
- G. Erni-Cassola, V. Zadjelovic, M. I. Gibson and J. A. Christie-Oleza, J. Hazard. Mater., 2019, 369, 691, DOI:10.1016/j.jhazmat.2019.02.067.
- L. Fok, T. W. L. Lam, H. X. Li and X. R. Xu, Sci. Total Environ., 2020, 718, 135371, DOI:10.1016/j.scitotenv.2019.135371.
- A. Sanchez-Vidal, R. C. Thompson, M. Canals and W. P. De Haan, PLoS One, 2018, 13, e0207033, DOI:10.1371/journal.pone.0207033.
- S. A. Mason, L. Kammin, M. Eriksen, G. Aleid, S. Wilson, C. Box, N. Williamson and A. Riley, J. Great Lakes Res., 2016, 42, 753, DOI:10.1016/j.jglr.2016.05.009.
- G. Suaria, C. G. Avio, A. Mineo, G. L. Lattin, M. G. Magaldi, G. Belmonte, C. J. Moore, F. Regoli and S. Aliani, Sci. Rep., 2016, 6, 37551, DOI:10.1038/srep37551.
- S. Abidli, Y. Lahbib and N. Trigui El Menif, Mar. Pollut. Bull., 2019, 142, 243, DOI:10.1016/j.marpolbul.2019.03.048.
- A. Bour, A. Haarr, S. Keiter and K. Hylland, Environ. Pollut., 2018, 236, 652, DOI:10.1016/j.envpol.2018.02.006.
- N. Ory, C. Chagnon, F. Felix, C. Fernández, J. L. Ferreira, C. Gallardo, O. Garcés Ordóñez, A. Henostroza, E. Laaz, R. Mizraji, H. Mojica, V. Murillo Haro, L. Ossa Medina, M. Preciado, P. Sobral, M. A. Urbina and M. Thiel, Mar. Pollut. Bull., 2018, 127, 211, DOI:10.1016/j.marpolbul.2017.12.016.
- X. Qu, L. Su, H. Li, M. Liang and H. Shi, Sci. Total Environ., 2018, 621, 679, DOI:10.1016/j.scitotenv.2017.11.284.
- W. Wang, W. Yuan, Y. Chen and J. Wang, Sci. Total Environ., 2018, 633, 539, DOI:10.1016/j.scitotenv.2018.03.211.
- P. L. Corcoran, T. Norris, T. Ceccanese, M. J. Walzak, P. A. Helm and C. H. Marvin, Environ. Pollut., 2015, 204, 17, DOI:10.1016/j.envpol.2015.04.009.
- A. K. Baldwin, A. R. Spanjer, M. R. Rosen and T. Thom, PLoS One, 2020, 15(5), e0228896, DOI:10.1371/journal.pone.0228896.
- C. Li, R. Busquets and L. C. Campos, Sci. Total Environ., 2020, 707, 135578, DOI:10.1016/j.scitotenv.2019.135578.
- J. K. H. Wong, K. K. Lee, K. H. D. Tang and P. S. Yap, Sci. Total Environ., 2020, 719, 137512, DOI:10.1016/j.scitotenv.2020.137512.
- L. Yang, Y. Zhang, S. Kang, Z. Wang and C. Wu, Sci. Total Environ., 2021, 754, 141948, DOI:10.1016/j.scitotenv.2020.141948.
- V. Hidalgo-Ruz, L. Gutow, R. C. Thompson and M. Thiel, Environ. Sci. Technol., 2012, 46, 3060, DOI:10.1021/es2031505.
- C. Li, Y. Gan, J. Dong, J. Fang, H. Chen, Q. Quan and J. Liu, Chemosphere, 2020, 253, 126740, DOI:10.1016/j.chemosphere.2020.126740.
- G. Kutralam-Muniasamy, F. Pérez-Guevara, I. Elizalde-Martínez and V. C. Shruti, Environ. Pollut., 2020, 267, 115463, DOI:10.1016/j.envpol.2020.115463.
- L. Yao, L. Hui, Z. Yang, X. Chen and A. Xiao, Chemosphere, 2020, 245, 125627, DOI:10.1016/j.chemosphere.2019.125627.
- C. Edo, M. González-Pleiter, M. Tamayo-Belda, F. E. Ortega-Ojeda, F. Leganés, F. Fernández-Piñas and R. Rosal, Sci. Total Environ., 2020, 729, 138824, DOI:10.1016/j.scitotenv.2020.138824.
- R. Mao, Y. Hu, S. Zhang, R. Wu and X. Guo, Sci. Total Environ., 2020, 723, 137820, DOI:10.1016/j.scitotenv.2020.137820.
- B. A. Oni, A. O. Ayeni, O. Agboola, T. Oguntade and O. Obanla, Ecotoxicol. Environ. Saf., 2020, 198, 110656, DOI:10.1016/j.ecoenv.2020.110656.
- R. Egessa, A. Nankabirwa, R. Basooma and R. Nabwire, Environ. Pollut., 2020, 257, 113442, DOI:10.1016/j.envpol.2019.113442.
- L. Su, Y. Xue, L. Li, D. Yang, P. Kolandhasamy, D. Li and H. Shi, Environ. Pollut., 2016, 216, 711, DOI:10.1016/j.envpol.2016.06.036.
- E. Uurasjärvi, S. Hartikainen, O. Setälä, M. Lehtiniemi and A. Koistinen, Water Environ. Res., 2019, 92, 149, DOI:10.1002/wer.1229.
- L. Yin, X. Wen, C. Du, J. Jiang, L. Wu, Y. Zhang, Z. Hu, S. Hu, Z. Feng, Z. Zhou, Y. Long and Q. Gu, Chemosphere, 2020, 244, 125486, DOI:10.1016/j.chemosphere.2019.125486.
- E. Hendrickson, E. C. Minor and K. Schreiner, Environ. Sci. Technol., 2018, 52, 1787, DOI:10.1021/acs.est.7b05829.
- A. G. J. Driedger, H. H. Dürr, K. Mitchell and P. Van Cappellen, J. Great Lakes Res., 2015, 41, 9, DOI:10.1016/j.jglr.2014.12.020.
- A. Ballent, P. L. Corcoran, O. Madden, P. A. Helm and F. J. Longstaffe, Mar. Pollut. Bull., 2016, 110, 383, DOI:10.1016/j.marpolbul.2016.06.037.
- M. Eriksen, S. Mason, S. Wilson, C. Box, A. Zellers, W. Edwards, H. Farley and S. Amato, Mar. Pollut. Bull., 2013, 77, 177, DOI:10.1016/j.marpolbul.2013.10.007.
- S. A. Mason, J. Daily, G. Aleid, R. Ricotta, M. Smith, K. Donnelly, R. Knauff, W. Edwards and M. J. Hoffman, J. Great Lakes Res., 2020, 46, 277, DOI:10.1016/j.jglr.2019.12.012.
- J. M. Whitaker, T. N. Garza and A. M. Janosik, Limnologica, 2019, 78, 125711, DOI:10.1016/j.limno.2019.125711.
- J. D. Costello and J. R. Ebert, J. Great Lakes Res., 1754, 220, 46, DOI:10.1016/j.jglr.2020.08.001.
- J. F. Ding, J. X. Li, C. J. Sun, C. F. He, F. H. Jiang, F. L. Gao and L. Zheng, Chin. J. Inorg. Anal. Chem., 2018, 46, 690, DOI:10.1016/S1872-2040(18)61086-2.
- M. F. Rabuni, N. M. Nik Sulaiman, M. K. Aroua, C. Yern Chee and N. Awanis Hashim, Chem. Eng. Sci., 2015, 122, 426, DOI:10.1016/j.ces.2014.09.053.
- S. Robinson, S. Z. Abdullah, P. Bérubé and P. Le-Clech, J. Membr. Sci., 2016, 503, 177, DOI:10.1016/j.memsci.2015.12.033.
- E. C. Minor, R. Lin, A. Burrows, E. M. Cooney, S. Grosshuesch and B. Lafrancois, Sci. Total Environ., 2020, 744, 140824, DOI:10.1016/j.scitotenv.2020.140824.
- C. Jiang, L. Yin, X. Wen, C. Du, L. Wu, Y. Long, Y. Liu, Y. Ma, Q. Yin, Z. Zhou and H. Pan, Int. J. Environ. Res. Public Health, 2018, 15, 2164, DOI:10.3390/ijerph15102164.
- A. Corti, V. Vinciguerra, V. Iannilli, L. Pietrelli, A. Manariti, S. Bianchi, A. Petri, M. Cifelli, V. Domenici and V. Castelvetro, Sustainability, 2020, 12, 878, DOI:10.3390/su12030878.
- H. K. Imhof, C. Laforsch, A. C. Wiesheu, J. Schmid, P. M. Anger, R. Niessner and N. P. Ivleva, Water Res., 2016, 98, 64, DOI:10.1016/j.watres.2016.03.015.
- M. Sighicelli, L. Pietrelli, F. Lecce, V. Iannilli, M. Falconieri, L. Coscia, S. Di Vito, S. Nuglio and G. Zampetti, Environ. Pollut., 2018, 236, 645, DOI:10.1016/j.envpol.2018.02.008.
- L. Anagnosti, A. Varvaresou, P. Pavlou, E. Protopapa and V. Carayanni, Mar. Pollut. Bull., 2021, 162, 111883, DOI:10.1016/j.marpolbul.2020.111883.
- L. C. M. Lebreton, J. Van Der Zwet, J. W. Damsteeg, B. Slat, A. Andrady and J. Reisser, Nat. Commun., 2017, 8, 15611, DOI:10.1038/ncomms15611.
- F. K. Migwi, J. A. Ogunah and J. M. Kiratu, Environ. Toxicol. Chem., 2020, 39, 765–774, DOI:10.1002/etc.4677.
- UN, Africa is on the right path to eradicate plastics, In Ecosystems and Biodiversity, 2018, https://www.unep.org/news-and-stories/story/africa-right-path-eradicate-plastics Search PubMed.
- O. S. Alimi, O. O. Fadare and E. D. Okoffo, Sci. Total Environ., 2021, 755, 142422, DOI:10.1016/j.scitotenv.2020.142422.
- C. M. Free, O. P. Jensen, S. A. Mason, M. Eriksen, N. J. Williamson and B. Boldgiv, Mar. Pollut. Bull., 2014, 85, 156, DOI:10.1016/j.marpolbul.2014.06.001.
- E. K. Fischer, L. Paglialonga, E. Czech and M. Tamminga, Environ. Pollut., 2016, 213, 648, DOI:10.1016/j.envpol.2016.03.012.
- H. Nel, S. Krause, G. H. Sambrook Smith and I. Lynch, MethodsX, 2019, 6, 2656, DOI:10.1016/j.mex.2019.11.007.
- A. L. Andrady, Mar. Pollut. Bull., 2011, 62, 1596, DOI:10.1016/j.marpolbul.2011.05.030.
- J. Lin, X. P. Xu, B. Y. Yue, Y. Li, Q. Z. Zhou, X.-M. Xu, J. Z. Liu, Q. Q. Wang and J. H. Wang, Sci. Total Environ., 2021, 760, 144316, DOI:10.1016/j.scitotenv.2020.144316.
- Y. Zhang, J. Liang, G. Zeng, W. Tang, Y. Lu, Y. Luo, W. Xing, N. Tang, S. Ye, X. Li and W. Huang, Sci. Total Environ., 2020, 705, 135979, DOI:10.1016/j.scitotenv.2019.135979.
- J. Masura, J. Baker, G. Foster, C. Arthur and C. Herring, Laboratory methods for the analysis of microplastics in the marine environment: recommendations for quantifying synthetic particles in waters and sediments, NOAA Technical Memorandum NOS-OR&R-48, NMFS Scientific Publications Office, Seattle, WA, 2015, https://marinedebris.noaa.gov/technical-memorandum/laboratory-methods-analysis-microplastics-marine-environment Search PubMed.
- M. González-Pleiter, D. Velázquez, C. Edo, O. Carretero, J. Gago, Á. Barón-Sola, L. E. Hernández, I. Yousef, A. Quesada, F. Leganés, R. Rosal and F. Fernández-Piñas, Sci. Total Environ., 2020, 722, 137904, DOI:10.1016/j.scitotenv.2020.137904.
- S. Turner, A. A. Horton, N. L. Rose and C. Hall, J. Paleolimnol., 2019, 61, 449, DOI:10.1007/s10933-019-00071-7.
- J. Li, H. Liu and J. P. Chen, Water Res., 2018, 137, 362, DOI:10.1016/j.watres.2017.12.056.
- M. Blettler, M. Ulla, A. Rabuffetti and N. Garello, Environ. Monit. Assess., 2017, 189, 581, DOI:10.1007/s10661-017-6305-8.
- T. Irfan, S. Khalid, M. Taneez and M. Hashmi, Environ. Sci. Pollut. Res., 2020, 27, 15083, DOI:10.1007/s11356-020-07833-1.
- L. Su, H. Cai, P. Kolandhasamy, C. Wu, C. Rochman and H. Shi, Environ. Pollut., 2018, 234, 347, DOI:10.1016/j.envpol.2017.11.075.
- M. C. M. Blettler, E. Abrial, F. R. Khan, N. Sivri and L. A. Espinola, Water Res., 2018, 143, 416, DOI:10.1016/j.watres.2018.06.015.
Footnote |
| † Electronic supplementary information (ESI) available. See DOI: https://doi.org/10.1039/d3ra04016j |
| This journal is © The Royal Society of Chemistry 2023 |