 Open Access Article
Creative Commons Attribution 3.0 Unported Licence
Enhanced electrochemical performance of the MoS2/Bi2S3 nanocomposite-based electrode material prepared by a hydrothermal method for supercapacitor applications
Kamal Batcha Mohamed Ismailab,
Manoharan Arun Kumar *a,
Ramasamy Jayavel
 c,
Mukannan Arivanandhan
 c and
Mohamed Abubakkar Mohamed Ismailc
aDepartment of Electrical, Electronics & Communication Engineering, School of Technology, Gandhi Institute of Technology and Management (GITAM), Bengaluru-561 203, India. E-mail: manokavi2011@gmail.com; mohamedismailmk@gmail.com; Tel: +91-7708587758
bDepartment of Electronics & Communication Engineering, Agni College of Technology, Chennai-600 130, Tamil Nadu, India
cCentre for Nanoscience and Technology, Anna University, Chennai-600 025, Tamil Nadu, India
First published on 14th August 2023
Abstract
Supercapacitors are widely used energy storage systems in the modern world due to their excellent electrochemical performance, fast charging capability, easy handling, and high power density. In the present work, pure MoS2 and MoS2/Bi2S3 nanocomposites with different compositions of bismuth were synthesized by the hydrothermal method. The structural properties of the electrode materials were studied using the XRD technique, which confirmed the formation of MoS2 and the secondary phase of Bi2S3 while increasing Bi substitution. The morphological studies of the synthesized electrode materials were performed using SEM, TEM, and HRTEM techniques, which indicated the 3D layered hierarchical structure of MoS2 nanospheres and the nanosheet-like structure of Bi2S3. The electrochemical properties of pristine MoS2 and MoS2/Bi2S3 nanocomposites were analysed by CV, CP, and EIS techniques using a 2 M KOH electrolyte in a three-electrode system. The CV curves show evidence of significant improvement in the electrochemical performance of MoS2/Bi2S3 composites compared to that of pure MoS2. The calculated specific capacitances of MoS2/Bi2S3 nanocomposites were relatively higher than those of pristine MoS2. The 20 mol% Bi added sample showed a maximum specific capacitance of 371 F g−1, compared to pristine MoS2 and other samples at a current density of 1 A g−1. The kinetics of the electrochemical process was studied. The Nyquist plots indicated that the Bi-added nanocomposites had lower Resr and RCT values, which resulted in high electrochemical performance. The experimental results revealed that Bi-substitution can further enhance the electrochemical energy storage performance of MoS2 for supercapacitor applications.
1. Introduction
Recent studies in nanotechnology have paved the way for designing and preparing various nanostructured materials. These materials have the potential to revolutionize numerous industries by offering improved performance, new functionality, and unprecedented control over material properties. Nanostructured materials will dominate future energy storage and conversion technology, particularly supercapacitors, Li-ion batteries, thermoelectrics, and photovoltaic applications.1–4 The supercapacitor is remarkably used as energy storage devices because of their capability to achieve high energy density than typical capacitors and high power density than Li-ion batteries. Typically, supercapacitors bridge the gap between conventional capacitors and batteries, which offers high capacitance, fast charging, slow discharging, more extended life cycles, high stability, superior performance at low temperatures, less weight, and cost-effectiveness. The storage capacity of supercapacitors is primarily determined by the surface area and pore structure of electrodes, which affects the available electrode–electrolyte interface for charge storage. Supercapacitors excel in applications requiring rapid energy transfer and high power output. The high self-discharge rate and lower energy density compared to batteries are the challenges in supercapacitors, which restrict their lower voltage applications.5,6Supercapacitors store energy through two behaviours, such as electric double-layer capacitance (EDLC) and pseudo capacitance. In EDLC supercapacitors, the electrode material stores the charges through electrostatic adsorption and desorption of electrolyte ions. At the surface of electrodes, there is no electrical charge transfer between electrodes and electrolytes.7,8 EDLC supercapacitors have high power density and good cyclic stability. Low-dimensional carbon-based materials such as graphene, carbon nanotubes, graphene oxides, and reduced graphene oxides have good EDLC behaviour.9–12 Pseudocapacitance is an electrochemical phenomenon where the existence of fast sequences of adsorption and intercalation charge transfers with reversible structural modifications resulted in high charge storage capacity. The fast electron charge transfer takes place due to a reversible oxidation and reduction reaction on the surface of the electrode and electrolyte interface, which produces a faradaic capacitive type current. Conducting polymers, metal oxides, and metal sulphides have delivered a profound pseudocapacitive behaviour.13 The specific capacitance of these electrochemical capacitors is 10–100 times greater than carbon-based electrode materials for supercapacitor applications.14
Various kinds of nanostructured electrode materials are employed in supercapacitor applications, wherein, two-dimensional layered materials have a large surface area, which allows maximum active sites on the surface, more flexibility, and high chemical and thermal stability. Hence, 2D materials are highly suitable as electrodes for electrochemical capacitors. Transition metal dichalcogenides (TMDs) have good catalytic and electrochemical performance because of their high conductivity among various 2D materials beyond graphene.15,16 The general formulas for TMDs are AB2, where the term A refers to transition metals, and the term B refers to chalcogen elements such as sulphur, selenium, and tellurium. In the crystal structure of TMDs, the layers of transition metal atoms were sandwiched between the layers of chalcogen atoms.17 The majority of TMDs have the capacity to exist in more than one crystal structure, notably the semiconducting (2H) and semimetal (1T) phases, and have physical and chemical properties that vary with thickness. Each layer in the TMD structures is weakly bonded to its neighbours by van der Waals forces, making physical or chemical isolation simple.18 MoS2 belongs to the family of TMDs, which have a large surface area, rich redox peaks, good intrinsic properties, and high theoretical capacitance. These properties of MoS2 make it suitable for energy storage applications such as supercapacitors.19–21 The monolayer MoS2 has a direct band gap of 1.8 eV, and the bulk MoS2 has an indirect band gap is about 1.2 eV. The layered structure of molybdenum disulfide is similar to graphene, which supports the fast moving of electrons in the redox reactions.22–25
Bismuth materials are used in numerous applications such as gas sensors, catalysts, and energy storage systems because of their low cost, nontoxic properties, high conductivity, and dielectric behaviour. Bismuth-based nanocomposite materials having relatively good redox reactions in the negative potential window can be used as negative electrodes in energy storage systems.26,27 Bismuth compounds such as bismuth oxides and bismuth sulfides are n-type semiconductors having high refractive index, narrow energy band gap, and good electrochemical activities. The surface morphology, crystalline structure, size, shape, and dimensions of bismuth chalcogenides have a significant impact on their electrochemical properties.28 Due to the substantial intercalation space in their crystalline structure, bismuth chalcogenides are used in electrochemical energy storage devices; their lattice interlayer provides routes for the transit and employment of guest ions.29 The inclusion of other molecules into MoS2 nanosheets can increase the layer distance between each stacked layer, which impacts the electrochemical behaviour. The metal oxide and sulfide-based MoS2 hybrid electrodes have enhanced electrochemical performance because of their high pseudocapacitance, which can store charge at a higher rate than a conventional electric double-layer capacitor.30,31
A viable option is to combine a nanomaterial with metal sulfides in order to address the conductivity limitations of individual metal sulfides. This integration offers flexible platforms for effective charge transfer. MoS2, Bi2S3, CuS, NiS, NiS2, Ni3S2, CoS, CoS2, CdS, SnS, and SnS2 are all promising choices for supercapacitor electrodes due to their impressive electrochemical performances.32–36 S. Jia et al. developed a composite material NiCo-DHS, which exhibited a high specific capacity of 973.6C g−1 and remains durable over 8000 cycles, with only a small capacity loss of 7.4%. It achieved an energy density of 65.91 W h kg−1 and a power density of 0.89 kW kg−1, demonstrating its considerable potential.37 A nonaqueous sodium-ion hybrid energy storage device has been developed, which utilizes VS2 nanosheets grown on electrochemically exfoliated graphene as the negative electrode and activated carbon as the positive electrode. These hybrid devices exhibited a high areal capacitance of 110.7 mF cm−2 over a wide potential range of 0.01–3.5 V. Additionally, they demonstrated an impressive areal energy density of 188.3 μW h cm−2 and excellent cycling stability, maintaining their performance for up to 5000 cycles without noticeable decay.38 W. Zhang et al. developed a Ti3C2Tx/Bi2S3@N-C electrode that showed a specific capacitance of 653 F g−1, which is significantly higher than other binary composites or similar MXene-based materials. The Zinc-ion hybrid capacitor consists of Ti3C2Tx/Bi2S3@N-C and Zn foil as electrodes, and it exhibits a high specific capacitance of 150.33 F g−1, along with a maximum energy density of 46.98 W h kg−1 at a power density of 750 W kg−1.39 Utilizing metal sulfides in supercapacitors offers numerous benefits, including high energy density, improved stability, enhanced conductivity, a wide range of materials, environmental advantages, compatibility with flexible devices, and potential for hybrid systems. This makes them an attractive choice for advancing the field of supercapacitor technology. However, only a few studies have been published so far, on the effects of Bi-substitution in MoS2 for energy storage applications. Therefore, the main objective of the present work is to study the effects of Bi-substitution in MoS2/Bi2S3 nanocomposite materials on their structural, morphological, and electrochemical performance.
2. Materials and methods
2.1. Materials
Sodium molybdate dehydrate (Sigma-Aldrich laboratory with 99.5% purity), thioacetamide (Alfa Aesar laboratory with 98% purity), and bismuth nitrate (Alfa Aesar laboratory with 98% purity) were used as precursors. All chemicals and reagents were purchased as analytical grade and used without any further purification.2.2. Hydrothermal synthesis of pure MoS2
The hydrothermal method was used to synthesize pure MoS2 nanoparticles. First, 0.05 M of sodium molybdate dihydrate (Na2MoO4·2H2O) and 0.1 M of thioacetamide (C2H5NS) were taken in the molar ratio of 1![[thin space (1/6-em)]](https://www.rsc.org/images/entities/char_2009.gif) :
:![[thin space (1/6-em)]](https://www.rsc.org/images/entities/char_2009.gif) 2. The precursors were dissolved in 140 ml DI water and stirred for 30 minutes. Then, the solution was transferred into a 200 ml Teflon-lined stainless steel autoclave. After that, the autoclave was kept in the box furnace at 200 °C for 48 hours. The black precipitate was collected and washed several times using ethanol and deionized water. Finally, the sample was dried in a vacuum oven at 60 °C for 6 hours.
2. The precursors were dissolved in 140 ml DI water and stirred for 30 minutes. Then, the solution was transferred into a 200 ml Teflon-lined stainless steel autoclave. After that, the autoclave was kept in the box furnace at 200 °C for 48 hours. The black precipitate was collected and washed several times using ethanol and deionized water. Finally, the sample was dried in a vacuum oven at 60 °C for 6 hours.
2.3. Hydrothermal synthesis of MoS2/Bi2S3 nanocomposites
MoS2/Bi2S3 nanocomposites were synthesized using a hydrothermal method by adding Bi with different mol%. To synthesize 5 mol% Bi-added composite, 0.0475 M of sodium molybdate dihydrate, 0.1 M of thioacetamide, and 0.0025 M of bismuth nitrate were dissolved in 140 ml of DI water and further stirred for 30 minutes. The resultant solution was transferred to a Teflon-lined stainless steel autoclave and kept in a box furnace at 200 °C for 48 h. Finally, the black color precipitate was collected and washed out several times using ethanol and deionized water and then dried in a vacuum oven at 60 °C for 6 h. A similar procedure was followed to synthesize composites with different Bi concentrations of 5, 10, 15, and 20 mol% and the samples were named as MBS-1, MBS-2, MBS-3, and MBS-4, respectively. A schematic representation of the hydrothermal synthesis of MoS2/Bi2S3 nanocomposites is shown in Fig. 1.2.4. Characterization techniques
The morphology of pristine MoS2 and MoS2/Bi2S3 nanocomposites was analyzed using the TESCAN VEGA 3 Scanning electron microscope (SEM) and FEI TECHNAI G2 20 TWIN high-resolution transmission electron microscope (HRTEM). The structural properties of the pristine MoS2 and MoS2/Bi2S3 nanocomposites were analyzed by XRD using a REGAKU SMARTLAB diffractometer. The XPS analysis of pristine MoS2 and MoS2/Bi2S3 nanocomposites was performed on a PHI Versaprobe III instrument. The electrochemical properties of pristine MoS2 and MoS2/Bi2S3 nanocomposites were studied by CP, CV, and EIS analysis using CH Instruments, USA (CHI6008E).2.5. Electrochemical studies
The active electrode material, Super P® carbon black and polyvinylidene fluoride (PVDF) were taken in the weight ratio of 80![[thin space (1/6-em)]](https://www.rsc.org/images/entities/char_2009.gif) :
:![[thin space (1/6-em)]](https://www.rsc.org/images/entities/char_2009.gif) 10
10![[thin space (1/6-em)]](https://www.rsc.org/images/entities/char_2009.gif) :
:![[thin space (1/6-em)]](https://www.rsc.org/images/entities/char_2009.gif) 10 respectively, and well mixed using a mortar and pestle. The slurry was prepared from the above mixture with N-methylpyrrolidone (NMP) as a solvent. Super P® carbon black was used as a conductive additive and PVDF was used as a binder. The prepared slurry was coated on Ni foam over the area of 1 cm2, which served as the working electrode in a three-cell electrode setup. The total weight of the slurry coated on one working electrode was 4 mg, and the areal mass loading of the active electrode material was 3 mg. A platinum wire and Ag/AgCl served as counter and reference electrodes, respectively. 2 M KOH was used as the electrolyte in the electrochemical studies of pristine MoS2 and MoS2/Bi2S3 nanocomposites. The electrochemical properties were analyzed using CH Instruments at room temperature. The cyclic voltammetry (CV), chronopotentiometry (CP), and electrochemical impedance spectroscopy (EIS) tests were carried out using a three-cell electrode configuration.
10 respectively, and well mixed using a mortar and pestle. The slurry was prepared from the above mixture with N-methylpyrrolidone (NMP) as a solvent. Super P® carbon black was used as a conductive additive and PVDF was used as a binder. The prepared slurry was coated on Ni foam over the area of 1 cm2, which served as the working electrode in a three-cell electrode setup. The total weight of the slurry coated on one working electrode was 4 mg, and the areal mass loading of the active electrode material was 3 mg. A platinum wire and Ag/AgCl served as counter and reference electrodes, respectively. 2 M KOH was used as the electrolyte in the electrochemical studies of pristine MoS2 and MoS2/Bi2S3 nanocomposites. The electrochemical properties were analyzed using CH Instruments at room temperature. The cyclic voltammetry (CV), chronopotentiometry (CP), and electrochemical impedance spectroscopy (EIS) tests were carried out using a three-cell electrode configuration.
3. Results and discussion
3.1. Structural and morphological analysis
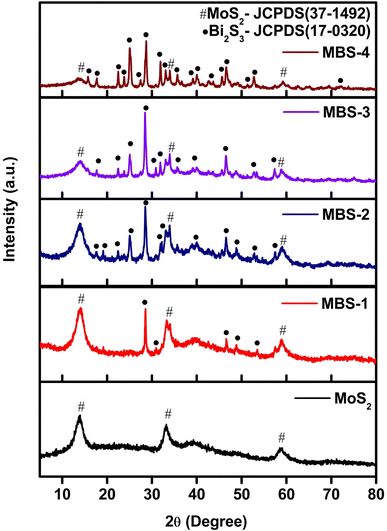
XRD patterns of pristine MoS2 and MoS2/Bi2S3 nanocomposites recorded in the 2θ range from 5–80° and shown in Fig. 2. The diffracted peaks of pristine MoS2 indexed to the planes of (002), (100), and (106) well matched with the standard JCPDS data (card no. 37-1492).40The secondary phase of Bi2S3 was formed by increasing the Bi concentration in MoS2/Bi2S3 nanocomposites. The diffraction peak intensities of Bi2S3 were indexed to the planes of (200), (120), (220), (101), (310), (211), (221), (240), (430), (440), (501), (312), (360), and (811) were in good agreement with those from the standard JCPDS data (card no. 17-0320). The mixed phases of MoS2 and Bi2S3 were clearly observed in the XRD patterns of MoS2/Bi2S3 nanocomposites and no other diffraction peaks were observed in the XRD pattern. The secondary phase of Bi2S3 was more dominant at higher concentration of Bi in MoS2/Bi2S3 nanocomposites.41–43
Fig. 3(a) represents the SEM image of pristine MoS2, formed as a 3D flower-like nanostructure. The close view of the pristine MoS2 nanoparticles is shown in Fig. 3(b) with the size of 300–600 nm range. The 3D nanoflowers showed hierarchical structures with pores and clumsy sheets. The spherical structure was formed due to the agglomeration of more nanosheets together. The morphology of MoS2/Bi2S3 nanocomposites with different concentrations of Bi is shown in Fig. 3(c–f), respectively. Bi2S3 was grown with MoS2 while increasing the Bi concentration in the MoS2/Bi2S3 nanocomposites and clearly observed in the SEM images. The spherical structure of MoS2 was stacked over Bi2S3 nanoflakes in MoS2/Bi2S3 nanocomposites.
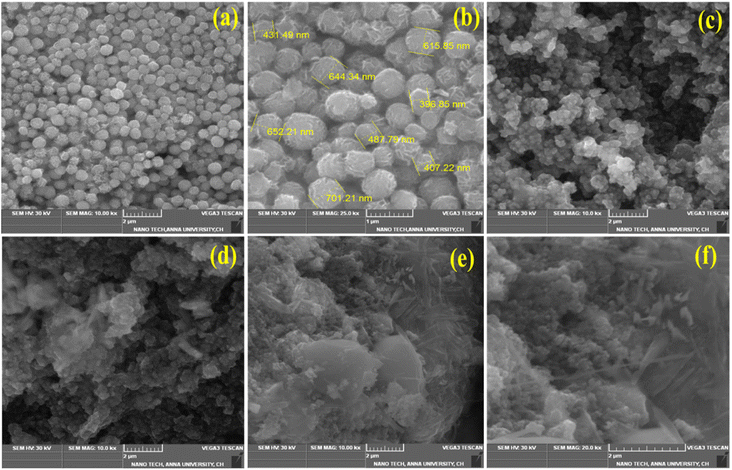 | ||
| Fig. 3 (a and b) SEM images of the pristine MoS2, (c–f) SEM images of MBS-1, MBS-2, MBS-3, and MBS-4 samples. | ||
The TEM and HRTEM were used to analyze the morphology and crystalline nature of the pristine MoS2 and MoS2/Bi2S3 nanocomposite and the images are shown in Fig. 4(a–c). The agglomerations of nanosheets were observed and the lattice fringes were clearly observed in the HRTEM images. The interplanar distance of 0.58 nm was calculated from the lattice fringes, which corresponds to the (002) plane of MoS2 as observed from the XRD pattern. In Fig. 4(d), the rings corresponding to (002), (100), and (110) planes were observed in the SEAD pattern, which verified the structure of pure MoS2 as hexagonal.44–46 Fig. 4(e–g) represents the TEM and HRTEM images of MBS-4 nanocomposite. It was clearly observed from the images that MoS2 and Bi2S3 were stacked together. The interplanar spacings of 0.58 nm and 0.30 nm were observed, which corresponded to the (002) plane of MoS2 and (211) plane of Bi2S3. The SAED pattern shows a clear ring with spots, which confirms the polycrystalline nature of the MBS-4 nanocomposite (Fig. 4(h)).47
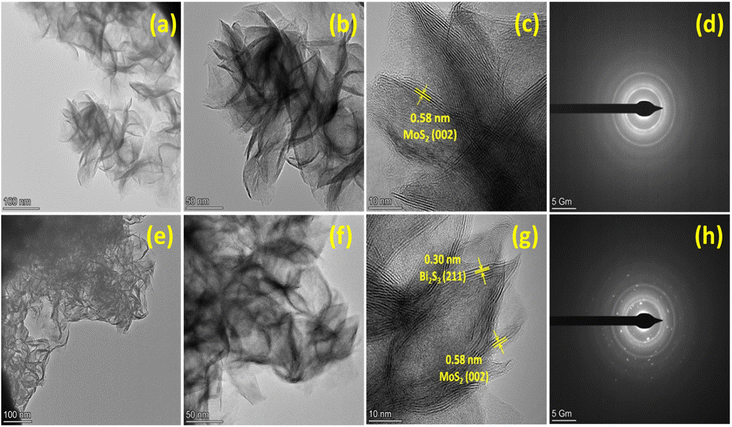 | ||
| Fig. 4 (a–c) HRTEM images of MoS2, (d) SAED pattern of MoS2, (e–g) HRTEM images of MBS-4 nanocomposite, (h) SAED pattern of MBS-4 nanocomposite. | ||
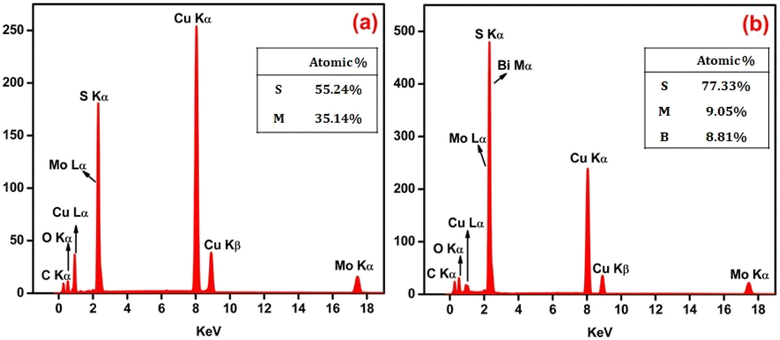
The EDAX spectra were recorded to investigate the composition of the synthesized pristine MoS2 and MoS2/Bi2S3 nanocomposite samples. The chemical composition of pristine MoS2 was confirmed and displayed in Fig. 5(a). Despite the peaks indicated, copper and carbon peaks were also noticed in the EDAX spectra of both samples, which may have originated from the grid. Fig. 5(b) represents the EDAX spectrum of the MBS-4 nanocomposite, in which the elements of Mo, Bi, and S were clearly observed. The EDAX spectrum confirms that no other elements were present in the sample, indicating that it was homogeneous in terms of its elemental composition.48,49
3.2. X-ray photoelectron spectroscopy (XPS) analysis
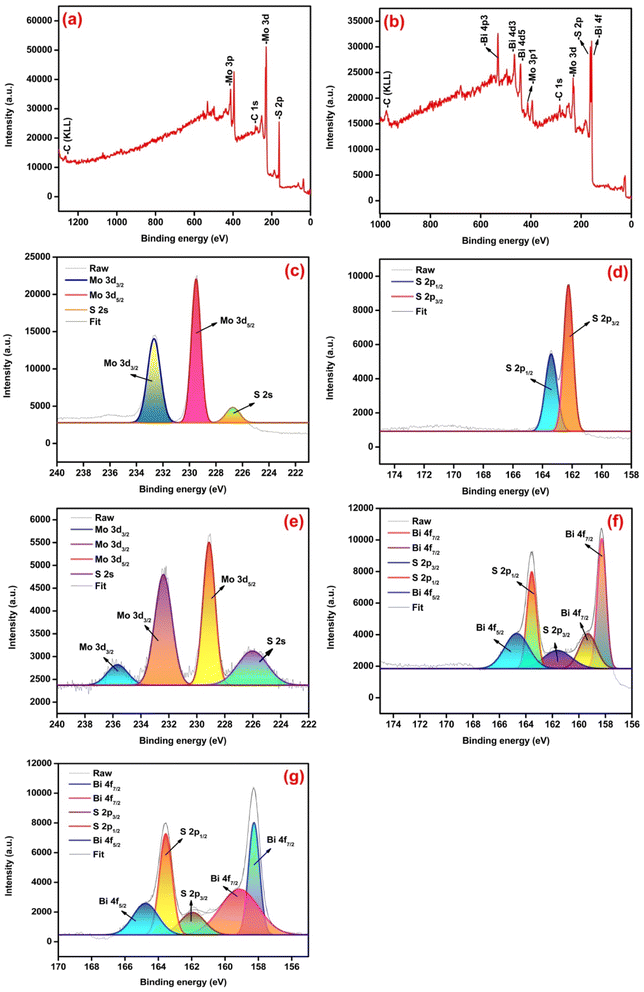
X-ray photoelectron spectroscopy (XPS) was used to analyze the chemical composition and binding state of elements in the samples. The survey spectra of pure MoS2 and MBS-4 samples confirmed the presence of Mo, Bi, S, and C elements as shown in Fig. 6(a) and (b). The elemental carbon appeared as a result of the carbon tape used to hold the samples.50 Fig. 6(c) represents the core level XPS spectrum of a pristine MoS2 sample for Mo 3d. The strong doublet peaks exist at 229.5 eV and 232.7 eV corresponding to Mo 3d5/2 and Mo 3d3/2, respectively, and the mild peak at 226.8 eV belonged to S 2s. Fig. 6(d) shows the core level XPS spectrum of S 2p for pristine MoS2 sample with two strong peaks appearing at 162.2 eV and 163.4 eV corresponding to S 2p3/2 and S 2p1/2, respectively.51Fig. 6(e) represents the core level XPS spectrum of Mo 3d peaks for the MBS-4 nanocomposite. The strong doublet exists at the energy levels of 229.1 eV and 232.3 eV corresponding to Mo 3d5/2 and Mo 3d3/2, respectively. Moreover, one of the weaker peaks exists at 226.0 eV for S 2s, and the other is located at 235.8 eV corresponding to Mo3d3/2, which is attributed to the presence of the Mo 6+ oxidation state. Oxidation occurred due to the formation of Bi2S3, which created the lack of sulfur atoms to form MoS2. Such oxidation in the nanocomposite enhances the electronic property of the electrode material and further develops more active sites with good photocatalytic behavior indicating that MoO3 is formed in the Bi-substituted nanocomposites.52,53
Fig. 6(f) represents the core level XPS spectrum of S 2p peaks for the MBS-4 nanocomposite. The strong doublet peaks appeared at the binding energy of 161.5 eV and 163.5 eV, which correspond to S 2p3/2 and S 2p1/2, respectively. Fig. 6(g) represents the core level XPS spectrum of Bi 4f peaks for the MBS-4 nanocomposite. The doublet peaks existed for Bi 4f7/2 at the binding energy of 158.2 eV and 159.2 eV, indicating the presence of Bi2O3 in the composite.54,55 The peak corresponding to Bi 4f5/2 appeared at the binding energy of 164.8 eV. It is clearly noted that an energy gap of 5.6 eV existed between the two firm peaks of Bi 4f7/2 and Bi4f5/2, indicating the formation of the Bi3+ state in the Bi2S3 phase.56
3.3. Electrochemical analysis
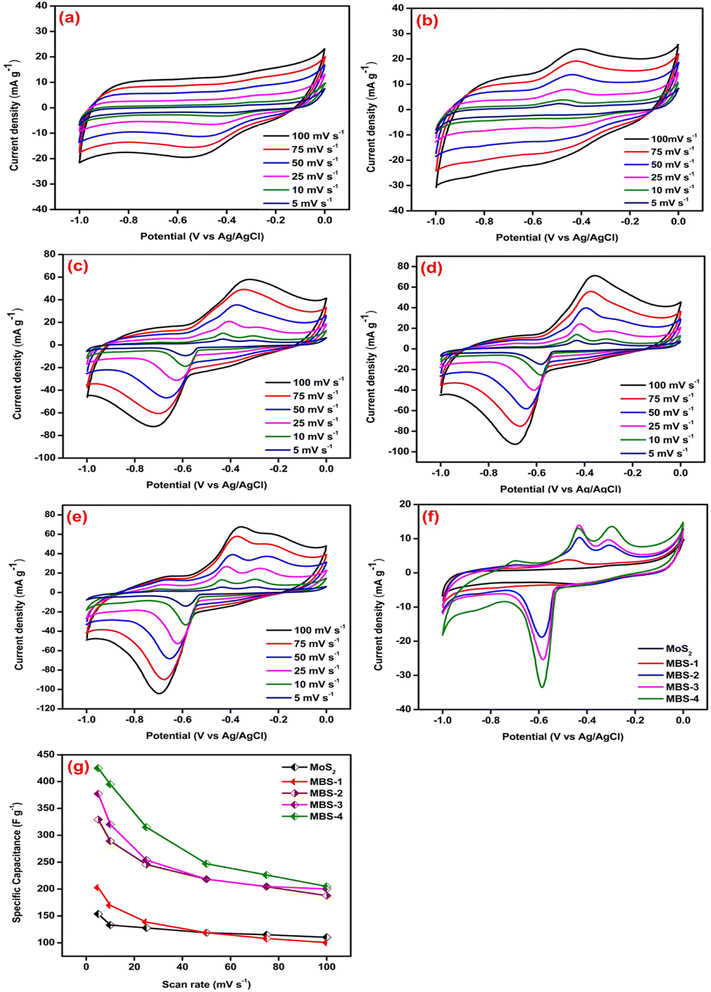
Cyclic voltammetry analysis was used to study the oxidation and reduction reaction kinetics of the pristine MoS2 and MoS2/Bi2S3 nanocomposites. The response of the CV curve was significant in the potential window range from −1 to 0 V for all the scan rates from 5 to 100 mV s−1. The specific capacitance of active materials can be calculated using the following eqn (1),57
 | (1) |
Fig. 7(a–e) shows the CV curves of pristine MoS2 and MoS2/Bi2S3 nanocomposites at scan rates from 5 to 100 mV s−1. Fig. 7(a) represents the CV response of pristine MoS2. The redox peaks are clearly visible in the CV curve, indicating the pseudo-capacitive behavior due to a reversible surface redox reaction.58 When the scan rate increases from 5 to 100 mV s−1, the area of CV curves also increases and the shape of the curves remains symmetrical. It showed the ideal capacitive behavior of the pristine MoS2. The maximum specific capacitance of pristine MoS2 was 154 F g−1 at a scan rate of 5 mV s−1. The CV curves of MoS2/Bi2S3 nanocomposites showed relatively stronger redox peaks compared to those of the pristine MoS2, indicating that the Bi-substitution increases the reversible faradaic redox reaction. Fig. 7(b) represents the CV response of the MBS-1 electrode, which exhibited a larger current flow than the pristine MoS2. The formation of heterostructure between MoS2 and Bi2S3 increases the conductivity and electrochemical properties of MoS2/Bi2S3 nanocomposites. The highest specific capacitance for the MBS-1 electrode was 203 F g−1 at a scan rate of 5 mV s−1. The current densities are maximum at higher scan rates due to the rapid diffusion and absorption of ions at the electrode–electrolyte interface.
Fig. 7(c and d) represents the CV curves of MBS-2 and MBS-3 electrodes, respectively. The electrochemical properties of the composites gradually increased with Bi-substitution, as shown in the CV curves. The CV response of the MBS-4 electrode is shown in Fig. 7(e). The two strong oxidation peaks are clearly visible at low scan rates, which correspond to the multiple oxidation states of the elements Mo and Bi. The presence of multiple oxidation states increases the electrochemical redox reactions and conductivity of MBS-4 nanocomposite electrodes. The highest specific capacitance of 425 F g−1 was obtained for Mo0.8Bi0.2S2 nanocomposite at a 5 mV s−1 scan rate. Fig. 7(f) shows the CV comparison of the pristine MoS2 and MoS2/Bi2S3 nanocomposites at a scan rate of 5 mV s−1. The MBS-4 nanocomposite has a higher integrated CV area, indicating that more ion diffusion and absorption occur at the electrode/electrolyte interface. It has a strong reduction peak at −0.6 V and two oxidation peaks at −0.42 V and −0.3 V. Fig. 7(g) shows variations in the specific capacitance of pristine MoS2 and MoS2/Bi2S3 nanocomposites at different scan rates. The MBS-4 sample had the highest specific capacitance than other composites and pristine MoS2. The specific capacitances of the pristine MoS2 and MoS2/Bi2S3 nanocomposites were higher at a scan rate of 5 mV s−1. At higher scan rates, the ions present in the electrolytes move very fast, which cannot access all the active sites of the electrode surface. This attributes low specific capacitance at higher scan rates.59,60 The redox reactions of a MoS2/Bi2S3 composite electrode in the KOH electrolyte can be described as follows:
| 2MoS2 + 6OH− → 2Mo(OH)2 + 4S−2 + 3H2O + 6e− | (2) |
| 2Bi2S3 + 6OH− → 2Bi(OH)3 + 3S2O2−3 + 6e− | (3) |
| Sample | Specific capacitance (F g−1) at different scan rates | |||||
|---|---|---|---|---|---|---|
| 100 mV s−1 | 75 mV s−1 | 50 mV s−1 | 25 mV s−1 | 10 mV s−1 | 5 mV s−1 | |
| MoS2 | 110 | 115 | 119 | 128 | 133 | 154 |
| MBS-1 | 100 | 108 | 119 | 139 | 170 | 203 |
| MBS-2 | 188 | 204 | 218 | 246 | 289 | 329 |
| MBS-3 | 200 | 205 | 218 | 254 | 320 | 377 |
| MBS-4 | 205 | 226 | 247 | 315 | 395 | 425 |
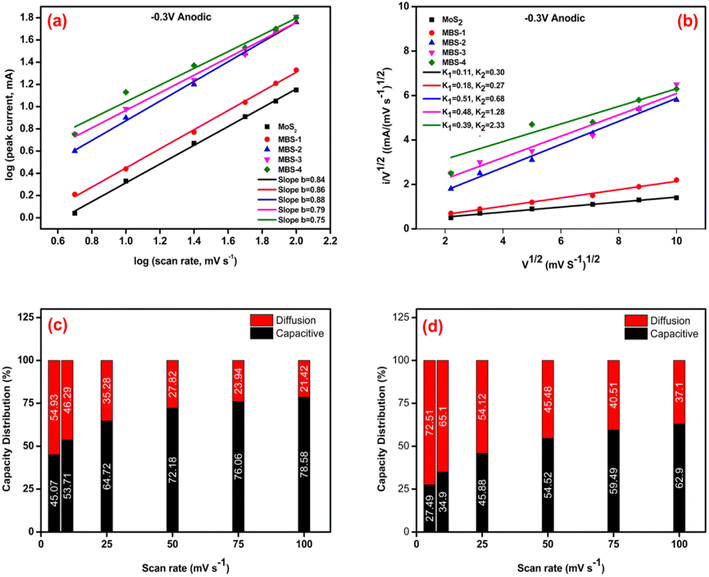
Studying the various kinetic responses through electrochemical analysis enhances the comprehension of the charge/discharge process, and offers valuable insights for pinpointing and developing superior electrode materials for advanced energy storage devices. The capacitive distribution can be approximated using the power law relationship between the current (i) and sweep rates (v), as shown in eqn (4). This can be performed by determining the b-value from the linear slope of the logarithm of i versus the logarithm of v.
| i = avb | (4) |
The b value has practical applications in designing high-performance electrode materials. It can be used to differentiate between pseudocapacitive and battery-type materials and provide information about electrochemical reactions and charge storage mechanisms in different ion intercalation batteries. In accordance with the existing literature, the b-value is characterized by two predetermined values, specifically 0.5 and 1.0, which are indicative of two distinct conditions: diffusion control and capacitive response, respectively. The range of b values between 0.5 and 1.0 represents the “transition” area between capacitive materials (b = 1.0) and typical battery-type materials (b = 0.5).61–63 Fig. 8(a) shows the b values of MoS2 and MoS2/Bi2S3 composites. The value of b ∼ 0.8 indicates the capacitive behavior of the pure samples. While increasing the Bi concentration is likely favorable with the diffusion of Mo and Bi ions.
J. Wang et al. developed a successful approach for analyzing and evaluating the contributions of capacitive and diffusion-controlled processes in the overall current.64 By utilizing their calculation method, it became possible to separate and quantify the surface capacitive and diffusion-controlled effects in the current response, as expressed in eqn (5) provided.
| i(v) = k1v + k2v1/2 = icapacitive + idiffusion | (5) |
The equation can be transformed into a simpler form known as a first-order equation.
| i(v)/v1/2 = k1v1/2 + k2 | (6) |
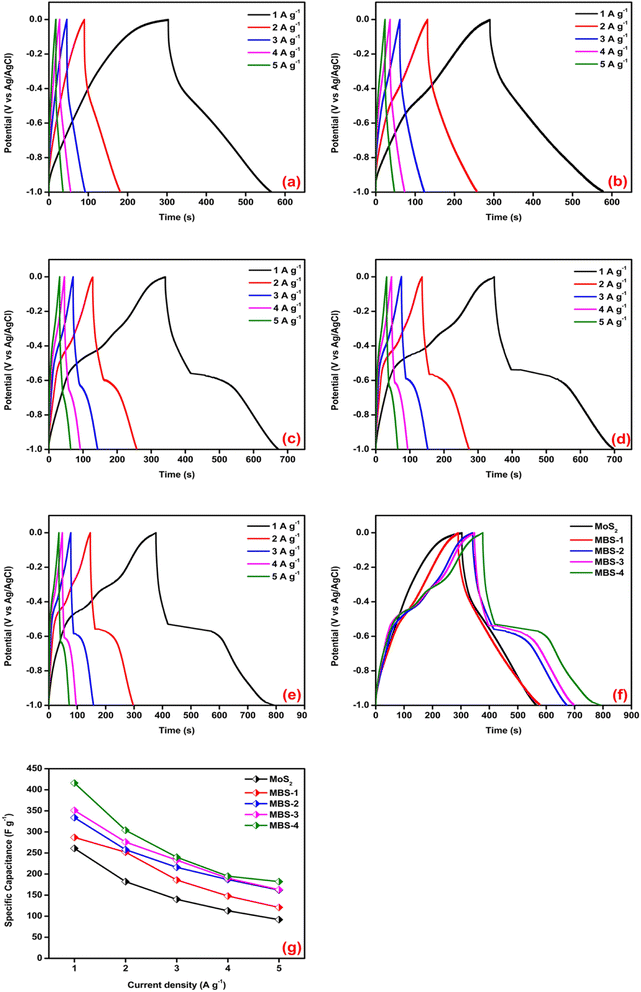
The charge–discharge kinetics of pristine MoS2 and MoS2/Bi2S3 nanocomposites were analyzed using chronopotentiometry. Fig. 9(a–e) shows CP curves of pristine MoS2 and MoS2/Bi2S3 nanocomposites at a constant potential window from −1 to 0 V. CP analysis was performed at various current densities from 1 to 5 A g−1. The sample discharge time is one of the essential key factors for estimating the specific capacitance of the working electrodes. The specific capacitance of the sample was calculated using the following eqn (7).65
 | (7) |
Fig. 9(a) represents the charge–discharge characteristics of pure MoS2. The CP curves of pure MoS2 are linear and well-symmetrical in shape. The maximum specific capacitance of pure MoS2 is 261 F g−1 at a current density of 1 A g−1. The CP curves of the MBS-1 electrode are shown in Fig. 9(b). The variations in terms of charging-discharging time are clearly observed in MoS2/Bi2S3 nanocomposite electrodes compared to those in pristine MoS2. The bismuth substitution increases the reversible charging-discharging performance and it was clearly observed in the CP curves of MBS-2 and MBS-3 electrodes, as shown in Fig. 9(c and d). The specific capacitances are notably increased, indicating more interaction between the active sites of the electrode and electrolytes.
Fig. 9(e) represents the CP curves of the MBS-4 electrode. The remarkable variations are noted in the charging–discharging time of the electrode. The highest specific capacitance of 371 F g−1 was calculated at a current density of 1 A g−1 among the other electrodes. The comparison between pristine MoS2 and MoS2/Bi2S3 nanocomposite electrodes at a current density of 1 A g−1 is shown in Fig. 9(f). The electrochemical activities are higher for the MoS2/Bi2S3 composite electrode than the pristine MoS2. For comparison, the specific capacitances of all electrodes were calculated from the discharge time of CP at a current density of 1 A g−1, and the data are shown in Fig. 9(g). The specific capacitances of pristine MoS2 and MoS2/Bi2S3 nanocomposites were calculated at different current densities using eqn (7) and are listed in Table 2. The calculated specific capacitances were high at lower current densities, which indicates that the diffusion of OH− ions was high at low scan rates/current densities, in which the electrolytes have sufficient time to pass through the internal active sites of the electrode materials. At higher current densities and scan rates, the absorption of electrolyte ions took place at the surface of the electrode materials, which led to a less electrode/electrolyte interface and a lower specific capacitance.66,67
| Sample | Specific capacitance (F g−1) at different current densities | ||||
|---|---|---|---|---|---|
| 1 A g−1 | 2 A g−1 | 3 A g−1 | 4 A g−1 | 5 A g−1 | |
| MoS2 | 261 | 182 | 140 | 113 | 92 |
| MBS-1 | 287 | 252 | 186 | 148 | 121 |
| MBS-2 | 334 | 258 | 216 | 187 | 162 |
| MBS-3 | 351 | 276 | 233 | 190 | 163 |
| MBS-4 | 371 | 304 | 240 | 195 | 182 |
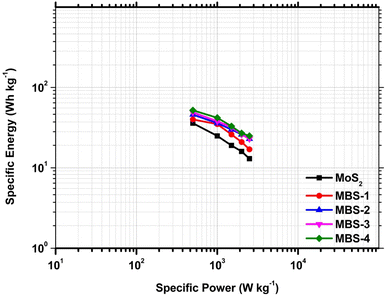
The Ragone plot is a useful tool for assessing the performance of electrode materials in supercapacitors. It allows for the evaluation of energy density (Ed, measured in W h kg−1) and power density (Pd, measured in kW kg−1) using the following equations.68
| Ed = 0.5CV2/3.6 | (8) |
| Pd = E × 3600/Δt | (9) |
It was observed that the energy density of the pristine MoS2 increases from 13 W h kg−1 to 26 W h kg−1 at the power densities from 2500 W kg−1 to 500 W kg−1. Comparatively, the MBS-4 composite electrode shows a higher energy density of 52 W h kg−1 at a power density of 500 W kg−1 and remained 25 W h kg−1 at 2500 W kg−1. The results illustrated that the increase in the Bi concentration in MoS2/Bi2S3 enhanced the energy density with high power output.
3.4. Electrochemical impedance spectroscopy (EIS) analysis
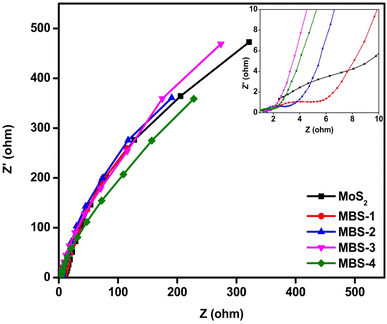
Electrochemical impedance spectroscopy analysis was performed to measure the electrical impedance at the interface between the working electrode and the electrolyte over a wide range of frequencies. Fig. 11 shows the electrical impedance spectra for pristine MoS2 and MoS2/Bi2S3 nanocomposite electrodes. It can be observed that a very small semicircle can be observed in the high-frequency range, indicating the low charge transfer resistance between the working electrode and the electrolytes.69 In the low-frequency region, the impedance spectrum was linear, confirming the ideal capacitive behaviour of the pristine MoS2 and MoS2/Bi2S3 nanocomposites. This indicates a low diffusion resistance between the ions in the electrolytes and the working electrodes. The equivalence series resistance (Resr) was measured at the intersection of the data with the x-axis. The Resr of pristine MoS2 was 2.4 ohms, which was significantly higher than that of MoS2/Bi2S3 nanocomposite electrodes. The addition of Bi increases the interfacial area between the electrode and the electrolyte and reduces the series resistance, which promoted charge transport. The MBS-4 electrode had the lowest Resr among the other MoS2/Bi2S3 nanocomposites. The observed series resistances of MBS-1, MBS-2, MBS-3, and MBS-4 electrodes are 2.2, 1.5, 1.3, and 1.2 ohms, respectively.4. Conclusion
Pure MoS2 and MoS2/Bi2S3 nanocomposites with different Bi-concentrations were successfully synthesized using the hydrothermal method. The XRD patterns showed the formation of MoS2 and Bi2S3 phases and the data well matched the standard JCPDS cards. The morphology of synthesized electrode materials was studied using SEM, TEM, and HRTEM analysis. The EDX analysis confirmed the presence of Mo, Bi, and S elements in the synthesized samples and the XPS analysis confirmed the oxidation states of pure MoS2 and MoS2/Bi2S3 nanocomposites. The electrochemical properties of MoS2/Bi2S3 nanocomposites were studied using CV, CP, and EIS analysis. MoS2/Bi2S3 nanocomposites showed excellent electrochemical properties with improved electrode/electrolyte interfaces compared to pristine MoS2. The calculated specific capacitances of the pristine MoS2, MBS-1, MBS-2, MBS-3, and MBS-4 composites were 154 F g−1, 203 F g−1, 329 F g−1, 377 F g−1, and 425 F g−1 at 5 mV s−1, respectively. Electrochemical measurements indicated that the MBS-4 electrode exhibited a higher energy density of 52 W h kg−1 than the pristine MoS2 electrode (26 W h kg−1). The experimental findings suggested that MoS2/Bi2S3 composites showed great potential as high-performance electrode materials in supercapacitors and other energy storage devices.Conflicts of interest
The authors declare that they have no conflicts of interest.Acknowledgements
The author (K. M.) is thankful to the Centre for Nanoscience and Technology, Anna University, Chennai-600 025, Tamil Nadu, India, for the continuous support and facilities provided to carry out this research work.References
- S. Bhoyate, P. K. Kahol and R. K. Gupta, Nanoscience, 2018, 5, 1–29 RSC.
- G. Venugopal, A. Hunt and F. Alamgir, Mater. Matters, 2010, 5(2), 42 CAS.
- Z.-G. Chen, Guang Han, Lei Yang, Lina Cheng and Jin Zou, Prog. Nat. Sci.: Mater., 2012, 22, 535–549 CrossRef.
- A. Slaoui, D. Lincot, J.-F. Guillemoles and L. Escoubas, Nanomaterials for Photovoltaic Conversion, Wiley-VCH Verlag GmbH & Co. KGaA, 2017 Search PubMed.
- S. Huang, X. Zhu, S. Sarkar and Y. Zhao, APL Mater., 2019, 7, 100901–100909 CrossRef.
- A. Davies and A. Yu, Can. J. Chem. Eng., 2011, 89, 1342–1357 CrossRef CAS.
- J. Cherusseri, N. Choudhary, K. S Kumar, Y. Jung and J. Thomas, Nanoscale Horiz., 2019, 4, 840–858 RSC.
- D. Voiry, A. Mohite and M. Chhowalla, Chem. Soc. Rev., 2015, 44(9), 2702–2712 RSC.
- T. Saravanan, P. Anandan, M. Shanmugam, M. Azhagurajan, M. Mohamed Ismail, M. Arivanandhan, Y. Hayakawa and R. Jayavel, Polym. Bull., 2020, 77, 3891–3906 CrossRef CAS.
- Z. Yang, J. Tian, Z. Yin and C. Cui, Carbon, 2019, 141, 467–480 CrossRef CAS.
- T. Purkait, G. Singh, D. Kumar, M. Singh and R. Sundar Dey, Sci. Rep., 2018, 8, 640 CrossRef PubMed.
- L. L Zhang and X. S. Zhao, Chem. Soc. Rev., 2009, 38(9), 2520–2531 RSC.
- R. Muhammad, Hasyim and Ramakrishnan Rajagopalan, J. Electrochem. Soc., 2020, 167, 013536 CrossRef.
- J. Xie, P. Yang, Y. Wang, T. Qi, Y. Lei and C. M. Li, J. Power Sources, 2018, 401, 213–223 CrossRef CAS.
- J. Cherusseri, N. Choudhary, K. S. Kumar, Y. Jung and J. Thomas, Nanoscale, 2020, 12, 8608 RSC.
- S. Tanwar, A. Arya, A. Gaur and A. L. Sharma, J. Phys.: Condens. Matter, 2021, 33, 303002 CrossRef CAS PubMed.
- S. A. Han, R. Bhatia and S.-W. Kim, Nano Convergence, 2015, 2, 17 CrossRef.
- P. Panigrahi, T. Hussain, A. Karton and R. Ahuja, ACS Sens., 2019, 4(10), 2646–2653 CrossRef CAS PubMed.
- S. Barua, H. S. Dutta, S. Gogoi, R. Devi and R. Khan, ACS Appl. Nano Mater., 2018, 1, 2–25 CrossRef CAS.
- T. Wang, S. Chen, H. Pang, H. Xue and Y. Yan, Adv. Sci., 2017, 1600289 CrossRef PubMed.
- Z. Li, X. Meng and Z. Zhang, J. Photochem. Photobiol., C, 2018, 35, 39–55 CrossRef CAS.
- M. Arun Kumar, C. Shanmugavel, N. Hanagata and R. Jayavel, Sci. Technol. Adv. Mater., 2017, 18, 43–50 CrossRef PubMed.
- B. Radisavljevic, A. Radenovic, J. Brivio, V. Giacometti and A. Kis, Nat. Nanotechnol., 2011, 6, 147–150 CrossRef CAS PubMed.
- M. Arun Kumar, R. Jayavel, M. Shanmugam, C. Sengottaiyan, S. Chinnathambi and N. Mohankumar, J. Nanosci. Nanotechnol., 2021, 21(6), 3299–3305 CrossRef PubMed.
- M. Arun Kumar, R. Jayavel, M. Arivanandhan, B. Raj and N. Mohankumar, Silicon, 2022, 14, 10467–10474 CrossRef.
- N. Joseph, P. M. Shafi and A. Chandra Bose, Energy Fuels, 2020, 34(6), 6558–6597 CrossRef CAS.
- B. K. Deka, A. Hazarika, O. Kwon, D. Y. Kim, Y. B. Park and H. W. Park, Chem. Eng. J., 2017, 325, 672–680 CrossRef CAS.
- N. Devi and S. S. Ray, Mater. Today Commun., 2020, 25, 101691 CrossRef CAS.
- B. Shunmughananthan, T. Dheivasigamani, J. S. K. Pitchai and S. Periyasamy, Dalton Trans., 2022, 51, 15579–15592 RSC.
- Z. S. Yan, J. Y. Long, Q. F. Zhou, Y. Gong and J. H. Lin, Dalton Trans., 2018, 47(15), 5390–5405 RSC.
- R. N. Bulakhe, V. H. Nguyen and J. J. Shim, New J. Chem., 2017, 41(4), 1473–1482 RSC.
- N. Abhiram, D. Thangaraju, R. Marnadu, G. Johnsy Arputhavalli, S. Gunasekaran, P. Vetrivelan, N. S. M. P. Latha Devi, M. Shkir and H. Algarni, Inorg. Chem. Commun., 2021, 133, 108882 CrossRef CAS.
- M. B. Muradov, O. O. Balayeva, A. A. Azizov, A. M. Maharramov, L. R. Qahramanli, G. M. Eyvazova and Z. A. Aghamaliyev, Infrared Phys. Technol., 2018, 89, 255–262 CrossRef CAS.
- J. Ding, A. Feng, X. Li1, S. Ding, L. Liu and W. Ren, J. Phys. D: Appl. Phys., 2021, 54, 173002 CrossRef CAS.
- A. Timothy and O. Damian, Results Chem., 2021, 3, 100151 CrossRef.
- T. Kajana, A. Pirashanthan, D. Velauthapillaic, A. Yuvapragasam, S. Yohi, P. Ravirajan and M. Senthilnanthanan, RSC Adv., 2022, 12, 18041–18062 RSC.
- S. Jia, Y. Lv, J. Wei, J. Guan, Z. Yan and Z. Shao, Chem. Eng. J., 2023, 456, 141120 CrossRef CAS.
- P. Zhang, L. Wang, F. Wang, D. Tan, G. Wang, S. Yang, M. Yu, J. Zhang and X. Feng, Batteries Supercaps, 2019, 2, 918 CrossRef CAS.
- W. Zhang, H. Jiang, Y. Li, W. Ma, X. Yang and J. Zhang, J. Alloys Compd., 2021, 883, 160881 CrossRef CAS.
- Bo Weng, X. Zhang, N. Zhang, Zi-R. Tang and Yi-J. Xu, Langmuir, 2015, 31(14), 4314–4322 CrossRef CAS PubMed.
- A. S. Alagar Nedunchezhiana, D. Sidhartha, N. Yalini Devia, R. Rajkumar, P. Rajasekaran, M. Arivanandhan, G. Anbalagan and R. Jayavel, Ceram. Int., 2019, 45(6), 6782–6787 CrossRef.
- L. X. Fang, B. L. Zhang, W. Li, J. H. Zhang, K. J. Huang and Q. Y. Zhang, Electrochim. Acta, 2014, 148, 164–169 CrossRef CAS.
- L. X. Fang, Z. W. Zhang, X. Li, H. Zhou, K. K. Ma, L. Ge and K. J. Huang, Colloids Surf., A, 2016, 501, 42–48 CrossRef CAS.
- X. Liu, L. Liu, Y. Wu, Y. Wang, J. Yang and Z. Wang, RSC Adv., 2019, 9, 13820–13828 RSC.
- B. Ahmeda, D. H. Anjuma, Y. Gogotsi and H. N. Alshareef, Nano Energy, 2017, 34, 249–256 CrossRef.
- K. Ma, H. Jiang, Y. J. Hu and C. Z. Li, Adv. Funct. Mater., 2018, 28, 1804306 CrossRef.
- P.-C. Shen, C. Su, Y. Lin, A.-S. Chou, C.-C. Cheng, J.-H. Park, M.-H. Chiu, A.-Y. Lu, H.-L. Tang, M. Tavakoli, G. Pitner, X. Ji, Z. Cai, N. Mao, J. Wang, V. Tung, J. Li, J. Bokor, A. Zettl and J. Kong, Nature, 2021, 593, 211–217 CrossRef CAS PubMed.
- K. Lalithambika, K. Shanmugapriya and S. Subramanian, Appl. Phys. A, 2019, 125, 817 CrossRef CAS.
- G. Xiao, Q. Dong, Y. Wang, Y. Sui, J. Ning, Z. Liu, W. Tian, B. Liu, G. Zou and B. Zou, RSC Adv., 2012, 2, 234–240 RSC.
- Q. Lin, X. Dong, Y. Wang, N. Zheng, Y. Zhao, W. Xu and T. Ding, J. Mater. Sci., 2020, 55, 6637–6647 CrossRef CAS.
- B. Li, L. Jiang, X. Li, R. Peng, P. Zuo, A. Wang, L. Qu, Y. Zhao, Z. Cheng and Y. Lu, Sci. Rep., 2017, 7, 11182 CrossRef PubMed.
- B. Weng, X. Zhang, N. Zhang, Z.-R. Tang and Y.-J. Xu, Langmuir, 2015, 31(14), 4314–4322 CrossRef CAS PubMed.
- J. Wang, C. Zhou, X. Yan, Q. Wang, D. Sha, J. Pan and J. Xiaonong Cheng, J. Mater. Sci.: Mater. Electron., 2019, 30, 6633–6642 CrossRef CAS.
- H. Lu, Q. Hao, T. Chen, L. Zhang, D. Chen, C. Ma, W. Yao and Y. Zhu, Appl. Catal., B, 2018, 237, 59–67 CrossRef CAS.
- S. Ibrahim, P. Bonnet, M. Sarakha, C. Caperaa, G. Monier and A. Bousquet, Mater. Chem. Phys., 2020, 243, 122580 CrossRef CAS.
- L. Wu, X. Yue, Y. Chang, K. Wang, J. Zhang, J. Sun, W. Zhishun and E. Kowalska, Catalysts, 2022, 12, 1293 CrossRef CAS.
- M. Mohamed Ismail, J. Vigneshwaran, S. Arunbalaji, D. Mani, M. Arivanandhan, S. P. Jose and R. Jayavel, Dalton Trans., 2020, 49(39), 13717–13725 RSC.
- D. Majumdar, J. Electroanal. Chem., 2021, 880, 114825 CrossRef CAS.
- R. Thangappan, S. Kalaiselvam, A. Elayaperumal, R. Jayavel, M. Arivanandhan, R. Karthikeyan and Y. Hayakawa, Dalton Trans., 2016, 45(6), 2637–2646 RSC.
- T. Saravanan, M. Shanmugam, P. Anandan, M. Azhagurajan, K. Pazhanivel, M. Arivanandhan, Y. Hayakawa and R. Jayavel, Dalton Trans., 2015, 44(21), 9901–9908 RSC.
- B. E. Conway, V. Birss and J. Wojtowicz, J. Power Sources, 1997, 66(1–2), 1–14 CrossRef CAS.
- J. Liu, J. Wang, C. Xu, H. Jiang, C. Li, L. Zhang, J. Lin and Ze X. Shen, Adv. Sci., 2017, 5(1), 1700322 CrossRef PubMed.
- D. T. Pham, B. Sambandam, S. Kim, J. Jo, S. Kim, S. Park, V. Mathew, Y.-K. Sun, K. Kim and J. Kim, Commun. Chem., 2018, 1, 83 CrossRef.
- J. Wang, J. Polleux, J. Lim and B. Dunn, J. Phys. Chem. C, 2007, 111(40), 14925–14931 CrossRef CAS.
- G. Murugadoss, J. Ma, X. Ning and M. R. Kumar, Inorg. Chem. Commun., 2019, 109(6), 107577 CrossRef CAS.
- M. A. Ghanem, I. S. El-Hallag, M. S. Amer and N. H. Alotaibi, J. Saudi Chem. Soc., 2021, 25(7), 101274 CrossRef CAS.
- B. Pal, S. Yang, S. Ramesh, T. Venkataraman and R. Jose, Nanoscale Adv., 2019, 1, 3807–3835 RSC.
- R. Thangappan, S. Kalaiselvam, A. Elayaperumal, R. Jayavel, M. Arivanandhan, R. Karthikeyan and Y. Hayakawa, Dalton Trans., 2016, 45, 2637 RSC.
- B. G. Sundara Raj, J. J. Wu, A. M. Asiri and S. Anandan, RSC Adv., 2016, 6(40), 33361–33368 RSC.
| This journal is © The Royal Society of Chemistry 2023 |


