DOI:
10.1039/D3RA03839D
(Paper)
RSC Adv., 2023,
13, 25895-25903
Direct adhesion between Cu foil and polytetrafluoroethylene without increasing surface roughness for high-frequency printed wiring boards†
Received
8th June 2023
, Accepted 23rd August 2023
First published on 30th August 2023
Abstract
Polytetrafluoroethylene (PTFE) serves as a suitable dielectric substrate for high-frequency printed wiring boards (PWBs) owing to its excellent properties at high frequency. However, to the best of our knowledge, no study has investigated the strong adhesion between PTFE and Cu foil with low surface roughness. Therefore, in this study, pure-PTFE comprising a weak boundary layer (WBL) on the surface and glass-cloth-containing PTFE (GC-PTFE), which did not contain a WBL, were subjected to heat-assisted plasma (HAP) treatment. Thereafter, we investigated the surface chemical bonding state, surface morphology, and adhesion properties of the as-prepared PTFE toward Cu foil with low surface roughness. As observed, oxygen-containing functional groups were generated on the HAP-treated PTFE, and the WBL in the as-received pure-PTFE was eliminated via HAP treatment. Moreover, the surface roughness of the HAP-treated PTFE did not increase compared to that of as-received PTFE. After performing thermal compression under atmospheric conditions, the adhesion strength of both HAP-treated pure-PTFE and GC-PTFE was ∼0.9 N mm−1. In addition, the adhesion strength of Cu/pure-PTFE and Cu/GC-PTFE increased after thermal compression under a reduced pressure, and the adhesion strength of 1 N mm−1 was obtained. Although the Cu foil was not roughened, Cu/PTFE realized strong adhesive strength. The developed method is advantageous because maintaining a low interface roughness is crucial for applying PTFE to manufacture high-frequency PWBs.
Introduction
With the increasing amount of information communication facilitated by smartphones, the demand for high-speed large-capacity transmission is continually increasing. Although the frequency of digital signals is increased to augment transmission speed and capacity, a higher frequency causes greater transmission loss if AC voltage is applied to dielectric substrates. To this end, polytetrafluoroethylene (PTFE), which exhibits a low relative dielectric constant and dielectric loss tangent, is considered a suitable dielectric for high-frequency printed wiring boards (PWBs).1 However, to utilize PTFE as a substrate, Cu wires must be fabricated on the PTFE surface to compensate for its low surface free energy.2–4 Therefore, surface treatment methods should be developed to enable PTFE adherence to other materials by generating oxygen-containing functional groups and increasing the surface free energy.
Based on the manufacturing method, PTFE is classified into two types of materials. In general, pure-PTFE sheets are manufactured by machining the bulk PTFE material into sheets, which introduces a weak boundary layer (WBL) on the pure-PTFE surface.5 Many large voids are reported to exist in the cross-section near the pure-PTFE surface. However, these voids were not observed in the cross-section of the bulk side. Therefore, a mechanically weak layer, called WBL, was introduced using the cutting existed on the pure-PTFE surface.5 In contrast, glass-cloth-containing PTFE (GC-PTFE) sheets are manufactured by immersing a glass cloth in a dispersed solution of PTFE powder and baking it. Notably, pure-PTFE with WBL fails to adhere strongly to other materials because cohesion failure occurs easily inside the WBL. Therefore, eliminating the WBL is necessary to ensure strong adhesion of pure-PTFE to other materials. In contrast, the GC-PTFE surface does not contain a WBL because its manufacturing does not involve cutting.6 Therefore, the GC-PTFE does not require any additional process to eliminate the WBL, and its adhesion property can be improved within a short period of surface treatment.6 Furthermore, compared to pure-PTFE, the GC-PTFE exhibits a low coefficient of linear thermal expansion (CTE) and high thermal stability because the GC-PTFE contains a glass cloth. However, depending on the manufacturing conditions, GC-PTFE often exhibits waviness generated by the glass cloth inside its surface. Moreover, the relative dielectric constant and dielectric loss tangent of pure-PTFE is 2.1 and 0.0002, respectively, whereas that of GC-PTFE is 3.04 and 0.0043, respectively. In general, pure-PTFE exhibits a lower relative dielectric constant and dielectric loss tangent than GC-PTFE. The interface roughness between the metal and dielectrics must be decreased to ensure the application of PTFE in high-frequency PWBs. This is because in high-frequency PWBs, the electric current is primarily concentrated on the interface between the metal and dielectric, which is regarded as a skin effect. Furthermore, PTFE should exhibit high thermal stability to prevent peeling off by metals. Therefore, for investigating the adhesion property of both pure-PTFE with low relative dielectric constant, dielectric loss tangent, and surface roughness, and GC-PTFE with high thermal stability is essential.
Previous studies have reported both wet and dry surface treatments for PTFE. The wet process involves chemical etching using a sodium (Na)-containing solution, whereas the dry process involves surface treatment by radiation and plasma. The surface treatment using Na-containing solution (Na treatment) improves the adhesion properties of the PTFE by leveraging the strong reduction power of metallic Na. First, the F atoms of the –CF2– chains of the PTFE surface are desorbed by the metallic Na, generating carbon radicals. Second, the carbon radicals react with H2O and O2 in the solution and atmosphere, and functional groups such as C![[double bond, length as m-dash]](https://www.rsc.org/images/entities/char_e001.gif) O, C–OH, and C–H are generated. Consequently, the surface free energy on PTFE increased and the adhesion property of PTFE improved.7 The adhesion strength between the electroless-plated Cu and pure-PTFE reportedly increased to 8.33 MPa by Na treatment after coarsening using sand paper.8 Furthermore, the adhesion strength between the vapor-deposited Cu- and Na-treated pure-PTFE increased up to 0.3 N mm−1 via ion beam radiation after Cu deposition.9 However, the Na treatment increased the surface roughness of the PTFE to improve its adhesion properties. Therefore, Na treatment is unsuitable for high-frequency PWBs because reducing the interface roughness between the dielectrics and metals is crucial for decreasing the transmission loss. Furthermore, the Na treatment poses environmental concerns and causes discoloration of the Na-treated PTFE. In the dry process, ion radiation, ultraviolet (UV) radiation, electron beam (EB), and plasma treatment have been applied to pure-PTFE. Ion radiation using Ar+ ion at 1 keV improved the adhesion properties of the vapor-deposited Cu and Cu sputtered on pure-PTFE.10,11 Furthermore, the adhesion strength between the vapor-deposited Cu and pure-PTFE increased from 0.01 to 0.35 N mm−1 upon low-energy Ar+-ion radiation under a reactive gas atmosphere such as O2 and NH3 gases because oxygen- and nitrogen-containing functional groups were generated and surface roughness was increased.12 However, the surface roughness of the ion-radiated PTFE increased.10–12 Therefore, the ion radiation is unsuitable for high-frequency PWBs.
O, C–OH, and C–H are generated. Consequently, the surface free energy on PTFE increased and the adhesion property of PTFE improved.7 The adhesion strength between the electroless-plated Cu and pure-PTFE reportedly increased to 8.33 MPa by Na treatment after coarsening using sand paper.8 Furthermore, the adhesion strength between the vapor-deposited Cu- and Na-treated pure-PTFE increased up to 0.3 N mm−1 via ion beam radiation after Cu deposition.9 However, the Na treatment increased the surface roughness of the PTFE to improve its adhesion properties. Therefore, Na treatment is unsuitable for high-frequency PWBs because reducing the interface roughness between the dielectrics and metals is crucial for decreasing the transmission loss. Furthermore, the Na treatment poses environmental concerns and causes discoloration of the Na-treated PTFE. In the dry process, ion radiation, ultraviolet (UV) radiation, electron beam (EB), and plasma treatment have been applied to pure-PTFE. Ion radiation using Ar+ ion at 1 keV improved the adhesion properties of the vapor-deposited Cu and Cu sputtered on pure-PTFE.10,11 Furthermore, the adhesion strength between the vapor-deposited Cu and pure-PTFE increased from 0.01 to 0.35 N mm−1 upon low-energy Ar+-ion radiation under a reactive gas atmosphere such as O2 and NH3 gases because oxygen- and nitrogen-containing functional groups were generated and surface roughness was increased.12 However, the surface roughness of the ion-radiated PTFE increased.10–12 Therefore, the ion radiation is unsuitable for high-frequency PWBs.
UV-induced graft polymerization with hydroxylethylacrylate (HEA), acrylamide (Aam), or glycidyl methacrylate (GMA) achieved an adhesion strength of 1.9 N mm−1 between the vapor-deposited Cu and Ar plasma-treated pure-PTFE.13 Nonetheless, to the best of our knowledge, no studies have directly adhered Cu to PTFE without graft polymerization. As reported, radiation-induced graft polymerization using acrylic acid delivered an adhesion strength of 1.03 N mm−1 between sputtered Cu/Cr and pure-PTFE.14 However, EB irradiation created a chain scission of the CF2 chains in pure-PTFE, which decreased the crystallinity and crystallite size15 while increasing the surface roughness.16 Moreover, the outermost surface modification of pure-PTFE using EB irradiation is challenging because the penetration depth of EB is 100–150 μm.16 Moreover, no studies have achieved strong adhesion between Cu and EB-irradiated pure-PTFE without graft polymerization. Plasma polymerization using GMA increased the adhesion strength between vapor-deposited Cu and pure-PTFE from 0.03 to 0.48 N mm−1.17 Furthermore, an adhesion strength of 1.9 N mm−1 was obtained between the vapor-deposited Cu and pure-PTFE by two-step graft polymerization using 1-vinylimidazole (VIDz) and GMA after Ar plasma treatment, followed by O2 plasma treatment.18 In addition, open-air type Ar + H2O plasma treatment and thermal compression achieved an adhesion strength of ≥0.8 N mm−1 between stainless steel (SUS304) and pure-PTFE or GC-PTFE.6 Ar + acrylic acid plasma jet treatment increased the adhesion strength between the electroless-plated Cu and pure-PTFE from 0.02 to 0.92 N mm−1.19 Furthermore, the adhesion strength between the electroless-plated Cu and plasma-treated perfluorinated ethylene propylene (FEP) was ∼1 N mm−1 without increasing the interface roughness.20 Plasma treatment and thermal compression achieved an adhesion strength of ≥1.2 N mm−1 between Cu and perfluoroalkoxyalkane (PFA).21 Prior research has attempted to enhance the adhesion properties between Cu and FEP or PFA, which exhibits the same dielectric constant and dielectric loss tangent as PTFE at 106 Hz.22
However, to the best of our knowledge, no studies have reported strong adhesion of Cu/PTFE without using adhesives and employing graft polymerization. In this study, plasma-treated pure-PTFE and GC-PTFE were adhered to Cu foils by thermal compression without adhesives. In addition, we comparatively analyzed the results of thermal compression under atmospheric pressure and reduced pressure atmosphere to investigate the effects of pressure during thermal compression. The surface-modification conditions and adhesion properties of fluoropolymers are summarized in Table 1.
Table 1 Surface-modification conditions and adhesion properties of various fluoropolymers
| Material |
Cu deposition method |
Surface treatment |
Adhesion strength |
Surface roughness (PTFE side) |
Intermediate layer |
Ref. |
| Pure-PTFE |
Electroless plating |
Chemical etching |
8.83 MPa |
Increase (1.8–1.9 μm) |
No |
8 |
| Pure-PTFE |
Evaporated |
Chemical etching + Bi24+ ion irradiation |
0.3 N mm−1 |
Increase (no data) |
No |
9 |
| Pure-PTFE |
Evaporated |
Ar+ ion irradiation |
No data |
Increase (rms = 50–226 nm) |
No |
10 |
| Pure-PTFE |
Sputtering |
Ar+ ion irradiation |
No data |
Increase (no data) |
No |
11 |
| Pure-PTFE |
Evaporated |
Ar+ ion irradiation |
0.01 to >0.35 N mm−1 |
Increase (no data) |
No |
12 |
| Pure-PTFE |
Evaporated |
Ar plasma + UV irradiation |
1.9 N mm−1 |
No data |
HEA, AAM and GMA |
13 |
| Pure-PTFE |
Sputtering |
EB irradiation |
1.03 N mm−1 |
No data |
Acrylic acid |
14 |
| Pure-PTFE |
Evaporated |
Ar plasma |
0.03–0.48 N mm−1 |
Decrease (Ra = 60–20 nm) |
GMA |
17 |
| Pure-PTFE |
Evaporated |
Ar plasma |
1.9 N mm−1 |
No data |
VIDz and GMA |
18 |
| Pure-PTFE |
Electroless plating |
Ar + acrylic acid plasma jet |
0.02–0.92 N mm−1 |
Decrease (no data) |
Acrylic acid |
19 |
| FEP |
Electroless plating |
Low pressure plasma |
1 N mm−1 |
Decrease (Rz = 97.1–77.1 nm) |
No |
20 |
| PFA |
Cu foil |
Low pressure plasma |
>1.2 N mm−1 |
No change (Rz = 42–42 nm) |
No |
21 |
| Pure-PTFE |
Cu foil |
Heat-assisted plasma |
This study |
This study |
No |
This study |
| GC-PTFE |
Cu foil |
Heat-assisted plasma |
This study |
This study |
No |
This study |
Experimental
Materials
Pure-PTFE sheets (no. 900UL, Nitto Denko, Japan; thickness: 0.2 mm) and GC-PTFE sheets (no. 9700UL, Nitto Denko, Japan; thickness: 0.23 mm) were cut into specimens of dimensions 45 mm × 70 mm used as the PTFE samples. Cu foils (CU-113381, Nilaco, Japan; thickness: 0.2 mm) were cut into specimens of dimensions 100 mm × 100 mm used as the metal foil samples for adhering to pure-PTFE and GC-PTFE. Pure-PTFE sheets, GC-PTFE sheets, and Cu foils were washed with acetone (99.5%, Kishida Chemical, Japan) for 1 min using an ultrasonic bath (USK-1R, AS ONE, Japan). Thereafter, pure-PTFE sheets and GC-PTFE sheets were washed with pure water for 1 min using an ultrasonic bath. After ultrasonic washing, the pure-PTFE sheets, GC-PTFE sheets, and Cu foils were dried using N2 gun (99.99%, Iwatani Fine Gas, Japan).
Apparatuses
Pure-PTFE and GC-PTFE sheets were plasma-treated under atmospheric pressure using a custom-made chamber system (Meisyo Kiko, Japan), similar to a previous study.23 This system comprises a high-frequency power source (KD-01, Noda RF Technologies, Japan), chamber, matching unit (NCD-01, Noda RF Technologies, Japan), electrode, electrode lifting mechanism, sample, sample table control unit, rotary pump (EC603, ULVAC, Japan), and radiation thermometer (FT-H40K, FT-50A, Keyence, Japan). The atmosphere in the chamber was evacuated to 10 Pa, and He gas (99.99%, Iwatani Fine Gas, Japan) was introduced at atmospheric pressure. For the radio frequency of 13.56 MHz, the applied power density was set at 19.1 W cm−2. The gap between the electrodes and samples was 1 mm and the surface temperature of the PTFE samples was increased to 200 °C ± 5 °C by plasma treatment for 600 s. Fig. 1 shows the schematic of plasma treatment apparatus. As reported in a previous study,24 the adhesion property did not improve if the surface temperature of the plasma-treated pure-PTFE was <100 °C. This is because the WBL5 on pure-PTFE surfaces was not eliminated. Therefore, in this study, the PTFE surface was plasma-treated at a high power density while maintaining a high temperature (∼200 °C) via spontaneous temperature increase to eliminate WBL, which is called heat-assisted plasma (HAP) treatment.
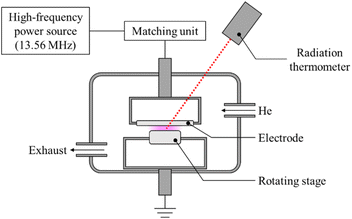 |
| | Fig. 1 Schematic of plasma treatment apparatus. | |
Confocal laser scanning microscope (CLSM) observation
A CLSM (LEXT OLS4100, Olympus, Japan) was used to measure the surface roughness of the Cu foil and PTFE samples before and after HAP treatment. The two-dimensional arithmetic mean estimation Ra, root–mean–square Sq, the three-dimensional arithmetic mean estimation Sa, and the maximum height Sz of the roughness were calculated for an area of 643 μm × 643 μm. The surface roughness measurements were repeated for three instances at varying points using the same samples, and the average of the three values was defined as the surface roughness.
Scanning electron microscopy (SEM) analysis
The morphologies of the Cu, pure-PTFE, and GC-PTFE surfaces before and after the HAP treatment were observed using a field-emission SEM (FE-SEM, S4800, Hitachi High-Tech, Japan). In addition, the morphologies of peeled surface of Cu/pure-PTFE and Cu/GC-PTFE were observed. The acceleration voltage was 5 kV. The surfaces of the pure-PTFE and GC-PTFE and peeled surface of Cu samples were coated with a thin Au film using a sputtering apparatus (Smart Coater, JEOL, Japan) to avoid surface charging.
Adhesion strength measurements
The HAP-treated pure-PTFE and GC-PTFE samples were directly adhered to Cu foils by thermal compression to measure the adhesion strengths between the PTFE and Cu samples. The HAP-treated PTFE samples were sandwiched between the Cu and SUS304 foils (3-2158-09, AS ONE, Japan), which were subsequently sandwiched between two plates and compressed under 2 MPa at 320 °C for 10 min using a compression molding machine. Thermal compression at the interface of Cu foil and PTFE facilitated the formation of a chemical bond. It also enabled the penetration into slight roughness on the Cu foil surface by improving the molecular mobility of the PTFE surface. The adhesion strength was compared between the thermal compression and heat release under atmospheric conditions and the thermal compression under reduced pressure atmosphere and heat release under Ar atmosphere. A compression molding machine (H400-15, AS ONE, Japan) was applied for performing thermal compression under atmospheric conditions, and a compression molding machine (IMC-11FD, Imoto machinery Co., LTD, Japan) was used to perform thermal compression under reduced pressure. The Cu foil was fixed on the stage using two SUS304 bars and PTFE side was clutched to the upper chuck. Fig. S1† shows the schematic of 90° peel test. The samples were positioned using an electrically driven test stand (MX-500N, IMADA, Japan), and the adhesion strength measurements were conducted using a digital force gauge (ZP-200N, IMADA, Japan). The width of Cu/pure-PTFE and Cu/GC-PTFE samples were 10 mm. The adhesion strength of Cu/pure-PTFE and Cu/GC-PTFE was obtained by measuring the force required to peel off 10 mm-wide Cu/PTFE samples and then dividing that force by ten. The pure-PTFE and GC-PTFE samples were HAP-treated three times, and the adhesion strength measurements were repeated on three instances. The average of the three values was defined as the Cu/PTFE adhesion strength, and the error bar exhibited the standard error.
X-ray photoelectron spectroscopy (XPS) analysis
XPS (Quantum2000, ULVAC-PHI, Japan) was applied to investigate the variations in the chemical bonding state of the pure-PTFE and GC-PTFE surfaces before and after HAP treatment. Additionally, it was used to investigate the chemical bonding state of peeled surface of Cu/pure-PTFE and Cu/GC-PTFE. The cumulative number, pass energy, and step size were 3, 25.00 eV, and 0.05 eV, respectively. The X-ray take-off angle was 45°, and surface charging was avoided using low-speed EB and low-speed Ar-ion beam during XPS measurement. The measured XPS data were analyzed using data analysis software (MultiPak V8.2C, 2007-9-04). As reported, the peak corresponding to the CF2 of PTFE was observed at 292.5 eV.25,26 Therefore, the measured XPS data were calibrated using this reference positions.
Results and discussion
Surface roughness measurement of Cu foil
A CLSM was used to measure the surface roughness of the Cu foil. The CLSM and SEM images of the Cu foil surface are depicted in Fig. 2 and 3, respectively, and the four types of surface roughness (Ra, Sq, Sa, and Sz) are listed in Table 2. The Ra of the Cu foil surface used in this study was 0.08 μm. In general, commercially purchased Cu foils exhibit an Ra ≥ 1 μm owing to the roughening treatment because high surface roughness facilitates strong adhesion.27 Although smooth Cu foils were purchased, they have roughness of Ra ≈ 0.20 μm.28 Notably, the surface roughness of the Cu foil used in this study was substantially less than that of commercially available Cu foils. Therefore, the Cu foils used herein are suitable for adhering to PTFE without increasing the interface roughness, which is the fundamental objective of this research.
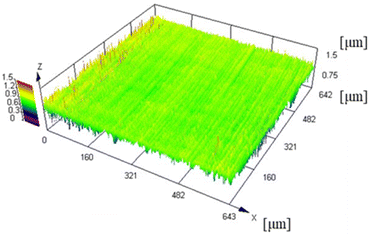 |
| | Fig. 2 CLSM image of Cu foil surface. | |
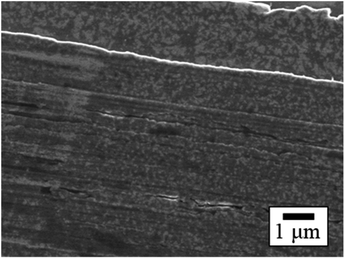 |
| | Fig. 3 SEM image of Cu foil surface. | |
Table 2 Surface roughness of Cu foil
| Ra |
0.08 ± 0.00 μm |
| Sa |
0.08 ± 0.00 μm |
| Sq |
0.11 ± 0.00 μm |
| Sz |
1.69 ± 0.05 μm |
Adhesion strength measurement by a 90° peel test
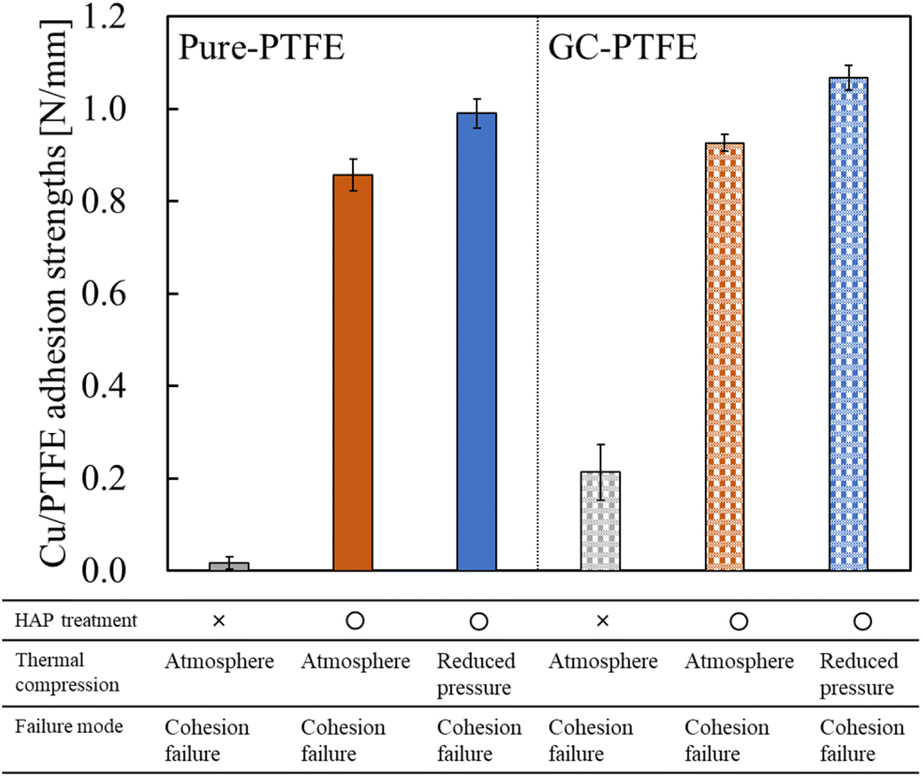
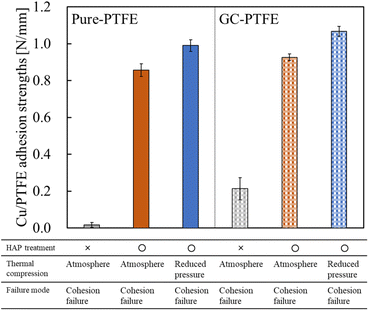
The adhesion strengths of Cu/pure-PTFE and Cu/GC-PTFE samples under varying thermal compression conditions are presented in Fig. 4, and the photographs recorded during the 90° peel test are exhibited in Fig. 5. For the as-received pure-PTFE and HAP-treated pure-PTFE, the adhesion strength was 0.02 N mm−1 and 0.86 N mm−1, respectively, after performing thermal compression under atmospheric conditions. Moreover, for the as-received GC-PTFE and HAP-treated GC-PTFE, the adhesion strength was 0.21 N mm−1 and 0.93 N mm−1, respectively, after performing thermal compression under atmospheric conditions. Thus, the adhesion strength of Cu/GC-PTFE was higher than that of Cu/pure-PTFE for both as-received and HAP-treated PTFEs. For the as-received PTFE, the adhesion strength of Cu/GC-PTFE was higher than that of Cu/pure-PTFE because WBL does not exist on the GC-PTFE surface. Furthermore, for the HAP-treated PTFE, the adhesion strength of Cu/GC-PTFE was slightly higher than that of Cu/pure-PTFE. As depicted in Fig. 5, the PTFE was attached to the Cu foil surface after 90° peel test for HAP-treated pure-PTFE and GC-PTFE, and the cohesion failure of PTFE was confirmed from visual observation. Cohesion failure of PTFE occurred regardless of the sample type and adhesion conditions. In addition, for the HAP-treated pure-PTFE and GC-PTFE, the adhesion strength of Cu/pure-PTFE and Cu/GC-PTFE increased to 0.99 N mm−1 and 1.07 N mm−1, respectively, upon reducing the ambient pressure from atmospheric pressure (101![[thin space (1/6-em)]](https://www.rsc.org/images/entities/char_2009.gif) 300 Pa) to 9 Pa during thermal compression. In this study, the adhesion strength was obtained by measuring the force required to peel off 10 mm-wide Cu/PTFE samples and then dividing that force by ten. Therefore, the force required for peeling off Cu/PTFE and the adhesion strength of Cu/PTFE was decreased when the areas of adhesion failure existed between the 10 mm-wide Cu/PTFE. In some areas, Cu foil and PTFE were not in contact due to the presence of air between them when thermal compression was performed under atmosphere. Conversely, the contact areas between Cu foil and PTFE increased because the air was removed by reducing the ambient pressure. In addition, the adhesion areas increased with an increase in the contact areas. Therefore, thermal compression increased the adhesion strength under reduced pressure, although the cohesion strength was the same.
300 Pa) to 9 Pa during thermal compression. In this study, the adhesion strength was obtained by measuring the force required to peel off 10 mm-wide Cu/PTFE samples and then dividing that force by ten. Therefore, the force required for peeling off Cu/PTFE and the adhesion strength of Cu/PTFE was decreased when the areas of adhesion failure existed between the 10 mm-wide Cu/PTFE. In some areas, Cu foil and PTFE were not in contact due to the presence of air between them when thermal compression was performed under atmosphere. Conversely, the contact areas between Cu foil and PTFE increased because the air was removed by reducing the ambient pressure. In addition, the adhesion areas increased with an increase in the contact areas. Therefore, thermal compression increased the adhesion strength under reduced pressure, although the cohesion strength was the same.
 |
| | Fig. 4 Adhesion strength between Cu foil and PTFE sheet at varying thermal compression conditions. | |
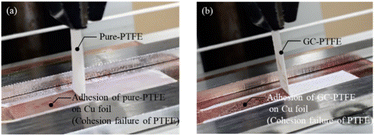 |
| | Fig. 5 Photographs during 90° peel test: (a) Cu/pure-PTFE; (b) Cu/GC-PTFE. | |
Influence of chemical bonding state on adhesion strength
The chemical bonding state of the pure-PTFE and GC-PTFE surfaces was investigated before and after HAP treatment using XPS analysis. The C 1s-XPS spectra of pure-PTFE and GC-PTFE surfaces before and after HAP treatment are illustrated in Fig. 6. For the as-received pure-PTFE and GC-PTFE surfaces, the peak indexed to –CF2– (292.5 eV) was observed. For the HAP-treated pure-PTFE and GC-PTFE surfaces, the peaks indexed to O–CO (289.2 eV), CO (288.0 eV), and C–O (286.5 eV) appeared.29,30 Based on this result, the F atoms of the as-received PTFE surface were desorbed and oxygen-containing functional groups were generated at the PTFE surface by HAP treatment. The amount of oxygen-containing functional group generation did not differ between the HAP-treated pure-PTFE and GC-PTFE. The Si 2p-XPS spectra of the GC-PTFE surface before and after HAP treatment are illustrated in Fig. 7. The peak indexed to Si was not observed even after HAP treatment, and as observed, the glass cloth inside the GC-PTFE was not exposed to the HAP-treated GC- PTFE surface. Therefore, the Cu/HAP-treated GC-PTFE adhesion strength did not increase because the glass cloth exposed to GC-PTFE surface was adhered to the Cu foil.
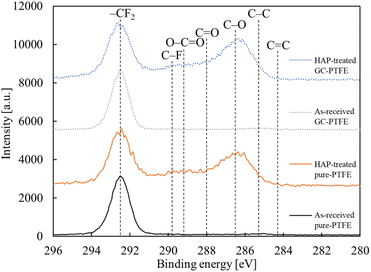 |
| | Fig. 6 C 1s-XPS spectra of PTFE samples before and after HAP treatment. | |
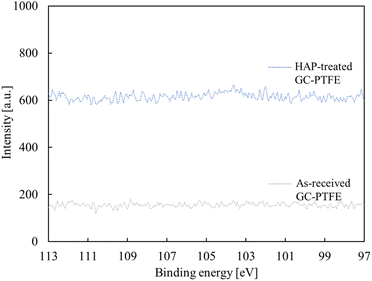 |
| | Fig. 7 Si 2p-XPS spectra of GC-PTFE samples before and after HAP treatment. | |
Influence of surface morphology on adhesion strength
The SEM images of PTFE samples before and after HAP treatment are depicted in Fig. 8. On the surface of the as-received pure-PTFE, voids and cutting damage were observed (Fig. 8(a)), indicating the existence of the WBL introduced on the pure-PTFE surface during the manufacturing process. In contrast, the damage was not observed on the HAP-treated PTFE surface, and the WBL was removed by HAP treatment (Fig. 8(b)). Additionally, the preferential etching of the amorphous part of PTFE has been reported.31 Consequently, the mechanical strength of the pure-PTFE surface was improved, thus minimizing the likelihood of cohesion failure through WBL removal and amorphous part etching. The elevated adhesion strength between Cu and HAP-treated pure-PTFE can be attributed to this increased mechanical strength. On the as-received GC-PTFE surface, a fibrous shape was observed rather than any cutting damage (Fig. 8(c)). This fibrous shape was considered to be a component of the crystalline structure. In contrast, on the HAP-treated GC-PTFE surface, both the fibrous and circular shapes were observed (Fig. 8(d)). Specifically, the circular shape was generated by etching the fibrous shape during the HAP treatment and observed as a cross-section of the fibers. Moreover, the glass cloth inside the GC-PTFE remained unexposed. Additionally, the mechanical strength of GC-PTFE surface was increased through HAP treatment because the preferential etching of the amorphous part occurred on GC- PTFE surface. Therefore, the increase in the adhesion strength of the Cu/HAP-treated GC-PTFE cannot be attributed to the glass cloth adhered to the Cu foil, and can be attributed to the increase in the cohesion strength. In addition, the surface roughness of the HAP-treated pure-PTFE and GC-PTFE did not increase.
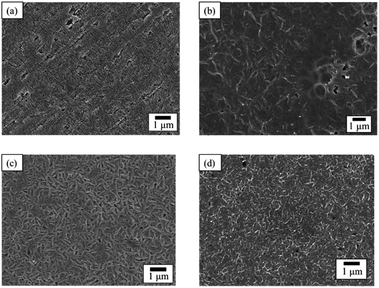 |
| | Fig. 8 SEM images of PTFE surface before and after HAP treatment: (a) as-received pure-PTFE; (b) HAP-treated pure-PTFE; (c) as-received GC-PTFE; and (d) HAP-treated GC-PTFE. | |
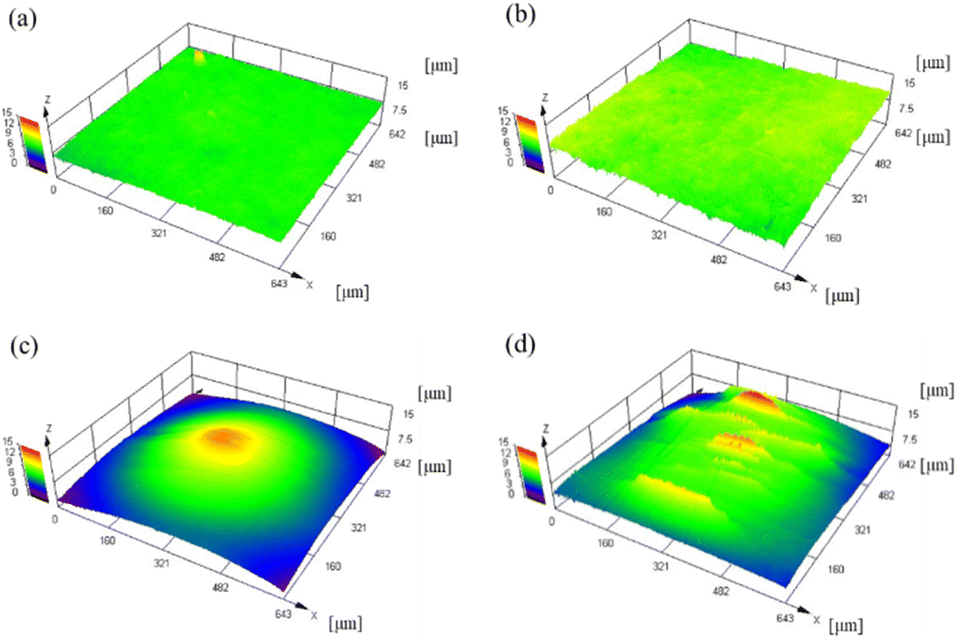
CLSM was used to measure the surface roughness of the PTFE samples before and after the HAP treatment. The CLSM images of the PTFE surface before and after HAP treatment are portrayed in Fig. 9, and the indicators of surface roughness (Sq and Sa) are listed in Table 3. As depicted in Fig. 9 and Table 3, the surface roughness increased marginally during the HAP treatment for pure-PTFE and GC-PTFE; however, the amount of increase in the surface roughness was within the error bar. To apply PTFE as dielectrics for high-frequency PWBs, the adhesion of PTFE to Cu is essential without increasing the surface roughness of both PTFE and Cu. Therefore, the adhesion between Cu and PTFE must be achieved without the anchor effect. The surface roughness of GC-PTFE was larger than pure-PTFE, regardless of the plasma treatment, because the high surface roughness of the glass cloth inside GC-PTFE.
 |
| | Fig. 9 CLSM images of PTFE surface before and after HAP treatment: (a) as-received pure-PTFE; (b) HAP-treated pure-PTFE; (c) as-received GC-PTFE; and (d) HAP-treated GC-PTFE. | |
Table 3 Surface roughness of PTFE samples before and after HAP treatment
| |
As-received pure-PTFE (μm) |
HAP-treated pure-PTFE (μm) |
As-received GC-PTFE (μm) |
HAP-treated GC-PTFE (μm) |
| Sa |
0.40 ± 0.09 |
0.50 ± 0.06 |
1.87 ± 0.51 |
3.05 ± 1.17 |
| Sq |
0.50 ± 0.10 |
0.63 ± 0.06 |
2.30 ± 0.66 |
3.73 ± 1.44 |
Analysis of peeled surface
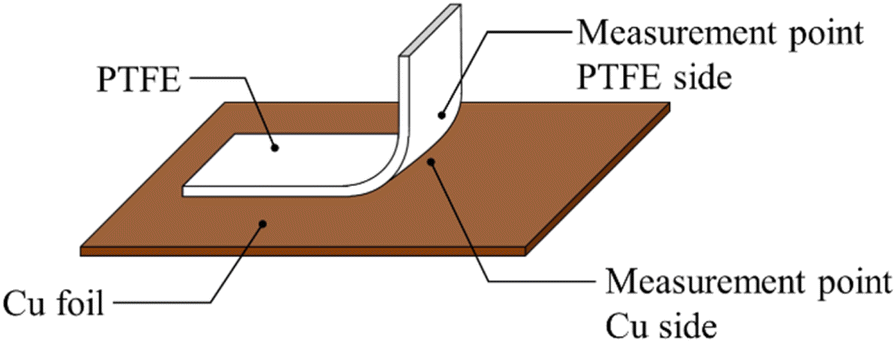
Fig. 10 shows schematic of the measurement points of peeled surface. As shown in this figure, the surfaces of Cu foil, pure-PTFE, and GC-PTFE after 90° peeling test were investigated using XPS and SEM. Fig. 11 shows C 1s-XPS spectra of peeled surface, while Fig. 12 shows Cu 2p3/2 spectra of peeled surface. Cu and PTFE were adhered by thermal compression in the atmosphere. As shown in the C 1s-XPS spectra of as-received pure-PTFE and GC-PTFE, only the peak indexed to CF2– was observed in PTFE and Cu foil sides. Furthermore, the Cu 2p3/2-XPS spectra of as-received pure-PTFE and GC-PTFE showed the peak indexed to Cu (932.6 eV).32 Thus, cohesion of PTFE failed for as-received pure-PTFE and GC-PTFE, and the thickness of PTFE adhered to the Cu foil was thinner than XPS-detected depth of several nanometers. The PTFE cohesion failure was considered to occur inside the WBL because the depth of WBL was in the order of μm.5 In the case of HAP-treated pure-PTFE and GC-PTFE, the peak indexed to the oxygen-containing functional groups, such as C–O and CO, in the modified layer were not observed. Additionally, only the peak indexed to CF2– from PTFE and Cu foil sides was observed in the C 1s-XPS spectra. In the case of HAP-treated pure-PTFE and GC-PTFE, the peak indexed to Cu was not observed in the Cu 2p3/2 spectra of PTFE and Cu foil sides. Therefore, for HAP-treated pure-PTFE and GC-PTFE, the cohesion failure of PTFE occurred deeper than the modified layer, and a thicker PTFE than XPS detection depth was adhered to Cu foil. As shown Fig. S2 and S3,† in some areas of GC-PTFE, the peak indexed to additive agent that adhere PTFE to glass cloth, such as CH2–, and the peak indexed to Si were observed in C 1s-XPS spectra and Si 2p-XPS spectra, respectively. In these areas, glass cloth inside GC-PTFE was exposed on GC-PTFE surface due to cohesion failure of GC-PTFE.
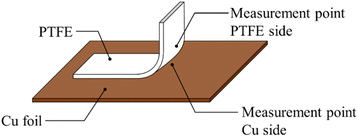 |
| | Fig. 10 Schematic of measurement points of peeled surface. | |
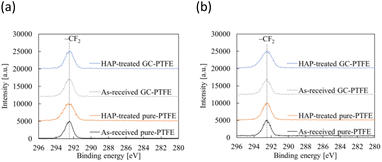 |
| | Fig. 11 C 1s-XPS spectra of peeled surface: (a) PTFE and (b) Cu foil sides. | |
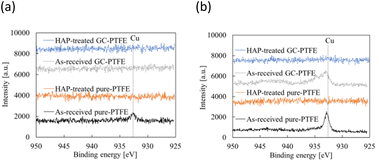 |
| | Fig. 12 Cu 2p3/2-XPS spectra of peeled surface: (a) PTFE and (b) Cu foil sides. | |
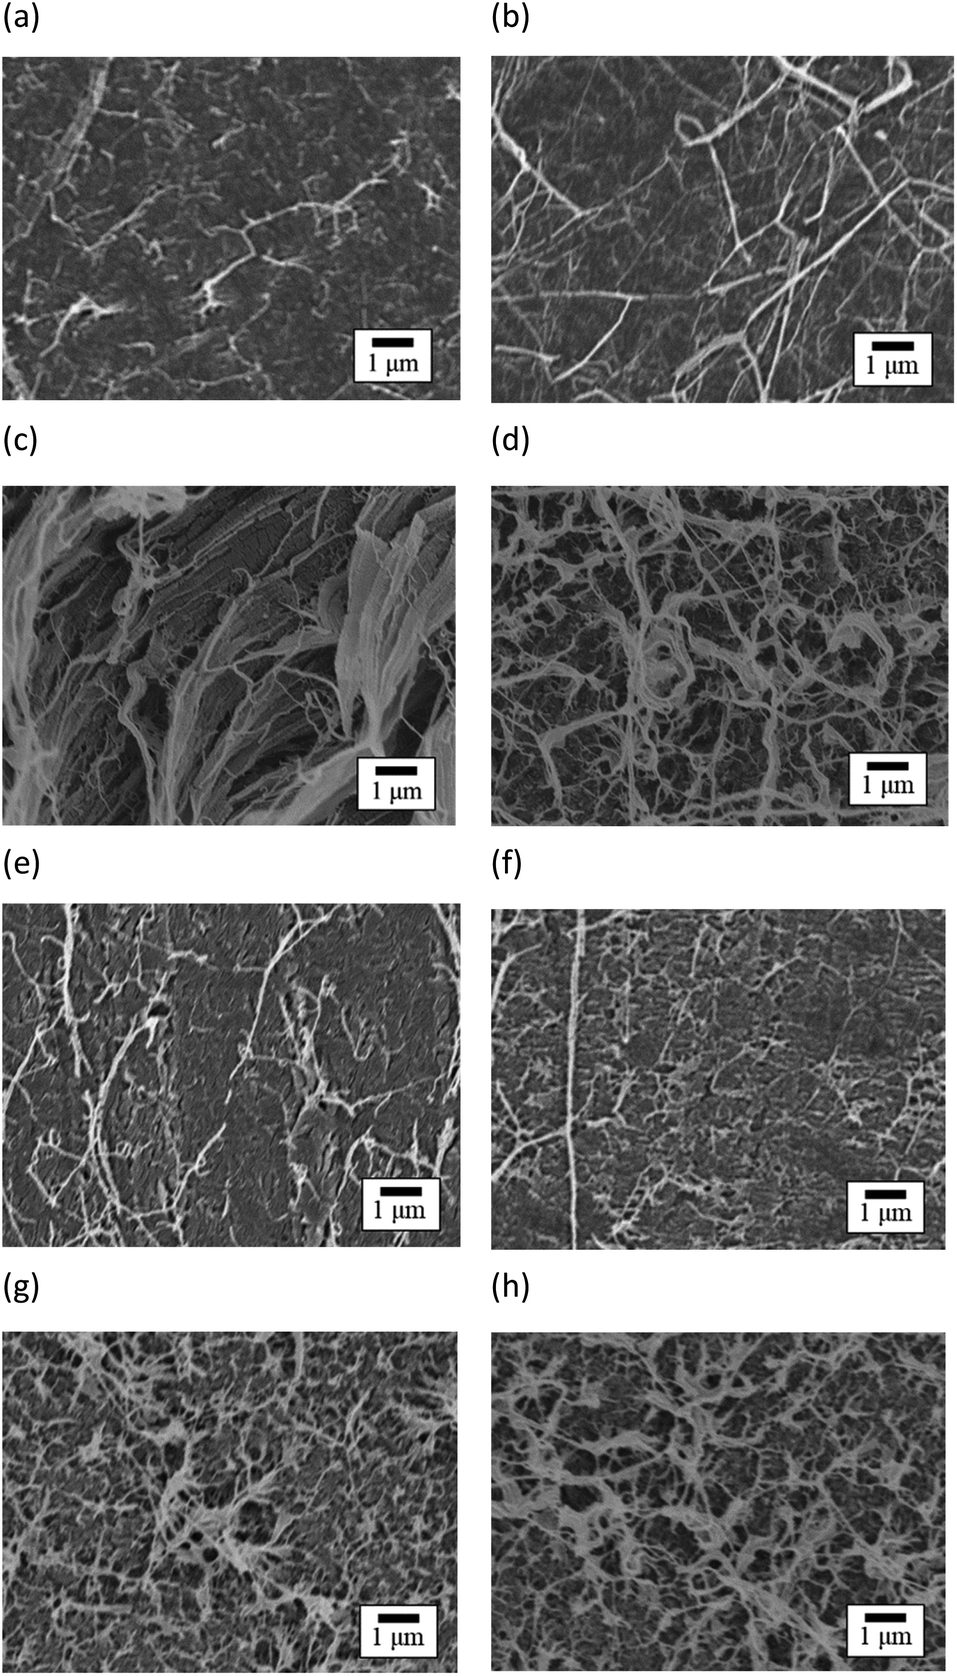
Fig. 13 shows the SEM images of peeled surface. The fibrils occurred on the peeled surface of PTFE, regardless of sample type and HAP treatment, due to cohesion failure of PTFE.12 Note that these fibrils were not observed on the PTFE and Cu surfaces before adhesion. Therefore, these fibrils were considered to obtain their particular shape due to cohesion failure of PTFE. In addition, the density of fibrils on the peeled surface of HAP-treated PTFE was larger than that on peeled surface of as-received PTFE for pure-PTFE and GC-PTFE. This is because Cu/HAP-treated PTFE was peeled with higher strength than Cu/as-received PTFE. XPS measurements and SEM images revealed the cohesion failure of PTFE, regardless of the sample type and HAP treatment. Therefore, on the outermost surface, the as-received PTFE sheet was adhered to the Cu foil by the small anchor effect by penetrating into slight roughness of Cu foil, even though the adhesion strength was low. However, the amount of PTFE adhered on Cu surface was determined by the sample type and HAP treatment. The thickness of as-received pure-PTFE adhered on Cu surface was thinner than XPS detection depth. Cohesion failure of PTFE occurred in the WBL. Consequently, the adhesion strength was low because the WBL existed on the pure-PTFE surface and pure-PTFE did not interact with Cu due to the absence of the oxygen-containing functional groups. Furthermore, the adhesion strength of as-received GC-PTFE was low because it did not interact with Cu due to the absence of the oxygen-containing functional groups, whereas that of HAP-treated pure-PTFE and GC-PTFE was increased due to the formation of oxygen-containing functional group and interaction between PTFE and Cu. In addition, the glass cloth inside HAP-treated GC-PTFE was exposed on some areas of the GC-PTFE surface after 90° peel test. These results indicate that more PTFE could adhere to the Cu foil surface for Cu/HAP-treated GC-PTFE than for Cu/HAP-treated pure-PTFE. Thus, Cu/HAP-treated GC-PTFE obtained slightly higher adhesion strength compared to Cu/HAP-treated pure-PTFE.
 |
| | Fig. 13 SEM images of peeled surface: (a) PTFE side of as-received pure-PTFE; (b) Cu side of as-received pure-PTFE; (c) PTFE side of HAP-treated pure-PTFE; (d) Cu side of HAP-treated pure-PTFE; (e) PTFE side of as-received GC-PTFE; (f) Cu side of as-received GC-PTFE; (g) PTFE side of HAP-treated GC-PTFE; and (h) Cu side of HAP-treated GC-PTFE. | |
Conclusions
This study achieved direct adhesion between a Cu foil with low surface roughness (Ra = 0.08 μm) and plasma-treated pure-PTFE and GC-PTFE. After performing thermal compression under atmospheric conditions, an adhesion strength of 0.9 N mm−1 was achieved by HAP treatment of both PTFEs. In addition, the adhesion strength of Cu/pure-PTFE and Cu/GC-PTFE was increased to 1 N mm−1 by thermal compression under reduced pressure atmosphere. Furthermore, the generation of oxygen-containing functional groups on the surface of the HAP-treated PTFE was confirmed by C 1s-XPS spectra before and after the HAP treatment. As confirmed by the Si 2p-XPS spectra, the glass cloth remained concealed from the surface of the HAP-treated GC-PTFE. The SEM images indicated that the WBL on the as-received pure-PTFE surface was eliminated by the HAP treatment. In addition, the WBL did not exist on the GC-PTFE surface. In both the cases of pure-PTFE and GC-PTFE, the surface roughness did not significantly increase by plasma treatment. Overall, pure-PTFE exhibited a lower surface roughness than GC-PTFE. Thus, the adhesion strength of pure-PTFE was increased by generating oxygen-functional groups and removing WBL via HAP treatment. The adhesion strength of GC-PTFE was marginally higher than that of pure-PTFE because of generating the functional groups and high mechanical strength. Furthermore, for both pure-PTFE and GC-PTFE, strong adhesion between Cu/PTFE was achieved without increasing the interface roughness of Cu/PTFE. Pure-PTFE has low relative dielectric constant, dielectric loss tangent, and surface roughness, but it has large CTE; hence, there is a need for a structure to prevent the thermal expansion. While GC-PTFE has low CTE, it has larger relative dielectric constant, dielectric loss tangent, and surface roughness than pure-PTFE. Therefore, the relative dielectric constant, dielectric loss tangent, and the diameter of added glass cloth inside GC-PTFE must be decreased. Regardless of the materials, strong adhesion between Cu and PTFE is vital for applying PTFE to high-frequency PWBs without increasing the roughness of PTFE surface. Therefore, this method is advantageous for manufacturing high-frequency PWBs because the strong adhesion of Cu/PTFE without increasing PTFE surface roughness decreases the transmission loss of PWBs.
Author contributions
Y. O. and K. Y. supervised the work. M. N. and T. K. performed plasma treatments and prepared plasma-treated PTFE samples. M. N. performed adhesion strength measurement, XPS measurements, CLSM observation, and SEM analysis. All authors contributed to the scientific discussion and manuscript preparation. M. N. wrote the manuscript.
Conflicts of interest
There are no conflicts to declare.
Acknowledgements
This work was supported by JST SPRING, Grant Number JPMJSP2138.
Notes and references
- Y. C. Chen, H. C. Lin and Y. D. Lee, J. Polym. Res., 2003, 10, 247–258 CrossRef CAS.
- D. K. Owens and R. C. Wendt, J. Appl. Polym. Sci., 1969, 13, 1741–1747 CrossRef CAS.
- V. K. Kumikov and K. B. Khokonov, J. Appl. Phys., 1983, 54, 1346–1350 CrossRef CAS.
- J. Jiang, L. Zhu, L. Zhu, B. Zhu and Y. Xu, Langmuir, 2011, 27, 14180–14187 CrossRef CAS PubMed.
- Y. Seto, M. Nishino, Y. Okazaki, K. Endo, K. Yamamura and Y. Ohkubo, Polym. J., 2022, 54, 79–81 CrossRef CAS.
- M. Nishino, Y. Okazaki, Y. Seto, T. Uehara, K. Endo, K. Yamamura and Y. Ohkubo, Polymers, 2022, 14, 394 CrossRef CAS PubMed.
- J. T. Marchesi, H. D. Keith and A. Garton, J. Adhes., 1992, 39, 185–205 CrossRef CAS.
- C. G. Sonwane, L. G. Bhatgadde, J. R. Bellare and Q. Li, J. Mater. Sci. Lett., 1999, 18, 1205–1208 CrossRef CAS.
- L. Wang, N. Angert, C. Trautmann and J. Vetter, J. Adhes. Sci. Technol., 1995, 9, 1523–1529 CrossRef CAS.
- S.-K. Koh, S.-C. Park, S.-R. Kim, W.-K. Choi, H.-J. Jung and K. D. Pae, J. Appl. Polym. Sci., 1997, 64, 1913–1921 CrossRef CAS.
- S. W. Lee, J. W. Hong, M. Y. Wye, J. H. Kim, H. J. Kang and Y. S. Lee, Nucl. Instrum. Methods Phys. Res., Sect. B, 2004, 219–220, 963–967 CrossRef CAS.
- Y. Seo, S. Kim, H. Kim and J. Kim, Langmuir, 2005, 21, 3432–3435 CrossRef CAS PubMed.
- S. Wu, E. T. Kang, K. G. Neoh and K. L. Tan, Polymer, 1999, 40, 6955–6964 CrossRef CAS.
- N. Ito, A. Mase, N. Seko, M. Tamada, E. Sakata and Y. Kogi, Jpn. J. Appl. Phys., 2006, 45, 9244–9246 CrossRef CAS.
- G. Jinglong, N. Zaochun and L. Yanhui, e-Polymers, 2016, 16, 111–115 Search PubMed.
- Y. Nishi, M. Uyama, H. Kawazu, H. Takei, K. Iwata, H. Kudoh and K. Mitsubayashi, Mater. Trans., 2012, 53, 1657–1664 CrossRef CAS.
- X. P. Zou, E. T. Kang, K. G. Neoh, C. Q. Cui and T. B. Lim, Polymer, 2001, 42, 6409–6418 CrossRef CAS.
- S. Wu, E. T. Kang, K. G. Neoh, H. S. Han and K. L. Tan, Macromolecules, 1999, 32, 186–193 CrossRef CAS.
- M. Okubo, M. Tahara, T. Kuroki, T. Hibino and N. Saeki, J. Photopolym. Sci. Technol., 2008, 21, 219–224 CrossRef CAS.
- S. Ikeda and Y. Kobayashi, J. Surf. Finish. Soc. Jpn., 2020, 71, 775–780 CrossRef.
- Y. Kobayashi and S. Ikeda, J. Surf. Finish. Soc. Jpn., 2021, 72, 333–339 CrossRef.
- G. Lopez, Recent Prog. Mater., 2021, 3, 1–15 Search PubMed.
- Y. Ohkubo, K. Ishihara, H. Sato, M. Shibahara, A. Nagatani, K. Honda, K. Endo and Y. Yamamura, RSC Adv., 2017, 7, 6432–6438 RSC.
- Y. Ohkubo, K. Ishihara, M. Shibahara, A. Nagatani, K. Honda, K. Endo and K. Yamamura, Sci. Rep., 2017, 7, 9476 CrossRef PubMed.
- N. Vandencasteele and F. Reniers, J. Electron Spectrosc. Relat. Phenom., 2010, 178–179, 394–408 CrossRef CAS.
- J. Hubert, T. Dufour, N. Vandencasteele, S. Desbief, R. Lazzaroni and F. Reniers, Langmuir, 2012, 28, 9466–9474 CrossRef CAS PubMed.
- S. Bok, G.-H. Lim and B. Lim, J. Ind. Eng. Chem., 2017, 46, 199–202 CrossRef CAS.
- K. Sugimoto, T. Ohsawa, K. Kawai, M. Kirinaka, D. Mizutani, M. Watanabe and H. Honma, J. Surf. Finish. Soc. Jpn., 2018, 69, 38–45 CrossRef CAS.
- K. G. Kostov, T. M. C. Nishime, A. H. R. Castro, A. Toth and L. R. O. Hein, Appl. Surf. Sci., 2014, 314, 367–375 CrossRef CAS.
- C.-S. Ren, K. Wang, Q.-Y. Nie, D.-Z. Wang and S.-H. Guo, Appl. Surf. Sci., 2008, 255, 3421–3425 CrossRef CAS.
- J. P. Youngblood and T. J. McCarthy, Macromolecules, 1999, 32, 6800–6806 CrossRef CAS.
- I. Platzman, R. Brener, H. Haick and R. Tannenbaum, J. Phys. Chem. C, 2008, 112, 1101–1108 CrossRef CAS.
|
| This journal is © The Royal Society of Chemistry 2023 |
Click here to see how this site uses Cookies. View our privacy policy here. 
 Open Access Article
 This Open Access Article is licensed under a Creative Commons Attribution-Non Commercial 3.0 Unported Licence
 ,
Takumi Kodama,
Kazuya Yamamura and
Yuji Ohkubo
,
Takumi Kodama,
Kazuya Yamamura and
Yuji Ohkubo