 Open Access Article
Creative Commons Attribution 3.0 Unported Licence
Black Sea hydrate production value and options for clean energy production
Bjørn Kvamme *abc and
Atanas Vasilevd
aState Key Laboratory of Oil and Gas Reservoir Geology and Exploitation, Southwest Petroleum University, Xindu Road No. 8, Chengdu 610500, China. E-mail: bkvamme@strategic-carbonllc.com; Tel: +86 47 9345 1956
bState Key Laboratory of Natural Gas Hydrate, Sun Palace South Street No. 6, Beijing 10027, China
cStrategic Carbon LLC, 7625 Rancho Vista BLVD W, Corpus Christi, 78414, TX, USA
dInstitute of Oceanology – Bulgarian Academy of Sciences, First May str. 40, PO Box 152, Varna 9000, Bulgaria
First published on 11th July 2023
Abstract
Natural gas hydrates of Bulgaria and Romania in the Black Sea have been subject to studies by several European research projects. The current understanding of the hydrate distribution, and the total amounts of hydrate in the region, makes it interesting to evaluate in terms of commercial potential. In this study, we have evaluated some well-known hydrate production methods. Thermal stimulation and adding chemicals are considered as not economically feasible. Pressure reduction may not be efficient due to the endothermic dissociation of hydrates and long-term cooling of the sediments. Chemical work due to pressure reduction is an additional mechanism but is too slow to be commercially feasible. Adding CO2/N2, however, has a dual value. In the future, CO2 can be stored at a price proportional to a CO2 tax. This is deducted from the value of the released natural gas. The maximum addition of N2 is around 30 mol% of the CO2/N2 mixture. A minor addition (in the order of 1 mol%) of CH4 increases the stability of the hydrate created from the injection gas. The maximum N2 amount is dictated by the demand for the creation of a new hydrate from injection gas but also the need for sufficient heat release from this hydrate formation to dissociate the in situ CH4 hydrates. An additional additive is needed to accelerate the formation of hydrate from injection gas while at the same time reducing the creation of blocking hydrate films. Based on reasonable assumptions and approximations as used in a verified kinetic model it is found that CH4/CO2 swapping is a feasible method for Black Sea hydrates. It is also argued that the technology is essentially conventional petroleum technology combined with learning from projects on aquifer storage of CO2, and a thermodynamic approach for design of appropriate injection gas. It is also argued that the CH4/CO2 swap can be combined with well-known technology for steam cracking of produced hydrocarbons to H2 and CO2 (for re-injection).
1. Introduction
Even more than 20 years ago it was estimated1 that the energy in the form of hydrate is more than twice the known amounts of all known sources of conventional fossil fuels, including coal. Hydrates are widely spread globally and if natural gas in them replaces some coal that would be a first environmental step. The potential of a gas hydrate production cycle with H2 as the only net energy export product2 is even more attractive and a big step forward. Technology solutions for the commercial use of H2 in the private energy sector, as well as for use in the public transport sector, have been available for many years already.Comparing worldwide hydrates to shale gas raises some perspectives, in addition to the abundance of natural gas hydrates. Fracking shale gas deposits are costly and involve various kinds of risks. Risk of geo-mechanical instabilities, undesired gas leakage pathways, and the use of chemicals including toxic are just three examples. The paradox is that the production of natural gas from hydrates may be simpler than shale gas production, and involve less risk. Some disagree with this statement and it is timely to have an open debate on this.
One of the limitations of the discussion of different methods for dissociating hydrates and releasing gas today is the thermodynamic analysis. A rigorous analysis based on the fundamental laws of thermodynamics is mostly absent. Instead, various production methods are evaluated based on simplified projections of hydrate stability like the one in Fig. 1c. It is not random that these curves are named stability limits rather than equilibrium curves. It is well known to most hydrate researchers that two components (one guest and water) distributed over three phases can establish thermodynamic equilibrium if one, and only one, independent thermodynamic variable is defined.1,3 This can easily be seen from Gibbs phase rule, which ends up with one degree of freedom for 2 components distributed over 3 phases (gas, liquid water, hydrate). Systems containing water in porous media are fairly complex. One reason is the strong interactions between water and mineral surfaces. Another reason is the interfaces between hydrates and liquid water. Yet a third reason is the selective adsorption of guest molecules (hydrocarbons, CO2, H2S, N2 etc) on liquid water surface. These phases are not massive in terms of mole numbers but still thermodynamically important. Many phases that will normally not be considered in analysis of conventional hydrocarbon systems play important roles. Instead of the compact Gibbs phase rule it might be better to use the rigorous counting behind the simplified rule. Degrees of freedom are number of independent thermodynamic variables minus constraints minus constraints on these variables. Constraints are conservation laws and thermodynamic equilibrium equations. Selective adsorption on the liquid water interface gives rice many different hydrates from mixtures. Kvamme4 illustrated this using a simple 2D adsorption theory to calculate adsorbed mole fractions of CO2 and N2 on liquid water surface versus composition in gas. Hydrate nucleation is thermodynamically and kinetically favoured in the liquid water side of the interface.5–7 See also all the papers included in several PhD theses on mesoscale modelling of hydrate phase transitions.8–11 There is nothing new about the one degree of freedom for three phases (liquid water, gas, hydrate) and two components (liquid water and CH4 for example). Experimentalists of hydrate equilibrium back in the 1940s used various methods to control pressure (P) or temperature (T) and measure the other one. One way was to fix pressure and form the hydrate at some temperature. Then, still, at the same pressure, they slowly increased temperature until the hydrate started to dissociate. The use of stirring at different levels made the formed hydrate more or less homogeneous, on a macroscopic level at least, so the range of hydrates we might expect from a mixture in a system without imposed hydrodynamics is not visible. Experimental data for hydrate equilibrium back to the early experiment has been compiled and reported by Sloan and Koh.12
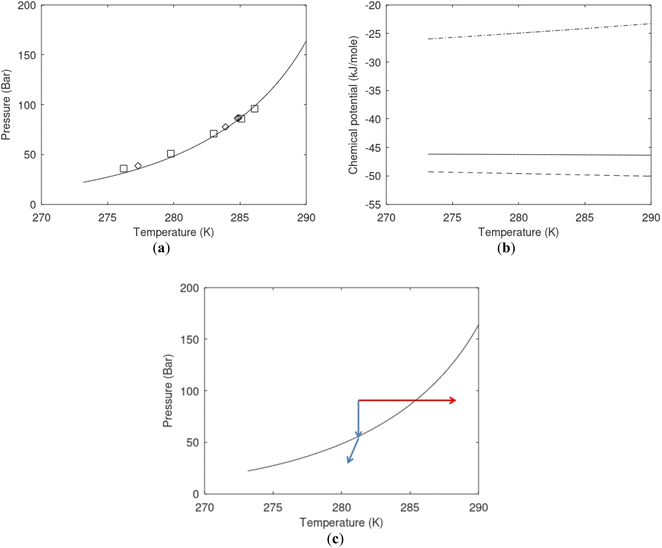 | ||
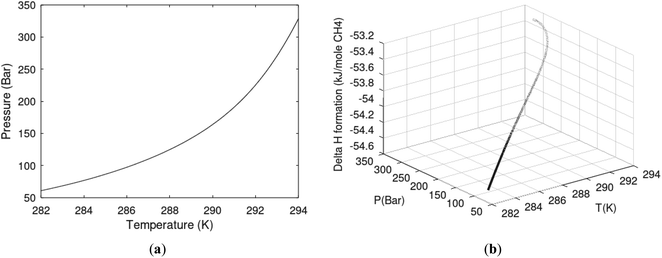
| Fig. 1 (a) Pressure temperature hydrate stability limits for CH4 hydrate. Solid is calculated (equations in Section 3), squares are experimental values from Sabil et al.13 and diamonds are experimental data from Tumba et al.14 (b) Hydrate Gibbs free energy (solid), liquid water chemical potential (dashed), and CH4 gas chemical potential (dash-dot). (c) Qualitative illustration of thermal stimulation for hydrate dissociation (red) and qualitative illustration of pressure reduction for hydrate dissociation (blue). The Joule–Thomson cooling due to gas expansion from the hydrate stability curve is of course not a straight line so just qualitative illustration. | ||
When two independent variables are defined by nature, like in natural sediment containing hydrates, then equilibrium equations are no longer valid. It is a mathematical consequence that the number of constraints (conservation laws and equilibrium equations) and fixed thermodynamic variables (T and P) exceeds the number of independent variables. Then there is no unique mathematical solution. One consequence of this is that there will be competing phase transitions that can result in hydrate formation and hydrate dissociation. Frequently thermal and mechanical equilibrium can be reached but then the chemical potentials of each component cannot be the same across phase boundaries.3 A degree of freedom of 1, which is the number of independent variables that must be defined for equilibrium, is even high for hydrates in sediments. Minerals surfaces are active as both inhibitors and promoters.4 Mixtures of guest molecules make the non-equilibrium situation more complex due to selective adsorption on liquid water and mineral surfaces (polar guests) and the creation of several hydrate phases. Throughout this paper, we will therefore use the term stability limits in different projections. Temperature and pressure are two variables defining one 2D projection. Hydrate stability limit as function of guest molecule concentration in surrounding water and temperature and pressure is another 3D projection (see Fig. 4 in Section 3). A third one is the hydrate stability limit in a concentration of water in the guest phase. The list is long. There is nothing like quasi-equilibrium, locally in the pores there are, however, some phase transitions that may be more dominating than others for specific times. And it is all kinetics in a thermodynamically non-equilibrium system.
The problem with the evaluation of the hydrate production strategy based on Fig. 1c is that at least two important aspects are missing. Gibbs free energy change for hydrate formation, and hydrate dissociation, is zero for every point along the solid curve. Since our model is based on chemical potentials for all components the comparison with experimental data is model verification for the chemical potentials of water and guest. Chemical potentials are plotted in Fig. 1b together with Gibbs free energy for the hydrate. As long as thermal stimulation (red, Fig. 1c), or pressure reduction (blue), brings the system out of the solid hydrate stability limit curve the dissociated products (liquid water and CH4 gas) are more stable (lower Gibbs free energy) than the same amounts of the components collected into solid hydrate. As such the combined first and second laws of thermodynamics are satisfied. What is missing is whether the first law can be satisfied or not. Can the dissociation enthalpy be supplied and how? For thermal stimulation, the dissociation enthalpy is supplied directly through the heat in the form of steam, hot water, or some other thermal source. And finally what about the second law of thermodynamics? Dissociation of hydrate requires an entropy increase corresponding to breaking a solid hydrate structure over to structures of higher entropy, liquid water, and gas respectively. Is the level of temperature high enough to accomplish these entropy changes?
The discussion above illustrates part of the objectives of this work. From the open literature, there have been substantial challenges with the pressure reduction method. The first hydrate production test offshore Japan was planned for two weeks and was shut down after 6 days. Preliminary results were presented in a workshop in Kyoto in 2014 (Nanotechnology & Nano-geoscience in Oil and Gas Industry, Society of Petroleum Engineers, March 4–7, 2014, Kyoto, Japan) but results were fairly non-conclusive although sand and tendencies of freezing down were mentioned as some of the problems. The qualitative nature of the presentation is one of the reasons that the presentation is not listed among the references. Presentation was given by an assistant professor from Kyoto University. Sand production is highlighted as the major problem in a written report.15 The second pilot offshore Japan was planned for a test production period of 6 months.16 After 24 days of oscillating production rates, and indications of partial freezing down, the production stopped.17 In particular one of the powerpoint-slides discussed by Dr Tenma17 illustrated very clearly the periodic tendencies of freezing down in terms of very sharp reduction in released gas rates. Other problems were also discussed but it was still concluded that the test ended due to problems of freezing down. Heat transport through water phases is very fast compared to diffusional transport of molecules. Even though heat transport through hydrate is significantly slower than transport through liquid water heat transport through hydrate is still a fast molecular transport mechanism. Transport of solid particles (sand and hydrate), on the other hand, is on a hydrodynamic level and far slower. The very sharp, and also smooth, reduction in gas release in the power-point slide shown to the audience17 by Dr Tenma would be more in accordance with a freezing down scenario. Hydrodynamic controlled blocking caused by sand accumulations would be expected to show more irregular drops in gas release since it is unlikely that sand blocking occur simultaneously and rapidly over substantial regions of the gas release front. The discussion above does not exclude combinations of the two effects although Dr Tenma's explanation of freezing down as the mechanism that finally stopped the flow seems reasonable in view of his graph of the pressure versus time-line.
The main objective of this work is to illustrate how the laws of thermodynamics can analyse the feasibility of various production methods and minimize their values.
A secondary objective is to illustrate the benefits of a uniform reference state for all phases. Ideal gas as reference state for all components in all phases ensures comparable Gibbs free energies for all possible phases in terms of stability. Derivation of the enthalpy model from the Gibbs free energy model using fundamental thermodynamic relationships ensures consistent entropy calculations for use in second law analysis. A simultaneous transition from fugacity description of guest molecules over to chemical potentials opens up a more general formalism that can be used in the analysis of hydrate formation and dissociation along a variety of pathways which also includes solid surfaces. A more specific example of the qualitative changes in Fig. 1c is plotted in Fig. 2. Initial CH4 hydrate at 277 K and 155 bar is exposed to a pressure reduction down to 15 bar. The final temperature in the figure is a function of the Joule–Thomson. A straight line down to 274 K is random for illustration only. The residual thermodynamic equations have been derived and presented in a substantial number of papers and we will mostly refer to these for detailed derivations and complete sets of equations.
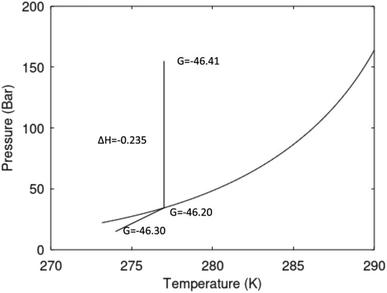 | ||
| Fig. 2 Pressure temperature hydrate stability limit curve as in Fig. 1a along with a first effect of pressure reduction to hydrate dissociation point at P = 34.43 bar for 277 K. Initial condition is 277 K and 155 bar. All Gibbs free energies (G) are in kJ mol−1 hydrate. For the final point Gibbs free energy is for the same amounts of water and gas that was in the hydrate at the dissociation point, but now in the form of liquid water and gas. The enthalpy change (ΔH) for the first pressure reduction is in kJ mol−1 hydrate for comparison with G in terms of units. The largest change in enthalpy is the dissociation enthalpy and dissociation condition of 277 K and 34.43 bar which is −7.57 kJ mol−1 hydrate (−56.24 kJ mol−1 CH4). The released CH4 gas from the initial state down to dissociation is 601 moles CH4 m−3 hydrate due to the rearrangement of the hydrate towards a lower filling fraction at the dissociation point. | ||
The third objective is to utilize the thermodynamic analysis on a specific example from the Black Sea as part of a hydrate energy value analysis.
The fourth objective is to illustrate how the production of natural gas from hydrate can be turned into a concept that implicitly involves safe long terms storage of CO2 as solid hydrate, the fifth and final objective is to illustrate that the commercial production of natural gas from hydrate using CO2/N2 mixtures with extra additives is possible and well-known technology can be utilized. There are remaining research challenges toward higher production efficiency but this does not affect the main technology components of the production.
Finally there is also a fifth objective which is not devoted much attention in the paper simply because it is an optional add-on to the CH4/CO2 swap method. This add-on is based on well-established technology which was first developed in Norway in 1913. CH4 can be cracked by steam to H2 and CO2. Ideally one mole of produced CH4 from hydrate can be cracked to 2 moles H2 and 1 mole CO2. The CO2 cane be re-injected into the natural gas hydrate so that the only net delivery is H2. Some limited reflections on that can be found in Section 7.4.
This is not a review paper on methods to release natural gas from hydrates. It is mainly a thermodynamic paper intended to illustrate a methodology for the analysis of methods to release natural gas from hydrates. For this reason, there are no references to specific methods for adding heat in thermal stimulation or references to the experiments on pressure reduction. The aim is to propose sets of thermodynamic calculations before designing experiments, or pilots, for testing a specific hydrate production method. Systematic thermodynamic analysis, in which all the thermodynamic laws have specific implications for the feasibility of a specific production method, is the goal. This type of analysis can assist in the design of experiments and can be used to select the most appropriate hydrate production method for a given reservoir containing in situ natural gas hydrate. The novelty of this work is that this type of systematic thermodynamic analysis has never been published by any other research groups. Given the costs of pilot experiments and cost of large scale experiments the potential economic savings in avoiding tests that have little or no potential of succeeding is substantial. One example is already given by Kvamme4 in a more limited analysis of the Ignik Sikumi pilot on CO2 injection. The thermodynamic scheme for feasibility analysis utilized here is, however, more extensive and complete than the analysis of Kvamme.4
One challenge related to the objectives above is that there is only one available concept that is able to calculate all the properties needed in a consistent way. Residual thermodynamics for all phases is a necessity for comparing thermodynamic stability of co-existing phases. Enthalpy calculations that are consistent with Gibbs free energy calculations are necessary to ensure realistic calculations of entropy changes for hydrate phase transitions. In a simple analogy to dissociation of ice we simply need to ensure that the final entropy resembles the structure of liquid water. There is not even a simple way to utilize Clausius–Clapeyron equation through derivation from Gibbs–Duhem because of the complex relationships between chemical potentials of the different components in hydrate, and in the co-existing fluid mixtures. We have not found any appropriate derivation in open literature, even for binary hydrates. And the definition of fugacity for hydrate formed from a mixture is totally empirical and thermodynamically inconsistent. Fugacity is defined on a component basis. Derivation based on the fundamental relationship between fugacity and chemical potential results in fairly complex hydrate “fugacity”. This has been demonstrated by Kvamme in some earlier publications. The fact that there are many self-references is simply that we are the only one that use residual thermodynamics for all phases, and all thermodynamic properties needed. There are no other available consistent thermodynamic concepts to compare to. To our knowledge all other thermodynamic codes, academic and industrial, are based on methods from before 1970. In these approaches the chemical potential difference between pure liquid water and empty hydrate is empirically fitted. In order to correct for temperature and pressure changes of this chemical potential difference then also involves empirical fittings of similar enthalpy differences, specific heat capacity differences and molar volume differences.
There are 24 citations (of 95 references) with Kvamme as first author, and some additional references from collaborators and previous students.
2. Thermodynamic laws and impact on hydrate production schemes
The first law of thermodynamics for open systems in Legendre transformed version, with P as independent thermodynamic variable instead of volume, can be written as follows for p co-existing phases:
 | (1) |
![[x with combining macron]](https://www.rsc.org/images/entities/i_char_0078_0304.gif) j) is the chemical potential for component I in phase j. As an example, consider p equal to 3 with j = gas, liquid water or hydrate. Minerals are considered as external and initially adsorbed phases on minerals are skipped. For heterogeneous hydrate formation on gas/liquid water interface there is one temperature acting from gas side, and potentially there is a different temperature acting from liquid water side. Heat transport is very fast through water phases, as compared to heat transport through non-polar gas (or liquid), even though conductivity through hydrate is lower than heat conductivity through liquid water.
j) is the chemical potential for component I in phase j. As an example, consider p equal to 3 with j = gas, liquid water or hydrate. Minerals are considered as external and initially adsorbed phases on minerals are skipped. For heterogeneous hydrate formation on gas/liquid water interface there is one temperature acting from gas side, and potentially there is a different temperature acting from liquid water side. Heat transport is very fast through water phases, as compared to heat transport through non-polar gas (or liquid), even though conductivity through hydrate is lower than heat conductivity through liquid water.
 | (2) |
The heat transport related to hydrates in sediments under dynamic situations is mainly due to molecular transport in the form of heat conduction, and also by heat convection. Complex and detailed formulations are not needed for the purpose of this work. The following expressions for heat conduction in direction x, based on volumetric description in x, y and z directions, can be expressed as:
 | (3) |
The heat convection can be expressed as:
![[Q with combining dot above]](https://www.rsc.org/images/entities/i_char_0051_0307.gif) Convectionx = h(x,y,z)Ay,z(Tx,0 − Tx) Convectionx = h(x,y,z)Ay,z(Tx,0 − Tx)
| (4) |
The role of the first laws of thermodynamics is in the energy balances, whether that is in the form of mathematical models inside a reservoir simulator, or as part of a thermodynamic analysis as in this work.
The second law of thermodynamics for the same system can be written as:
 | (5) |
The entropy development for every phase inside the sum of eqn (5) is on the form of:
 | (6) |
The superscript j,ext in eqn (6) involves temperatures from external sources but also from other phases with different temperatures. The second part of the second law is that heat cannot be transported directly from a lower temperature to a higher temperature.
On a simple first order analysis, on the same level as eqn (2), we can then write:
 | (7) |
A direct role of the second law is the control over level of temperature resulting from various stimulations that can be applied with the intention to dissociate hydrate. The actual temperature that faces the hydrate, and then also the interface between hydrate and liquid water, has to be sufficiently high to break the hydrogen bonds. Entropy development during these changes should result in structure of liquid water and structure of gas from guest molecules after hydrate dissociation. Thermodynamically Helmholtz free energy is directly linked to the structure through the canonical ensemble, which again links to Gibbs free energy by a trivial Legendre transform. Enthalpy is fundamentally linked to Gibbs free energy (eqn (16) in Section 3). Definition of Gibbs free energy as function of enthalpy and entropy is the reason why the models for Gibbs free energy and enthalpy need to be consistent and based on the same model, as a minimum requirements for prediction of realistic structural changes, and entropy changes, during phase transitions.
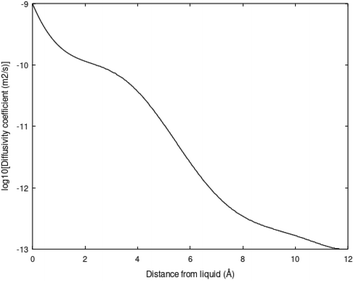
Molecular diffusion changes dramatically during hydrate dissociation. The partial molar entropy for water changes from a low entropy in hydrate to a significantly higher value in liquid water. The entropy partial molar entropy change for the guest molecules, on the hand, depends on the dissociation route. If hydrate dissociates over to gas the partial molar entropy change can be large, in contrast to dissociation of hydrate towards liquid water. In the latter case the guest is then initially transferred to liquid water solution. Frequently the average structure of guest molecules in liquid water are similar to structure in hydrate, like for instance CH4 in small cavity transferred to liquid water solution. Hydrate stability limits towards liquid water is illustrated in figure in Section 3. Fig. 3 below is a diffusivity coefficient profile based on the simulation methods due to Kvamme & Tanaka.20 The uncertainty in diffusivity coefficient is large and the profile might very well be considered as semi-empirical. The interface thickness is, however, derived from other types of molecular dynamics simulations.10,18,19 The diffusivity profile appears very reasonable relative to the structural development of water across the interface (1.2 nm). See also Kvamme et al.21 for prediction of hydrate film thickness as function of time as compared to experimental data for CH4 hydrate and CO2 hydrate, in which this type of interface diffusivity coefficient profile was utilized.
The diffusivity coefficient on the hydrate surface is expected to be substantially higher than water diffusivities inside “bulk hydrate”. Estimates of “bulk hydrate” water diffusivity coefficients may be in the order of 10−15 m2 s−1.22–24 Estimates and even methods for calculations of “bulk hydrate” diffusivity are, however, very uncertain.
This interface is a physical necessity for co-existence between hydrate and liquid water and stems from the fact that partial charge distribution from hydrate surface waters is fairly fixed geometrically and does not match partial charges in average dynamic structures of liquid water. The interface reproduces itself continuously on a molecular scale in time and space. Practically this is a kinetic bottleneck in hydrate dissociation kinetics. Any efficient hydrate production scheme need to deliver temperatures high enough to break the hydrogen bonds in the hydrate/water interface, as well as in “bulk hydrate”. This is a substantial challenge for the pressure reduction method. The impact of the hydrogen bond structure on hydrate phase transition kinetics is more complex than just the slow mass transport across the interface diffusivity profiles like the one in Fig. 3. Concentration profiles of the guest molecules across the interface are fairly steep from concentrations close to solubility on the liquid water side to high concentration on the hydrate side of the interface. See for instance Kvamme et al.21 for more details.
The combination of first and second laws of thermodynamics expressed in the same independent variables (temperatures, pressures and mole-fractions) as the first law, and expressed in terms of Gibbs free energy is:
 | (8) |
There are two primary roles of the combined law for the systems in this work. For systems that can reach thermodynamic equilibrium then eqn (8) can be used to derive equilibrium conditions. That part of it can, however, also be directly and easier derived from eqn (1) when Legendre transformed back to internal energy formulation rather than enthalpy formulations. The second and most important role of the combined law in this work is thermodynamic directions for phase separations and creation of new phases. In first order dynamic form the result is:
 | (9) |
3. Residual thermodynamics
A general residual thermodynamic scheme is illustrated in Fig. 4.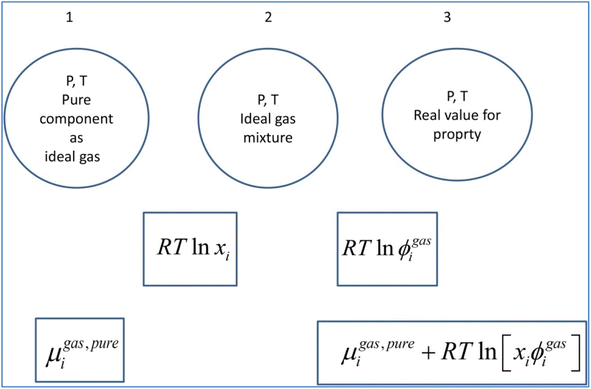 | ||
| Fig. 4 Residual thermodynamic scheme for guest molecule chemical potential in fluid phase. Chemical potential for pure component as ideal gas is trivially available from the canonical partition function for the given molecule type as function of molecular mass (translational momentums) and moments of inertia for molecules with rotational degrees of freedom. All molecules in this study are rigid molecules based on successful models applied in several Molecular Dynamics (MD) studies. Methane is approximated as a simple sphere. Moments of inertia for CO2 and H2O (TIP4P31) are available from the authors. Ideal mixing from 1 to 2 comes from the entropy effect of dilution when pure components mix at constant P. The fugacity coefficient goes to unity when pressure goes to zero. For other conditions it can trivially be derived from Helmholtz free energy for any equation of state, we use Soave–Redlich–Kwong (SRK) equation of state.32 Analytical expression for the fugacity coefficient from SRK is available from several chemical engineering handbooks. Pure water chemical potential as ice were sampled from MD studies, in which the ideal gas chemical potentials are sampled from the momentum space and the residual contribution (corresponding to the step from 2 to 3) are sampled from configurational space.20 Liquid water chemical potentials are derived used experimental data for dissociation of ice and liquid water heat capacities.20 For water containing salts or other dissolved components then a symmetric excess scheme applies. In this case pure also three steps apply. Reference state similar to 1 in this figure is now pure liquid water. From 1 to 2 an ideal mixing term is added similar to the residual scheme. The result at 2 is ideal mixture for water and then the correction from 2 to 3 is accomplished by replacing the fugacity coefficient with an activity coefficient that accounts for dissolved molecules (and ions) effects on water chemical potential. Symmetric activity coefficient goes to unity when ole-fraction water goes to unity. A similar three stage approach also applies to guest molecules dissolved in water. Due to it’s quadrupole moment CO2 is more soluble in water than CH4. Solubility of these components in water is still low and infinite dilution of these components in water is a proper reference state. Reference stage is 1 in this figure will now the infinite dilution chemical potential for the actual component in water, which is available from MD simulations for model molecules but can also be derived from experimental data. The same ideal mixture term from 1 to 2 apply. And then there is an asymmetric excess activity coefficient that replaces the fugacity coefficient in the step from 2 to 3. Asymmetric activity coefficient approaches unity when mole-fraction of the dissolved guest in water is zero. | ||
The detailed equations for different components in the different phases are available from several references. Ref. 1, 25–30 are some examples.
Chemical potential for water in hydrate is given by:10
 | (10) |
μH2H,0O(TH,PH) is chemical potential for water in empty hydrate from Kvamme and Tanaka19 and corrected by a simple Poynting correction from 1 bar to actual pressure of the hydrate PH. vkis the number of cavities of type k per water molecule. In structure I hydrates, which we use in this work as examples, there are 6 large cavities and 2 small cavities in a cubic water structure of 46 water molecules. vkis 3/23 for k = large and 1/23 for k = small. The canonical partition function for molecule i in cavity type k can be written as:
| hki = eβ[μki−Δgki] | (11) |
Assuming that small and large cavities are at equilibrium:
| μlargei = μsmalli | (12) |
Eqn (10) is derived from a semi grand canonical ensemble in which number of water is fixed and number of guest molecules corresponds to an open ensemble.
Fig. 1a is constructed based on equal chemical potentials for liquid water and hydrate water as in an equilibrium system but now denoted as stability limits. Mechanical and thermal equilibrium implies that phase indexes can be omitted on these and we end up with:
 | (13) |
Superscript w denote aqueous phase and superscript H denotes hydrate. Using equilibrium also for guest molecules in gas and in hydrate we then insert chemical potential for gas in eqn (11) and solve eqn (13) iteratively. In most calculations we choose a range of temperatures and solve eqn (13) for pressures. This is of course the same whether we calculate hydrate stability limit curves, or equilibrium curves. The fundamental difference is, however, that a hydrate stability limit curve is one of several hydrate stability curves and that competing hydrate phase transitions may override the pressure temperature stability limit. This is happening all the time in nature. One example is the dynamics of many offshore hydrates worldwide. Fracture systems that create channels between hydrate filled sediments and seafloor brings in seawater. This seawater contains little or practically no CH4 in most cases. CH4 hydrate stability limits towards CH4 in surrounding seawater are plotted in Fig. 5 below.
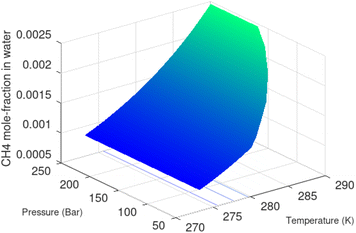 | ||
| Fig. 5 Hydrate stability limits in mole-concentrations of CH4 in average seawater (salinity 35) in contact with hydrate. | ||
A typical situation is that hydrate dissociates towards seawater from top and new hydrate form from upcoming gas. Note that the pressure dependency of this hydrate stability limit is not substantial since it involves two condensed phases. The same type of stability limit is also responsible for hydrate mounds on top of hydrocarbon leakage fluxes worldwide. Upcoming gas forms hydrate due to pressure temperature and dissociates from seafloor side due to limits as plotted in Fig. 5. As a result several levels of biological ecosystems lives on the basis of dissociating hydrate due to CH4 concentrations in surrounding seawater lower than limits in Fig. 5.
Also, note that Gibbs free energy for the hydrate is:
 | (14) |
Chemical potential for water and methane along the hydrate stability limits are plotted in Fig. 1b. The change in Gibbs free energy due to the phase transition is given by:
 | (15) |
Eqn (15) is zero along the hydrate stability limit in Fig. 1a. The comparison with experimental data in Fig. 1a is therefore a model verification of the chemical potentials for water and guest molecules.
A consistent model for the enthalpy of hydrate formation and dissociation is derived from eqn (15) using the fundamental relationship:27
 | (16) |
See also ref. 28 Kvamme et al. Appendix A for the importance of thermodynamic consistency between calculations of Gibbs free energy and enthalpy. Another advantage of using eqn (15) and (16) is that is it general for hydrate formation from other phases. One example is hydrate formation from dissolved hydrate formers in water. Hydrate nucleation towards mineral surfaces is another example.1 Measurements of hydrate phase transition enthalpy is very challenging and critical information, like for instance coordination number, is frequently not available.30
4. Hydrate phase transition kinetics
In contrast to conventional hydrocarbon systems the hydrate stabilization through water hydrogen bonds imposes nano to meso scale kinetic bottle necks. As will be discussed in more details in Section 7 structured water phases like ice and hydrate gives rice to complex interface between the solid water phase and liquid water. Practically these nano scale interface acts as mass transport barriers. It is therefore not sufficient to supply enough heat to dissociate the hydrate based on hydrate dissociation enthalpy. The level of temperature is also critical. The purpose of this section is to shed more light on these nano scale barriers and possible ways to model these mathematically.4.1. Nano to macro dynamic couplings
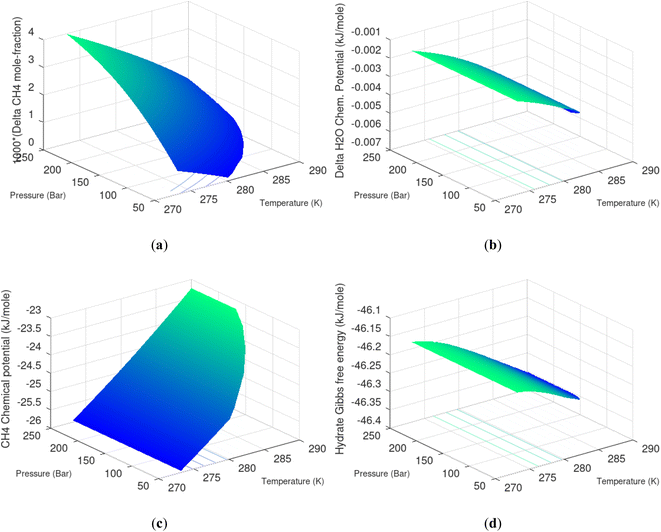
Hydrate production dynamic is implicitly coupled on multiple scales. The critical importance of second law, eqn (6) and (7) is on nano to meso scale as directly related to the hydrate phase transitions itself. As discussed before the problem simply boils down to supplying enough heat to break hydrogen bonds and change the entropy from a low (relative) value in hydrate over to higher values in resulting gas and liquid water respectively. The necessary heat supply is macroscopic. The coupling goes through supplied heat flux based on hydrate surface orthonormal to each heat transport direction. If translated over to radial coordinates it is then the heat flux for a certain radial coordinate that faces the surface fraction of hydrates in the pores. Hydrate cannot touch mineral surfaces directly and will always be pore filling.1–3,21,25,26,28,29 For a certain radial cross-section area and reasonable simplifications it is even possible to implement a coupled macro to nano model for the entropy dynamics in hydrate reservoir simulators like for instance RetrasoCodeBright (RCB).34–39 See also the PhD theses39–43 and journal publications included in these theses for more details on RCB and algorithms for handling hydrate phase transitions. To our knowledge RCB is currently the only hydrate reservoir simulator that is feasible for this type of coupling between macro-models for mass- and heat-fluxes, and dynamics hydrate phase transition models which ranges from geometric scales on pore level and down to nano scale on hydrate/liquid water interface. For this reason there are no references to other hydrate reservoir simulators. It is far beyond the scope of this work to detail out a complete model, and associated interface, for RCB within this paper.The thermodynamic control over phase transitions is given Gibbs free energy change across the specific phase transition. At the phase transition limit Gibbs free energy change, eqn (15), is zero and theoretically the hydrate formation rate is the same as the hydrate formation rate is the same and net kinetic phase transition rate is zero. For the heterogeneous hydrate formation on the gas/liquid interface the limits in P T projection are given in Fig. 1a. For the homogeneous hydrate formation in Fig. 5 2D projections with either P or T as fixed variable is obtained by slicing Fig. 5 along either P or T axis. A fundamental difference between the heterogeneous hydrate formations and the homogeneous formation is that homogeneous hydrate formation can occur in the whole range of concentrations between liquid solubility of guest(s) to hydrate stability limits of guest(s) towards liquid water solution in Fig. 5. Specifically we can use the conditions in Fig. 5 as an example. The difference in liquid solubility mole-fractions of CH4 and the mole-fraction for hydrate stability limits in Fig. 5 is plotted in Fig. 6a. The mole-fraction difference is denoted as Delta. The water benefit for the hydrate formation is the difference in chemical potential for water in hydrate and the chemical potential for water in liquid. The sign of Delta is of course opposite in Fig. 6b as compared to Fig. 6a since Fig. 6a is the range of homogeneous hydrate formation possibility while Fig. 6b is the water part of the thermodynamic benefit. Note that every concentration in between liquid solubility of CH4 and hydrate stability limit gives rice to a unique hydrate. The reason is that chemical potential for guest molecules vary with concentration in the liquid water solution. This will directly also change hydrate water chemical potential through eqn (11) and (10). Chemical potential for CH4 in liquid solution along the concentrations in between solubility and hydrate stability limits in Fig. 6a is plotted in Fig. 6c and Gibbs free energies for the resulting hydrates due to variations in water and guest chemical potentials are plotted in Fig. 6d. The relationship between guest cavity partition functions in eqn (11) and cavity filling fractions is not given explicitly here to save space. The corresponding mole-fractions of water and guests are trivial. See for instance either of the ref. 1, 5 and 29 for details. Every set of concentration, temperature and pressure behind Fig. 6d gives a unique hydrate of specific stability given by Gibbs free energy. This implies that also hydrate dissociation kinetics will be different for each of these hydrate, as discussed more in Section 4.2.
Eqn (9) can be used in two ways relative to the goals of this work. It can be used in a local Gibbs free energy minimization scheme for calculations of phase distributions and associated compositions. Discrete evaluations of specific phase transitions are, however, more relevant for this work. Again we stress the need for consistent calculations of Gibbs free energy, enthalpy and entropy in view of the first term on right hand side of eqn (9). Temperatures of the various phases, as well as external fields imposed by hydrate dissociation stimulation actions, vary dynamically as a function of the impact of hydrate dissociation actions. Eqn (9) can be evaluated for discrete sets of phase transitions. Dissociation through addition of chemicals has so far not been discussed here. For general illustration it is not even needed. It will be discussed in the next Section. See also.6,44–46
The two primary terms on right hand side that impose hydrate instability are the first and last term. See Appendix B in ref. 3 Kvamme et al. for an example of chemical work.
A critical element in hydrate production is the heat transport needs in the energy balance, and whether the supplied heat is sufficient to supply hydrate dissociation enthalpy.
4.2. Hydrate phase transition dynamics
Within the scope of this work Classical Nucleation Theory (CNT) is sufficient for illustration of the most important aspects and also simple enough to be integrated into hydrate reservoir simulators. The two main elements of this theory are (1) formulation of Gibbs free energy change and (2) the hydrate phase transition kinetics. These nano processes are critical for macro aspects of hydrate phase transitions in sediments because they control the onset of phase transition, and in many cases the total dynamics of hydrate phase transitions are dominated by nano scale bottlenecks. Hydrate nucleation is discussed is Section 4.2.1 with focus on macroscopic implications. Classical nucleation theory is discussed is Section 4.4.2.
 | (17) |
For the simplest possible geometry of a crystal, which is a sphere, with radius R we then get:
 | (18) |
ρHN is the molar density of the hydrate core, and in the first term the difference in molar density between hydrate and liquid water is neglected. ΔGPhase transition is the molar Gibbs free energy change for the phase transition. γ is interface free energy. Frequently, interfacial tension σ is used instead of γ. Interfacial tension is related to interfacial stress and is one-dimensional, while interface free energy is the work needed to create an interface. The two are related by:
 | (19) |
Two things should be stressed. The region beyond critical size is denoted as stable growth, which is technically only true for simple models like CNT. In real systems there can be competition on mass between neighbour growing cores that results in cores of sizes beyond critical size decay because hydrate cores of lower Gibbs free energy will consume mass from hydrate cores of higher Gibbs free energy. These types of effects can be captured in more advanced models like for instance Phase Field Theory (PFT).8–11,18,19 Another important thing to keep in mind is that hydrate nucleation, and the subsequent growth phase, are physically well defined processes. Hydrate induction, or onset of massive hydrate growth, on the other hand is a more diffuse definition in the sense that monitoring of hydrate induction time is sensitive to monitoring technology (pressure, laser etc.). In open literature, unfortunately, induction times are frequently discussed as nucleation times. Hydrate nucleation is on nano scale in time and space (volume)5,18,19,21,28,30,47 while hydrate induction depends on many processes on meso, micro and macro-scale. Hydrate films thinner than 0.1 mm will not be visible to the human eye and experiments based on visual observations, or micro-scale monitoring,21 might be misinterpreted as if there is no hydrate present.
Hydrate production necessarily involves net hydrate dissociation but that does not prevent hydrate reformation to happen. During depressurization the Joule–Thomson effects of released gas cooling bring the system back again into hydrate forming conditions. During the second offshore test in Japan16 this was observed as several periods of reduced production before the whole test shut down. Another example is CO2/CH4 swapping in which the success depends on nucleation and growth of new hydrate from injection gas as heat source for dissociation of in situ CH4 hydrate. Even during thermal stimulation heat distribution will be non-uniform and might involve regions favourable for hydrate reformation. The use of chemicals for hydrate dissociation, like for instance alcohols, that are solvable in water will be diluted throughout the groundwater, and possibilities of hydrate reformation may result (Fig. 7).
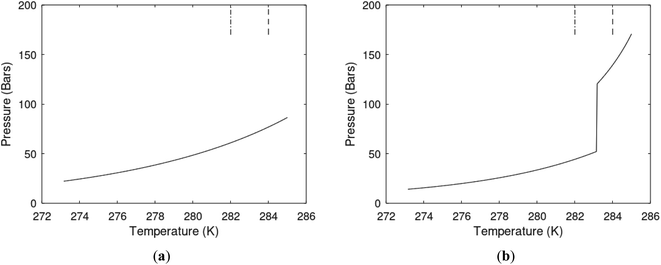
As an example here we can look at hydrate nucleation for CH4 hydrate and CO2 hydrate at conditions relevant for the Black Sea. Two temperatures are fixed – one below the CO2 phase transition and one for a temperature above the phase transition point (Fig. 8).
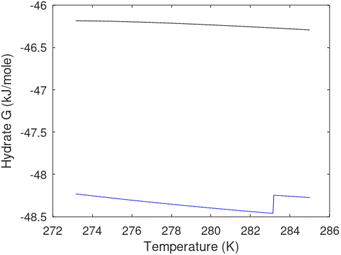
Free energy changes for hydrate formation are plotted in Fig. 9. When both CH4 and CO2 are in gas region the critical radii are not very different. The CO2 phase transition for CO2 changes that and critical radius for CO2 hydrate is larger than for CH4 hydrate. CO2 hydrate is, however, a substantially more stable hydrate than CH4 hydrate and nucleates faster at both temperatures. Gibbs free energy change for the formation of CO2 hydrate at 284 K is significantly smaller in absolute value than the corresponding value at 282 K because the change in density (and molecular attractions) for guest phase to hydrate is smaller.
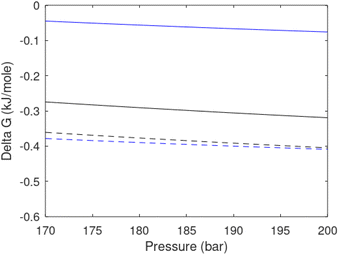 | ||
| Fig. 9 Gibbs free energy changes for hydrate formation at 282 K (dashed) and 284 K (solid). Blue is for CO2 hydrate formation and black is for CH4 hydrate formation. | ||
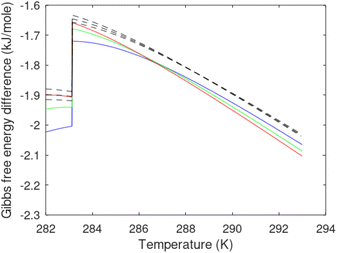
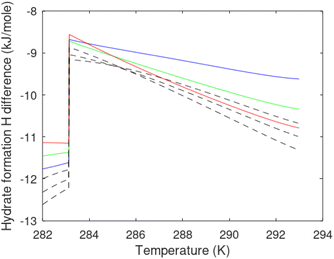
It is also important to keep in mind that for conditions in which both CH4 hydrate and CO2 hydrate can exists the CO2 hydrate is always more stable (lower Gibbs free energy) than CH4 hydrate as illustrated in Fig. 10 below.
The practical implications of this is that CH4 hydrate will nucleate instantly on a macroscale in time (seconds and up) if the thermodynamic conditions are favourable. The paradox is that the Joule–Thomson cooling effect per pore volume will be proportional to the volume fraction gas in the pores. Turbulence, and associated large gas/water contact areas, will further stimulate to generation of large numbers of hydrate nuclei, as well as fast hydrate growth and accumulation of hydrate cores. In CO2/CH4 swapping method CO2 hydrate nucleation will totally dominate relative to possible reformation of CH4 hydrate. These are just two practical examples of the need to evaluate the nano scale aspects of hydrate phase transition dynamics.
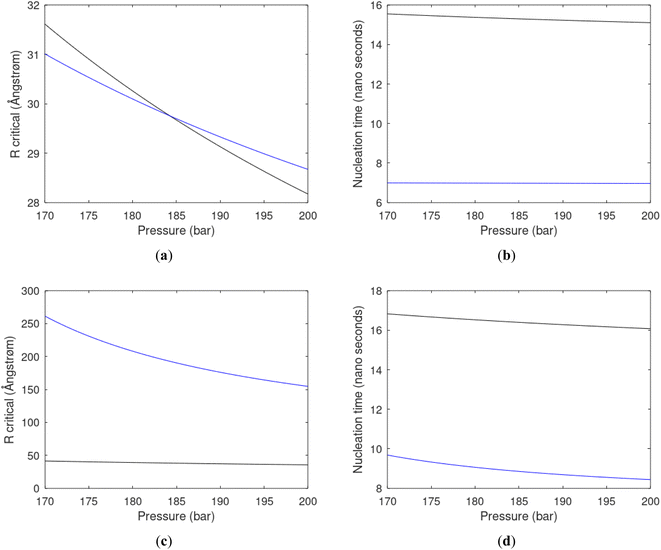
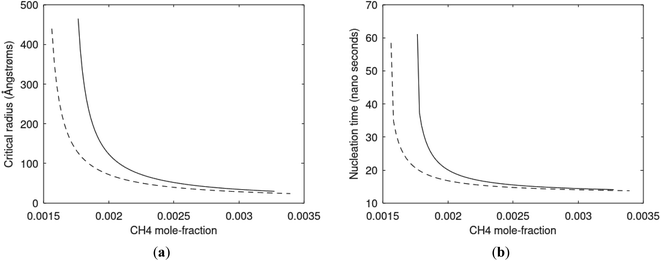
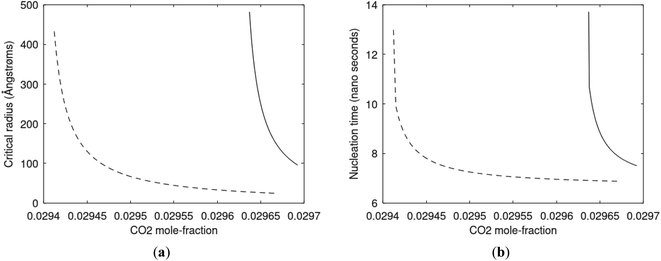
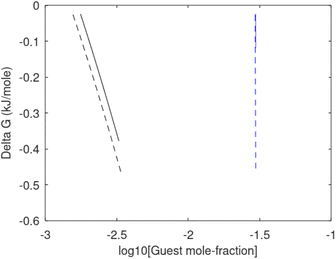
Since also heterogeneous hydrate nucleation is dominated by the liquid water side of the interface homogeneous hydrate nucleation from guest molecules dissolved in water. Critical radius and nucleation times for representative conditions comparable to the heterogeneous case are plotted in Fig. 11 for CH4 and in Fig. 12 for CO2. Gibbs free energy changes for hydrate formation are plotted in Fig. 13.
As expected the critical radii are very large for liquid concentrations of guest close to limit of hydrate stability concentrations. Corresponding nucleation times are relatively high but still on nano scale and instant relative to macro time scales of seconds and longer times. Closer to solubility concentrations the critical core radii are slightly larger than heterogeneous hydrate formation. For CO2 there is a distinct change from 282 K to 284 K. In a turbulent situation during hydrate dissociation homogeneous nucleation from supersaturated water, as well as heterogeneous hydrate nucleation in liquid water side of interface will represent two end points of a chain of hydrate nucleation situations in which the homogeneous case is the asymptotic case of homogeneously dissolved guest in water.
Hydrate dissociation does not involve the creation of a totally new phase since hydrate facing another phase will result in a development of an interface. For hydrate in contact with water we have already discussed the interface as a nano scale dynamically reproducing interface due to difference in distributions of water partial charges. Hydrate facing gas also need to restructure in order to optimize surface entropy since fixed location hydrate water partial charges facing non-polar guest phase is in entropy penalty. Also in this case a hydrate/gas interface of structured water will develop. For hydrate dissociation there are no direct penalty terms as that in eqn (18) for nucleation of hydrate cores. What is common to hydrate nucleation and growth, and dissociation is the hydrogen bonded interface, which can be a macroscopic bottle-neck.
J = J0![[thin space (1/6-em)]](https://www.rsc.org/images/entities/char_2009.gif) e−βΔGTotal e−βΔGTotal
| (20) |
Eqn (21) below, with parameters in Table 1, is the equation applied for Fig. 3. At this stage, eqn (21) is considered as semi-empirical since the samplings of diffusivities from MD are fairly uncertain. Parameters in Table 1 are the same for CH4 and CO2 since the diffusivity is controlled by hydrogen bonded water.
 | (21) |
| I | Parameter | i | Parameter | I | Parameter |
|---|---|---|---|---|---|
| 1 | 0.979242 | 4 | 171.673 | 7 | −9649.96 |
| 2 | 15.5427 | 5 | 6.76975 | 8 | 14![[thin space (1/6-em)]](https://www.rsc.org/images/entities/char_2009.gif) 779.7 779.7 |
| 3 | −88.5112 | 6 | 1939.55 | 9 | −7496.15 |
The time for a methane molecule to cross the interface can be found by integrations of the second order Fick's law:
 | (22) |
The liquid water/hydrate interface is constantly reproducing itself on nano-scales in time. The mass transport is dynamically limited by the very low diffusivity close to the hydrate surface. A fair approximation is therefore:
 | (23) |
For hydrate growth beyond interface thickness, eqn (23) is used as a constant value for film thickness growth. The corresponding mass transport dynamics in CNT, J0, is then given by:
 | (24) |
ρH is the molar density of the hydrate. This is trivial to calculate from the volume of the hydrate (unit cell dimension) and filling of the cavities. Diffusivities based on auto velocity correlation samplings scale proportionally to square velocities. The relationship between kinetic energy and temperature per degree of freedom for movement gives the temperature scaling relative to the MD simulations that were conducted at 273.15 K. Within other uncertainties this scaling is not very significant.
The implicit coupling to heat transport is then
![[Q with combining dot above]](https://www.rsc.org/images/entities/i_char_0051_0307.gif) ∼ Δ ∼ Δ![[H with combining low line]](https://www.rsc.org/images/entities/i_char_0048_0332.gif) Total Total
| (25) |
In which the enthalpy change is given eqn (16) and Total is the same as Phase transition for hydrate dissociation while the penalty term in eqn (18) applies to the hydrate nucleation stage during hydrate formation. This term rapidly fades to almost zero, relative to the phase transition Gibbs free energy benefit term, for increasing hydrate core sizes beyond critical radius size. Except for calculations of nucleation sizes, as illustrated in the previous section it can be omitted in the hydrate growth region. Two various ways that heat can be transported are discussed in Section 2, eqn (3) and (4).
As an example we may consider CH4 hydrate dissociation towards incoming water from seafloor. Example is artificial but condition partly representative for Black Sea. An in situ CH4 hydrate at 284 K and 170 bar faces incoming water with 282 K and 170 bar. The corresponding thermodynamic control farctor, the exponent with Gibbs free energy change in eqn (20) is 1.39. The diffusivity coefficient for liquid water side of interface is assumed to be 1 × 10⁻⁸ m2 s−1, hydrate side interface diffusivity coefficient is 1 × 10⁻¹² m2 s−1. The calculated molecular flux of CH4 from hydrate is calculated to 39![[thin space (1/6-em)]](https://www.rsc.org/images/entities/char_2009.gif) 975 mol Å−2·s−1, which corresponds to 6.638 mol m−2 s−1 or 0.1062 kg m−2 s−1.
975 mol Å−2·s−1, which corresponds to 6.638 mol m−2 s−1 or 0.1062 kg m−2 s−1.
5. Black sea hydrates distribution, saturations, and volumes
The unique conditions of the Black Sea for gas hydrate existence made the basin the most hopeful for hydrate exploitation in Europe. The main gas hydrate deposits (GHDs) of the Black Sea are located in the Danube Fan in the northwestern part of the basin. Published estimations of hydrate saturations (Sh) are used for raw hydrate volumes (Vh) determinations.5.1. Black sea basin unique conditions for hydrates existence
The focus area is the northernmost part of the Bulgarian Exclusive Economic Zone (BEEZ) of the Black Sea where seismic records with registered bottom simulating reflectors (BSRs)50,51 show on the continental slope a significant GHD with an area of ∼1300 km2 (65 × 20 km) at depths 300–400 mbsf (meters below seafloor). The area is part of the deep-water Danube Fan. GHD with almost the same area exists in the Romanian Exclusive Economic Zone (REEZ) northern from the Viteaz Canyon51,52 (Fig. 14).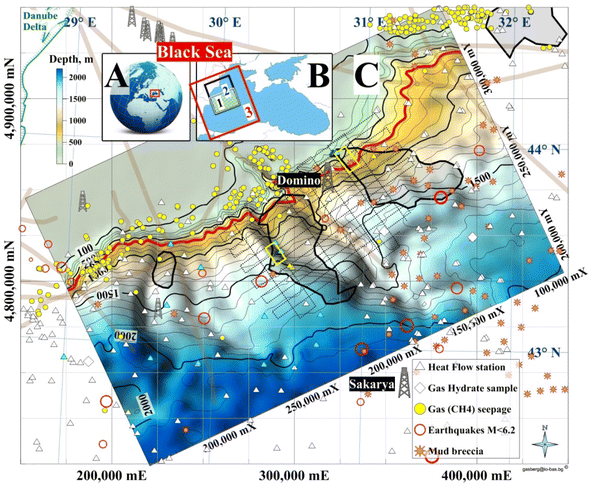 | ||
| Fig. 14 Study areas. (A) Black Sea; (B) (1) area presented in (C); (2) a model area for (1); (3) Western Black Sea basin analysis model;53 (C) Bathymetry and GHDs in the Danube paleodelta (cruise MSM34-35, SUGAR III project). (Legend) 4 dimed polygons: from left to right 2 Bulgarian, Romanian and Ukrainian GHDs/BSR areas; red isobath 650 m: MHSZ lateral boundary; 2 yellow rectangles: SUGAR III detail 3D seismic & CSEM polygons; dotted lines: MSM34 2D seismic; thick grey lines: faults; Black Sea biggest conventional natural gas fields: Sakarya (405 bcm; Turkey54) and Domino (42–84 bcm; Romania55). | ||
The area is the transition zone between the Moesian Platform in the west, the Scythian Platform in the north, and the Western Black Sea basin in the south-east.56 The East Moesian Trough and the Polshkov Ridge are located in the western part of area 1 in Fig. 14. Two faults starting from the area of the present Danube delta reach the northeastern and the southwestern corner of the MSM34 seismic work area (Fig. 14). The axis of the area is the marine Peceneaga-Camena fault, which follows the main modern levee channel of the Viteaz Canyon.
The adjacent onshore areas are mainly drained from the Danube. Sedimentation in the large deep-sea fan complexes is controlled by climate and sea level changes.57 The sedimentary architecture is determined by the turbidity system of the Danube deep-sea fan. This is the largest mud-rich fan in the basin, composed of stacked channel-levee systems.56 Channel-levee systems are lenticular sedimentary units with coarse-grained sediments at the channel axis, and fine-grained, alternations of sand and mud in the lateral levees.58
The presence of GHs was inferred from seismic records with bottom simulating reflectors (BSRs), which marked the base of the GHSZ.51,52 BSRs were identified in the youngest buried levee-channel systems of the Danube northern and southern from the Viteaz Canyon.51 The BSR area in the BEEZ lies on the continental slope at water depths 750–1830 m. Unusual quintuple BSR was reported in the area59 which focused the further detail 3D seismic and CSEM investigations (yellow frame in Fig. 14C). The south GHD difference from the north GHD is that it is well sealed and gas seepages and enhanced methane values in the seafloor sediments were not determined.52 GH reservoirs with massive sand deposits are expected within the levee-channel systems,52 which makes the area promising for the first tests for GH exploitation in EU.52
After the discovery of the wide areas with BSRs (EC project ASSEMBLAGE) and the first systematic 2D multichannel seismic (Institute of Marine Sciences and Technology, Izmir, Turkey for the German project SUGAR III) all interpretation efforts were concentrated in the detail polygons with sizes ∼15 × 5 km. That's why all cited estimations are about the area of the detailed polygon in the BEEZ.
The unique conditions of the Black Sea GHs are determined by the lower salinity and the higher temperature of the near bottom waters in comparison with these in the oceans – 35 PSU and 0–3 °C. Their last significant variations are due to climate and sea level changes after the Last Glacial Maximum (LGM).57 Due to the low salinity of the Black Sea waters of ∼22 PSU, the more dense winter waters formed mostly in the area of the northwestern shelf, submerse only to depths of ∼150 m. As a result, in the Black Sea waters under 150 m the O2 is replaced with H2S and less CH4 and forms the anoxic zone (∼90% of the water body). The temperature of the waters under 500 m (the depth of insulation for the Black Sea) is almost constant at 9.1 °C according to more than a century of measurements.60
The heat flow of the central part of the western Black Sea is <20 mW m−2, which is below the heat flow of the old oceanic basins. These lowest values are due to recent sedimentation and the result is a non-equilibrium temperature field. The northwestern margins' heat flow values are typical for the continental crust (50–70 mW m−2) but in situ heat flow measurements in the detail polygon show values of 30–50 mW m−2 and an average geothermal gradient of 30 mK m−1.
The salinity in sediments decreases from 22 PSU on the seafloor to 2–3 PSU at a depth of 40 mbsf and down is almost constant.59
Hydrates in the Danube Fan are of microbial origin (methane δ13C −84‰ to −70‰) and concentrations of 99.1–99.9%.65 Drilling with MARUM MeBo200 in the northwestern part of the GHD in the REEZ showed little amounts of thermogenic gases and methane was the dominant gas in sediments of the upper ∼150 mbsf.66
Concluding, the Black Sea conditions are favorable for large GHDs formation. Only the higher seafloor temperature is with some negative effect – a shallower GHSZ but the trapping of the hydrate former gases in a thinner GHSZ could create a higher hydrate saturation.
5.2. GHD in the BEEZ: hydrate saturations
Two main layers with GHs are registered from seismic and CSEM – shallow at depths 100–150 mbsf and deep/main with a base at the BSR at depths 300–400 mbsf. According to seismic the shallow layer is with lower saturation opposite to the CSEM results (Table 2).The deeper GH-saturated horizon is registered with BSRs almost in the whole area.59 An exception is the central part of the GHD area where the BSR is horizontal as the main lithostratigraphic boundaries and cannot be recognized.59 The upper GH saturated horizon is registered on a few records and usually with lengths of first kilometers. According to CSEM some parts of the upper horizon could be with average GH saturation of >30%. Heat flow results are from the model of the deeper/main horizon and show higher average and maximum GH saturations. The heat flow method is with a higher ratio of signal/noise than seismic and CSEM.62 Its results are comparable with those from the basin analysis.53
Data provided by Dr Laura Gassner58 present hydrate saturation from the detailed polygon of the GHD in the BEEZ in Fig. 15. Results from acoustic full-waveform inversion (FWI) of ocean bottom seismographs' (OBS) data show that hydrates are connected to higher P- and S-wave velocities while the free gas under the BSRs reduces P-velocities (vP) only.58
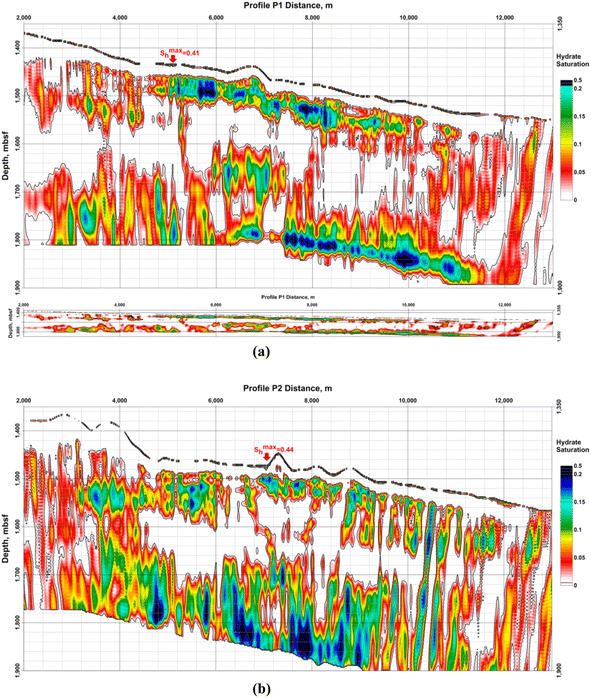 | ||
| Fig. 15 Hydrate saturation (Sh) from Gassner et al.:58 (a) profile P1; up – with vertical exaggeration; down – with the same horizontal and vertical scale; (b) profile P2. Both model grid sizes are 7,200 × 1,500 and cover 14.4 km in length and 3 km depth under the sea level. Horizontal and vertical steps are equal to 2 m. Profile P1 is parallel to P2 and the distance between them is 1 km. Sh represents the hydrate saturation of the pore space. The number of the OBS stations on every profile is 5 with 1 km spacing between them. The maximum values on the profiles P1 and P2 of Sh > 0.4 are in the uppermost sediments (near-bottom). The vertical exaggeration is ×10. | ||
A limitation of the method is the assumption that hydrates could exist only above the BSR and gas – only below the BSR.58 For the sediment volumes where hydrates and gas coexist model results will show decreased values for both – hydrate and gas saturations because the assumption in these cases decreases P-wave velocities above the BSR and increases them bellow the BSR. Information about the FWI.58 Other examples, suggesting that the results for hydrate saturation are decreased are that the Gaussian smoothing applied to obtain starting models decreased interpreted signal anomalies; vP increase above the BSR and vP/vS ratio decrease are limited; assumed no effect of the hydrate and gas on the density model, etc. Such reasons could explain the absence of gas in the model results under the registered BSR on profile P2.58
Calculated hydrate and gas saturations are up to 30% and 1.2%.58 The saturations depend on the assumed sediment composition and porosity. A better estimation needs drilling and direct parameter measurements.
Imagination with so high resolution is not possible to receive with drilling and therefore is useful in showing the challenges for hydrate production technologies due to the jumps in saturation values.
5.3. GHD in the BEEZ: hydrate volumes
The GHD in the BEEZ is designated as promising in Europe for implementation of technologies for recovery of methane from hydrates52 because of expected significant hydrate reserves in sand collectors at distance ∼200 km from the main Bulgarian port Varna (the closest to the GHD is the Bulgarian port Shabla – 135 km; the main Romanian port Constanta is at 150 km). For a raw calculation of hydrate reserves of a GHD are needed estimations of the next parameters:• average part of the GHSZ sediment volume with hydrates;
• average hydrate saturation;
• average porosity (relative volume of the sediment pore space);
• the average thickness of sediments in the GHSZ (the BSR depth under the seabed);
• lateral area of the GHD.
| Profile | S, % | S, % | S, % | S, % | S, % | S, % | S, % |
|---|---|---|---|---|---|---|---|
| Sh, % | Sh, % | Sh, % | Sh, % | Sh, % | Sh, % | Sh, % | |
| Sh > 0% | Sh > 5% | Sh > 10% | Sh > 15% | Sh > 20% | Sh > 25% | Sh > 30% | |
| P1 | 82.0 | 29.2 | 10.7 | 3.2 | 0.51 | 0.0085 | 0.0012 |
| 4.7 | 9.6 | 13.8 | 17.7 | 21.6 | 27.4 | 33.0 | |
| P2 | 81.4 | 42.5 | 17.4 | 4.9 | 1.02 | 0.0536 | 0.0019 |
| 6.2 | 9.9 | 13.8 | 18.0 | 21.9 | 26.1 | 35.7 | |
| Average | 81.7 | 35.8 | 14.0 | 4.0 | 0.76 | 0.0310 | 0.0015 |
| 5.4 | 9.8 | 13.8 | 17.8 | 21.8 | 26.8 | 34.4 |
For the GHD raw total hydrate reserve estimation, we use the values in Table 3 for the average part of the GHD sediment volume with hydrates of 81.7% and its average hydrate saturation of 5.4%.
• the average GHSZ depth of the GHD in the BEEZ is ∼350 mbsf;60
• the shallowest (main) BSR occurs in the area at depths 320–380 mbsf59 (average 350 mbsf);
• at a water depth of 765 m (close to the shallowest water depth of the GHD in the BEEZ) the BSR depth is 144 mbsf63 and only the maximum BSR1 depth in the Danube area is > 450 mbsf.64
This estimation is probably 2 times lower than this from CSEM and 3 times from the heat flow approach (Table 2). Therefore, the actual gas quantity is likely to be >3000 bcm. A conventional gas field with the closest gas reserves is the 5th largest in the world (Shtokman, Russia, 3100 bcm). The reserves of the GHD in the BEEZ are 2 times more compared with the cited down largest Norwegian gas field Troll with originally recoverable reserves of 1437 bcm (area ∼50 × 20 km; remaining reserves ∼685 bcm). About 277 production wells, 599 sidetracks and more than two million reservoir metres drilled on Troll produce yearly ∼40 bcm gas.
The presented results demonstrate the main obstacles to model estimations and future production tests. Final results will be available only after the realization of a drilling program.
6. Dominating thermodynamic processes for various methods to release natural gas from hydrates
It can be useful as an initial qualitative overview to look at which thermodynamic contributions are affected by different sets of actions intended to dissociate hydrate (Table 4).| (1) Law | Combined law | (2) Law | |||||
|---|---|---|---|---|---|---|---|
| Heat | Shaft W | Chem. W | Heat S | Shaft W | Chem. W | T | |
| P-reduction | 1–3 | 0 | 1 | 1–3 | 0 | 1 | 0 |
| Thermal | 8–10 | 0 | 5 | 8–10 | 0 | 5 | 10 |
| Chemical | 0 | 0 | 10 | 0 | 0 | 10 | 10 |
| CO2 | 5–10 | 1–5 | 3–6 | 5–10 | 1–5 | 3–6 | 10 |
Shaft work is the second term on the right-hand side of (1) law and stems from Legendre transform from energy to enthalpy, in which the internal “push work” is subtracted. Shaft work may be denoted as “exportable work”. Practically it contributes to Joule–Thomson cooling by gas expansion. It also occurs in Gibbs free energy, which is critical for the evaluation of the most likely phase distributions.
Heat is the first term on the right-hand side of the first law while heat S is the impact of the second law on Gibbs free energy. In a simplified way, Gibbs free energy can be interpreted as “available energy” since it is the energy level for flowing systems (enthalpy) minus the energy of irreversibility. Thermodynamically irreversibility is frequently named friction – in a wider interpretation of friction than simple mechanical friction.
Chemical work is the net molecular work involved in transferring molecules from one phase over to another phase. The net energy part of chemical work is the change in interaction energies with other molecules while the entropy part of it is the rearrangements of the two phases after the transfer of molecules. See also Appendix B in ref. 3 Kvamme et al. for some examples of possible models for chemical work. A numerical example is given in the last paragraph of Section 4.
T in the column for (2) law has a more extended meaning than just temperature. For thermal stimulation and injection of CO2, it is the real temperature level. It is simply an indication that the level of temperature has to be high enough to break hydrogen bonds and provide the necessary entropy increase from hydrate over to proportional amounts of gas and liquid water. In the extended meaning of adding chemicals for breaking hydrogen bonds it simply means the possibility of achieving that goal.
Table 4 is purely qualitative and just an overview as basis for more quantitative calculations, and for possible proposals that can improve the actual method.
Every hydrate reservoir is different and ranges from deposits with no free gas and high hydrate saturation, via no free gas and low hydrate saturation to all variations of sediments containing gas/liquid water and hydrate.
On top of that there are the variations in sediment distributions that can range from hydrates on top of conventional gas like for instance Messayokha in Siberia.65 Since 1970 it is estimated that about half of the produced gas from that is from dissociation of hydrate. From the time-lines for pressure changes65 it appears that the dissociation of hydrate has been slow. But it is a huge conventional gas reservoir. Some of the many wells are periodically closed and stimulated by methanol to remove hydrate plugging. To repeat – Table 1 is merely a list of challenges related to each of 4 different categories for stimulation and promotion of hydrate dissociation. Some associated calculations are presented in Section 7.
7. Advantages and limitations of methods to release natural gas from hydrates
The variety of hydrate deposits around the world is huge. It will be impossible to address the whole range of differences in gas/water/hydrate distributions in hydrate filled sediments, sediment characteristics and all other key parameters that dictate the dynamic state of the hydrate sections. And on top of that the impact of all surrounding sediments, including fracture systems that transports hydrocarbons in to hydrate filled sediments as well as fracture systems that brings in seawater and causes hydrate dissociation. Pin-pointing some challenges and suggesting possible improvements is a main motivation for this section.Several hydrate reservoir simulators are available in the open literature. Some are academic and open while others are commercial and frequently lack details on algorithms and built in parameters. A general challenge is the numerical complexity, which frequently limit the rigor of the models for phase transitions. One example is hydrate formation, and hydrate dissociation, which are frequently just an “on/off” which in only temperature and pressure for a local grid cell in a simulation. For CH4 hydrate, as one example, it is simply a question of whether conditions are inside or outside the hydrate stability limits in Fig. 1a, regardless of other competing hydrate phase transitions and associated dynamics in a non-equilibrium system. Frequently oversimplified empirical kinetic models, like the one due to Kim et al.66 are used. This correlation is based on controlled laboratory experiments in a cell with different levels of stirring and very different from conditions in natural sediment. It is not even based on the correct mechanism since all experiences from pilot plant studies (see earlier discussion in introduction) as well as theoretical considerations points on heat supply limitations for the pressure reduction method. The only way forward is a kinetic model that contains consistent thermodynamics and realistic mass transport barriers, as discussed in Section 4. See also Kvamme and Clarke5 for a review of old models and discussion of some possible pathways forward. RetrasoCodeBright33–43 is in many senses the only platform for hydrate reservoir simulations that can include competing hydrate phase transitions because it has a built in free energy minimization module. The numerical challenges are still substantial for some problems.
Within the focus of this work it is more important to evaluate the various thermodynamic contributions to hydrate phase transitions. Evaluation of specific models for the various contributions to the first law of thermodynamics (enthalpy) for energy balances, the combined law (Gibbs free energy) for phase stability and second law (entropy) for level of temperature needed to provide necessary entry increase from solid hydrate to higher level as free gas and liquid water entropies. Relative impact of the various contributions in eqn (1)–(9) and nano scale bottlenecks related to hydrogen bonds in hydrate and hydrate/liquid water interface is the main goal. Simple models intended to at least reflect potential challenges of the different methods to release natural gas from hydrates are therefore a good starting point.
Some challenges related to pressure reduction are discussed in Section 7.1 and also illustrated with simple calculations based on literature values for transport properties as systemized by Kvamme et al.7 There are many ways to add heat and Section 7.2 is mainly devoted to qualitative evaluation of the economic feasibility. Adding methanol or various chemical that breaks hydrogen bonds can be efficient locally. Salts are corrosive but also efficient. Section 7.3 is limited to some thermodynamic calculations and associated cost estimates. Injection of CO2 with additives, as discussed in Section 7.4, has some unique features like combined CO2 storage and energy production. Since new hydrate from injection gas forms inside the pores between sediments and in situ CH4 hydrate it is efficient in terms of heat transport.
7.1. Pressure reduction
A large number of experiments are reported in open literature on pressure reduction. Unfortunately many of the experiments have unrealistic boundary condition like for instance constant temperature. In many cases critical information are lacking in the reports. Some experiments are conducted without realistic sediments. Rather than attempting to discuss the varieties in experimental set-ups and associated experimental results it is better to focus on how the thermodynamic laws, as related to hydrate dissociation, are affected.
 | (26) |
Accumulation of energy in the volume elements from a producing well is omitted. r is a radial distance from the producing well, ϕ is the a rotational angle and z is the height of the cylindrical transport section, i.e.: the height of the specific hydrate filled sediment section in consideration. ρ is density and c is specific heat capacity of the sediments containing hydrate, liquid water and gas. Approximating that the heat transport is uniform all around the cylindrical heat transport then there is no rotational dependency to the temperature and the second term vanishes. In a steady state limit then also the first term on the right hand side disappears. The temperature gradient in the last term on left hand side is the geothermal gradient and assumed to be approximately constant for the hydrate filled section. With all these simplifications then eqn (26) reduces to:
 | (27) |
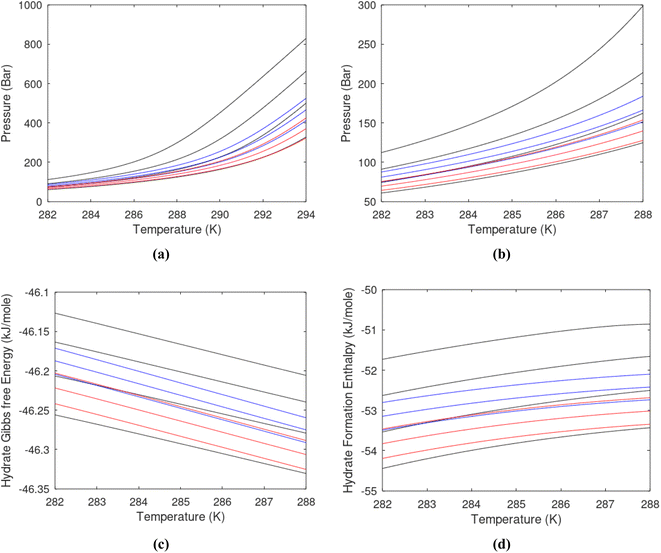
Θ is the geothermal gradient. For the Danube paleodelta values are reported to vary between 27 and 35 °C per km.55 A constant value of 31 °C per km is used in eqn (27). The enthalpies of formation for CH4 hydrate, in the relevant range of pressure temperature conditions for Danube paleodelta, are plotted in Fig. 16. The corresponding enthalpies of hydrate dissociation are the negative of the formation numbers along the pressure temperature hydrate stability limit. Since the hydrate dissociation occurs at the hydrate stability limit in pressure temperature projection then the pressure variable in (27) is an implicit function of T and integration will be in only T as function of r. The variation in enthalpies of hydrate dissociation for the actual conditions is limited and a constant average value of 53.9 kJ mol−1 CH4 is sufficient for the purpose, and rigor, of eqn (27). With constant k over the height of the hydrate filled sediment then the third term on the left hand side disappear. rmax is the maximum distance from the borehole that contributes significantly to a heat flow towards the borehole. Assuming that the borehole radius is available for gas production over the whole height, as an approximations, then rmin is the pipeline diameter. zmax is the height of the hydrate filled sediment. For stationary flow the first term of right hand side disappears (Fig. 17).
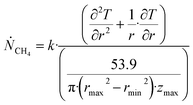 | (28) |
Recalculation to standard cubic meter is using ideal gas law. As a simple example consider the temperature profile in Fig. 17 as function of distance from a borehole with diameter 0.5 m and a radial extension of 1 km as a rather arbitrary number for efficient radial distance for heat supply to hydrate dissociation. Mathematically the plotted profile can be expressed as:
T(r) = e[a0+a1![[thin space (1/6-em)]](https://www.rsc.org/images/entities/char_2009.gif) ln(r)] ln(r)]
| (29) |
 | (30) |
 | (31) |
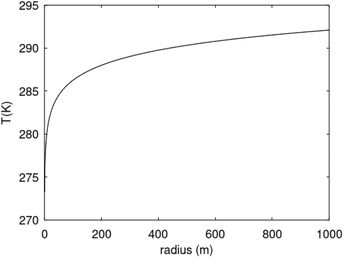 | ||
| Fig. 17 Temperature profile based on eqn (29) for rmax = 1000 m. | ||
Parameters are given in Table 5. The selection is rather random and range from typical gas fields to oil mixed fields. Details on these data, and production data for fields offshore Norway, are openly available from Norwegian Petroleum Directorate.66 Monthly production rates for three fields are plotted in Fig. 18. See also Table 6.
 in bcm per month for different radial extensions of significant heat transport towards producing well. Parameters a0 and a1 are the parameters in the temperature profile in eqn (29) for various maximum radius of significant heat transport interaction
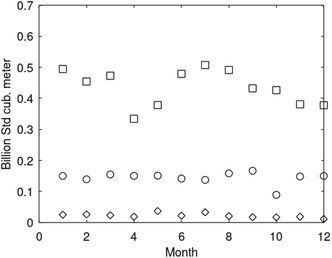 | ||
| Fig. 18 Monthly gas production rates from Kvitebjørn for 2008 (squares), Mikkel (circles) for 2005 and Lille-Frigg (diamonds) for 1997. | ||
| P | Ws | Sleipner | Lille-Frigg | Mikkel | Kvitebjørn | ||||||||
|---|---|---|---|---|---|---|---|---|---|---|---|---|---|
| Mt y−1 | mol s−1 | kg s−1 | Mt year−1 | mol s−1 | kg s−1 | Mt year−1 | mol s−1 | kg s−1 | Mt year−1 | mol s−1 | kg s−1 | ||
| 1.274 | 1020 | 40 | 0.614 | 495 | 19 | 3.932 | 3180 | 124 | 11.836 | 9572 | 375 | ||
| kW | Bwh y−1 | Cost per y | Kw | Bwh y−1 | Cost per y | kW | Bwh y−1 | Cost per y | kW | Bwh y−1 | Cost per y | ||
| 200 | 1.18 | 1204 | 10.55 | 105.5 | 584 | 5.116 | 51.16 | 3752 | 32.87 | 328.7 | 11![[thin space (1/6-em)]](https://www.rsc.org/images/entities/char_2009.gif) 295 295 |
98.94 | 989.4 |
| 230 | 1.24 | 1265 | 11.08 | 110.8 | 614 | 5.379 | 53.79 | 3943 | 34.54 | 345.4 | 11![[thin space (1/6-em)]](https://www.rsc.org/images/entities/char_2009.gif) 869 869 |
104.0 | 1040 |
| 250 | 1.26 | 1285 | 11.26 | 112.6 | 624 | 5.466 | 54.66 | 4007 | 35.10 | 351.0 | 12![[thin space (1/6-em)]](https://www.rsc.org/images/entities/char_2009.gif) 061 061 |
105.7 | 1057 |
| 270 | 1.27 | 1295 | 11.34 | 113.4 | 629 | 5.510 | 55.10 | 4039 | 35.38 | 353.8 | 12![[thin space (1/6-em)]](https://www.rsc.org/images/entities/char_2009.gif) 156 156 |
106.5 | 1065 |
| 300 | 1.28 | 1306 | 11.44 | 114.4 | 634 | 5.554 | 55.54 | 4070 | 35.65 | 356.5 | 12![[thin space (1/6-em)]](https://www.rsc.org/images/entities/char_2009.gif) 252 252 |
107.3 | 1073 |
The profile in Fig. 17 is fairly random. Initial situations for real hydrate deposits vary from high hydrate saturations and no free gas, to low hydrate saturations and substantial free gas phase in pores. Pumping out water does not result is significant Joule–Thomson effects and associated radial temperature gradients may be very small. Exporting energy from a specific volume section of the reservoir will, however, lead to cooling of the heat supply source. It is beyond the scope of this work to make iterative calculation of extracted energy for the hydrate dissociation in Table 4 and subsequent adjustment of temperature profiles adjusted for exported energy.
The pressure reduction may generate temperatures below freezing. It is, however, unrealistic to produce gas with associated water for sub-zero temperatures and that is the reason for a minimum temperature of 273.15 K in Fig. 17.
292 K and lower temperatures are not sufficient to break hydrogen bonds efficiently. There is no available information on the dynamics of destabilization of hydrogen bonds at low temperatures in open literature. It is therefore not possible to evaluate second law requirements. There is some data on dissociation of ice exposed to air at various temperatures. Due to the differences in hydrogen bonded structures in ice and also the fact that hydrate also contains guest molecules that related to surrounding components thermodynamically.
Similarly there is also a lack of available information to evaluate impact of these low temperatures on the combined law.
The second mechanism that can lead to hydrate dissociation caused by pressure reduction is the chemical work. This is the last term on right hand side in eqn (2) for the first law and eqn (9) for the combined law. See Appendix B in ref. 3 for an example. Without specific data on mass fluxes through the hydrate filled sediments in a specific reservoir there is no basis for evaluation of this specific mechanism. Dissociation in guest chemical potential gradients is slow. Then again, however, as discussed above the efficiency of dissociating hydrate in low temperature gradients are also highly uncertain. The observed oscillating behaviour for the second test offshore Japan16,17 also illustrates the complexity of extracting low temperature heat for hydrate dissociation, and the additional effect of cooling down the heat source due to extracted hydrate dissociation energy.
7.2. Thermal stimulation
Adding heat is technically efficient. There are, however, a substantial number of ways to accomplish this and they are all very different as the way the heat is distributed. Adding steam exchanges steam condensation energy for hydrate dissociation and heat conduction throughout the reservoir. Hot water, potentially hot seawater, is a less costly option which also benefits from direct injection into pore space rather than a complex transition stage of condensing steam before liquid water enters pore space. Common to all these options is that they are very expensive and substantial amounts of heat are lost to heating minerals. STATOIL (now EQUINOR) concluded68 10 years ago that thermal stimulation is not commercially feasible. No arguments are made whether this also holds today or not.Every hydrate reservoir is unique in very many aspects. This includes the more or less stationary state due dynamics of hydrate dissociation from incoming water and creation of new hydrate from upcoming gas. Frequently this balance between dynamics of hydrate dissociation from top of hydrate filled sections, and creation of new hydrate from bottom of hydrate filled sediments is the main factor that determines hydrate saturations in the pores. Hydrate saturation and related initial flow dynamics in the reservoir is one of the factors that will determine efficiency of fluid injection and the efficiency of spreading fluids around in the hydrate filled sediments. Water is of course easier to inject than CO2/N2 mixtures discussed in the next section.
Given that the economic feasibility of heat addition is very uncertain for any characteristics of hydrate deposits it does not makes sense to go into details and/or review of methods for thermal stimulation in the context of this paper. Furthermore, the thermal stimulation method, if applied alone, reduces the stability of the working volume of the sediments, increasing the water content, since the dissociation of 1 volume of hydrate creates ∼0.8 volumes of water.
7.3. Chemicals
Adding electrolyte solutions containing different ions is clearly efficient in breaking hydrogen bonds. Corrosion issue and cost depends on types of salts used. Sodium chloride is inexpensive and likely economically feasible even though portions of injected saline water will be lost. The density of water is proportional to salt content and saline water will sink. It is also environmentally friendly. Technically the efficiency is proportional to ability to distribute the injection water through the hydrate filled sediments. The technology is simple and does not need any extensive discussion here.Methanol and ethanol have excellent properties with water. They are solvable and move with water at comparable liquid water diffusivity coefficients. This is important in the behaviour towards hydrate/liquid water interface hydrogen bonds, as well as on hydrate surfaces. Methanol is, however, highly poisonous and will likely be banned for use in many relevant areas since it will pollute groundwater. Ethanol is more expensive but less poisonous. To our knowledge Brazil is the only country that utilizes ethanol for hydrate prevention since they produce low cost ethanol from sugar industry waste products. The thermodynamic inhibition aspects are well known over many decades of hydrate prevention research, and associated experimental work. Some few examples are, however, also included here since the thermodynamic model utilized in this work can also provide values for hydrate stability (Gibbs free energy) and hydrates dissociation enthalpy for use in first law energy balances. The thermodynamic models have been verified elsewhere45,69 for NaCl, as well as for alcohols, and not repeated. Fig. 19 is, however, unique since the conditions are different than the typical conditions that have been examined in earlier publications. And of course these also highly relevant for production of hydrates from Black Sea using CO2/N2 mixtures with alcohol as possible additional components for keeping the interface between injection gas and pore water free of blocking hydrate films. See also Section 7.4.
As expected the CH4 hydrates formed from water containing salt or alcohols are less stable (higher Gibbs free energy) than hydrates formed from pure water. CH4 hydrate formation enthalpies for hydrates formed are lower for two reasons. One reason is the effects of inhibitor on water but also the fact that higher pressures are needed to form hydrates from water containing inhibitors. The density of the guest molecules in the gas phase outside of the hydrate is therefore higher for the systems with inhibitor. Inclusion enthalpy difference is therefore lower for hydrates formed from water containing hydrate.
The examples in Fig. 19 are well known classical inhibitors that are solvable in water. Surfactants with surface exposed polar groups or even ionic surfactants are also alternatives that should be investigated further. High molecular weight surfactants, however, may not be the way to go since there will always be a risk of agglomeration and clogging. Nature is full of surfactants and there is much room for more research.
Hydrates in clay and very fine sand are typical systems that might be considered for chemical hydrate production. Black Sea hydrates are conventional hydrates in coarse grain sand which does not need complex and expensive methods to release natural gas from hydrates.
7.4. CO2 injection
There are very many experimental papers on the use of CO2 for combined CO2 storage and release of CH4. Every research group have their own design of experimental set-up. Frequently critical data are missing in the published report from experiments. Often the boundary conditions are inappropriate since they interfere with the mechanism for the CO2/CH4 swapping that is the purpose of the exchange. One example is experiments that are conducted at constant temperature. Since heat released from formation of a new hydrate from injection gas is a primary mechanism for the CO2/CH4 swapping it is obvious that temperature control of the experiment does not make sense. Instead of discussing a substantial number of different experimental set-ups and many different boundary conditions we skip any review of experimental efforts, including our own experimental efforts during latest 3 decades. The main scientific method in this work is classical thermodynamics analysis, based on the fundamental laws of thermodynamics. Within that perspective there are few or actually none other relevant papers to discuss and refer to except our own. There are indeed very many good papers on hydrate published every year. We are, however, the only group that utilize a totally uniform thermodynamic reference system for hydrate formed and dissociated through any possible route. Through several papers we have discussed heterogeneous hydrate formation on gas/liquid water interface as well as homogeneous hydrate formation from guest molecules dissolved in water. Lately we focus more on hydrate nucleation towards mineral surfaces. The advantage of residual thermodynamics is that the reference state is the same as ideal gas space during samplings from Molecular Dynamics (MD) simulations. With appropriate models for chemical potentials of water and guest in adsorbed state there are modern algorithms for efficient sampling of chemical potentials. See for instance Kvamme et al.1 for example of CH4 hydrate nucleation towards mineral surface. Ref. 70–75 provides overview of modern adsorption studies in classical MD modelling, including calculations of chemical potentials for adsorbed water and adsorbed guests, as well as for adsorbed ions and polar components. This is also relevant for injection of CO2/N2 with addition of alcohol and/or surfactant.Injection of CO2 into hydrate filled sediments requires two different types of additives. The first additive is a component that can increase injection gas permeability. The ideal choice is a component that can enter hydrate while being inferior to CO2 in large cavity occupancy. A typical choice can be N2 or even air. The second additive is an additive that can prevent hydrate blocking films on the interface between injection gas, and pore water. Low molecular surfactants are natural choices.7,76,77 Small alcohols, like methanol and ethanol, have surfactant properties6,45,69,78 due to low polarity parts related to methyl groups. The advantage of these small alcohols is that they move efficiently together with water on interfaces. In contrast to the first type of additives these are added in very small amounts based on an interface area action mechanism.
The total commercial income to the concept consists of the CO2 emission reduction value. Different countries have various ways to set a value on this. Norway, as an oil and gas producing country, started with a tax of 51 US$ per ton CO2 emission from oil and gas production back in 1991. This has later changed to a tax per produced unit of gas and oil respectively. The initial tax was the economic motivation for the CO2 storage in Utsira back in 1996. STATOIL (EQUINOR) philosophy was that one million ton CO2 per year separated from the Sleipner hydrocarbon system should be stored in underground aquifers at a cost lower than the CO2 emission tax. This project is still running and the same motivation was behind CO2 storage from Snøhvit (0.7 million ton CO2 per year). Looking at some large energy consumers like Germany the CO2 tax is 25 Euro per ton CO2 from 2021 and supposed to increase to 55 Euro per ton CO2 in 2025.76
Technically there are only minor differences in using air rather than N2. Oxygen will have slightly higher attraction to water than N2 and as such no negative impact. If any cost of adding air is disregarded then the “sales value” of accepting CO2 from customers will be set to 55 Euro per ton. At this stage it is unknown what Yara in Netherlands is paying Northern Lights for storing 0.8 million ton CO2 per year from ammonia production76,77 in underground aquifers offshore Norway.
Released CH4 after the swapping will migrate upwards due to buoyancy and can be directed towards a network of receiving wells. New drilling technology (ref. 2 and references therein) reduces the cost of well drilling substantially as compared to conventional drilling technology. This makes it feasible to optimize a network of receiving wells kept at pressures slightly lower than local static pressure but still high enough to reduce transport of liquid water with the sampled gas to a minimum.
The cost of compressing the gas mixture is trivially the enthalpy difference between the inlet condition and the outlet condition as corrected for entropy losses. In usual compressor design the entropy losses are incorporated through an efficiency percentage. Practically the entropy losses increase the finale temperature but then the fluid is transported to the injection point and expected to exchange heat with surroundings. Just as a conservative example we use an inlet condition of atmospheric pressure and temperature 293 K. Without the usual iteration on zero entropy change and then subsequent correction for efficiency an outlet fluid temperature of 298 K may serve as good enough as example. Cost of gas compression for some injection rates ranging from storage of small point sources like for instance Sleipner (1 million ton CO2 per year), which is also representative for the point source from Yara mentioned above as well as the initial point source in Northern Lights. That is a point source of 1.3 million ton CO2 per year from cement industry in south eastern Norway. 1 mole CO2 injected will theoretically release more than 1 mole of CH4.48 Nevertheless – as rough conservative estimate in Table 6 below we use that 1 mole CO2 injected releases 1 mole CH4. Production rates in Fig. 20 is for an ideal gas reference state and mole numbers of CO2 needed to produce those levels of CH4 production is trivially proportional. Maximum N2 mole-fraction in injection gas is set to 0.3 and moles injection gas per mole CO2 injected is therefore 1.43 moles. The numbers in Table 6 for the example fields in Fig. 20 are amounts of CO2/N2 injection gas needed to release those rates of CH4. Calculation of shaft work is generally an iterative process in which the entropy change (and associated temperature change) is an iterative solution based on a given efficiency in conversion of the necessary work needed for the compression. This is fairly trivial in chemical engineering calculations and does not need detailed explanations here. For orders of magnitude calculation in the context of this section isothermal estimates are sufficient for illustration. It is not officially known what Yara Netherlands are going to pay the Northern Lights project for storing 0.8 million tons CO2 per year in underground aquifers offshore Norway. If we use 50 US$ per ton CO2 based on level of CO2 taxes in various countries in Europe it is obvious that the compression costs are very low compared to the net income of receiving the CO2 for storage. The cost of nitrogen is low and can be replaced by the use of air, which then can be considered as zero cost. A very minor cost of keeping CH4 receiving wells at slightly lower pressures than local static pressure is not significant. Only difference in investment costs as compared to aquifer storage is these receiving wells. New drilling technology (see reference in Kvamme & Saeidi2) reduces this cost substantially as compared to conventional drilling technology.
For CO2/N2 to be feasible there are 4 criteria that has to be met:48
(1) Temperature pressure hydrate stability limits for hydrate from injection gas (CO2 with N2 and possible additives) has to be below the corresponding curve for in situ CH4 hydrate.
(2) Gibbs free energy of the hydrate formed from injection gas has to be lower (more negative) than Gibbs free energy for in situ CH4 hydrate.
(3) The enthalpy of hydrate formation for injection gas hydrate has to be higher in absolute value than the absolute value of hydrate formation enthalpy for in situ CH4 hydrate.
(4) The level of temperature supplied to in situ hydrate is high enough to break hydrogen bonds and provide the necessary entropy change from low entropy in solid hydrate to higher entropies for corresponding amounts of liquid water and gas.
Criteria (2) is always met, as discussed elsewhere,1–3,26,29,44,45,78 for CO2 and mixtures of CO2 with N2 up to roughly 25 mol% N2. 30 mol% N2 is feasible because some CO2 will distribute to other phases (dissolved, adsorbed on minerals, adsorbed on water, adsorbed on hydrate) and some N2 may even degas from CO2/N2 mixture during dynamic phase transitions. Experiments79 indicate practically no difference in performance between injection of CO2/N2 mixture containing 20 mol% N2 and 30 mol% N2. Illustrations of Gibbs free energy differences between injection gas and in situ CH4 hydrate are plotted in Fig. 21. All the mixtures are relevant. The addition of small amount of CH4 is very favorable for stabilization of the small cavities, even though also N2 will provide some hydrate stabilizing effect by filling the small cavities.
Criteria (3) is met for N2 additions up to 30 mol% in CO2/N2 injection mixture.1–3,26,27,29,44,45,78 See also Fig. 21 below, which is for typical Black Sea conditions.
Hydrate formation for all the mixtures can serve as efficient heat source for dissociation of in situ CH4 hydrate.
The primary mechanism for CO2/CH4 swapping in liquid water region of temperatures is the utilization of hydrate formation enthalpy from formation of injection gas hydrate and transfer of heat, on a pore scale, to in situ CH4 hydrate. Fast heat transfer through water phases in pores80 is likely to provide high enough temperatures when the released heat from injection gas hydrate formation reaches in situ CH4 hydrate in the pores. This is particularly true since in situ hydrate is filling the inner pore volume and injection gas enters space between hydrate and sediment walls of the pores. It is therefore expected that criteria (4) is met. It is fully possible to evaluate this assumption using heat conduction models in eqn (7) and integration between appropriate boundary conditions for different hydrate saturations (and corresponding free liquid water distribution in the pores).
Criteria (1) is a bit more special since the hydrate formed from injection gas may not be in contact with in situ CH4 hydrate. If reformation of hydrate becomes an issue then criteria (1) might be an issue but not necessarily since the density of released CH4 is relative low and will lead to CH4 migration upwards by buoyancy and towards collecting wells by pressure gradients. From a mass availability in the pores it is more likely that CO2 is present in separate phase. Fig. 22 is a plot of the pressure temperature hydrate stability projection for the conditions also applied in Fig. 20 and 21.
Just to illustrate the favorable stabilization of the small cavities for even only and addition of 1 mol% CH4 the hydrate mole-fractions of CH4 and N2 are plotted in Fig. 23. Despite a gas mole-fraction ratio of CH4 to N2 in gas ranging from 1/30 to 1/19 the ratio between the two components in the hydrate reflects the superior stabilization of the small cavity by CH4 as compared to N2, which is as expected.
Nevertheless – when choosing gas for mixing with CO2 then N2 or air is a reasonable choice since N2 and O2 at least provide some stabilization of small cavities. This is in contrast to H2. The reference to experimental studies on the use of H2 as permeability increasing additive is not given here since the study lacked from many important details in the publication. Another interesting aspect of N2 and O2 is the possibility of injecting flue gas directly. Natural gas power plants typically utilize fairly large amounts of excess air in order to ensure efficient combustion of the gas. The mol% N2 and O2 in the exhaust mixture may therefore exceed the “magic” 30 mol% discussed here. The differences in water solubility between CO2 and these two gases make it feasible to design coarse grained separation at low pressures without the use of costly amine solutions. Specific proposals on this are available but beyond the scope of this work. Other combustion situations may be more favorable for direct compression and injection.
The addition of 1 mol% CH4 is favorable for all the injection gas properties that are needed. This addition is, however, most important for the changes in pressure temperature hydrate stability limit regions. If the local relevant range of conditions (with reference to Fig. 22), or other aspects does not make it necessary to add CH4 then this cost can certainly be avoided.
In summary there is nothing very special about injection of CO2/N2 for CO2/CH4 swapping as compared to injection for aquifer storage. Injection gas permeability is different because available liquid water in the pores is smaller. Or put in a different way – if porosity is defined by fluid volume per sediment volume unit, then porosity is low for hydrate filled sediments. Minerals are water wetting and in aquifer storage the injection of CO2 faces permeability challenges if CO2 density is high, like in the Snøhvit project.81–84 For the injection into hydrate filled sediments the primary role of the N2 is to dilute the CO2 and reduce the mixture density, and as a consequence also increase injection gas permeability. To a limited extent the presence of N2 will also disturb the establishment of hydrate blocking films. Efficient reduction of flow blocking hydrate films caused by injection gas hydrate films needs surfactant additives. Small alcohols like methanol and ethanol have surfactant properties in interface between aqueous phase and a nonpolar phase due to the methyl groups. In contrast to conventional surfactants these small alcohols are dissolvable in water. In the interface between gas and liquid water there will be two limiting situations. Closer to the gas the concentration of alcohol is large relative to water and the alcohol is the solvent for water. This will efficiently prevent hydrate formation in that part of the interface. Further into the liquid water side then water is the solvent for alcohol and hydrate can form at locations in which the activity of water permits. The transition of solvent between water and alcohol respectively is visible in different mixture properties. One of them is the dielectric constant. For water methanol mixtures this transition is illustrated by Fig. 13 in Kvamme85 in which the change in gradient for the dielectric constant reflect the change in which molecule that is the solvent and which is the solute.
The change in interface free energy due to the presence of alcohol increases the transport rate of hydrate formers into the liquid water side, as well as increasing the supersaturation of hydrate formers in the water interface. The presence of surfactant also increases the extension (width) of the interface.6
Large conventional surfactants may result in surfactant clogging that can also partly block the pores. Small molecules with surfactant effects may, however, be efficient. Morpholines is one class of possible surfactant7,76,77 in addition to small amounts of alcohol. On a molecular scale small alcohols moves (molecular diffusion) together with water in the interface with comparable diffusivity coefficients. Morpholines, and other small molecules with surfactant properties, are more stationary in the interface region and may have a stronger effect in keeping the interface open and free from blocking hydrates. The balance between alcohol and other types of surfactant active molecules, as well as the total amount of interface active additives, is one of the challenges that need further experiments in order to optimize CO2/CH4 swapping schemes.
Steam cracking has developed quite much since the early invention by Norsk Hydro back in 1913. The main developments have been on new and improved catalysts, and improvement in thermodynamic efficiency through variations in excess steam. The total conversion is a two stage reaction from CH4 to CO and then CO to CO2. CO2 is a large molecule that normally only fits into the large cavity of structure I. There are some exceptions for hydrates formed at temperatures far below zero and atmospheric conditions. Another example are CO2 hydrae formation from aqueous solutions containing chemicals that result in very high CO2 solubility and homogeneous CO2 hydrate formation. With only filling of large cavities them the CO2 mole-fraction in hydrate is in the order of 0.11. In contrast the mole-fraction CH4 in situ CH4 hydrate is in the order of 0.14. The ratio of released CH4 per mole new hydrate formed from injected CO2 is therefore higher than one. This opens up for a self-driven energy cycle in which the CO2 from cracking of produced CH4 is re-injected into the reservoir for release of more CH4 for production of H2 as the only net export product. This opens up for development of new areas in permafrost regions, in addition to clean development of offshore hydrate resources.
Hydrates is the Black Sea was analyzed by Kvamme & Vasilev85,86 in terms of possible injection gas mixtures for combined CO2 storage and CH4 production. Offshore hydrates around the world dissociate due to inflow of seawater through fracture systems. The reason is the CH4 concentration in the incoming seawater is normally close to zero and thus below the hydrate stability limit in Fig. 5. Kvamme and Vasilev88 analyzed some Black Sea systems as well as some systems offshore Norway (Nyegga) with a focus of whether injection of CO2 dominated mixtures could reduce leakage fluxes of CH4 to the oceans and potentially then also to air. In either case these fluxes increase the carbon content of the oceans.
The pressure temperature corresponding to depths for two hydrate sections at Danube86–88 and two hydrate sections from Nyegga88 are plotted in Fig. 24 below along with corresponding free energies and some possible injection mixtures.
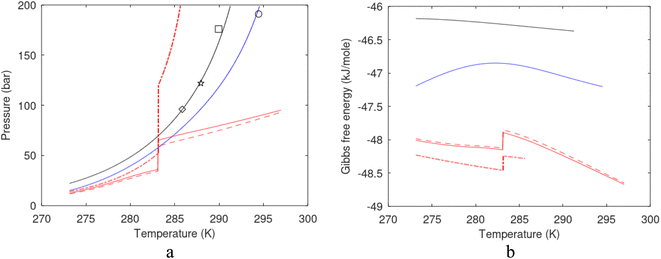 | ||
| Fig. 24 (a) Pressure temperature stability limits for some hydrates from Danube and Nyegga and model systems. Circle and square are from Danube while diamond and pentagram are from Nyegga. Solid black curve is calculated hydrate stability limits for pure CH4 hydrate while blue curve is calculated hydrate stability limits for a mixture of 1.75 mol% H2S and rest CH4. The two points from Nyegga and the highest (closest to seafloor) point from Danube appear to be close to pure CH4 hydrates while the deepest one from Danube might contain H2S based on the calculations as well as observations of H2S containing hydrates in the Black Sea.85,86 Red dash dot curve is for hydrates from pure CO2. Solid red is for a mixture consisting of 1 mol% CH4, 2 mol% C2H6, 70 mol% CO2 and 27 mol% N2. This injection mixture is denoted as mixture 1. Dashed red is for a mixture of 1 mol% CH4, 4 mol% C2H6, 70 mol% CO2 and 25 mol% N2. This injection mixture is denoted as mixture 2. (b) Gibbs free energy for the hydrates in (a). | ||
Commercial use of the deepest Danube resource that likely contains significant amounts of H2S is not interesting. Although mixture 2 (Fig. 24) will be able to swap also that hydrate, and released H2S likely mix into new hydrate formation together with injection gas we focus on the three other systems. Highest temperature is therefore 289.95 K for the Danube system following the CH4 hydrate curve.
In situ CH4 hydrate is structure I hydrate and so is hydrate from injection gas. In terms of performance the relevant numbers are moles CH4 per mole water in hydrate, and mole CO2 in hydrate formed from injection gas per mole water.
For pure CH4 hydrate moles CH4 per mole water is simply:
 | (32) |
The mass balance for a mixture is also trivial and the linear algebraic equation for mole numbers of different guests in hydrate per mole water in hydrate is simply the solution to eqn (33) below.
 | (33) |
Moles CH4 in the in situ CH4 hydrate per mole water is plotted is plotted in Fig. 25 below along with moles CO2 in hydrate formed from mixture 1.
Just to complete the thermodynamic analysis for Danube and Nyegga CH4 hydrates the enthalpy change for hydrate formation for in situ CH4 hydrate, and for injection gas mixture 1, are plotted in Fig. 26 below along with the entropy changes for the hydrate formations. The enthalpy of hydrate formation for the injection gas is more than sufficient to dissociate the in situ hydrate even if it would have been a situation of 1 mole water creating hydrate from injection gas and needing to dissociate in situ CH4 hydrate to release 1 mole of water. For Danube hydrate systems, as well as for Nyegga hydrate systems, however the situation is far from these limitations in free pore water. Low hydrate saturation ensures availability of water for creation of significantly more than 1 mole injection gas hydrate per in situ CH4 hydrate that needs to be dissociated from the released heat of new hydrate formation.
Production of the released CH4 and direct use as energy source is an option but an even better option is to combine the swapping with steam cracking of released CH4. Ideally (100% conversion efficiency) each CH4 produce 2 moles of H2 for energy use and 1 mole of CO2 for re-injection back into the reservoir after makeup with the additional gas components in mixture 1. 100% conversion is of course not realistic but the actual conversion efficiency depends on the specific version of steam cracking. It is therefore better to leave the number as they are with 100% efficiency in the context of this work so that everyone can scale down based on the efficiency of the version used. Produced moles H2 per moles CO2 stored is then simply twice the numbers of released H2 in Fig. 25b. For the highest Danube section one mole CO2 stored as hydrate can ideally produce 3.36 moles H2. For Nyegga the two sections can produce 3.20 and 3.28 moles H2 per mole CO2 stored as hydrate respectively, for highest and deepest.
H2 as net export product is by itself a great value in developments towards a more sustainable future. In some regions of the world, however, the CH4/CO2 swap coupled with steam cracking into a cycle as described can provide new development of areas that may be fairly non-productive because they are remote from conventional energy sources. One of numerous examples can be found in Chinese permafrost regions.90
Finally it should also be mentioned that the steam cracking method is not limited to CH4. There are several versions that documents cracking of larger hydrocarbons. Some of the worldwide hydrates are of thermogenic origin, or a mixture of biogenic and thermogenic hydrocarbons. Typically we are then talking about structure I and structure II hydrates with up to iso-butane. Structure H can contain larger hydrocarbons but are very rare to find in nature.
8. Some estimates of commercial value of Black Sea hydrates
As discussed in Section 7.1 there are substantial challenges in extracting heat from surroundings over long time scales. And the fact that it is low temperature heat is a challenge in efficiently breaking hydrogen bonds and generating the necessary change in entropy from an ordered structure like hydrate over to disordered liquid water phase and even more disordered gas phase. Pressure change through heat supply from surrounding is generally questionable for the Black Sea hydrate saturations discussed in Section 5. If chemical work in the last term on right hand side of first law, and the combined law in terms of free energy, is to provide an efficient production mechanism the water inflow from surroundings have to come from sections of the sediments which does not contain hydrate. There is no information in the data reported in Section 5 on whether this is realistic or not.Until it can be verified that the limitations in heat supply, and limitations in chemical work as production mechanism, can be overcomed then pressure reduction method may not provide any long term natural gas value from Black Sea hydrates. This statements is also supported by the failures of the two pressure reduction tests offshore Japan.15,16
Adding heat in the forms of steam, hot water or other methods of direct heat supply is not expected to be cost efficient as discussed in Section 7.2. Limited hydrate saturation involved in fairly large heat loss in heating water and minerals surrounding the hydrate. Low hydrate saturations is also a substantial challenge for the effect of adding water soluble chemicals due to the in situ dilution of chemicals in pore water. Exceptions are surfactants which are active on liquid water surface and can be efficient in turbulent flow situations when polar or ionic groups collides with hydrate surfaces. One challenge might be that some surfactants might adsorb on mineral surfaces and reduce amounts of surfactant available for action on hydrate surfaces. To our knowledge it has never been verified if this category of chemicals are dynamically efficient in producing hydrates.
The nano scale limitations of mass transport across the hydrate/liquid water interface is a bottleneck that also controls macroscopic hydrate phase transition dynamics. This bottleneck appears in hydrate growth as well as hydrate dissociation. As such eqn (24) in Section 4.2.2 applies to hydrate dissociation as well, with an opposite sign for hydrate dissociation relative to hydrate growth. The thermodynamic control factor in eqn (20) is of course different qualitatively as well as quantitatively. The qualitative difference is that hydrate nucleation and growth contains and “push-work” penalty for giving space for the new phase. This is typically not present in hydrate dissociation. Quantitatively Gibbs free energy change in the thermodynamic factor is sensitive to the actual temperature. The associated heat transport term is proportional to the temperature of the water surrounding the in situ CH4 hydrate as a result of the released heat due to formation of a new hydrate from the injection gas. Within all levels of uncertainties related to reservoir and all related characteristics, including hydrate saturation we might as well set the thermodynamic factor to unity without any justification beyond the level of uncertainties. Fixing the mole-fraction CH4 in the hydrate to 0.14 as an approximation we end up with a model for CH4 hydrate dissociation flux.
 | (34) |
Eqn (26) is not new and was developed and utilized in Kvamme et al.21 to predict hydrate film thickness for CH4 hydrate and CO2 hydrate respectively. Agreement with experimental observations were remarkably good. As such the model has been verified elsewhere.21
At this level of available information on the reservoir, and uncertain in hydrate saturations and pore scale properties, it is only possible to provide some best possible estimates of CH4 release. This can be done for some values of temperature, and the assumption that hydrogen bonds in the liquid water/hydrate interface is efficiently broken and that the hydrate dissociation delay due to interface transport is zero. We also assume that the addition of N2 is sufficient to avoid bottlenecks relate to injection gas permeability. And furthermore we will assume that added surfactant or surfactant mixture (for instance alcohol and classical surfactant) is sufficient to avoid blocking hydrate films during formation of hydrate from injection gas.
The molecular transport during a dynamic hydrate dissociation may be significantly faster than self diffusion in liquid water. Estimated hydrate dissociation flux in moles CH4 m−2 s−1 as function of temperature and diffusivity coefficient are listed in Table 7 below.
| Dliq T | 1 × 10⁻⁸ m2 s−1 | 5 × 10⁻⁸ m2 s−1 | 1 × 10⁻⁷ m2 s−1 | 5 × 10⁻⁷ m2 s−1 | 1 × 10⁻⁶ m2 s−1 | 5 × 10⁻⁶ m2 s−1 |
|---|---|---|---|---|---|---|
| Flux | Flux | Flux | Flux | Flux | Flux | |
| 274 | 6.54 × 10⁻⁵ | 3.26 × 10⁻⁴ | 6.54 × 10⁻⁴ | 3.26 × 10⁻³ | 6.54 × 10⁻³ | 3.26 × 10⁻² |
| 278 | 6.75 × 10⁻⁵ | 3.37 × 10⁻⁴ | 6.75 × 10⁻⁴ | 3.37 × 10⁻³ | 6.74 × 10⁻³ | 3.37 × 10⁻² |
| 282 | 6.95 × 10⁻⁵ | 3.48 × 10⁻⁴ | 6.95 × 10⁻⁴ | 3.47 × 10⁻³ | 6.95 × 10⁻³ | 3.48 × 10⁻² |
| 286 | 7.15 × 10⁻⁵ | 3.58 × 10⁻⁴ | 7.15 × 10⁻⁴ | 3.57 × 10⁻³ | 7.16 × 10⁻³ | 3.58 × 10⁻² |
The range maximum temperature in Table 7 might be low and is limited by the models for diffusivity and concentration profiles. Extrapolarions to higher temperatures using the similar scaling factor in eqn (26) is expected to be fair though. It is rather unclear what the actual hydrate surface temperature is since the consumption of heat for breaking hydrogen bonds in water/hydrate interface and during dissociation of hydrate leads to cooling of the hydrate core. Some published Phase Field Theory (PFT) simulations11,89 provides insight into possible temperature distributions on CH4 hydrate core during CO2/CH4 swapping.
The conversion of the flux numbers from Table 7 to expected production rates goes through expected efficient area covered by injection gas. This is a technological issue on how the injection is performed as well as flow and distribution aspects in the balance between the properties of the injection gas, hydrate saturation of the in situ CH4 as well as many other properties that dictate flow and fluid distributions. It is also feasible to inject through several wells, which may also be economically feasible with new low-cost drilling technology. See Kvamme and Saeidi2 for references and discussion on that. Within the level of information that is available on the Black Sea hydrates it is impossible to provide any accurate estimates and the best we can do is to illustrate some possible scenarios for one temperature.
The numbers in Table 8 can be compared directly to conventional gas fields and some examples are gien in Fig. 18 above. We have not looked into the monthly variations in Kvitebjørn. The gas treatment plant for Troll gas is located at Kollsnes outside Bergen in Norway. Troll is the largest Norwegian gas field and the guarantist for gas deliveries to Europe according to contracts. Kvitebjørn is one of the smaller fields which is also transported to Kollsnes and treated in a separate gas treatment plant there. Whether the monthly variations are related to balance and agreed delivery rate to Europe or there are other reasons is not known. It is still one of many gas producing fields offshore Norway. Data for all of them in the same format as the data plotted in Fig. 18 is openly available.67
| Dliq area | 1 × 10⁻⁸ m2 s−1 | 5 × 10⁻⁸ m2 s−1 | 1 × 10⁻⁷ m2 s−1 | 5 × 10⁻⁷ m2 s−1 | 1 × 10⁻⁶ m2 s−1 | 5 × 10⁻⁶ m2 s−1 |
|---|---|---|---|---|---|---|
| Prod | Prod | Prod | Prod | Prod | Prod | |
| 1 | 6.54 × 10⁻⁵ | 3.26 × 10⁻⁴ | 6.54 × 10⁻⁴ | 3.26 × 10⁻³ | 6.54 × 10⁻³ | 3.26 × 10⁻² |
| 5 | 3.38 × 10⁻⁴ | 1.63 × 10⁻³ | 3.38 × 10⁻³ | 1.63 × 10⁻² | 3.38 × 10⁻² | 1.63 × 10⁻¹ |
| 10 | 6.54 × 10⁻⁴ | 3.26 × 10⁻³ | 6.54 × 10⁻³ | 3.26 × 10⁻² | 6.54 × 10⁻² | 3.26 × 10⁻¹ |
| 50 | 3.38 × 10⁻³ | 1.63 × 10⁻² | 3.38 × 10⁻² | 1.63 × 10⁻¹ | 3.38 × 10⁻¹ | 1.63 |
Although much of the example conditions are related to a limited region of the Black Sea the total amount of hydrates in the Black Sea between Bulgaria and Romania is significant and can supply with gas for many years the EU (2021 gas consumption of 396.6 bcm). Exact how many years depends on the way the hydrates are produced and efficiency. Assuming the GHD in the REEZ with the same reserves as the GHD in the BEEZ the two largest GHDs in the Danube Fan are with >6000 bcm gas. Therefore 15 years of gas to EU may be as good a guess as any other based on what we know from current seismic information and other data available.
The CO2 storage capacity per m3 of CH4 hydrate filled sediment under the local conditions and typical hydrate saturations is in the order of 110 kg. To put this number into perspective we can compare to Utsira storage of gas separated from the Slepner field in the North Sea which is a million ton CO2 per year, or 2740 ton CO2 per 24 hours. This is even small compared to CO2 from a full scale gas power plant. The trick at Utsira injection is to bring the condition of the CO2 injection close to critical point for a mixture of CO2 and CH4, i.e., small amounts of CH4 is added to the CO2 in order to create the high permeability of an injection gas close to critical point. CO2/N2 injection into Black Sea hydrates facilitate from the added supercritical N2 and potentially some CH4. With the limited hydrate saturation and a typical porosity of 0.45 in the Black Sea it is expected that CO2/N2 injection into Black Sea hydrates is expected to manage at least same rates as injection into Utsira. These numbers are based on injection well at Utsira. As discussed elsewhere2 low cost drilling technology can make it economically feasible to drill several injection wells and distribute the injection to increase injection capacity. It is therefore technically feasible to reach CO2/N2 injection rate capacities comparable to established aquifer storage projects and higher.
In contrast to for instance pressure reduction the mechanism is on nano scale and formation of new CO2 dominated hydrate happens close to in situ CH4 hydrates. Within the level of information presently available on Black Sea hydrates there is no reason to believe in anything less than the total recovery of the in situ CH4 gas hydrate. This is particularly true of the relatively high amount of free water in the pores that can create new hydrate and serve as heat sources for CH4 hydrate dissociation.
9. Discussion
The substantial variation of experimental designs in open literature reports on CO2/CH4 swapping using either pure CO2 or CO2/N2 mixtures makes it challenging to review and compare experimental results. The reason is the differences in important kinetic parameters in the different experimental setups. Examples are differences in porosity, differences in injection rates, differences in pore flow characteristics, and efficient free pore water/injection gas contact area. These are just a few important differences from a long list. On top of this, there are frequently experimental boundary conditions that interfere with exchange mechanisms. One example of this is experiments conducted at a constant temperature. As discussed in this work, and many other papers referred to in this paper, a dominating mechanism for the CO2/CH4 swapping in liquid water range of temperatures is that released heat from the formation of hydrate from free pore water and injection gas releases enough heat to dissociate in situ CH4 hydrates. Exchanging heat between the hydrate-filled sediment and a cooling section then obviously disturbs the natural impact of the heat delivered from the new hydrate formation gas and free water, and the in situ CH4 hydrates. Conducting the swapping experiments in a container made of heat-insulating material also induces bias as compared to natural surroundings. In a significant number of experimental papers important details are missing, often details of importance for the CO2/CH4 swapping mechanism. For these reasons, as well as several additional reasons, we excluded reviews of our experiments along with all other published experiments.There is also the danger of reviews contributing to bringing errors and possible inadequate models further to a wider audience. A few examples of this can be found in the review paper by Koh et al.91 The pressure-temperature hydrate stability limits for CO2 in their Fig. 23 are not following recent experimental data, as illustrated in Fig. 24 below. Another example is the equations of Kim and Bishnoi65 listed on the right column of page 117 below the 4th paragraph in ref 91. This is an empirical equation based on experiments with controlled stirring without sediments and no coupling between the various kinetic contributions to phase transition kinetics as discussed in models like Classical Nucleation Theory (see Section 4 for a discussion and references) and more advanced models. The list of examples can be very long but limiting ourselves to a final example here then we can consider the equation below the first paragraph on the right-hand side of page 119 (ref. 91) due to Anderson et al.92 This equation does not apply to realistic pore sizes in natural sediments. Pores sizes beyond nanoscale pore sizes will have a region close to mineral surfaces for which water structures are very extreme. The water density in the first adsorbed layer of water towards a mineral surface can typically be up to 3 times liquid water density (see Kvamme et al.1 and references in that paper, including references to fundamental experiments) but has a limited range in the order of 2 to 3 nm from the mineral surface before water density is like regular water. These nano-scale effects are critically important in the nucleation of hydrate toward mineral surfaces. And it also prevents hydrate from sticking directly to mineral surfaces. Except for these effects most of the liquid water in pore volume, in realistic natural gas hydrate-filled sediments, is liquid water. These three examples are not meant as any discredit of the review paper by Koh et al.91 but rather a warning that reviews of experiments and analyses from other research groups always can involve an element of risk of spreading information and data which are not correct and/or at least may need further details on limitations that are not provided in the review.
Frequently the CO2 hydrate stability limits are plotted wrongly in the open literature. There is no reason to speculate on the reasons for that within the focus of this paper but the lack of a steep change in the stability limits practically means that a CO2 density change to a higher density is omitted then. Calculated hydrate stability limits (solid curve) are compared to several experimental studies in Fig. 27 below. It is a non-equilibrium system so there is no reason to look for specific points of multiple-phase coexistence as they may not even exist as a stable point in a Gibbs free energy minimum consideration. This is in contrast to an equilibrium situation in which there are of course well defined equilibrium points. The solid line is simply defined and calculated by the conditions of hydrate in equilibrium with liquid water and CO2. Higher density for CO2 leads to lower fugacity coefficients and then the lower chemical potential for CO2 as a separate phase. Higher pressure is therefore needed for the CO2 to prefer the hydrate phase in the dense CO2 region. This density shift will also of course appear in all mixtures of CO2 with other components.
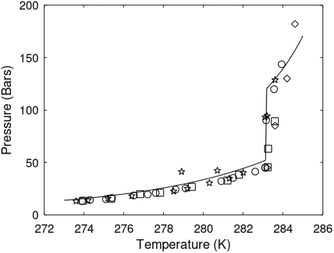 | ||
| Fig. 27 Calculated pressure temperature hydrate stability limits for pure CO2 hydrate (solid) as compared to experimental data for CO2 hydrate from Herri et al.93 (circles), Takenouchi and Kennedy94 (diamonds), Ohgaki et al.95 (blue squares) and Fan and Guo96 (pentagrams). | ||
The reason that we have not used a hydrate reservoir simulator to obtain a better perspective of swapping profiles in 2D or 3D modeling is that there are no available hydrate reservoir simulators that have a realistic swapping mechanism incorporated. It is far beyond the scope of this work to give a review of hydrate reservoir simulators. RetrasoCodeBright34–39 has a structure that permits the inclusion of kinetic models like the one in eqn (26) but at this stage, there is no budget to pay for the implementation although it will be a similar strategy that was used when implementing a slightly different kinetic model for CH4/CO2 swapping.38
As discussed earlier the technology needed is conventional petroleum technology. The primary focus in future research should therefore be devoted to optimizing the surfactant mixture. To avoid surfactant agglomeration the search is for low MW surfactants, and a mixture with ethanol to optimize the interface effect through the high mobility of ethanol with water.
While N2 is used as the primary additive for increasing injection gas permeability air can also be used for simplicity. Thermodynamically the difference between air and N2 is not even significant in the thermodynamic analysis conducted in this study.
10. Conclusions
In this work, we have mapped the hydrate distributions in the Black Sea between Bulgaria and Romania with the perspective of commercial production of natural gas from these hydrates. Thermal stimulation (steam or other methods) may not be economically feasible and substantial amounts of heat will be listed to other things than hydrate production. Adding chemicals, like for instance thermodynamic hydrate inhibitors, is also expensive and efficiency will be reduced by dilution in pore water for the relatively low hydrate saturations. Two mechanisms can dissociate hydrate during pressure reduction. The establishment of a temperature gradient due to the Joule–Thomson effects generates a low-temperature heat supply and questions are raised on the efficiency of this in breaking hydrogen bonds. Long-term cooling of surrounding sediments is another challenge. Extraction of fluids from hydrate-filled sections will lead to an inflow of fluids from neighboring sediments. These fluids may be under-saturated with natural gas and chemical work-induced hydrate dissociation may occur. These are, however, kinetically slow processes. In summary pressure reduction may be questionable as a feasible production method for Black Sea hydrates.The hydrate distributions and hydrate saturations make it very feasible for combined storage of CO2 in the form of hydrate and the associated release of CH4. Injection of CO2 and CO2/N2 mixtures is easy and follows conventional technology. Released CH4 will migrate upwards and will be trapped by the sealing structures. Logistics of where to put producing wells is also fairly standard petroleum technology.
The total commercial value of injecting CO2/N2, CO2/air, or flue gas with a CO2 content of at least 30 mol% is the combination of storing CO2 at a price related to the level of CO2 tax, and the value of the produced CH4. Cracking the produced gas with steam is an additional option in which the separated CO2 from the cracking is returned to the hydrate-filled sediments and Hydrogen is used for local energy production or transport.
There is no reason, at least at this stage, to search for alternatives to N2 or air as the permeability-promoting additive to CO2. The second additive is added in small portions – typically from ppm and up. The purpose of this additive is to promote fast massive hydrate formation from injection gas (CO2/N2) while still reducing hydrate blocking of the pores. For this purpose, we seek a mixture of ethanol and a classical low molecular-weight surfactant. In the long run, we seek an environmentally friendly surfactant.
Based on reasonable assumptions and approximations it is possible to reach commercial natural gas for the hydrates in the Black Sea. And given the combined CO2 storage value and the value of the produced gas, the total value may even be higher than for conventional natural gas.
An extra value can be added by combining the CH4/CO2 swap with steam cracking of the produced CH4. This leaves H2 as the only export product for clean energy use. In a wider context this particular extension can open up for population of remote permafrost areas since it is basically a stand-alone solution in which the steam cracking for the H2 production generates the CO2 needed for the cycle.
Conflicts of interest
There are no conflicts of interests.Acknowledgements
We would like to thank the reviewers for the time and effort necessary to review the manuscript and improve its quality. This work was supported by: Bulgarian Science Fund project KP-06-OPR04/7 GEOHydrate “Geothermal evolution of marine gas hydrate deposits – Danube paleodelta, Black Sea” (2018–2023); European Union project 101000518 DOORS: Developing Optimal and Open Research Support for the Black Sea (2021–2025). Bjørn Kvamme is grateful for financial support through 111 Project (No. D21025), National Key Research and Development Program (No. 2019YFC0312300), National Natural Science Foundation Item of China (No. U20B6005-05, 51874252 and 5177041544), Open Fund Project of State Key Laboratory of Oil and Gas Reservoir Geology and Exploitation (No. PLN2021-02 and PLN2021-03).References
- B. Kvamme, J. Zhao, N. Wei, W. Sun, N. Saeidi, J. Pei and T. Kuznetsova, Hydrate Production Philosophy and Thermodynamic Calculations, Energies, 2020, 13, 672, DOI:10.3390/en13030672.
- B. Kvamme and N. Saeidi, A Zero Emission Scheme for Producing Energy from Natural Gas Hydrates and Conventional Natural Gas, Petroleum, 2021, 7, 364–384, DOI:10.1016/j.petlm.2021.10.003.
- B. Kvamme, Thermodynamics and Kinetic Mechanisms for CH4/CO2 Swapping in Natural Sediments, Energy Fuels, 2022, 36, 6374–6396, DOI:10.1021/acs.energyfuels.2c00902.
- B. Kvamme, Thermodynamic Limitations of the CO 2/N 2 Mixture Injected into CH 4 Hydrate in the Ignik Sikumi Field Trial, J. Chem. Eng. Data, 2016, 61, 1280–1295, DOI:10.1021/acs.jced.5b00930.
- B. Kvamme and M. Clarke, Hydrate Phase Transition Kinetic Modeling for Nature and Industry–Where Are We and Where Do We Go?, Energies, 2021, 14, 4149, DOI:10.3390/en14144149.
- B. Kvamme, J. Selvåg, N. Saeidi and T. Kuznetsova, Methanol as a Hydrate Inhibitor and Hydrate Activator, Phys. Chem. Chem. Phys., 2018, 20, 21968–21987, 10.1039/C8CP02447B.
- J. Selvåg, T. Kuznetsova and B. Kvamme, Molecular Dynamics Study of Surfactant-Modified Water–Carbon Dioxide Systems, Mol. Simul., 2018, 44, 128–136, DOI:10.1080/08927022.2017.1350783.
- A. Svandal, Modeling Hydrate Phase Transitions Using Mean-Field Approaches, PhD thesis, University of Bergen, Bergen, 2006 Search PubMed.
- T. Buanes, Mean–Field Approaches Applied to Hydrate Phase Transition, PhD thesis, University of Bergen, Bergen, Norway, 2006 Search PubMed.
- M. Qasim, Microscale Modeling of Natural Gas Hydrates in Reservoirs, PhD thesis, University of Bergen, Bergen, Norway, 2012 Search PubMed.
- K. Baig, Nano to Micro Scale Modeling of Hydrate Phase Transition Kinetics, 2017, PhD thesis, University of Bergen, Bergen, Norway Search PubMed.
- E. D. Sloan and C. A. Koh, Clathrate Hydrates of Natural Gases, CRC Press, Boca Raton, USA, 3rd edn, 2000 Search PubMed.
- K. M. Sabil, O. Nashed, B. Lal, L. Ismail and A. Japper-Jaafar, Experimental Investigation on the Dissociation Conditions of Methane Hydrate in the Presence of Imidazolium-Based Ionic Liquids, J. Chem. Thermodyn., 2015, 84, 7–13, DOI:10.1016/j.jct.2014.12.017.
- K. Tumba, P. Reddy, P. Naidoo, D. Ramjugernath, A. Eslamimanesh, A. H. Mohammadi and D. Richon, Phase Equilibria of Methane and Carbon Dioxide Clathrate Hydrates in the Presence of Aqueous Solutions of Tributylmethylphosphonium Methylsulfate Ionic Liquid, J. Chem. Eng. Data, 2011, 56, 3620–3629, DOI:10.1021/je200462q.
- Y. Konno, T. Fujii, A. Sato, K. Akamine, M. Naiki, Y. Masuda, K. Yamamoto and J. Nagao, Key Findings of the World's First Offshore Methane Hydrate Production Test off the Coast of Japan: Toward Future Commercial Production, Energy Fuels, 2017, 31, 2607–2616, DOI:10.1021/acs.energyfuels.6b03143.
- K. Yamamoto, X.-X. Wang, M. Tamaki and K. Suzuki, The Second Offshore Production of Methane Hydrate in the Nankai Trough and Gas Production Behavior from a Heterogeneous Methane Hydrate Reservoir, RSC Adv., 2019, 9, 25987–26013, 10.1039/C9RA00755E.
- N. Tenma, AIST, Tokyo, Japan, Recent Status of Methane Hydrate R&D Program in Japan, Presented at 11th International Methane hydrate Research and Development workshop (IMHRD), Corpus Christi, Texas, USA, 6-8 December 2017, Presented December 7 from 8.15 to 9.00 Search PubMed.
- G. Tegze, T. Pusztai, G. Tóth, L. Gránásy, A. Svandal, T. Buanes, T. Kuznetsova and B. Kvamme, Multiscale Approach to CO2 Hydrate Formation in Aqueous Solution: Phase Field Theory and Molecular Dynamics. Nucleation and Growth, J. Chem. Phys., 2006, 124, 234710, DOI:10.1063/1.2207138.
- A. Svandal, T. Kuznetsova and B. Kvamme, Thermodynamic Properties and Phase Transitions in the H2O/CO2/CH4 System, Fluid Phase Equilib., 2006, 246, 177–184, DOI:10.1016/j.fluid.2006.06.003.
- B. Kvamme and H. Tanaka, Thermodynamic Stability of Hydrates for Ethane, Ethylene, and Carbon Dioxide, J. Phys. Chem., 1995, 99, 7114–7119, DOI:10.1021/j100018a052.
- B. Kvamme, R. B. Coffin, J. Zhao, N. Wei, S. Zhou, Q. Li, N. Saeidi, Y.-C. Chien, D. Dunn-Rankin and W. Sun, et al., Stages in the Dynamics of Hydrate Formation and Consequences for Design of Experiments for Hydrate Formation in Sediments, Energies, 2019, 12, 3399, DOI:10.3390/en12173399.
- A. Falenty, A. N. Salamatin and W. F. Kuhs, Kinetics of CO2-Hydrate Formation from Ice Powders: Data Summary and Modeling Extended to Low Temperatures, J. Phys. Chem. C, 2013, 117, 8443–8457, DOI:10.1021/jp310972b.
- A. N. Salamatin, A. Falenty, T. C. Hansen and W. F. Kuhs, Guest Migration Revealed in CO2 Clathrate Hydrates, Energy Fuels, 2015, 29, 5681–5691, DOI:10.1021/acs.energyfuels.5b01217.
- B. Peters, N. E. R. Zimmermann, G. T. Beckham, J. W. Tester and B. L. Trout, Path Sampling Calculation of Methane Diffusivity in Natural Gas Hydrates from a Water-Vacancy Assisted Mechanism, J. Am. Chem. Soc., 2008, 130, 17342–17350, DOI:10.1021/ja802014m.
- B. Kvamme, J. Zhao, N. Wei and N. Saeidi, Hydrate—A Mysterious Phase or Just Misunderstood?, Energies, 2020, 13, 880, DOI:10.3390/en13040880.
- B. Kvamme, Environmentally Friendly Production of Methane from Natural Gas Hydrate Using Carbon Dioxide, Sustainability, 2019, 11, 1964, DOI:10.3390/su11071964.
- B. Kvamme, Enthalpies of Hydrate Formation from Hydrate Formers Dissolved in Water, Energies, 2019, 12, 1039, DOI:10.3390/en12061039.
- B. Kvamme, Kinetics of Hydrate Formation, Dissociation and Reformation, Chem. Thermodyn. Therm. Anal., 2021, 1–2, 100004, DOI:10.1016/j.ctta.2021.100004.
- B. Kvamme, Consistent Thermodynamic Calculations for Hydrate Properties and Hydrate Phase Transitions, J. Chem. Eng. Data, 2020, 65, 2872–2893, DOI:10.1021/acs.jced.0c00171.
- B. Kvamme, S. A. Aromada and P. B. Gjerstad, Consistent Enthalpies of the Hydrate Formation and Dissociation Using Residual Thermodynamics, J. Chem. Eng. Data, 2019, 64, 3493–3504, DOI:10.1021/acs.jced.9b00276.
- W. L. Jorgensen and J. D. Madura, Temperature and Size Dependence for Monte Carlo Simulations of TIP4P Water, Mol. Phys., 1985, 56, 1381–1392, DOI:10.1080/00268978500103111.
- G. Soave, Equilibrium Constants from a Modified Redlich-Kwong Equation of State, Chem. Eng. Sci., 1972, 27, 1197–1203, DOI:10.1016/0009-2509(72)80096-4.
- K. Qorbani, B. Kvamme and R. Olsen, Non-Equilibrium Simulation of Hydrate Formation and Dissociation from CO2 in the Aqueous Phase, J. Nat. Gas Sci. Eng., 2016, 35, 1555–1565, DOI:10.1016/j.jngse.2016.03.093.
- K. Qorbani and B. Kvamme, Non-Equilibrium Simulation of CH4 Production from Gas Hydrate Reservoirs through the Depressurization Method, J. Nat. Gas Sci. Eng., 2016, 35, 1544–1554, DOI:10.1016/j.jngse.2016.03.102.
- K. Qorbani, B. Kvamme and R. Olsen, Sensitivity Analysis of CO2 Injection within Saline Aquifers for Storage Purposes in the Form of Hydrate Using a Reactive Transport Simulator, J. Chem. Eng. Data, 2016, 61, 4148–4156, DOI:10.1021/acs.jced.6b00567.
- K. Qorbani and B. Kvamme, Modeling of CH4 Production through the Depressurization Method from Bjørnøya Gas Hydrate Basin Using Reactive Transport Simulator, in Proceedings of the Proceeding of 12th International Conference on Heat Transfer, Fluid Mechanics and Thermodynamics, Malaga, Spain, July 11 2016 Search PubMed.
- K. Qorbani, B. Kvamme and T. Kuznetsova, Simulation of CO2 Storage into Methane Hydrate Reservoirs, Non-Equilibrium Thermodynamic Approach, Energy Procedia, 2017, 114, 5451–5459, DOI:10.1016/j.egypro.2017.03.1689.
- K. Qorbani, B. Kvamme and T. Kuznetsova, Using a Reactive Transport Simulator to Simulate CH4 Production from Bear Island Basin in the Barents Sea Utilizing the Depressurization Method, Energies, 2017, 10, 187, DOI:10.3390/en10020187.
- K. Qorbani, Non-Equilibrium Modelling of Hydrate Phase Transition Kinetics in Sediments, PhD thesis, University of Bergen, Bergen, Norway, 2017 Search PubMed.
- K. Jemai, Modeling Hydrate Phase Transitions in Porous Media Using a Reactive Transport Simulator, PhD thesis, University of Bergen, Bergen, Norway, 2014 Search PubMed.
- M. T. Vafaei, Reactive Transport Modelling of Hydrate Phase Transition Dynamics in Porous Media, PhD thesis, University of Bergen: Bergen, Norway, 2015 Search PubMed.
- A. Chejara, Gas Hydrates in Porous Media: CO2 Storage and CH4 Production, PhD thesis, University of Bergen, Bergen, Norway, 2014 Search PubMed.
- S. Liu, Modelling CO2 Storage in Saline Aquifers with Reactive Transport Simulator RCB, PhD thesis, University of Bergen: Bergen, Norway, 2011 Search PubMed.
- B. Kvamme, N. Wei, J. Zhao, S. Zhou, L. Zhang, W. Sun and N. Saeidi, Alcohols for Hydrate Inhibition – Different Alcohols and Different Mechanisms, Petroleum, 2022, 8, 1–16, DOI:10.1016/j.petlm.2021.10.007.
- B. Kvamme, Small Alcohols as Hydrate Promoters, Energy Fuels, 2021, 35, 17663–17684, DOI:10.1021/acs.energyfuels.1c02902.
- M. Lauricella, M. R. Ghaani, P. K. Nandi, S. Meloni, B. Kvamme and N. J. English, Double Life of Methanol: Experimental Studies and Nonequilibrium Molecular-Dynamics Simulation of Methanol Effects on Methane-Hydrate Nucleation, J. Phys. Chem. C, 2022, 126, 6075–6081, DOI:10.1021/acs.jpcc.2c00329.
- B. Kvamme and T. Kuznetsova, Hydrate Dissociation in Chemical Potential Gradients: Theory and Simulations, Fluid Phase Equilib., 2004, 217, 217–226, DOI:10.1016/j.fluid.2003.02.002.
- B. Kvamme, S. A. Aromada, N. Saeidi, T. Hustache-Marmou and P. Gjerstad, Hydrate Nucleation, Growth, and Induction, ACS Omega, 2020, 5, 2603–2619, DOI:10.1021/acsomega.9b02865.
- B. Kvamme, Kinetics of Hydrate Formation from Nucleation Theory, Int. J. Offshore Polar Eng., 2002, 12, 256–263 Search PubMed.
- B. Kvamme, Droplets of Dry Ice and Cold Liquid CO2 for Self-Transport of CO2 to Large Depths, Int. J. Offshore Polar Eng., 2003, 13, 139–146 CAS.
- I. Popescu, M. De Batist, G. Lericolais, H. Nouzé, J. Poort, N. Panin, W. Versteeg and H. Gillet, Multiple Bottom-Simulating Reflections in the Black Sea: Potential Proxies of Past Climate Conditions, Mar. Geol., 2006, 227, 163–176, DOI:10.1016/j.margeo.2005.12.006.
- J. Bialas, I. Klaucke,M. Haeckel and S. Maria, Merian Cruise 34, Leg 1&2, SUGAR Site; GEOMAR Report, GEOMAR, Kiel, Germany, 2014 Search PubMed.
- E. Burwicz and M. Haeckel, Basin-Scale Estimates on Petroleum Components Generation in the Western Black Sea Basin Based on 3-D Numerical Modelling, Mar. Pet. Geol., 2020, 113, 104122, DOI:10.1016/j.marpetgeo.2019.104122.
- Turkish Petroleum Corporation (TPAO) A New Discovery of 135 Bcm Gas in the North Sakarya Gas Field in Black Sea 2021, https://www.tpao.gov.tr/file/2201/20210604-tp-amasra-1-discovery-eng-66361e0331ced70c.pdf, accessed: 9/25/2022 Search PubMed.
- Offshore Technology Neptun Deep Gas Field Project, Black Sea, 2020, https://www.offshore-technology.com/projects/neptun-deep-gas-field-project-black-sea/, accessed: 10/13/2022 Search PubMed.
- J. Bialas, T. Bohlen, A. Dannowski, G. Eisenberg-Klein, L. Gassner, R. Gehrmann, K. Heeschen, S. Hölz, M. Jegen and I. Klaucke, et al., Joint Interpretation of Geophysical Field Experiments in the Danube Deep-Sea Fan, Black Sea, Mar. Pet. Geol., 2020, 121, 104551, DOI:10.1016/j.marpetgeo.2020.104551.
- W. B. F. Ryan, W. C. Pitman, C. O. Major, K. Shimkus, V. Moskalenko, G. A. Jones, P. Dimitrov, N. Gorür, M. Sakinç and H. Yüce, An Abrupt Drowning of the Black Sea Shelf, Mar. Geol., 1997, 138, 119–126, DOI:10.1016/S0025-3227(97)00007-8.
- L. Gassner, T. Gerach, T. Hertweck and T. Bohlen, Seismic Characterization of Submarine Gas-Hydrate Deposits in the Western Black Sea by Acoustic Full-Waveform Inversion of Ocean-Bottom Seismic Data, Geophysics, 2019, 84, B311–B324, DOI:10.1190/geo2018-0622.1.
- T. Zander, M. Haeckel, C. Berndt, W.-C. Chi, I. Klaucke, J. Bialas, D. Klaeschen, S. Koch and O. Atgın, On the Origin of Multiple BSRs in the Danube Deep-Sea Fan, Black Sea, Earth Planet. Sci. Lett., 2017, 462, 15–25, DOI:10.1016/j.epsl.2017.01.006.
- A. Vassilev, Optimistic and Pessimistic Model Assessments of the Black Sea Gas Hydrates, C. R. Acad. Bulg. Sci., 2006, 59, 543–550 CAS.
- K. Schwalenberg, R. A. S. Gehrmann, J. Bialas and D. Rippe, Analysis of Marine Controlled Source Electromagnetic Data for the Assessment of Gas Hydrates in the Danube Deep-Sea Fan, Black Sea, Mar. Pet. Geol., 2020, 122, 104650, DOI:10.1016/j.marpetgeo.2020.104650.
- A. Vasilev, Geothermal Evolution of Gas Hydrate Deposits: BEEZ in the Black Sea, C. R. Acad. Bulg. Sci., 2015, 68, 1135–1144 CAS.
- M. Riedel, T. Freudenthal, J. Bialas, C. Papenberg, M. Haeckel, M. Bergenthal, T. Pape and G. Bohrmann, In Situ Borehole Temperature Measurements Confirm Dynamics of the Gas Hydrate Stability Zone at the Upper Danube Deep Sea Fan, Black Sea, Earth Planet. Sci. Lett., 2021, 563, 116869, DOI:10.1016/j.epsl.2021.116869.
- M. Riedel, J. Bialas, H. Villinger, T. Pape, M. Haeckel and G. Bohrmann, Heat Flow Measurements at the Danube Deep-Sea Fan, Western Black Sea, Geosciences, 2021, 11, 240, DOI:10.3390/geosciences11060240.
- Oil & Gas Journal Russian Field Illustrates Gas-Hydrate Production 2005, https://www.ogj.com/drilling-production/production-operations/ior-eor/article/17236287/russian-field-illustrates-gashydrate-production, accessed: 10/13/2022 Search PubMed.
- H. C. Kim, P. R. Bishnoi, R. A. Heidemann and S. S. H. Rizvi, Kinetics of Methane Hydrate Decomposition, Chem. Eng. Sci., 1987, 42, 1645–1653, DOI:10.1016/0009-2509(87)80169-0.
- Norwegian Petroleum Directorate Oil & Gas Production, 2022, https://www.npd.no/en/, accessed: 9/25/2022.
- E. S. Andersen and T. Reichel, Personal Communication on October 15, 2012, Trondheim, 2012 Search PubMed.
- B. Kvamme, Mechanisms for CH4/CO2 Swapping in Natural Sediments, Fluids, 2022, 7, 260, DOI:10.3390/fluids7080260.
- R. Olsen, K. N. Leirvik, B. Kvamme and T. Kuznetsova, Adsorption Properties of Triethylene Glycol on a Hydrated Calcite Surface and Its Effect on Adsorbed Water, Langmuir, 2015, 31, 8606–8617, DOI:10.1021/acs.langmuir.5b02228.
- R. Olsen, B. Kvamme and T. Kuznetsova, Hydrogen Bond Lifetimes and Statistics of Aqueous Mono-, Di- and Tri-Ethylene Glycol, AIChE J., 2017, 63, 1674–1689, DOI:10.1002/aic.15539.
- R. Olsen, B. Kvamme and T. Kuznetsova, Free Energy of Solvation and Henry's Law Solubility Constants for Mono-, Di- and Tri-Ethylene Glycol in Water and Methane, Fluid Phase Equilib., 2016, 418, 152–159, DOI:10.1016/j.fluid.2015.10.019.
- R. Olsen and B. Kvamme, Effects of Glycol on Adsorption Dynamics of Idealized Water Droplets on LTA3A Zeolite Surfaces, AIChE J., 2019, 65, e16567, DOI:10.1002/aic.16567.
- R. Olsen, K. N. Leirvik and B. Kvamme, Adsorption Characteristics of Glycols on Calcite and Hematite, AIChE J., 2019, 65 DOI:10.1002/aic.16728.
- R. Olsen, K. N. Leirvik, B. Kvamme and T. Kuznetsova, Effects of Sodium Chloride on Acidic Nanoscale Pores Between Steel and Cement, J. Phys. Chem. C, 2016, 120, 29264–29271, DOI:10.1021/acs.jpcc.6b10043.
- J. Selvåg, T. Kuznetsova and B. Kvamme, Molecular Dynamics Study of Morpholines at Water – Carbon Dioxide Interfaces, Fluid Phase Equilib., 2019, 485, 44–60, DOI:10.1016/j.fluid.2018.12.004.
- J. Selvåg, Molecular Simulations for Surfactants at Aqueous-Nonpolar Liquid Interfaces, PhD thesis, University of Bergen, Bergen, Norway, 2021 Search PubMed.
- B. Kvamme, Small Alcohols as Surfactants and Hydrate Promotors, Fluids, 2021, 6, 345, DOI:10.3390/fluids6100345.
- N. Saeidi, D. Dunn-Rankin, B. Kvamme and Y.-C. Chien, Experimental Studies on Combined Production of CH4 and Safe Long-Term Storage of CO2 in the Form of Solid Hydrate in Sediment, Phys. Chem. Chem. Phys., 2021, 23, 23313–23324, 10.1039/D1CP03239A.
- A. Svandal, B. Kvamme, L. Granasy and T. Pusztai, The Influence of Diffusion on Hydrate Growth, in Proceedings of the Proceedings of the 1st International Conference on Diffusion in Solids and Liquids, Aveiro, Portugal, July 6 2005 Search PubMed.
- MIT Snohvit Fact Sheet: Carbon Dioxide Capture and Storage Project 2010, https://sequestration.mit.edu/tools/projects/snohvit.html, accessed: 10/13/2022 Search PubMed.
- ZeroCO2 Snøhvit 2008, http://www.zeroco2.no/projects/snoehvit, accessed: 10/13/2022 Search PubMed.
- J.-Q. Shi, C. Imrie, C. Sinayuc, S. Durucan, A. Korre and O. Eiken, Snøhvit CO2 Storage Project: Assessment of CO2 Injection Performance Through History Matching of the Injection Well Pressure Over a 32-Months Period, Energy Procedia, 2013, 37, 3267–3274, DOI:10.1016/j.egypro.2013.06.214.
- O. Hansen, D. Gilding, B. Nazarian, B. Osdal, P. Ringrose, J.-B. Kristoffersen, O. Eiken and H. Hansen, Snøhvit: The History of Injecting and Storing 1 Mt CO2 in the Fluvial Tubåen Fm, Energy Procedia, 2013, 37, 3565–3573, DOI:10.1016/j.egypro.2013.06.249.
- B. Kvamme, Thermodynamic Properties and Dielectric Constants in Water/Methanol Mixtures by Integral Equation Theory and Molecular Dynamics Simulations, Phys. Chem. Chem. Phys., 2002, 4, 942–948, 10.1039/b108724j.
- B. Kvamme and A. Vasilev, Black Sea gas hydrates: safe long terms storage of CO2 with environmentally friendly energy production, Sustainable Energy Fuels, 2023, 7, 1466–1493 RSC.
- B. Kvamme and A. Vasilev, Thermodynamic Feasibility of the Black Sea CH4 hydrate replacement by CO2 hydrate, Energies, 2023, 16(3), 1223 CrossRef CAS.
- B. Kvamme and A. Vasilev, Danube Fan and Nyegga – the largest contrast European gas hydrate deposits for CO2 storing and CH4 and H2 production, Int. J. Greenhouse Gas Control, 2023 Search PubMed , submitted.
- K. Baig, B. kvamme, T. Kuznetsova and B. Jordan, The impact of water/hydrate film thickness on the kinetic rate of mixed hydrate formation during CO2 injection into CH4 hydrate, AIChE J., 2015, 61(11), 3944–3957 CrossRef CAS.
- B. Li, Y. Ye, T. Zhang and Q. Wan, Numerical Investigation into the Gas Production from Hydrate Deposit under Various Thermal Stimulation Modes in a Multi-Well System in Qilian Mountain, Entropy, 2021, 23, 800 CrossRef CAS PubMed.
- D.-Y. Koh, H. Kang, J.-W. Lee, Y. Park, S.-J. Kim, J. Lee, J. Y. Lee and H. Lee, Energy-Efficient Natural Gas Hydrate Production Using Gas Exchange, Appl. Energy, 2016, 162, 114–130, DOI:10.1016/j.apenergy.2015.10.082.
- R. Anderson, M. Llamedo, B. Tohidi and R. W. Burgass, Characteristics of Clathrate Hydrate Equilibria in Mesopores and Interpretation of Experimental Data, J. Phys. Chem. B, 2003, 107, 3500–3506, DOI:10.1021/jp0263368.
- J.-M. Herri, A. Bouchemoua, M. Kwaterski, A. Fezoua, Y. Ouabbas and A. Cameirao, Gas Hydrate Equilibria for CO2–N2 and CO2–CH4 Gas Mixtures—Experimental Studies and Thermodynamic Modelling, Fluid Phase Equilib., 2011, 301, 171–190, DOI:10.1016/j.fluid.2010.09.041.
- S. Takenouchi and G. C. Kennedy, Dissociation Pressures of the Phase CO2 5 3/4 H2O, J. Geol., 1965, 73, 383–390, DOI:10.1086/627068.
- K. Ohgaki, Y. Makihara and K. Takano, Formation of CO2 Hydrate in Pure and Sea Waters, J. Chem. Eng. Jpn., 1993, 26, 558–564, DOI:10.1252/jcej.26.558.
- S.-S. Fan and T.-M. Guo, Hydrate Formation of CO2 -Rich Binary and Quaternary Gas Mixtures in Aqueous Sodium Chloride Solutions, J. Chem. Eng. Data, 1999, 44, 829–832, DOI:10.1021/je990011b.
| This journal is © The Royal Society of Chemistry 2023 |

