 Open Access Article
Creative Commons Attribution 3.0 Unported Licence
Combined ICP-OES and XPS analysis to evaluate the [AlO4]0 concentration in quartz: limiting the formation temperature of quartz
Mengmeng Shen a,
Mulin Huangb,
Zhiyun Luc and
Xuemei He*a
aSchool of Gemmology, China University of Geosciences, Beijing, 100083, China. E-mail: hexuemei3127@126.com
bNational Gems and Jewelry Technology Administrative Center, Beijing, 100013, China
cSchool of Earth Sciences, Zhejiang University, Hangzhou, 310027, China
First published on 25th August 2023
Abstract
A proposed quartz thermometer is based on the concentration of [AlO4]0 tetrahedra determined by combining inductively coupled plasma optical emission spectrometry (ICP-OES) with X-ray photoelectron spectroscopy (XPS) data. The concentration of [AlO4]0 tetrahedra in the quartz lattice (C[AlO4]0/ppm) and the formation temperatures of quartz (TQ/°C) from agate, gold deposits, and granodiorite are calculated by C[AlO4]0 = CAl total (ppm) × k and TQ (°C) = 3.6 × CAl total (ppm) × k + 33.0, respectively. Where CAl total is the total Al concentration of quartz measured by ICP-OES and k is the relative percentage of [AlO4]0 tetrahedra in the quartz lattice and can be obtained by fitting the Al(2p) XPS spectrum. The obtained formation temperatures of quartz (TQ) agree well with the equilibrium formation temperature (TE) calculated by oxygen isotope data. By comparing the relative positions of the two temperature curves of quartz (TQ and TE), the composition of the mineral-forming fluid can be inferred. The proposed quartz thermometer can be applied to quartz formed under equilibrium conditions and in Al-saturated environments over a wide temperature range (152–566 °C). The use of the quartz thermometer effectively eliminates interference from different fluid compositions and satisfies the requirements of convenience and economy.
1. Introduction
As the second most abundant mineral in the Earth's continental crust, quartz is widely found in sedimentary, metamorphic, and igneous environments.1–9 Due to limitations in charge and ionic radius, only a small number of ions can replace Si4+ in the quartz lattice.10 The [AlO4]0 center is caused by the substitution of Al3+ for Si4+ and the formation of O1− by replacing Si4+ with an electron hole at one of the four closest O2− ions.11–20 The [AlO4]0 center consists of a hole trapped in a non-bonding orbital of an O ion located adjacent to the substitutional Al.21 The precursor state of this center is the diamagnetic [AlO4/M+]0 associated with the adjacent charge-compensated cations M+ (H+, Li+, Na+).21 During γ-irradiation of quartz at 295 K, the M+ ions may diffuse away to produce paramagnetic [AlO4]0. In the more open spaces in the structure or by micro-inclusions of Al-bearing phase, Al3+ exists outside the silica-oxygen skeleton as [AlO6]0 octahedra (six-coordination), playing a role similar to that of general cations such as Mg2+ and Fe2+.22,23 The formation temperature of quartz can be estimated by various techniques such as oxygen isotope data, micro-thermometry of fluid inclusions, and the titanium-in-quartz geothermometer.17,24–33 Perry (1963) observed that the Al content in quartz from contact-metamorphosed quartz-aluminum silicate rocks decreased regularly with increasing distance from the intrusion, suggesting that the Al solubility in quartz may be temperature-dependent.34 The result of chemical equilibrium simulations show that factors such as pressure, growth rate, and fluid composition have no significant effect on the Al content in quartz.35 The Al content in quartz is mainly controlled by temperature, so the Al-in-quartz thermometer mainly considers temperature.36 Dennen et al. (1970) found that under Al-saturated and equilibrium crystallization conditions, the Al content in quartz varies with crystallization temperature over a wide range of temperatures (80–900 °C).35 The formation temperature (TQP/°C) of both natural and synthetic quartz crystals changed with their total Al concentrations (CAl total/ppm), as described by the equation of:| TQP(°C) = 3.6 × CAl total (ppm) + 33.0 | (1) |
The equation above yields a considerably high estimate for the crystallization temperature. This may be because the total Al content (CAl total/ppm) not only include the [AlO4]0 tetrahedra in the quartz structure but also [AlO6]0 octahedra in the more open spaces in the structure or by micro-inclusions of Al-bearing phases.37–39 Apparently, it is controversial to calculate the formation temperature of quartz (TQP) directly using the total Al concentration obtained by bulk analytical methods. To effectively avoid the influence of the [AlO6]0 octahedra, the concentration of [AlO4]0 tetrahedra in the quartz lattice can be directly quantified through electron paramagnetic resonance (EPR).40 However, prior to conducting EPR testing, quartz must undergo a complex heat treatment and irradiation process to convert the diamagnetic [AlO4/M+]0 to the paramagnetic [AlO4]0, enabling their detection through EPR.
In this study, an alternative method for distinguishing between [AlO4]0 tetrahedra in the quartz lattice and [AlO6]0 octahedra in the more open spaces in the structure or by micro-inclusions of Al-bearing phases is the XPS analysis of quartz. Unlike EPR testing, XPS analysis does not require complex pre-processing to exclude the effects of impurity inclusions in quartz. The relative percentage of [AlO4]0 tetrahedral (k) in the quartz lattice is determined by fitting the Al(2p) XPS spectrum.41–46 The concentration of [AlO4]0 tetrahedra (C[AlO4]0/ppm) in the quartz lattice is obtained by multiplying the total Al concentration of quartz (CAl total/ppm) obtained through ICP-OES by the relative percentage of [AlO4]0 tetrahedra (k) from XPS analysis. In this research, fragments containing quartz with varying geological backgrounds and formation temperatures were selected to evaluate the feasibility of the quartz thermometer. The formation temperature of quartz (TQ) was determined by analyzing the concentration of [AlO4]0 tetrahedra in the quartz lattice by a combination of ICP-OES and XPS techniques. The calculated results (TQ) were then compared to the equilibrium formation temperatures (TE) obtained by analyzing the oxygen isotopic compositions of the same samples. This quartz thermometer is easy to operate, reduces costs, and eliminates interference from the composition of the mineralizing fluid.
2. Materials and methods
The analyzed material includes quartz-bearing fragments from eight occurrences across China, as shown in Fig. 1 and Table 1. The origins of these fragments are epithermal, hydrothermal, and magmatic. Their formation temperatures span low, medium, and high ranges (Table 1). Agate BS-1 and HH-1 originate from primary and secondary agate deposits, respectively, with formation temperatures below 220 °C.47,48 The gold-bearing quartz veins are obtained from various types of gold deposits, including orogenic gold, epithermal gold, and porphyry copper polymetallic deposits.49 Furthermore, granodiorites containing quartz exhibiting a broad temperature range between 250 and 733 °C have also been selected.50 The quartz-bearing fragments were carefully crushed before individual quartz pieces are hand-picked under a binocular microscope. These pieces were then ground into 300 mesh powders. The purity of quartz powder reaches more than 95%. To address the limitation of the micro-area analysis, quartz powders were selected for ICP-OES, XPS, and oxygen isotope tests, respectively.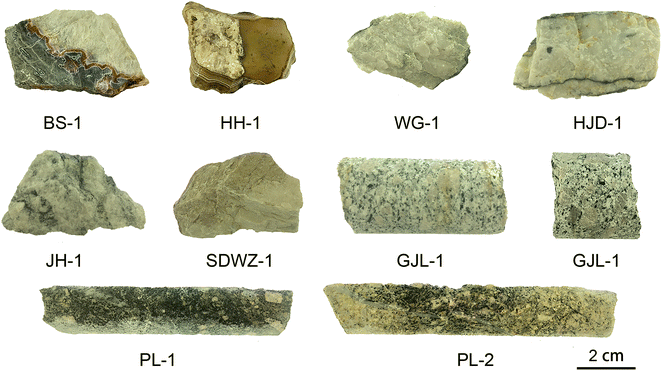 | ||
| Fig. 1 Quartz bearing fragments selected from sediments of hydrothermal agate, gold bearing quartz vein, and granodiorite in China. | ||
| No. | Description | Genetic type | Occurrence | Temperature (°C) |
|---|---|---|---|---|
| BS-1 | Primary agate | Epithermal | Baoshan, Yunnan | 87–152 |
| HH-1 | Secondary agate | Epithermal | Xunke, Heilongjiang | 203–220 |
| WG-1 | Gold bearing quartz vein | Hydrothermal | Wangu gold deposit, Hunan | 225–385 |
| HJD-1 | Gold bearing quartz vein | Hydrothermal | Huangjindong gold deposit, Hunan | 160–397 |
| JH-1 | Gold bearing quartz vein | Hydrothermal | Jinhong gold deposit, Hunan | 258–397 |
| SDWZ-1 | Gold bearing quartz vein | Epithermal | Sandaowanzi gold deposit, Heilongjiang | 160–385 |
| PL-1 | Gold bearing quartz vein | Hydrothermal | Pulang copper–gold deposit, Yunnan | 115–450 |
| PL-2 | Gold bearing quartz vein | Hydrothermal | Pulang copper-gold deposit, Yunnan | 115–450 |
| GJL-1 | Granodiorite | Magmatic | Guojialing, Shandong | 250–733 |
| GJL-2 | Granodiorite | Magmatic | Guojialing, Shandong | 250–733 |
The total Al content of the quartz powder was detected by ICP-OES (JY Ultima2C). A mixture of 100 mg of quartz powder and 400 mg of anhydrous lithium metaborate was melted in a muffle furnace at 1000 °C for 15 minutes. The cooled silica mixture was added to 50 ml of 5% aqua regia solution at 80 °C. After the silica mixture was completely dissolved and cooled, the volume was adjusted to 100 ml with 5% aqua regia solution. The solution was left for 24 hours, and then analyzed by ICP-OES. The ICP-OES parameters were as follows: forward power of 1200 W, plasma gas flow rate of 14.0 L min−1, nebulizer gas flow rate of 1.0 L min−1, sample uptake speed of 1.0 ml min−1, the integration time of 10–15 s at low and high wavelength ranges. A concentric nebulizer was used with a cyclonic spray chamber. The analytical wavelength for the Al element was 396.152 nm. The measurement was controlled by ICP jy5.1 software. The relative error of the results is less than 3%.
The Al(2p) spectra of the quartz powders were obtained by a Thermo Scientific ESCALAB 250 Xi+ spectrometer. The C(1s) peak (284.6 eV) was used to calibrate the position of the binding energy. The data was processed by using the CaseXPS software, Shirley background, Gaussian![[thin space (1/6-em)]](https://www.rsc.org/images/entities/char_2009.gif) :
:![[thin space (1/6-em)]](https://www.rsc.org/images/entities/char_2009.gif) Lorentz function = 60
Lorentz function = 60![[thin space (1/6-em)]](https://www.rsc.org/images/entities/char_2009.gif) :
:![[thin space (1/6-em)]](https://www.rsc.org/images/entities/char_2009.gif) 40 to fit the XPS data. The test error is ±0.1%, and the relative error of Al(2p) peak fitting is less than ±1.0%.
40 to fit the XPS data. The test error is ±0.1%, and the relative error of Al(2p) peak fitting is less than ±1.0%.
The oxygen isotope of quartz powders was analyzed by a 253plus gas isotope ratio mass spectrometer at Nanjing Hongchuang Geological Exploration Technology Service Co., Ltd. The quartz powders were placed on a nickel sample holder and heated with a 20 W CO2 laser. BrF5 was used as the fluorinating agent. The released oxygen was converted to CO2 and then admitted online to the mass spectrometer. The accuracy of the method is ±0.2‰, and the relative error of the temperature calculated by the error transfer formula is ±4.0%.
3. Results and discussion
3.1 ICP-OES data
The total Al contents of the quartz powders (CAl total) are determined by ICP-OES and shown in Table 2. Quartz pieces from agate deposits exhibit a low total Al content, ranging from 182–643 ppm. In contrast, the total Al contents of quartz pieces from gold deposits are more variable, ranging from 559 to 5070 ppm. Notably, the total Al content of quartz pieces in granodiorite deposits can be as high as 8660 ppm, and it is significantly greater than that of quartz from other deposits. The total Al concentration of quartz (CAl total) obtained by ICP-OES represents the total concentration of [AlO4]0 tetrahedra in the quartz lattice and [AlO6]0 octahedra in the impurity inclusions. Therefore, direct measurement of the concentration of [AlO4]0 tetrahedra (C[AlO4]0/ppm) in the quartz lattice by ICP-OES is not feasible.| No. | δ18OSMOW (‰) | Tmet (°C) | Toc (°C) | Tmag (°C) | CAl total (ppm) | k (%) | C[AlO4]0 (ppm) | TQ (°C) |
|---|---|---|---|---|---|---|---|---|
| BS-1 | 17.0 | 59 | 132 | 248 | 182 | 18.2 | 33 | 152 |
| HH-1 | 13.8 | 78 | 169 | 332 | 643 | 7.3 | 47 | 202 |
| WG-1 | 18.3 | 52 | 120 | 222 | 559 | 10.9 | 61 | 253 |
| HJD-1 | 16.9 | 59 | 133 | 250 | 885 | 6.7 | 59 | 245 |
| JH-1 | 15.8 | 66 | 145 | 275 | 1100 | 6.4 | 70 | 285 |
| SDWZ-1 | −2.8 | 291 | 2286 | −395 | 4770 | 1.7 | 81 | 325 |
| PL-1 | 12.7 | 85 | 184 | 373 | 5070 | 1.8 | 91 | 361 |
| PL-2 | 11.7 | 92 | 199 | 417 | 4900 | 2.3 | 113 | 440 |
| GJL-1 | 9.8 | 107 | 232 | 535 | 8660 | 1.7 | 147 | 562 |
| GJL-2 | 9.5 | 110 | 237 | 560 | 8230 | 1.8 | 148 | 566 |
3.2 XPS data
The Al(2p) spectra of our specimens were fitted using Gaussian–Lorentzian (GL) = 60![[thin space (1/6-em)]](https://www.rsc.org/images/entities/char_2009.gif) :
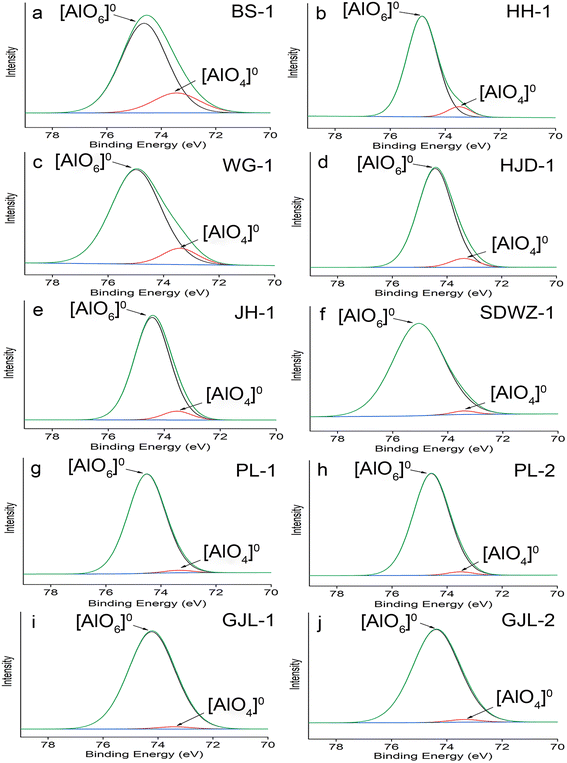
:![[thin space (1/6-em)]](https://www.rsc.org/images/entities/char_2009.gif) 40. The results of XPS and peak fitting are given in Fig. 2 and Table 3. In the region of Al(2p), the Al3+ binding energy values range from 73.4 to 74.2 eV in tetrahedral coordination and from 74.1 to 74.9 eV in octahedral coordination.51 The deconvolution of the Al(2p) spectrum in our work produced two components (73.3–73.5 and 74.2–75.0 eV), which accords well with the results of previous studies, so the binding energies at 73.3–73.5 and 74.2–75.0 eV are caused by the [AlO4]0 tetrahedra in four-coordination and [AlO6]0 octahedra in six-coordination, respectively.11,22,23
40. The results of XPS and peak fitting are given in Fig. 2 and Table 3. In the region of Al(2p), the Al3+ binding energy values range from 73.4 to 74.2 eV in tetrahedral coordination and from 74.1 to 74.9 eV in octahedral coordination.51 The deconvolution of the Al(2p) spectrum in our work produced two components (73.3–73.5 and 74.2–75.0 eV), which accords well with the results of previous studies, so the binding energies at 73.3–73.5 and 74.2–75.0 eV are caused by the [AlO4]0 tetrahedra in four-coordination and [AlO6]0 octahedra in six-coordination, respectively.11,22,23
| No. | Peak | Position (eV) | FWHM (eV) | % area | No. | Peak | Position (eV) | FWHM (eV) | % area |
|---|---|---|---|---|---|---|---|---|---|
| BS-1 | 1 | 73.4 | 2.0 | 18.2 | SDWZ-1 | 1 | 73.4 | 1.0 | 1.7 |
| 2 | 74.6 | 2.0 | 81.8 | 2 | 75.0 | 2.2 | 98.3 | ||
| HH-1 | 1 | 73.5 | 1.0 | 7.3 | PL-1 | 1 | 73.3 | 1.2 | 1.8 |
| 2 | 74.8 | 1.3 | 92.7 | 2 | 74.5 | 1.6 | 98.2 | ||
| WG-1 | 1 | 73.4 | 1.5 | 10.9 | PL-2 | 1 | 73.5 | 1.1 | 2.3 |
| 2 | 75.0 | 2.1 | 89.1 | 2 | 74.6 | 1.6 | 97.7 | ||
| HJD-1 | 1 | 73.4 | 1.2 | 6.7 | GJL-1 | 1 | 73.4 | 1.5 | 1.7 |
| 2 | 74.4 | 1.5 | 93.3 | 2 | 74.2 | 2.0 | 98.3 | ||
| JH-1 | 1 | 73.5 | 1.2 | 6.4 | GJL-2 | 1 | 73.4 | 1.3 | 1.8 |
| 2 | 74.4 | 1.5 | 93.6 | 2 | 74.4 | 2.0 | 98.2 |
The fitting analysis of Al(2p) spectra reveals that Al in quartz from various geological backgrounds mainly existed as [AlO6]0 octahedra (Fig. 2 and Table 3). The [AlO6]0 octahedra in quartz are most likely attributed to its Al-containing impurity inclusions, suggesting the existence of many impurity fluids or solid inclusions in the quartz.11,22,23 To exclude the influence of impurity inclusions on the quartz thermometer, the relative proportions of [AlO4]0 tetrahedra (k) are calculated from the fitted peak areas of [AlO4]0 tetrahedra and [AlO6]0 octahedra (Table 3). The calculated k values range from 1.7% to 18.2%.
3.3 Oxygen isotope data
The δ18O values of quartz shown in Table 2 range from –2.8‰ to +18.3‰. Based on the quartz–water curve proposed by Matsuhisa et al. (1979), the equilibrium formation temperatures of quartz (TE) were measured by the oxygen isotope ratios (Table 2).52–54 The temperatures (TE) were calculated according to the following equation:
δ18O = 1000![[thin space (1/6-em)]](https://www.rsc.org/images/entities/char_2009.gif) ln ln![[thin space (1/6-em)]](https://www.rsc.org/images/entities/char_2009.gif) αQW = 3.34 × 10⁶T−2 − 3.31 αQW = 3.34 × 10⁶T−2 − 3.31
| (2) |
Based on published data, it is inferred that the mineral-forming fluids of quartz from two agate deposits were influenced by low-temperature hydrothermal fluid and meteoric water.56 Therefore, their formation temperatures are calculated to be 132 °C and 169 °C, respectively. However, the calculations of epithermal quartz vein SDWZ-1 for pure magmatic water led to isotope equilibration temperatures below 0 °C, so it seems to be unlikely (Table 2). Therefore, the meteoric water plays a dominant role during its formation, and an isotopic equilibrium temperature of 291 °C is selected as its formation temperature.50 The δ18O values of quartz from other gold and granodiorite deposits are much closer to those of quartz precipitated from magmatic fluids (Table 2). As a result, their formation temperature ranges are determined to be 222 °C to 417 °C and 535 °C to 560 °C, respectively. Consequently, the isotope compositions yield the calculated fractionation temperatures (TE) ranging from 132 °C and 560 °C.
3.4 Application of quartz thermometer
The results in Table 2 show that the total Al concentration in quartz (determined by ICP-OES) is greater than the concentration of [AlO4]0. This indicates the presence of Al-containing inclusions leading to the conclusion that the medium was saturated with respect to Al.37 The quartz is crystallized from the fluid under near-equilibrium conditions. Thus, the prerequisites for the application of quartz thermometers exist.37 The concentration of [AlO4]0 in quartz was derived by combining the data from ICP-OES and XPS. The calculated k is multiplied by the total Al concentration of quartz (CAl total) measured by ICP-OES to obtain the [AlO4]0 concentration in the quartz lattice (C[AlO4]0/ppm). The concentration of [AlO4]0 tetrahedra (C[AlO4]0/ppm) in the quartz lattice can be determined by the following equation:| C[AlO4]0 = CAl total (ppm) × k | (3) |
From agate to gold, and then to granodiorite deposits, the [AlO4]0 concentration in the quartz lattice (C[AlO4]0/ppm) increases from 33 ppm to 148 ppm. Combined with the research of Dennen et al. (1970),35 the formation temperature of quartz (TQ/°C) can be calculated from the following quartz temperature equation:
| TQ(°C) = 3.6 × CAl total (ppm) × k + 33.0 | (4) |
The results are kept as integers. According to the error transfer equation, the relative error of the quartz thermometer is less than ±11% (Fig. 3). The calculated temperatures of quartz (TQ) are broadly distributed between 152 °C and 566 °C (Table 2). The formation temperatures of quartz from agate deposits are 152 and 202 °C, respectively. It is indicated that quartz pieces from these two agate deposits were formed under a low-temperature environment. Furthermore, quartz veins from gold deposits crystallize in the medium to high temperature range of 245 °C to 440 °C. The formation temperature of quartz in granodiorite is as high as 566 °C.
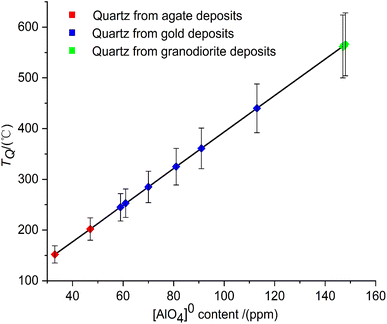 | ||
| Fig. 3 The formation temperatures of quartz calculated by the quartz thermometer with a relative error of less than ±11%. | ||
3.5 Reliability and advantages of quartz thermometer
The formation temperatures of quartz (TQ) calculated by the quartz thermometer are compared to the temperature ranges of quartz observed in previously published studies (Fig. 4). It is indicated that the TQ values calculated by the quartz thermometer fall within the temperature ranges reported in previous studies. The temperature curves of quartz (TQ and TE) calculated by the quartz thermometer and oxygen isotope data are shown in Fig. 4. The temperatures (TQ) calculated by the quartz thermometer are in good agreement with those (TE) obtained by oxygen isotope fractionation.26 In summary, the results demonstrate the reliability and applicability of the quartz thermometer for quartz of various origins and temperatures.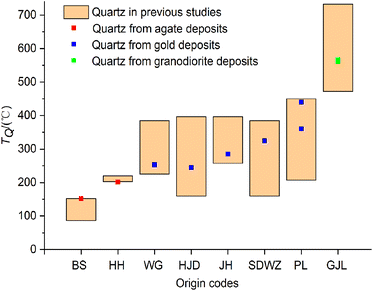 | ||
| Fig. 4 Comparison of the formation temperatures of quartz according to the quartz thermometer and published data, respectively. | ||
The formation temperatures of quartz (TQ) in agate deposits determined by the quartz thermometer are plotted between the temperature curves in equilibrium with meteoric water and magmatic water (Fig. 5). This confirms the assumption that their mineral-forming fluids may be a mixture of meteoric and magmatic origin. According to the quartz thermometer, the formation temperature of epithermal quartz vein SDWZ-1 is closest to the temperature in equilibrium with meteoric water. It reveals that its mineral-forming fluid is dominated by meteoric water. The formation temperatures of quartz in other gold and granodiorite deposits calculated by the quartz thermometer are all located near the temperature curve in equilibrium with magmatic water. This provides further evidence of their magmatic origin. By comparing the relative positions of the two temperature curves (TQ and TE), the composition of quartz mineral-forming fluids can be inferred. This provides valuable information for understanding the formation process of quartz and the origin of mineral-forming fluids.
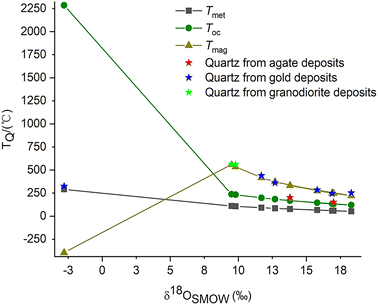 | ||
| Fig. 5 Comparison of the formation temperatures of quartz calculated from the quartz thermometer and oxygen isotope data. | ||
The oxygen isotope analysis is commonly used to constrain the crystallization temperature of quartz in natural geological systems. When calculating the formation temperature of quartz (TE) from oxygen isotope data, it is crucial to deduce the composition of its mineral-forming fluids by analyzing its hydrogen isotope. The corresponding equilibrium temperature is then selected as its formation temperature. Alternatively, the process of fluid mixing, such as the mixing of meteoric water with late magmatic fluids, must be taken into account. However, the quartz thermometer can determine the formation temperature of quartz (TQ) without considering the composition of its mineral-forming fluids. This simplifies the process and reduces costs. Moreover, the quartz thermometer appears to be a more accurate and economical solution for quartz with mixed compositions of mineral-forming fluids.
4. Conclusions
In summary, the quartz thermometer combining ICP-OES and XPS demonstrates extensive applicability and serves as a powerful tool for investigating the formation temperature of quartz. It effectively eliminates the interference caused by microscopic inclusions in quartz and breaks the application limitations of the Al-in-quartz thermometer. Compared to other methods used for calculating quartz temperature, the quartz thermometer does not require complex pretreatment procedures and can provide a more accurate estimate of quartz formation temperature. Furthermore, by analyzing the relative positions of temperature profiles based on the quartz thermometer and oxygen isotope equilibrium, it is possible to infer the composition of quartz-forming fluids. This provides valuable information for studying the genesis of quartz.Author contributions
Mengmeng Shen: conceptualized; conducted experimental work and data analysis; drafted original manuscript. Mulin huang: edited the manuscript. Zhiyun Lu: conceptualized; edited the manuscript. Xuemei He: supervised the project, characterized properties of materials.Conflicts of interest
There are no conflicts to declare.Acknowledgements
The work was funded by the “Beihong Agate” project from the China National Standardizing Committee (Grant No. 20161367-T-334). Special appreciation to Associate Professor Liang Zhang for providing us with some samples.References
- X. Niu, D. Yan, X. Zhuang, Z. Liu, B. Li, X. Wei, H. Xu and D. Li, Mar. Pet. Geol., 2018, 96, 271–287 CrossRef.
- Y. Wang, K. F. Qiu, A. Muller, Z. L. Hou, Z. H. Zhu and H. C. Yu, J. Geophys. Res.: Solid Earth, 2021, 126, 11 Search PubMed.
- O. Flörke, B. Köhler-Herbertz, K. Langer and I. Tönges, Contrib. Mineral. Petrol., 1982, 80, 324–333 CrossRef.
- J. Götze, M. Plötze, T. Graupner, D. K. Hallbauer and C. J. Bray, Geochim. Cosmochim. Acta, 2004, 68, 3741–3759 CrossRef.
- J. Götze, Mineral. Mag., 2009, 73, 645–671 CrossRef.
- J. Götze and R. Lewis, Chem. Geol., 1994, 114, 43–57 CrossRef.
- W. H. Dennen, Geol. Soc. Am. Bull., 1964, 75, 241–246 CrossRef CAS.
- W. Dennen, Geol. Soc. Am. Bull., 1967, 78, 125–130 CrossRef CAS.
- J. Goetze and M. Ploetze, Eur. J. Mineral., 1997, 529–538 CrossRef.
- J. Gotze, Microsc. Microanal., 2012, 18, 1270–1284 CrossRef PubMed.
- T. Gotte, T. Pettke, K. Ramseyer, M. Koch-Muller and J. Mullis, Am. Mineral., 2011, 96, 802–813 CrossRef.
- Q. Lan, J. Lin, S. Fu and J. Luo, J. Geochem. Explor., 2021, 224, 106740 CrossRef CAS.
- M. Lin, Z. Y. Pei, Y. B. Li, Y. Y. Liu, Z. L. Wei and S. M. Lei, Miner. Eng., 2018, 125, 42–49 CrossRef CAS.
- W. Dennen, Geochim. Cosmochim. Acta, 1966, 30, 1235–1241 CrossRef CAS.
- J. Götze, M. Tichomirowa, H. Fuchs, J. Pilot and Z. Sharp, Chem. Geol., 2001, 175, 523–541 CrossRef.
- R. Ruffini, A. Borghi, R. Cossio, F. Olmi and G. Vaggelli, Microchim. Acta, 2002, 139, 151–158 CrossRef CAS.
- R. B. Larsen, I. Henderson, P. M. Ihlen and F. Jacamon, Contrib. Mineral. Petrol., 2004, 147, 615–628 CrossRef CAS.
- A. Van den Kerkhof, A. Kronz, K. Simon, A. Riganti and T. Scherer, S. Afr. J. Geol., 2004, 107, 559–576 CrossRef CAS.
- B. G. Rusk, M. H. Reed, J. H. Dilles and A. J. Kent, Am. Mineral., 2006, 91, 1300–1312 CrossRef CAS.
- K. Breiter and A. Muller, Eur. J. Mineral., 2009, 21, 335–346 CrossRef CAS.
- J. Gotze, Y. Pan and A. Muller, Mineral. Mag., 2021, 85, 639–664 CrossRef.
- J. Gotze, M. Plotze and D. Habermann, Mineral. Petrol., 2001, 71, 225–250 CrossRef CAS.
- J. Götze, M. Plötze, H. Fuchs and D. Habermann, Mineral. Mag., 1999, 63, 149–163 CrossRef.
- B. G. Rusk, H. A. Lowers and M. H. Reed, Geology, 2008, 36, 547–550 CrossRef CAS.
- B. Flem, R. B. Larsen, A. Grimstvedt and J. Mansfeld, Chem. Geol., 2002, 182, 237–247 CrossRef CAS.
- J. Gotze, R. Mockel, U. Kempe, I. Kapitonov and T. Vennemann, Mineral. Mag., 2009, 73, 673–690 CrossRef.
- A. Commin-Fischer, G. Berger, M. Polve, M. Dubois, P. Sardini, D. Beaufort and M. Formoso, J. South Am. Earth Sci., 2010, 29, 751–760 CrossRef CAS.
- D. Wark, W. Hildreth, F. Spear, D. Cherniak and E. Watson, Geology, 2007, 35, 235–238 CrossRef CAS.
- R. Wiebe, D. Wark and D. Hawkins, Contrib. Mineral. Petrol., 2007, 154, 439–453 CrossRef CAS.
- G. A. Gualda, D. M. Gravley, M. Connor, B. Hollmann, A. S. Pamukcu, F. Bégué, M. S. Ghiorso and C. D. Deering, Sci. Adv., 2018, 4, eaap7567 CrossRef CAS PubMed.
- C. Harris, Am. Mineral., 1989, 74, 476–481 CAS.
- C. Zhang, X. Li, R. R. Almeev, I. Horn, H. Behrens and F. Holtz, Earth Planet. Sci. Lett., 2020, 538, 116213 CrossRef CAS.
- O. Flörke, Krist. Tech., 1972, 7, 159–166 CrossRef.
- E. C. Perry, Aluminum substitution in quartz, a study in geothermometry, Massachusetts Institute of Technology, 1963 Search PubMed.
- W. H. Dennen, W. H. Blackburn and A. Quesada, Contrib. Mineral. Petrol., 1970, 27, 332–342 CrossRef CAS.
- G. Juve, R. B. Larsen and M. Polve, Transport and deposition of SiO2 with H2O under supercritical conditions, Norges Geologiske Undersokelse, 2000 Search PubMed.
- J. Gotze, M. Plotze, M. Tichomirowa, H. Fuchs and J. Pilot, Mineral. Mag., 2001, 65, 407–413 CrossRef CAS.
- D. M. Scotford, Am. Mineral., 1975, 60, 139–142 CAS.
- A. Agel and I. Petrov, Eur. J. Mineral., 1990, 2, 144 Search PubMed.
- T. Sun, J. Chen, R. Viswanadham and J. Green, J. Vac. Sci. Technol., 1979, 16, 668–671 CrossRef CAS.
- L. V. Duong, B. J. Wood and J. T. Kloprogge, Mater. Lett., 2005, 59, 1932–1936 CrossRef CAS.
- Q. Huang, J. Liu, X. He, T. Liu and A. Lu, J. Non-Cryst. Solids, 2021, 555, 120531 CrossRef CAS.
- T. Barr, J. Chem. Soc., Faraday Trans., 1997, 93, 181–186 RSC.
- A. Gonzalez-Elipe, J. Espinos, G. Munuera, J. Sanz and J. Serratosa, J. Phys. Chem., 1988, 92, 3471–3476 CrossRef CAS.
- W. Reichle, S. Kang and D. Everhardt, J. Catal., 1986, 101, 352–359 CrossRef CAS.
- T. Deng, D. Xu, G. Chi, Z. Wang, Q. Jiao, J. Ning, G. Dong and F. Zou, Ore Geol. Rev., 2017, 88, 619–637 CrossRef.
- S.-C. Sun, L. Zhang, R.-H. Li, T. Wen, H. Xu, J.-Y. Wang, Z.-Q. Li, F. Zhang, X.-J. Zhang and H. Guo, Minerals, 2019, 9, 133 CrossRef CAS.
- B. Liu and J. Lu, Geotecton. et Metallog., 2006, 30, 481–485 CAS.
- G. Hirth and J. Tullis, J. Struct. Geol., 1992, 14, 145–159 CrossRef.
- J. Chastain and R. C. King Jr, Perkin-Elmer Corp., 1992, 40, 221 Search PubMed.
- T. Moxon and G. Palyanova, Minerals, 2020, 10, 953 CrossRef CAS.
- J. Götze, R. Möckel and Y. Pan, Minerals, 2020, 10, 1037 CrossRef.
- J. Götze, R. Möckel, T. Vennemann and A. Müller, Chem. Geol., 2016, 428, 77–91 CrossRef.
- M. Shen, Z. Lu and X. He, ACS Omega, 2022, 7, 23858–23864 CrossRef CAS PubMed.
- A. Fallick, J. Jocelyn, T. Donnelly, M. Guy and C. Behan, Nature, 1985, 313, 672–674 CrossRef CAS.
- J. Mao, G. Xie, C. Duan, F. Pirajno, D. Ishiyama and Y. Chen, Ore Geol. Rev., 2011, 43, 294–314 CrossRef.
| This journal is © The Royal Society of Chemistry 2023 |

