DOI:
10.1039/D3RA03579D
(Paper)
RSC Adv., 2023,
13, 22029-22042
Synthesis of CeO2/ZrO2/ZnO nano alloy oxide and investigation of photocatalysis of naphthol orange under sunlight
Received
28th May 2023
, Accepted 8th July 2023
First published on 21st July 2023
Abstract
Novel metal-like cerium- and zirconium-doped ZnO photocatalysts were prepared herein with various proportions of molar ratios via a cost-effective co-precipitation method. The effects of novel metal doping on the photocatalytic activity of ZnO were studied. Various techniques were used to investigate the structural, morphological, and elemental composition, particle size, optical properties, and catalytic activity of the synthesized photocatalysts. It was found that the crystallite size and particle size of the nano alloy oxides were 15.12 ± 1 and 5 ± 1 nm, respectively, and the surface morphology of the nanoparticles indicated a satisfactory surface area. Among all synthesized nanocomposites, CexZrxZnxO5 (x = 1) [CZ1Z2-A] exhibited satisfactory photo-oxidation activity against naphthol orange (NO) under sunlight with a rate constant of 57.5 × 10⁻³ min−1. The effects of pH, inorganic salts, dye concentrations, and catalytic dosage on NO degradation were studied. A probable mechanistic pathway for the degradation of NO in the presence of CZ1Z2-A was proposed, and studies of sacrificial agents indicated that superoxide radical anion (O2˙−) was the main accountable active species in NO degradation. In addition, CZ1Z2-A exhibited excellent recyclability potential, and XRD studies revealed that there was no change in the crystal structure before or after degradation, which indicated its high stability. The intriguing finding was that Ce- and Zr-doped ZnO did not exhibit satisfactory catalytic performance in the photo-oxidation of NO. However, the composite formula of CexZrxZnxO5 (x = 1) with a 1![[thin space (1/6-em)]](https://www.rsc.org/images/entities/char_2009.gif) :1:1 ratio of metal ions offered excellent catalytic activity.
:1:1 ratio of metal ions offered excellent catalytic activity.
1. Introduction
Due to the increase in the Earth's population and industrialization, the textile and pharmaceutical industries continuously release into the environment organic pollutants contained in wastewater that has not undergone any type of purification.1,2 Azo dyes are the most commonly used dyeing agents in the textile industries, and account for more than 60% of the total dyes used. These dyes contain an azo bond and are highly toxic, carcinogenic, and mutagenic to human and aquatic life. The continuous release of this toxic pollutant results in a long-term adverse effect on the environment.3 Therefore, it is necessary to use a suitable method to treat wastewater containing this organic pollutant to remove dyes. Several techniques such as adsorption, ion exchange, coagulation, flocculation, reverse osmosis, ultrafiltration, and biological treatment have been employed to remediate this problem, but each of these has its limitations, i.e., high cost, limited versatility, increase in salt content in the waste matter, and other disposal problems.4
Heterogeneous photocatalysis was found to be very effective for the treatment of toxic organic pollutants due to its low cost, harmless products (CO2, H2O), reusability, and facile separability.5–9 The mechanism of heterogeneous photocatalysts relies on the photogeneration of electrons (e−) and holes (h+) when subjected to suitable light, and their subsequent migration to the catalyst surface. Then, these electrons and holes react with water and air to form reactive oxygen species (ROS), which then react with adsorbed organic pollutants and degrade them into harmless products.10
Among several heterogeneous photocatalysts, zinc oxide (ZnO) was found to be most promising for the treatment of toxic azo textile dyes due to its low cost, high physical and chemical stability, wide bandgap, and large extinction binding energy (60 meV).11–13 However, ZnO nanostructures are characterized by low photocatalytic efficiency due to the rapid recombination of electrons and holes and photocorrosion. ZnO also exhibits low photocatalytic activity under sunlight.14,15
Metal ion doping, coupling with another semiconductor, and surface modification by noble metal can improve the photocatalytic activity of ZnO by bandgap alternation, reduction of electron–hole pair recombination, and increase in defects such as oxygen vacancy.16,17 Cerium oxide (CeO2) and zirconium oxide (ZrO2) are major components in the rare earth family. Cerium oxide improves the activity of photocatalysts by reducing electron–hole pair recombination through its electron-trapping sites (Ce4+).16 Because the ion exchange capacity of ZrO2 is high, its redox activity is enriched with oxygen vacancies, and its overall composite charges are neutral, it is an excellent photocatalytic material.18 Jeyaraj et al. reported enhanced photocatalytic activity of CeO2/ZnO nanospheres against brilliant green dye as compared to pure CeO2 and ZnO.19 Wahba et al. showed that ZrO2/ZnO exhibits excellent photocatalytic activity against indigo carmine and methylene blue under UV light.18 Li et al. reported an increase in photocatalytic activity against rhodamine B (Rh-B) dye by CeO2/ZnO under UV light.20 Quintana et al. reported increased photocatalytic activity of ZrO2/ZnO compared to pure ZnO and ZrO2 under UV light.21
In this work, ZnO was modified with two proportions of inner transition metal ions Ce4+ and Zr4+ to form a nano-sized CexZrxZnxO5 (x = 1) [CZ1Z2-A] photocatalyst. We used a simple co-precipitation method for synthetic purposes due to its low cost, high reproducibility, and no requirement of external temperature, pressure, expensive devices, or organic solvents.15 Initially, our target was to synthesize Ce4+- and Zr4+-doped ZnO, which exhibited poor photocatalytic activity. However, when we prepared CexZrxZnxO5 (x = 1) (1:1:1) nanocomposites, they proved to be excellent for photo-oxidation of napthol orange (NO). There have been no reports thus far on the synthesis of this nano alloy oxide photocatalyst or its photocatalytic activity against NO. CexZrxZnxO5 (x = 1) [CZ1Z2-A] showed stronger photocatalytic activity as compared to CexZryZnyO5 (x = 0.1, y = 0.45) [CZ1Z2-B] and individual Ce4+- and Zr4+-doped metal ions in ZnO composites for the photodegradation of NO under sunlight irradiation.
2. Experimental section
2.1. Chemicals required
(NH4)2Ce(NO3)6 (SDFCL Sd Fine Chemicals), ZrO(NO3)2·xH2O (SDFCL Sd Fine Chemicals), ZnO (Qualigens Fine Chemicals), NH4OH, dilute HNO3, EtOH, and NO (analytical grade) were the essential analytical reagents used for this experiment. Distilled water was used for the preparation of all aqueous solutions.
2.2. Synthesis of doped and alloy metal photocatalysts
The CexZr1−xO4 (x = 0.1) [CZ1], CexZn1−xO3 [CZ2], CexZrxZnxO5 (x = 1) [CZ1Z2-A] (weight taken as a 1:1:1 molar ratio), and CexZryZnyO5 (x = 0.1, y = 0.45) [CZ1Z2-B] (weight taken as 10% of Ce and 90% of equal proportions of Zr and Zn) mixed oxide nanocomposites were prepared by a co-precipitation method. According to the composition, the prerequisite amounts of (NH4)2Ce(NO3)6 (5.20 g) and ZrO(NO3)2·xH2O (2.31 g) were separately dissolved in a minimum volume of water and dil. HNO3, respectively, and then stirred for 10 minutes. ZnO (0.81 g) is sparingly soluble in water, and therefore, a few drops of dilute HNO3 were added until it completely dissolved. Then, it was stirred for an additional 10 minutes. A solution of (NH4)2Ce(NO3)6, ZrO(NO3)2·xH2O, and ZnO was poured into a single beaker and cautiously observed to ensure that there was no precipitate. Next, 6 mL of ethanol was added to the solution, and the mixture was stirred for 30 minutes.
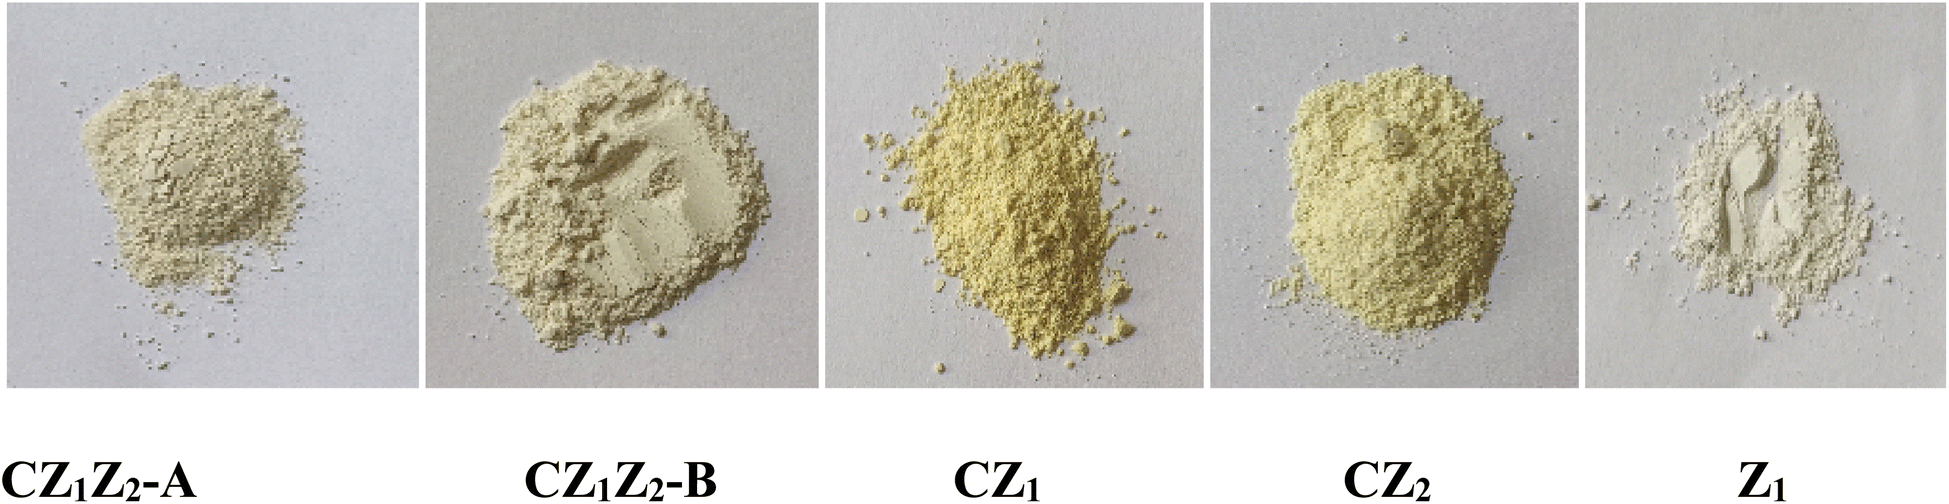
Then, 5 M NH4OH was added dropwise to the mixture until a complete precipitate appeared with constant stirring, and the pH was maintained at 8–9. The obtained precipitate was filtered and washed with deionised water and ethanol, and then dried at 100 °C in a hot air oven for 6 h. The resulting solid oxide was crushed with a pestle, and we obtained our desired nano alloy oxide material. The total synthesis of CexZrxZnxO5 (x = 1) [CZ1Z2-A] is presented in Scheme 1. The other doped novel metal ZnO photocatalysts were prepared following the same procedure according to their composition. Images of the different synthesized nanocomposites are shown in Fig. 1.
 |
| | Scheme 1 Flowchart diagram for synthesis of CeO2/ZrO2/ZnO nano alloy oxide. | |
 |
| | Fig. 1 Images of CZ1Z2-A, CZ1Z2-B, CZ1, CZ2, and Z1. | |
2.3. Procedures for NO measurement by UV-Vis spectrophotometer
The photocatalytic activity of the prepared nanocomposites was investigated by treating them with the model dye NO under sunlight. For this purpose, a 250 mL stock solution of 10 mM NO was prepared by dissolving in the required amount of ethanol and water. Then, its absorbance was adjusted to approximately 1 using a UV-visible spectrophotometer with the addition of the required amount of distilled water.
To investigate the photocatalytic efficiency of the prepared photocatalyst, 0.20 g of the prepared catalyst was added to each set of 25 mL of standard NO dye solutions and exposed to sunlight. All of the photocatalytic experiments were performed between 10:00 am and 3:00 pm during different months (October 2022 and May 2023). The average sunlight irradiation was measured, and its value was 137 mW cm−2. The decomposed dye solution was removed by siphoning every 10 min.
The photocatalytic degradation efficiency of all photocatalysts was determined using the same process. In the presence of a photocatalyst, the degradation of NO follows first-order kinetics. The following equation, Co/C = kt, was used to calculate the rate constant of the photocatalytic reaction (where Co denotes the initial concentration at ‘0’ minutes, and ‘C’ denotes the concentration at time ‘t’). The graph of ln Co/C vs. time interval was used to determine the value of k, where Co and C denote the concentration of NO dye at time t = 0 and t = t, respectively. The percentage of degradation of dyes by different nano alloy oxides was determined using the equation (C0 − Cf)/C0, where C0 and Cf denote the initial and final concentrations of dye (ppm), respectively.
2.4. Characterization
The photocatalytic activity of all synthesized nano alloy oxides was compared, and based on the highest photocatalytic activity, the nanocomposite, i.e., CexZrxZnxO5 (x = 1) [CZ1Z2-A], was used for further characterization studies. The crystal structure of all composites was obtained by X-ray diffraction (XRD) at room temperature using a D8 Advance BRUKER instrument, equipped with Cu Kα (1.54060 Å) as the incident radiation. The Scherrer equation was used for the calculation of crystal size: D = Kλ/βcosθ, K = 0.9, D = crystal size (Å), λ = wavelength of Cu-Kα radiation, and β = corrected half-width of the diffraction peak. FT-IR spectral analyses were performed at room temperature using a PerkinElmer Paragon 1000 FT-IR spectrometer. The KBr technique was used to record the spectra. The FT-IR spectrum of CeO2/ZrO2/ZnO oxide nanoparticles was recorded in the range of 4000 to 450 cm−1. A UV-visible spectrometer (UV-1800, Shimadzu) was used for the measurement of absorbance. The average grain sizes of the nanocomposite were measured using scanning electron microscopy (SEM) (JEOL JMS-6390). The nanocomposite CexZrxZnxO5 (x = 1) [CZ1Z2-A] was examined to determine the atomic level dispersion through energy dispersive X-ray spectroscopy (EDX) (JEOL JMS-6390). The fine structure of the prepared sample was analyzed by transmission electronic microscopy (TEM) (Model Philips TM-30, Philips Research Laboratories). Fluorescence spectrophotometry (PerkinElmer FL 6500) was used to obtain photoluminescence measurements at room temperature.
3. Results and discussion
3.1. XRD analysis
Powder XRD techniques were used to analyze and confirm the crystal structure of the synthesized nanocomposites. The XRD patterns of CZ1Z2-A, CZ2, Z1, and CZ1, CZ1Z2-B are shown in Fig. 2(a) and (b), respectively. The XRD patterns of CZ1Z2-A exhibited wide and broad diffraction peaks 2θ of 28.75°, 48.03°, 57.61° and exhibited (hkl) values of (111), (220), and (311) corresponding to the face-centered fluorite cubic structure of CeO2 (JCPDS No. 34-0394) with no impurities.22 The absence of any other peak of zinc or zirconium in CZ1Z2-A could be due to the partial replacement of small-sized Zn2+ (0.09 nm) and Zr4+ (0.084 nm) ions by Ce4+ (0.097 nm) ions.23,24 In addition, it was observable that the diffraction peaks of CeO2 were measured at a slightly higher angle in the case of CZ1Z2-A in comparison to CZ2. The crystalline size of CZ1Z2-A was 15.12 ± 1 nm, as determined using the Scherer method and corresponding to the maximum intensity (111) peak. In the XRD pattern of CZ1Z2-B, the (111) and (311) planes confirmed the formation of a face-centered fluorite cubic structure in CeO2. In addition, the (220) peak of ZrO2 was observed in CZ1Z2-B, which could be due to the increase in the Zr content in CZ1Z2-B.
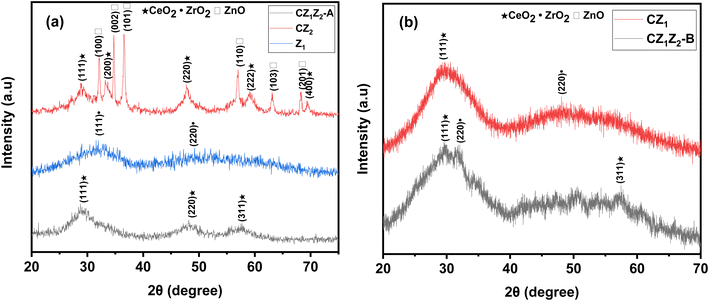 |
| | Fig. 2 (a) XRD patterns of CZ1Z2-A, CZ2, and Z1. (b) XRD patterns of CZ1Z2-B and CZ1. | |
3.2. FT-IR spectroscopy
The FT-IR spectra of CexZr1−xO4 (x = 0.1) [CZ1], CexZn1−xO3 [CZ2], CexZrxZnxO5 (x = 1) [CZ1Z2-A], and CexZryZnyO5 (x = 0.1, y = 0.45) [CZ1Z2-B] are shown in Fig. 3, where spectral bands appear at 3455, 2427, 1628, 1384, 833, 735, and 628 cm−1. The bands observed at approximately 3455 cm−1 were assigned to the stretching vibration of the –OH groups, and 1628 cm−1 was assigned to the bending vibration of H–O–H, due to the absorbed water molecule. The band at approximately 1384 cm−1 was attributed to the C![[double bond, length as m-dash]](https://www.rsc.org/images/entities/char_e001.gif) O bond of absorbed CO2. The presence of CO2 mode in the FT-IR spectrum could be due to the trapping of atmospheric CO2 by the nanocomposites.25 The peak at 833 cm−1 corresponded to the Ce–O bond.26 The sharp band at approximately 735 cm−1 may be due to the Zr–O stretching mode.27 The band located at approximately 628 cm−1 was attributed to Zn–O deformation.28
O bond of absorbed CO2. The presence of CO2 mode in the FT-IR spectrum could be due to the trapping of atmospheric CO2 by the nanocomposites.25 The peak at 833 cm−1 corresponded to the Ce–O bond.26 The sharp band at approximately 735 cm−1 may be due to the Zr–O stretching mode.27 The band located at approximately 628 cm−1 was attributed to Zn–O deformation.28
 |
| | Fig. 3 FT-IR spectrum of the CZ1, CZ2, CZ1Z2-A, and CZ1Z2-B photocatalysts. | |
3.3. Field emission scanning electron microscopy (FESEM) analysis
FESEM of CZ1Z2-A was performed to obtain information regarding its surface morphology and to determine its grain size. FESEM images of CZ1Z2-A are shown in Fig. 4(a)–(d) at magnifications of 500×, 1500×, 3500×, and 7000×, respectively. From the FESEM images, we cannot accurately predict the shape or size of the CZ1Z2-A nanoparticles. However, the average grain size of the CZ1Z2-A nanoparticles is 100 ± 5 nm.
 |
| | Fig. 4 (a)–(d) FESEM images of the CZ1Z2-A nanocomposite at different magnifications. | |
3.4. EDX analysis
The elemental description of CZ1Z2-A was obtained from EDX analysis, which is shown in Fig. 5. Absorption peaks of cerium, zirconium, zinc, and oxygen were found in the EDX spectrum, and the absence of any other foreign elements or impurities indicates the purity of the nanocomposites. The peaks located at 1 keV, 2 keV, and 5 keV are characteristic of zinc, zirconium, and cerium, respectively. The atomic% values for metal ions are shown in Table 1 for the CZ1Z2-A nanocomposites. The atomic% values for Ce:Zr:Zn are almost equal, and 1:1:1 indicates satisfactory homogeneity.
 |
| | Fig. 5 EDX spectrum of CZ1Z2-A. | |
Table 1 Elemental analysis and determination of weight% and atomic% for CZ1Z2-A
| Element |
Line type |
Wt% |
Atomic% |
| 0 |
K series |
24.65 |
67.43 |
| Zn |
K series |
14.81 |
9.92 |
| Zr |
L series |
22.35 |
10.72 |
| Ce |
L series |
38.19 |
11.93 |
| Total: |
|
100 |
100 |
3.5. TEM analysis
The particle size, morphology, size distribution, and crystallinity of nanocomposites were evaluated with the assistance of TEM. Fig. 6 interprets the mesoporous nature of the CZ1Z2-A nano alloy oxide. The average particle size of the CZ1Z2-A nano alloy oxide was 5 ± 1 nm. The particle size distribution of CZ1Z2-A is shown in Fig. 6(e).
 |
| | Fig. 6 (a)–(d) TEM of CZ1Z2-A. (e) Particle size distribution of CZ1Z2-A. | |
3.6. Photocatalytic activity
The photo-oxidation of NO solution to a colourless solution with the prepared photocatalysts under sunlight irradiation is shown in Fig. 7(a). The UV-visible spectra were measured after irradiation of NO with CZ1Z2-A compositions, and the corresponding absorbance of dyes was found at 484 nm, which is shown in Fig. 7(b). The decolourization pattern of NO at different time intervals is shown in Fig. 7(a) (inset). The time required for the complete degradation of NO by CZ1Z2-A was 50 minutes. Fig. 7(a) indicates that an equimolar proportion of CexZrxZnxO5 (x = 1) [CZ1Z2-A] nanocomposites exhibited stronger photocatalytic activity as compared to other nanocomposites. The degradation rate constant of NO under sunlight in the presence of CZ1Z2-A was 66.6 × 10⁻³ min−1, which was measured after approximately 80% decolourization (30 minutes) of dye, and the degradation efficiency was 91.2%. The reaction rate constant and degradation efficiency of different nanocomposites are shown in Table 2.
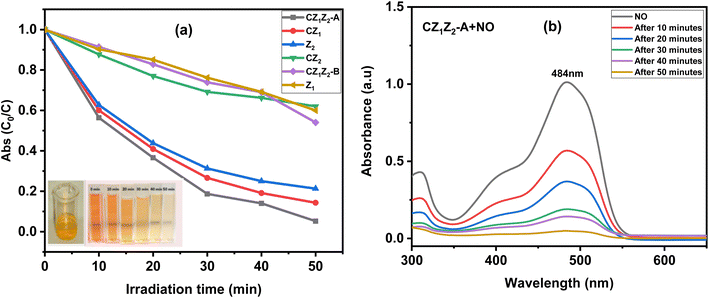 |
| | Fig. 7 (a) The changes in the concentrations of NO in the presence of CZ1Z2-A, CZ1Z2-B, CZ1, CZ2, Z1, Z2, and sunlight. (b) Degradation of NO in the presence of CZ1Z2-A at a constant time interval at 484 nm. | |
Table 2 Rate constant and degradation rate of NO by photooxidation in the presence of CZ1Z2-A, CZ1Z2-B, CZ1, CZ2, Z1, and Z2a
| Sample |
Acronym |
Reaction rate constant, k (10−3 min−1) |
| The reaction rate measured after 80% (30 minutes) degradation of dyes. |
| CexZrxZnxO5 (x = 1) |
CZ1Z2-A |
57.5 |
| CexZryZnyO5 (x = 0.1, y = 0.45) |
CZ1Z2-B |
10.17 |
| CexZr1−xO4 (x = 0.1) |
CZ1 |
43.39 |
| CexZn1−xO3 (x = 0.1) |
CZ2 |
12.5 |
| ZrO2 |
Z1 |
8.75 |
| ZnO |
Z2 |
36.67 |
3.7. Effects of salts and pH on degradation efficiency
The photo-oxidation of NO in the presence of CZ1Z2-A and different salts was investigated under sunlight, and is shown in Fig. 8(a). For this purpose, 10 mM NaNO3, NaCl, and Na2SO4 was used, and their effect on degradation efficiency (%) is shown in Fig. 8(b). In the presence of NO3−, the degradation (%) of dyes slightly increased due to the formation of hydroxyl radical by the protonation of produced O˙− (ref. 29) (eqn (1) and (2)).| | |
NO3− + light → NO3˙− → NO2− + O˙−
| (1) |
| | |
Cl− + ˙OH → Cl˙ + OH−
| (3) |
| | |
SO42− + ˙OH → SO4˙− + OH−
| (4) |
 |
| | Fig. 8 (a) Changes in concentrations of NO in the presence of CZ1Z2-A and 10 mM NaNO3, NaCl, and Na2SO4 under sunlight irradiation. (b) Degradation (%) of NO using CZ1Z2-A in the presence of different salts at different time intervals. | |
The decrease in the photodegradation efficiency in the presence of Cl− and SO42− is due to their ability to scavenge ROS, i.e., hydroxyl radical, which is the key species for the degradation of dyes (eqn (3) and (4)).30
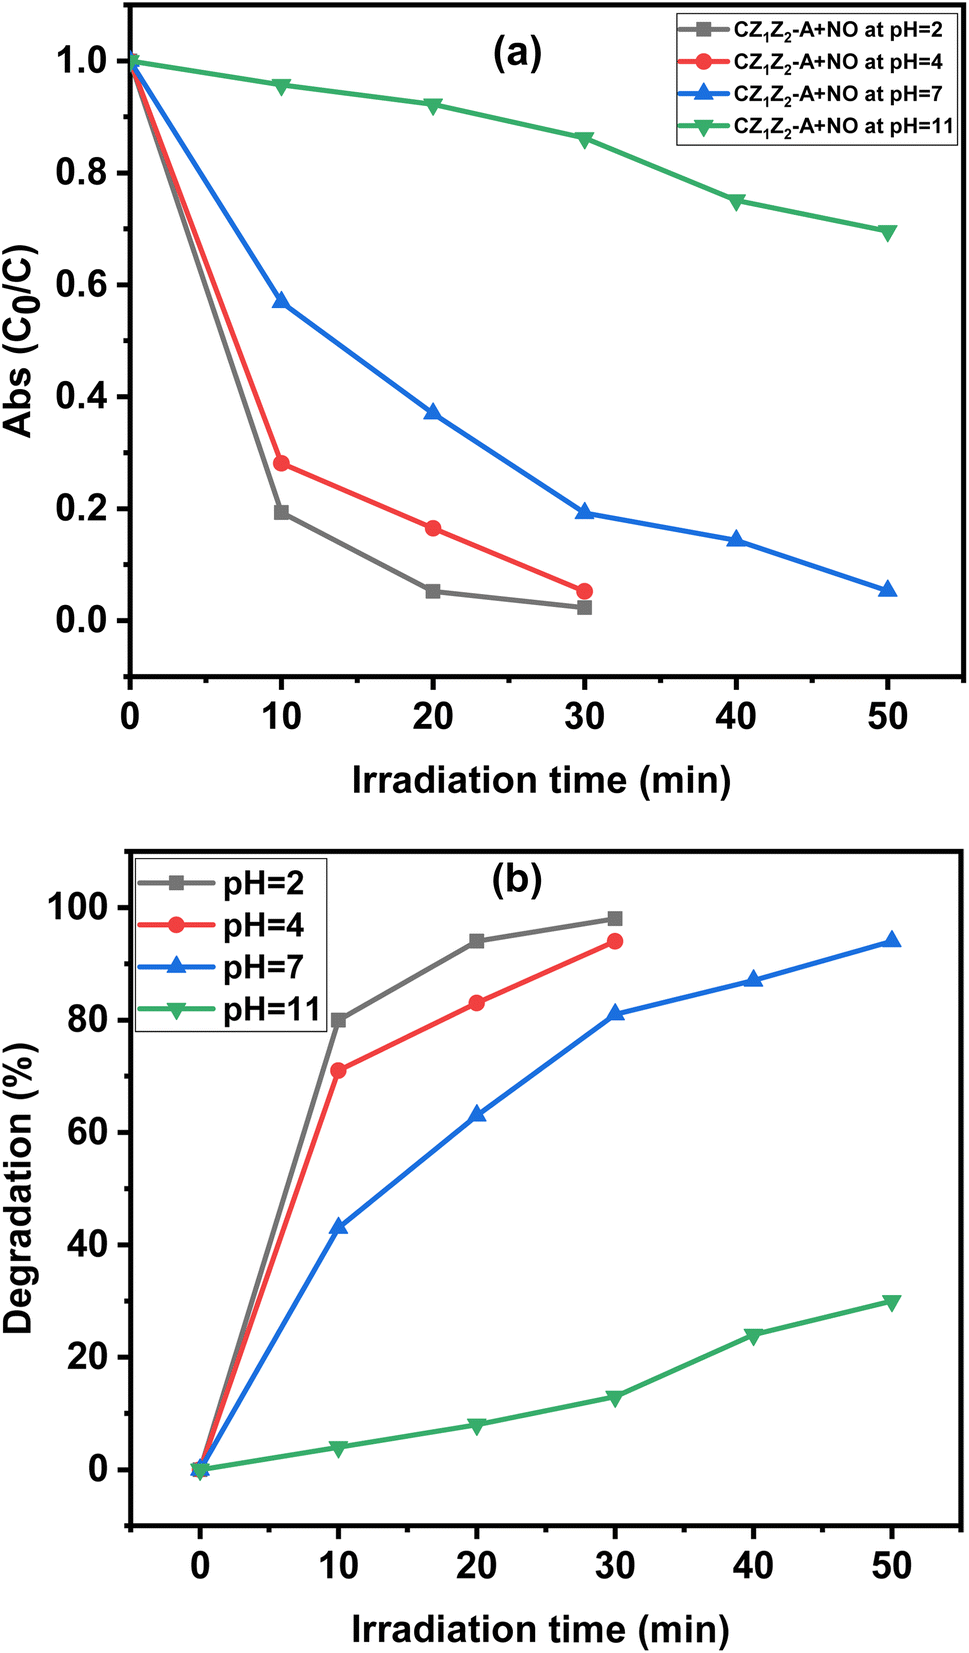
The effect of different pH on the photocatalytic dye degradation of NO was studied in the presence of the CZ1Z2-A nanocomposite under sunlight, which is shown in Fig. 9(a). For this purpose, a degradation study was conducted at pH = 2, 4, 7, and 11. As the change was made from a basic to an acidic medium, the degradation efficiency of dyes increased, which is shown in Fig. 9(b). We used 0.1 M HCl and NaOH for the adjustment of pH within the range of 2 to 11. The point of zero charge (PZC) for CeO2-based compounds is approximately 6.5.31
 |
| | Fig. 9 (a) The changes in the concentrations of NO in the presence of CZ1Z2-A at different pH values under sunlight. (b) The changes in the degradation rate of NO dye in the presence of CZ1Z2-A at different pH values under sunlight. | |
When the pH of the solution was higher than 6.5, an electrostatic repulsion occurred between the negatively charged nanocomposite surface and anionic dye. The amount of dye degradation decreased with increasing pH due to an increase in the repulsion between the surface of the catalyst and dye. A decrease in the pH below the PZC increased the dye degradation due to the increase in the attraction between the positively charged nanocomposite surface and anionic dye, which is visible in Fig. 9(b). In addition, as the pH value increased, the formation of ROS, i.e., active hydroxyl radical (˙OH˙), was favoured,32 and the photocatalytic degradation rate increased.
3.8. Effect of catalytic dosage and initial concentration of dye on the degradation efficiency
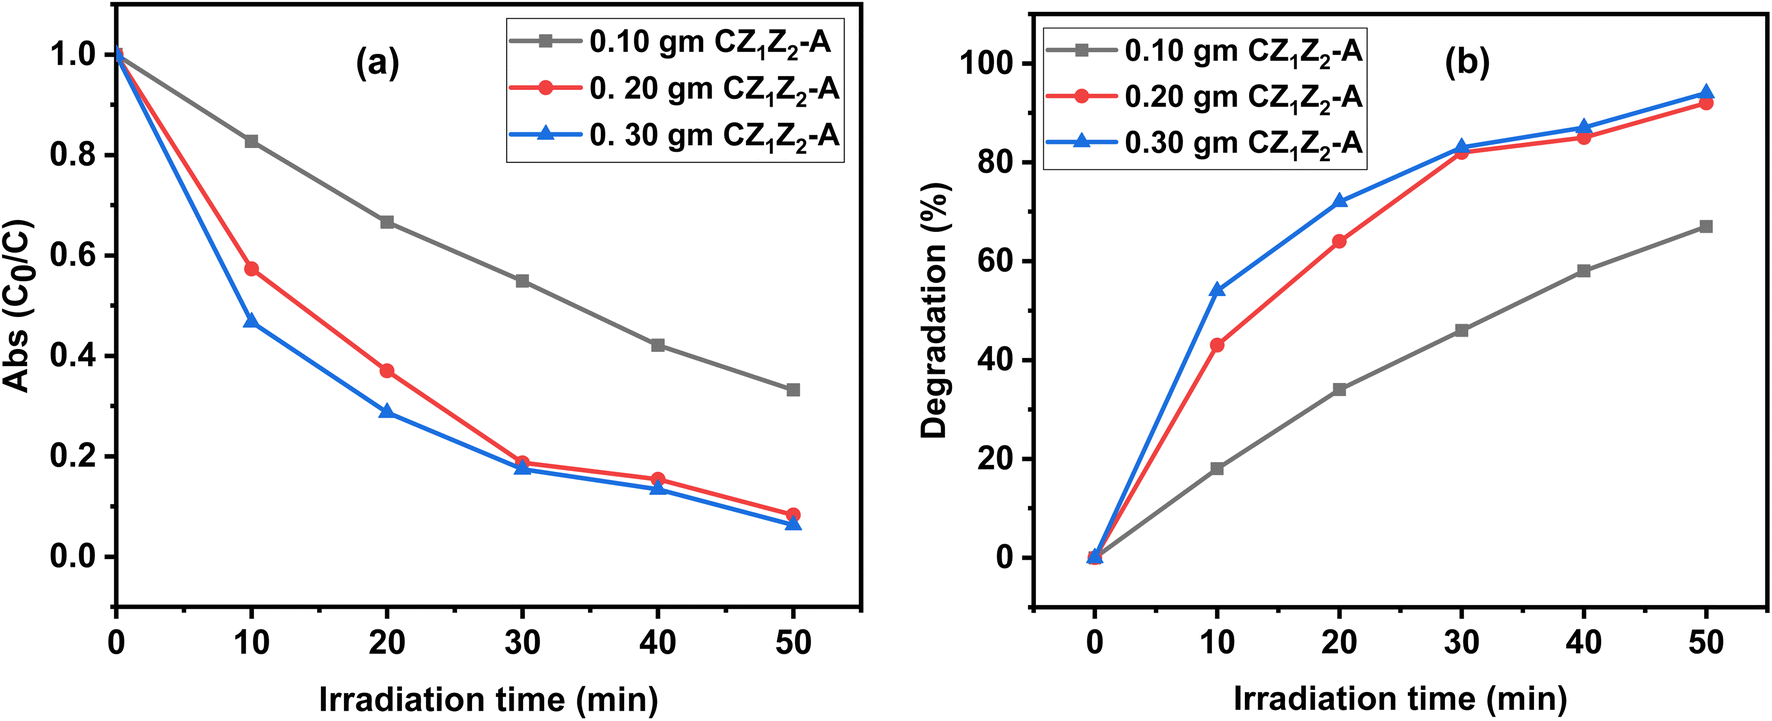
To avoid wasting photocatalyst, it was necessary to optimize the catalyst amount in the photocatalytic degradation experiments. The effect of the dosage of CZ1Z2-A was investigated by studying NO degradation using 0.10–0.30 g of photocatalyst for 50 min, which is shown in Fig. 10(a). The degradation percentages increased as the quantity increased from 0.10 g to 0.30 g, which are shown in Fig. 10(b). CZ1Z2-A was a satisfactory adsorbent of dye with a high surface area.33 As the catalyst dose increased, the amount of adsorbed dye on the surface of the photocatalyst increased. This adsorbed dye molecule can rapidly react with ROS, with subsequent degradation.
 |
| | Fig. 10 (a) Changes in the concentrations of NO in the presence of different catalytic dosages of CZ1Z2-A under sunlight. (b) Changes in the degradation rate of NO in the presence of different catalytic dosages of CZ1Z2-A under sunlight. | |
In addition, with increasing catalyst quantity, the amount of Ce4+/Ce3+ increased, which can lead to the generation of additional ROS, and thus increased dye degradation.34 There was less of an increase in the dye degradation rate as the catalytic dosage increased from 0.20 g to 0.30 g. This could be due to the decrease in photon penetration with increasing catalytic dosage, which leads to a decrease in the formation of ROS.35
The effect of the initial concentration of NO dye on the degradation efficiency was investigated. The concentration of dye varying from 30 mg L−1 to 50 mg L−1 with 0.20 g photocatalyst (CZ1Z2-A) and the degradation efficiency are shown in Fig. 11.
 |
| | Fig. 11 Effect of initial dye concentration on the photodegradation of NO by CZ1Z2-A. | |
Fig. 11 shows that as the initial dye concentration increased from 30 mg L−1 to 50 mg L−1, the rate of photocatalytic degradation decreased from 94% to 82%. This occurred because with increasing dye concentration, the amount of photon penetration decreases. As a result, the amount of interaction between photons and the surface of the photocatalyst decreases, which in turn decreases the formation of ROS, and thus, the degradation rate decreases.36 The number of photocatalytically generated ROS remained the same in all these cases because the quantity of photocatalyst was the same. To maintain the equilibrium, a higher concentration of ROS must be used to degrade a higher concentration of dye if the catalyst amount remains constant.37 Therefore, it is obvious that with an increasing quantity of dye, the degradation rate should decrease because the formation of ROS remains constant.
3.9. Recyclability and stability of the CZ1Z2-A nanocomposite
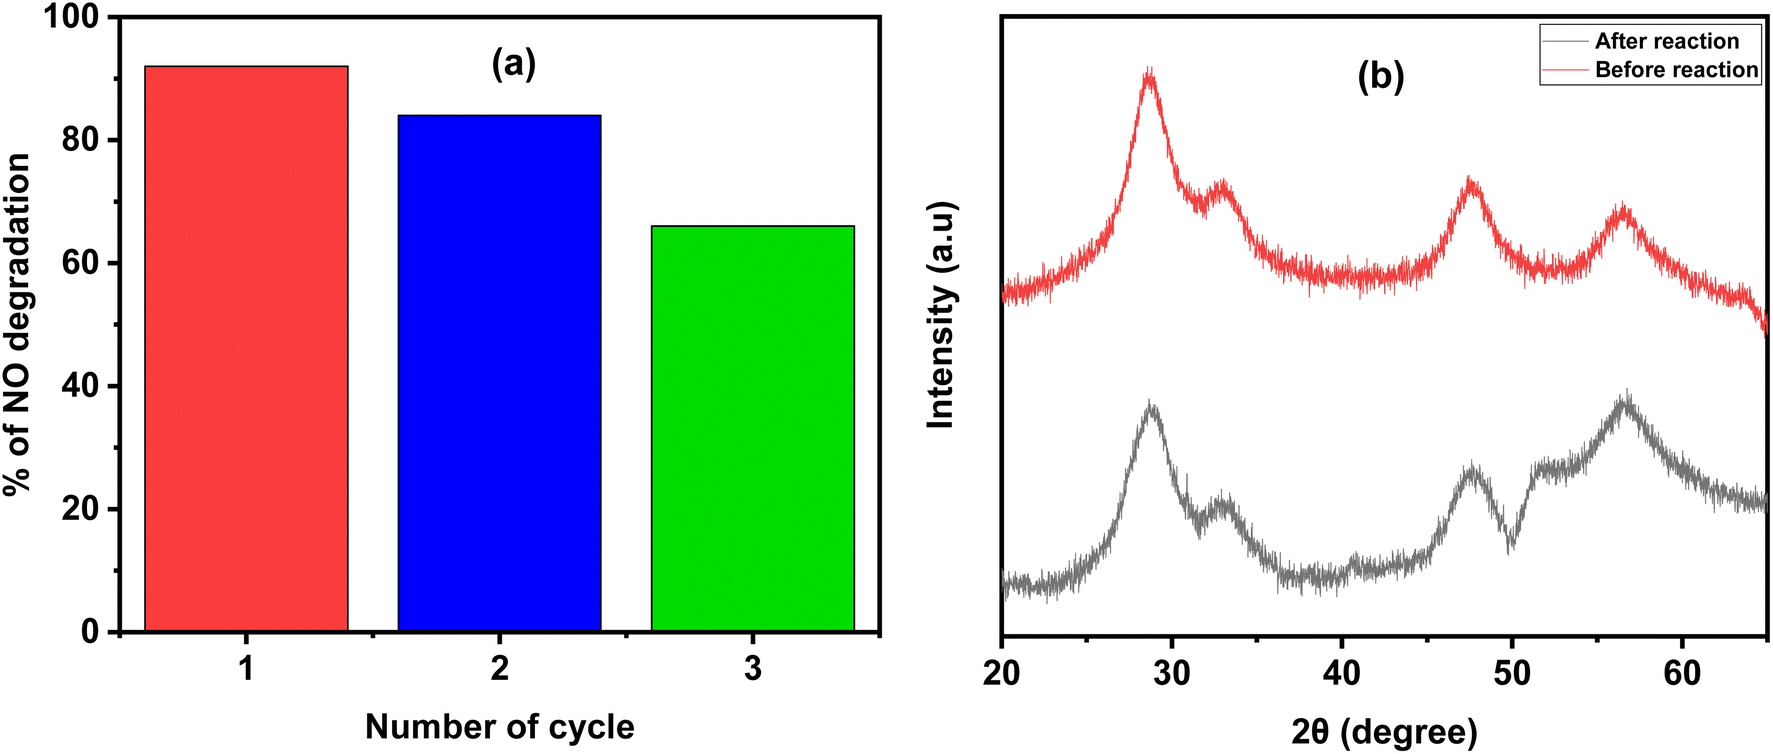
An important characteristic of any heterogeneous photocatalyst is its recyclability. To investigate the reusability of CZ1Z2-A, the difference in the degradation rate of NO was determined with recycle tests that were performed under the same reaction conditions for up to 50 minutes. After each test, CZ1Z2-A was filtered and repeatedly washed with ethanol and water to remove any trace amounts of organic dye compounds. It was subsequently dried in a hot air oven at 100 °C for 3 h, and then it was ready to be used for the next test.
According to Fig. 12(a), after the first two tests, the rate of degradation remained nearly the same (92% to 84%). During the third test, there was a decrease in the degradation of NO (66%). A decreased degradation rate could be due to the loss of photocatalyst after each cycle, and also, after each cycle, the sample was dried for 3 h, whereas initially, it was dried for 6 h. The results indicate that the CZ1Z2-A photocatalyst can be reused multiple times, which is a characteristic of a perfect heterogeneous photocatalyst.
 |
| | Fig. 12 (a) Recycling experiment of photocatalytic degradation of NO under sunlight. (b) The XRD pattern of CZ1Z2-A before and after the third catalytic cycle. | |
To confirm the stability of the photocatalyst after repeated usage, the XRD pattern of CZ1Z2-A was investigated before the reaction and after the third cycle, which is presented in Fig. 12(b). After the third cycle, the characteristics of the XRD peaks remained unchanged, which confirms the stability of the photocatalyst.
3.10. Optical analysis
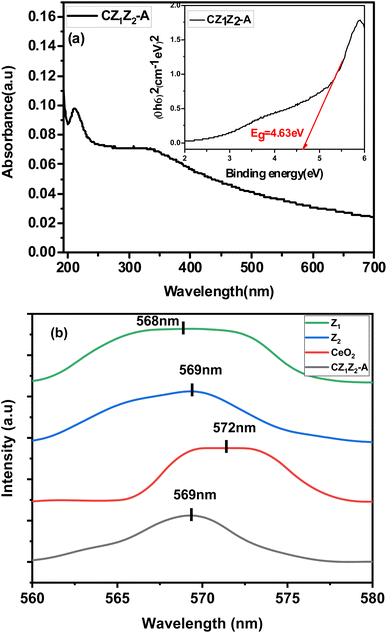
To analyse the optical property of the synthesized nanocomposite, the UV-visible absorption spectra of CZ1Z2-A were recorded between 200 to 700 nm, which is shown in Fig. 13(a). The optical band gap of the nanocomposite was determined using Tauc's formula (eqn (5)):where α = absorption coefficient, A denotes a constant, Eg = band gap energy, exponent n depends on the types of transition, h = Planck's constant, and ν = frequency of light. The band gap for ZnO is 3.47 eV, which was previously reported.15 Calculations were performed to ascertain the band gap for CZ1Z2-A, and it was determined to be 4.63 eV, as shown in Fig. 13(a).
 |
| | Fig. 13 (a) UV-visible absorption spectra of CZ1Z2-A; the inset figure presents the binding energy plot of CZ1Z2-A. (b) PL spectra of CZ1Z2-A, Z1, Z2, and CeO2. | |
Photoluminescence spectra provide us with additional information regarding optical properties. Radiative recombination of photo-generated electrons and holes generates photoluminescence emission. Thus, the higher the intensity, the higher the rate of electron hole-pair recombination.38,39 The initial analysis of the emission spectra of the synthesized materials provided two excitations at 286 and 572 nm. Then, we fixed the wavelengths at 286 and 572 nm, and in all cases, the obtained spectra only showed excitation peaks in the range of 568–572 nm. Therefore, at room temperature, PL spectra of CZ1Z2-A, Z1, Z2, and CeO2 were obtained at an excitation wavelength of 572 nm.
The maximum intensity peak for CZ1Z2-A, Z1, Z2, and CeO2 appeared at 569 nm, 569 nm, 568 nm, and 572 nm, respectively, with a wide range, as shown in Fig. 13(b). CZ1Z2-A showed a symmetric curve with a PL intensity peak at 569 nm as compared to CeO2, Z1, and Z2. This indicates that the recombination of photoinduced electron–hole pairs was favourable in the case of CZ1Z2-A as compared to the others. This increases its photocatalytic activity as compared to Z1, Z2, and CeO2, which is in satisfactory agreement with our experimental results.
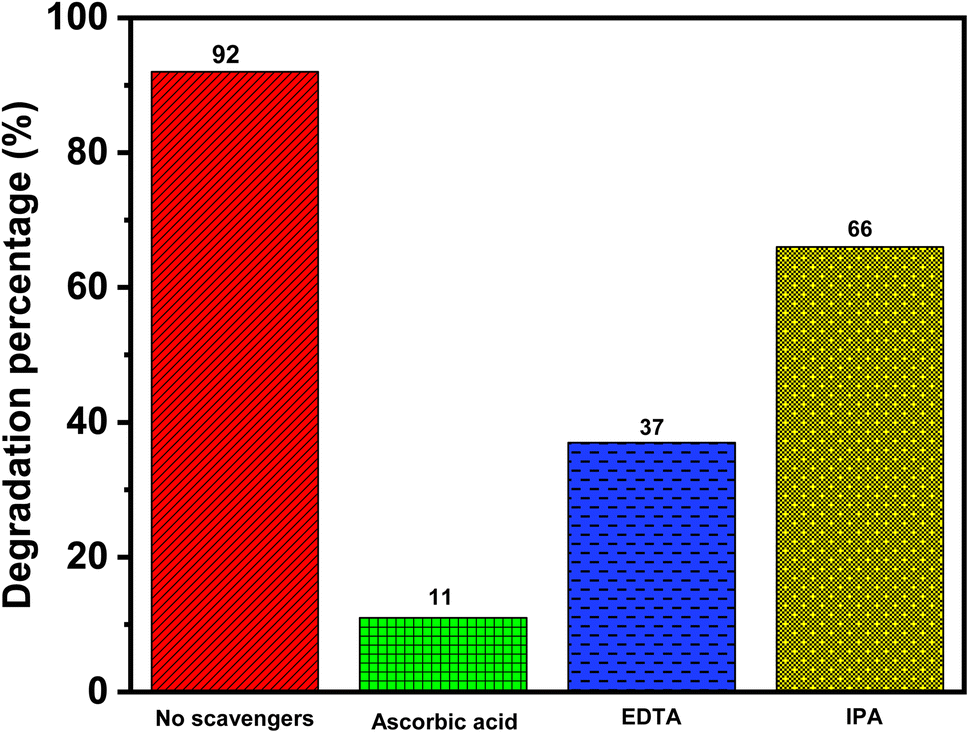
3.11. Effects of sacrificial agents on degradation
To understand the role of reactive species, i.e., superoxide radical anion (O2˙−), holes (h+), and hydroxyl ions (˙OH), in photocatalytic degradation, sacrificial agent studies were carried out, which are shown in Fig. 14. For this purpose, ascorbic acid, ethylenediaminetetraacetic acid (EDTA), and isopropyl alcohol (IPA) were used to trap superoxide radical anion (O2˙−), holes (h+), and hydroxyl radical (˙OH), respectively.37,40 In each of these cases, the reaction conditions remained the same, and 10 mM sacrificial agents were added to the NO dye solution before the addition of the photocatalyst. The degradation rate was measured after 50 min.
 |
| | Fig. 14 The role of sacrificial agents on the photocatalytic degradation of NO under sunlight. | |
In the absence of any sacrificial agents, the rate of NO degradation was 92%. In the presence of 10 mM ascorbic acid, EDTA, and isopropyl alcohol, the degradation rate of NO decreased to 11%, 37%, and 66%, respectively. The addition of all the sacrificial agents decreased the rate of NO degradation under sunlight, which indicated that all of the species contribute to the degradation of NO. However, in the presence of ascorbic acid, the decrease in the NO degradation rate was the highest. This clearly indicates that the superoxide radical anion (O2˙−) is the key species and is responsible for the photocatalytic degradation of NO.
3.12. Proposed mechanism
The most probable mechanism of NO degradation is schematically represented in Fig. 15. When photons fall on the surface of CZ1Z2-A, electrons from the valence band travel to the conduction band. This process generates holes in the valence band and electrons in the conduction band. These holes and electrons basically react with oxygen and water molecules to produce highly efficient ROS, i.e., hydroxyl radical and superoxide radical anions. These ROS react with dye molecules and degrade them into nontoxic water and carbon dioxide molecules.15,41–43 The detailed mechanism involved for the production of hydroxyl and superoxide radicals is also explained using the following empirical equations (eqn (6) and (7)) to calculate the VB and CB band edge potential for ZrO2, ZnO, and CeO2:where Ec denotes the constant with respect to a standard hydrogen electrode (approximately 4.5 eV), Eg denotes the band gap, and X denotes the semiconductor electronegativity.44 The X values for ZrO2, ZnO, and CeO2 are 5.91, 5.79, and 5.56 eV, respectively.44,45 The calculated ECB and EVB values for the photocatalysts are shown in Table 3. The Eo values for ˙OH/H2O and O2/O2˙− were 2.27 eV and −0.046, respectively.45
 |
| | Fig. 15 Proposed mechanism for degradation of NO by the CZ1Z2-A nanophotocatalyst. | |
Table 3 Calculated ECB and EVB values for ZrO2, ZnO, and CeO2
| |
X (eV) |
Eg (eV) |
ECB (eV) |
EVB (eV) |
| ZrO2 |
5.91 |
5.01 |
−1.09 |
3.92 |
| CeO2 |
5.56 |
3.2 |
−0.54 |
2.66 |
| ZnO |
5.79 |
3.47 |
−0.445 |
3.025 |
Table 1 shows that the VB of ZrO2 is more positive than that of ZnO, and the VB of ZnO is more positive than that of CeO2. The holes from the valence band of ZrO2 migrate to the VB of ZnO, and from ZnO, the hole then migrates to the valence band of CeO2. Because the CB of CeO2 is more positive than that of ZrO2 and ZnO, hence, the photo-induced electrons from ZrO2 and CeO2 migrate to ZnO. Due to the higher oxidation potential, the VB of ZrO2 can easily convert adsorbed H2O to hydroxyl radical (˙OH). The photogenerated electrons in the CB of CeO2 can easily convert adsorbed oxygen molecules to superoxide radical anions (O2˙−).
The FT-IR technique was used to investigate the mineralization of NO in the presence of CZ1Z2-A. For this purpose, FT-IR spectroscopy of NO before and after degradation was performed, and the comparison is shown in Fig. 16(a). Magnification of the FT-IR scanning between 800 and 1800 cm−1 is shown in Fig. 16(b).
 |
| | Fig. 16 (a) FT-IR spectra of NO before and after degradation. (b) Magnification of the FT-IR spectra between 800 and 1800 cm−1. | |
The NO dye solution exhibited a peak at approximately 3428 cm−1 due to the stretching frequency of the –OH group. The NO peaks at 1551, 1571, 1596, and 1623 cm−1 are due to the stretching frequency of the benzene phenyl ring. The characteristic peak of an azo group (–NN–) is visible at 1316 and 1386 cm−1.46 The IR spectra of the degraded product of NO show a large intense peak at 3303 cm−1 due to the vibration of water molecules. The peak at approximately 1631 cm−1 is due to the HCO3− from CO2 dissolved in water.47 The peaks of the azo and benzene groups disappeared in the product, which indicates mineralization and the excellent catalytic properties of CZ1Z2-A.
4. Conclusion
CexZrxZnxO5 (x = 1) [CZ1Z2-A] nano alloy oxide photocatalysts were synthesized using an inexpensive co-precipitation method. The procedure is eco-friendly, viable, and hazardless, with low toxicity. The most interesting observation was that when the percentages of Ce and Zr in ZnO were increased, there was no significant result, but when the ratio of metal ions was 1:1:1 in CexZrxZnxO5 (x = 1), satisfactory photocatalytic activity was observed. The particle size (5 nm) and surface properties indicated a porous nature, and as a result, it acted as a satisfactory photocatalyst for the oxidation of NO under sunlight. In the dark, the absorbance of NO did not change in the presence of the photocatalyst. After catalytic experiments, the PL and FTIR spectra were also in satisfactory agreement with the degradation of NO under sunlight. Among all the composites, there were significant results for the photo-oxidation of NO by CexZrxZnxO5 (x = 1) [CZ1Z2-A] under sunlight.
Author contributions
All the experiments and applications were performed by Mr A. Sinha and Mr S. K. Sahu under the supervision of Dr T. K. Ghorai. The manuscript was written by Mr A. Sinha, and designed and corrected by Dr T. K. Ghorai and Dr S. Biswas.
Conflicts of interest
The authors declare no financial conflicts of interest.
Acknowledgements
This work was fully supported by the Madhya Pradesh Council of Science & Technology, Government of India, Madhya Pradesh (File No. A/R&D/RP-2/Phy & Engg./2017-18/271) and DST-FIST, Government of India (File No. SR/FST/CS-I/2017/2(C)) for financial assistance for development of the Instrumental Facility at the Department of Chemistry, IGNTU and Central Instrumental Facility at IGNTU. The authors are also thankful to West Bengal State University, Barasat, Kolkata, India, University of Calcutta, Kolkata, India and STIC Cochin, Kerala, India for the FTIR, TEM, FESEM, and EDX study analyses.
References
- S. Panwar, G. K. Upadhyay and L. P. Purohit, Mater. Res. Bull., 2022, 145, 111534, DOI:10.1016/j.materresbull.2021.111534.
- T. J. Al-Musawi, P. Rajiv, N. Mengelizadeh, I. A. Mohammed and D. Balarak, J. Environ. Manage., 2022, 292, 112777, DOI:10.1016/j.jenvman.2021.112777.
- Y. Bai, X. Wang, F. Zhang and R. J. Zeng, Front. Environ. Sci. Eng., 2022, 16, 1–9 CrossRef.
- P. Ahuja, S. K. Ujjai, R. Kanojia and P. Attri, J. Compos. Sci., 2021, 5(3), 82, DOI:10.3390/jcs5030082.
- H. Wang, X. Li, X. Zhao, C. Li, X. Song, P. Zhang, P. Huo and X. Li, Chin. J. Catal., 2022, 43, 178–214 CrossRef CAS.
- J. Kaur and S. Singhal, Ceram. Int., 2014, 40, 7417–7424 CrossRef CAS.
- M. Huelsey, C. W. Lim and N. Yan, Chem. Sci., 2020, 11, 1456–1468 RSC.
- A. Moores and N. Yan, ACS Sustainable Chem. Eng., 2017, 5, 11124 CrossRef CAS.
- T. Wang, X. Cao and L. Jiao, Carbon Neutrality, 2022, 1, 21, DOI:10.1007/s43979-022-00022-8.
- I. Khana, K. Saeeda, N. Alib, I. Khanc, B. Zhangd and M. Sadiq, J. Environ. Chem. Eng., 2020, 8(5), 104364, DOI:10.1016/j.jece.2020.104364.
- B. T. Sone, E. Makamu, H. E. A. Mohamed, O. Oputu and V. Fester, Environ. Nanotechnol., Monit. Manage., 2021, 16, 100515, DOI:10.1016/j.enmm.2021.100515.
- P. Sánchez-Cid, C. Jaramillo-Páez, J. A. Navío, A. N. Martín-Gómez and M. C. Hidalgo, J. Photochem. Photobiol., A, 2019, 369, 119–132, DOI:10.1016/j.jphotochem.2018.10.024.
- W. Liu, T. He, Y. Wang, G. Ning, Z. Xu, X. Chen, X. Hu, Y. Wu and Y. Zhao, Sci. Rep., 2020, 10, 1–12 CrossRef PubMed.
- A. Das, M. Patra, M. Kumar P, M. Bhagavathiachari and R. G. Nai, Mater. Chem. Phys., 2021, 263, 124431, DOI:10.1016/j.matchemphys.2021.124431.
- A. Sinha, S. K. Sahu, S. Biswas, M. Mandal, V. Mandal and T. K. Ghorai, Curr. Res. Green Sustainable Chem., 2022, 5, 100244, DOI:10.1016/j.crgsc.2021.100244.
- Z. Lv, Q. Zhong and M. Ou, Process Saf. Environ. Prot., 2021, 156, 457–464 CrossRef.
- U. Alam, A. Khan, D. Ali, D. Bahnemann and M. Muneer, RSC Adv., 2018, 8, 17582–17594 RSC.
- M. A. Wahba, S. M. Yakout, W. A. A. Mohamed and H. R. Galal, Mater. Chem. Phys., 2020, 256, 123754, DOI:10.1016/j.matchemphys.2020.123754.
- M. Jeyaraj, R. Atchudan, S. Pitchaimuthu, T. N. J. I. Edison and P. Sennu, Process Saf. Environ. Prot., 2021, 156, 457–464, DOI:10.1016/j.psep.2021.10.033.
- C. Li, R. Chen, X. Zhang, S. Shu, J. Xiong, Y. Zheng and W. Dong, Mater. Lett., 2011, 65, 1327–1330 CrossRef CAS.
- A. Quintana, A. Altube, E. G. Lecina, S. Suriñach, M. D. Baró, J. Sort, E. Pellicer and M. Guerrero, J. Mater. Sci., 2017, 52, 13779–13789 CrossRef CAS.
- Y. Xu, C. Deng, C. Dong, Q. Wang and N. Gao, Int. J. Photoenergy, 2022, 1–9, DOI:10.1155/2022/8594451.
- P. Rodlamul, S. Tamura and N. Imanaka, J. Ceram. Soc. Jpn., 2018, 126, 750–754 CrossRef CAS.
- Y. Zheng, K. Li, H. Wang, X. Zhu, Y. Wei, M. Zheng and Y. Wang, Energy Fuels, 2016, 30, 638–647 CrossRef CAS.
- Y. M. Hao, S. Y. Lou, S. M. Zhou, R. J. Yuan, G. Y. Zhu and N. Li, Nanoscale Res. Lett., 2012, 7, 1–9 CrossRef PubMed.
- S. Karidas, B. K. Veena, N. Pujari, P. Krishna and V. Chunduru, Sadhana, 2020, 45(1), 128, DOI:10.1007/s12046-020-01329-x.
- S. Mallakpour and E. Shafiee, Des. Monomers Polym., 2017, 20, 378–388 CrossRef CAS PubMed.
- A. C. Janaki, E. Sailatha and S. Gunasekaran, Spectrochim. Acta, Part A, 2015, 144, 17–22 CrossRef CAS PubMed.
- T. M. Elmorsi, Y. M. Riyad, Z. H. Mohamed and H. M. H. A. E. Bary, J. Hazard. Mater., 2010, 174, 352–358 CrossRef CAS.
- A. Khataee, A. Karimi, S. A. Oskoui, R. D. C. Soltani, Y. Hanifehpour, B. Soltani and S. W. Joo, Ultrason. Sonochem., 2015, 22, 371–381 CrossRef CAS PubMed.
- M. F. Khana, G. Cazzato, H. A. Saleemi, R. R. Macadangdang Jr, M. N. Aftabe, M. Ismailf, H. Khalidg, S. Ali, S. U. H. Bakhtiar, A. Ismail and M. Zahid, J. Mol. Struct., 2022, 1247, 131397, DOI:10.1016/j.molstruc.2021.131397.
- C. M. Magdalanea, K. Kaviyarasuc, N. Matinisec, N. Mayedwac, N. Mongwaketsic, D. Letsholathebe, G. T. Mola, N. AbdullahAl-Dhabi, M. V. Arasu, M. Heninic, J. Kennedyc, M. Maaza and B. Jeyaraj, S. Afr. J. Chem. Eng., 2018, 26, 49–60 Search PubMed.
- P. Rodlamul, S. Tamura and N. Imanaka, Bull. Chem. Soc. Jpn., 2019, 92, 585–591 CrossRef CAS.
- J. Ouyang, Z. Zhao, S. L. Suib and H. Yang, J. Colloid Interface Sci., 2019, 539, 135–145 CrossRef CAS PubMed.
- V. Gadore, S. R. Mishra and M. Ahmaruzzaman, Sci. Rep., 2023, 13, 7708, DOI:10.1038/s41598-023-34742-3.
- X. Wang, F. Wang, Y. Sang and H. Liu, Adv. Energy Mater., 2017, 7, 1700473, DOI:10.1002/aenm.201700473.
- A. Ilyas, K. Rafiq, M. Z. Abid, A. Rauf and E. Hussain, RSC Adv., 2023, 13, 2379–2391 RSC.
- L. Wolski, K. Grzelak, M. Munko, M. Frankowski, T. Grzyb and G. Nowaczyk, Appl. Surf. Sci., 2021, 563, 150338, DOI:10.1016/j.apsusc.2021.150338.
- J. Liqianga, Q. Yichuna, W. Baiqia, L. Shudan, J. Baojianga, Y. Libina, F. Wei, F. Hongganga and S. Jiazhong, Sol. Energy Mater. Sol. Cells, 2006, 90, 1773–1787 CrossRef.
- R. A. Shathy, S. A. Fahim, M. Sarker, M. S. Quddus, M. Moniruzzaman, S. M. Masum and M. A. I. Molla, Catalysts, 2022, 12(3), 308, DOI:10.3390/catal12030308.
- Y. H. Chiu, T. F. M. Chang, C. Y. Chen, M. Sone and Y. J. Hsu, Catalysts, 2019, 9(5), 430, DOI:10.3390/catal9050430.
- M. J. Fang, C. W. Tsao and Y. J. Hsu, J. Phys. D: Appl. Phys., 2020, 53, 143001, DOI:10.1088/1361-6463/ab5f25.
- C. W. Tsao, M. J. Fang and Y. J. Hsu, Coord. Chem. Rev., 2021, 438, 213876, DOI:10.1016/j.ccr.2021.213876.
- X. Bi, S. Yu, E. Liu, X. Yin, Y. Zhao and W. Xiong, RSC Adv., 2020, 10, 524 RSC.
- A. Hezama, K. Namrathaa, Q. A. Drmoshb, Z. H. Yamanib and K. Byrappa, Ceram. Int., 2017, 43, 5292–5301 CrossRef.
- R. Manikandan, P. N. Deepa and S. S. Narayanan, J. Solid State Electrochem., 2017, 21, 3567–3578 CrossRef CAS.
- F. Mousli, A. Chaouchi, M. Jouini, F. Maurel, A. Kadri and M. M. Chehimi, Catalysts, 2019, 9(7), 578, DOI:10.3390/catal9070578.
|
| This journal is © The Royal Society of Chemistry 2023 |
Click here to see how this site uses Cookies. View our privacy policy here. 
 Open Access Article
 This Open Access Article is licensed under a Creative Commons Attribution-Non Commercial 3.0 Unported Licence
 *a
*a