 Open Access Article
Removal of hydrogen sulfide in the gas phase by carbide slag modified bentonite
Qi Jianga,
Ming Jiang *a,
Tianci Hanb,
Yongmei He
 a,
Tianguo Lia,
Jilai Zhanga,
Youbo Sua,
Yonglin Wua,
Bo Diana and
Yonglan Zonga
aCollege of Resources and Environment, Yunnan Agricultural University, Kunming, China. E-mail: mingjiang2010@163.com
bShandong Pengrun New Materials Co. Ltd., Jining, China
First published on 11th July 2023
Abstract
Bentonite-based adsorbents for the removal of hydrogen sulfide (H2S) were prepared by a wet-mixing method using carbide slag as the active component. The effects of carbide slag content, calcination temperature, calcination time, and reaction temperature on the H2S adsorption capacity were investigated. The results showed that compared with the blank bentonite adsorbent, the carbide slag-modified bentonite-based adsorbent enhanced the chemisorption of H2S. The adsorption capacity of the carbide slag modified bentonite adsorbent (2.50 mg g−1) was more than 40 times higher than that of the blank bentonite-based adsorbent (0.06 mg g−1) under optimal conditions. The optimal conditions for H2S removal were 3![[thin space (1/6-em)]](https://www.rsc.org/images/entities/char_2009.gif) :
:![[thin space (1/6-em)]](https://www.rsc.org/images/entities/char_2009.gif) 5 ratio of carbide slag-to-bentonite, calcination temperature of 450 °C for 2 h, and reaction temperature of 95 °C. H2S was mainly removed in the mesopores and macropores of the adsorbent and was finally transformed to CaS and sulfate on the adsorbent surface. The adsorption process of H2S followed the Freundlich adsorption isotherm equation and Bangham adsorption kinetic model.
5 ratio of carbide slag-to-bentonite, calcination temperature of 450 °C for 2 h, and reaction temperature of 95 °C. H2S was mainly removed in the mesopores and macropores of the adsorbent and was finally transformed to CaS and sulfate on the adsorbent surface. The adsorption process of H2S followed the Freundlich adsorption isotherm equation and Bangham adsorption kinetic model.
1. Introduction
Hydrogen sulfide (H2S) is a highly toxic compound with an irritating odor that is produced during natural gas production, the processing of coal and its derivatives, oil refining, sewage treatment plants, and landfills.1 H2S can seriously corrode equipment and pipelines and must be treated before being discharged into the environment.2,3 Currently, the industrial removal of H2S is primarily performed by wet removal methods, but the green removal of H2S is difficult.4–6 Dry desulfurization methods are simple, stable, and produce little secondary pollution.7–9 Adsorption is the most commonly used dry desulfurization method, but during the H2S adsorption, the loss of adsorbent is large, which decreases the desulfurization effect and increases the cost of its removal and purification.Bentonite is a non-metallic mineral with montmorillonite as its main mineral component. It is one of the most abundant clay minerals in the world and has been used because of its good water absorption, swelling properties, and non-toxicity.10–12 Bentonite is also used in environmentally friendly materials. Stepova et al.13 used metal-modified carbonate-rich bentonite for the purification of H2S in low concentration exhaust gases. The results showed that the iron-modified and copper-modified bentonite adsorbents had almost 100% H2S removal capacity by 15 min and 25 min, respectively. Similar results were obtained by Nguyen-Thanh et al. who used metal-modified bentonite compounded with activated carbon for H2S purification.14 The results showed that 3000 ppm H2S could be almost completely removed by the copper-modified adsorbent by 10 min. Currently, bentonite-based adsorbents for H2S removal are usually modified using iron chloride solution or copper chloride solution.13,14 However, the formation of Fe2S3 and CuS is a challenge for the effective utilization of such type adsorbents. The utilization of solid waste can ensure green development goals are achieved, and waste-to-waste technologies have emerged as a new idea for the comprehensive utilization of waste. Bentonite-based adsorbents can be modified with waste material and used for H2S removal.
Carbide slag is a highly alkaline and relatively loose surface solid waste residue produced by the hydrolysis of calcium carbide to produce acetylene for PVC production. Its main component is Ca(OH)2.15 The global annual production of carbide slag is huge, each 1 ton of PVC produces about 1.5–2 tons of carbide slag by-product, and the massive dumping of carbide slag poses a serious threat to the environment.16 Therefore, scholars have utilized the high alkalinity of carbide slag to prepare materials to remove SO2, HCl, fixed CO2.16,17 However, composites containing carbide slag have not been used for H2S removal.
In this paper, a carbide slag-modified bentonite adsorbent for H2S removal was prepared. The effects of carbide slag content, calcination temperature, calcination time, and adsorption temperature on the adsorptive removal of H2S were investigated by H2S removal efficiency curves. The adsorption characteristics of H2S on the adsorbent were analyzed by SEM, N2-BET, FTIR spectroscopy, Raman spectroscopy, XRD, and XPS. The H2S adsorption isotherms and kinetic were also explored.
2. Experimental
2.1. Materials
Activated bentonite (noted as AB) was obtained by the high-temperature calcination of sodium-based bentonite at 450 °C for 2 h.
Carbide slag (noted as CS) was collected from a calcium carbide plant in An Ning, Yunnan Province, China.
| Name of adsorbent | Mass ratio of raw materials | Calcination temperature | Calcination time |
|---|---|---|---|
| CK-B | Bentonite![[thin space (1/6-em)]](https://www.rsc.org/images/entities/char_2009.gif) : :![[thin space (1/6-em)]](https://www.rsc.org/images/entities/char_2009.gif) Water = 5 Water = 5![[thin space (1/6-em)]](https://www.rsc.org/images/entities/char_2009.gif) : :![[thin space (1/6-em)]](https://www.rsc.org/images/entities/char_2009.gif) 2, wt/wt 2, wt/wt |
— | — |
| C-B | Bentonite![[thin space (1/6-em)]](https://www.rsc.org/images/entities/char_2009.gif) : :![[thin space (1/6-em)]](https://www.rsc.org/images/entities/char_2009.gif) Water = 5 Water = 5![[thin space (1/6-em)]](https://www.rsc.org/images/entities/char_2009.gif) : :![[thin space (1/6-em)]](https://www.rsc.org/images/entities/char_2009.gif) 2, wt/wt 2, wt/wt |
450 °C | 2 h |
| CK-AB | Activated bentonite![[thin space (1/6-em)]](https://www.rsc.org/images/entities/char_2009.gif) : :![[thin space (1/6-em)]](https://www.rsc.org/images/entities/char_2009.gif) Water = 3 Water = 3![[thin space (1/6-em)]](https://www.rsc.org/images/entities/char_2009.gif) : :![[thin space (1/6-em)]](https://www.rsc.org/images/entities/char_2009.gif) 2, wt/wt 2, wt/wt |
— | — |
| C-AB | Activated bentonite![[thin space (1/6-em)]](https://www.rsc.org/images/entities/char_2009.gif) : :![[thin space (1/6-em)]](https://www.rsc.org/images/entities/char_2009.gif) Water = 3 Water = 3![[thin space (1/6-em)]](https://www.rsc.org/images/entities/char_2009.gif) : :![[thin space (1/6-em)]](https://www.rsc.org/images/entities/char_2009.gif) 2, wt/wt 2, wt/wt |
450 °C | 2 h |
CS-B (1![[thin space (1/6-em)]](https://www.rsc.org/images/entities/char_2009.gif) : :![[thin space (1/6-em)]](https://www.rsc.org/images/entities/char_2009.gif) 5) 5) |
Carbide slag![[thin space (1/6-em)]](https://www.rsc.org/images/entities/char_2009.gif) : :![[thin space (1/6-em)]](https://www.rsc.org/images/entities/char_2009.gif) Bentonite Bentonite![[thin space (1/6-em)]](https://www.rsc.org/images/entities/char_2009.gif) : :![[thin space (1/6-em)]](https://www.rsc.org/images/entities/char_2009.gif) Water = 1 Water = 1![[thin space (1/6-em)]](https://www.rsc.org/images/entities/char_2009.gif) : :![[thin space (1/6-em)]](https://www.rsc.org/images/entities/char_2009.gif) 5 5![[thin space (1/6-em)]](https://www.rsc.org/images/entities/char_2009.gif) : :![[thin space (1/6-em)]](https://www.rsc.org/images/entities/char_2009.gif) 3.5, wt/wt/wt 3.5, wt/wt/wt |
— | — |
C-CS-B (1![[thin space (1/6-em)]](https://www.rsc.org/images/entities/char_2009.gif) : :![[thin space (1/6-em)]](https://www.rsc.org/images/entities/char_2009.gif) 5) 5) |
Carbide slag![[thin space (1/6-em)]](https://www.rsc.org/images/entities/char_2009.gif) : :![[thin space (1/6-em)]](https://www.rsc.org/images/entities/char_2009.gif) Bentonite Bentonite![[thin space (1/6-em)]](https://www.rsc.org/images/entities/char_2009.gif) : :![[thin space (1/6-em)]](https://www.rsc.org/images/entities/char_2009.gif) Water = 1 Water = 1![[thin space (1/6-em)]](https://www.rsc.org/images/entities/char_2009.gif) : :![[thin space (1/6-em)]](https://www.rsc.org/images/entities/char_2009.gif) 5 5![[thin space (1/6-em)]](https://www.rsc.org/images/entities/char_2009.gif) : :![[thin space (1/6-em)]](https://www.rsc.org/images/entities/char_2009.gif) 3.5, wt/wt/wt 3.5, wt/wt/wt |
450 °C | 2 h |
CS-B (2![[thin space (1/6-em)]](https://www.rsc.org/images/entities/char_2009.gif) : :![[thin space (1/6-em)]](https://www.rsc.org/images/entities/char_2009.gif) 5) 5) |
Carbide slag![[thin space (1/6-em)]](https://www.rsc.org/images/entities/char_2009.gif) : :![[thin space (1/6-em)]](https://www.rsc.org/images/entities/char_2009.gif) Bentonite Bentonite![[thin space (1/6-em)]](https://www.rsc.org/images/entities/char_2009.gif) : :![[thin space (1/6-em)]](https://www.rsc.org/images/entities/char_2009.gif) Water = 2 Water = 2![[thin space (1/6-em)]](https://www.rsc.org/images/entities/char_2009.gif) : :![[thin space (1/6-em)]](https://www.rsc.org/images/entities/char_2009.gif) 5 5![[thin space (1/6-em)]](https://www.rsc.org/images/entities/char_2009.gif) : :![[thin space (1/6-em)]](https://www.rsc.org/images/entities/char_2009.gif) 4.5, wt/wt/wt 4.5, wt/wt/wt |
— | — |
C-CS-B (2![[thin space (1/6-em)]](https://www.rsc.org/images/entities/char_2009.gif) : :![[thin space (1/6-em)]](https://www.rsc.org/images/entities/char_2009.gif) 5) 5) |
Carbide slag![[thin space (1/6-em)]](https://www.rsc.org/images/entities/char_2009.gif) : :![[thin space (1/6-em)]](https://www.rsc.org/images/entities/char_2009.gif) Bentonite Bentonite![[thin space (1/6-em)]](https://www.rsc.org/images/entities/char_2009.gif) : :![[thin space (1/6-em)]](https://www.rsc.org/images/entities/char_2009.gif) Water = 2 Water = 2![[thin space (1/6-em)]](https://www.rsc.org/images/entities/char_2009.gif) : :![[thin space (1/6-em)]](https://www.rsc.org/images/entities/char_2009.gif) 5 5![[thin space (1/6-em)]](https://www.rsc.org/images/entities/char_2009.gif) : :![[thin space (1/6-em)]](https://www.rsc.org/images/entities/char_2009.gif) 4.5, wt/wt/wt 4.5, wt/wt/wt |
450 °C | 2 h |
CS-B (3![[thin space (1/6-em)]](https://www.rsc.org/images/entities/char_2009.gif) : :![[thin space (1/6-em)]](https://www.rsc.org/images/entities/char_2009.gif) 5) 5) |
Carbide slag![[thin space (1/6-em)]](https://www.rsc.org/images/entities/char_2009.gif) : :![[thin space (1/6-em)]](https://www.rsc.org/images/entities/char_2009.gif) Bentonite Bentonite![[thin space (1/6-em)]](https://www.rsc.org/images/entities/char_2009.gif) : :![[thin space (1/6-em)]](https://www.rsc.org/images/entities/char_2009.gif) Water = 3 Water = 3![[thin space (1/6-em)]](https://www.rsc.org/images/entities/char_2009.gif) : :![[thin space (1/6-em)]](https://www.rsc.org/images/entities/char_2009.gif) 5 5![[thin space (1/6-em)]](https://www.rsc.org/images/entities/char_2009.gif) : :![[thin space (1/6-em)]](https://www.rsc.org/images/entities/char_2009.gif) 5, wt/wt/wt 5, wt/wt/wt |
— | — |
C-CS-B (3![[thin space (1/6-em)]](https://www.rsc.org/images/entities/char_2009.gif) : :![[thin space (1/6-em)]](https://www.rsc.org/images/entities/char_2009.gif) 5) 5) |
Carbide slag![[thin space (1/6-em)]](https://www.rsc.org/images/entities/char_2009.gif) : :![[thin space (1/6-em)]](https://www.rsc.org/images/entities/char_2009.gif) Bentonite Bentonite![[thin space (1/6-em)]](https://www.rsc.org/images/entities/char_2009.gif) : :![[thin space (1/6-em)]](https://www.rsc.org/images/entities/char_2009.gif) Water = 3 Water = 3![[thin space (1/6-em)]](https://www.rsc.org/images/entities/char_2009.gif) : :![[thin space (1/6-em)]](https://www.rsc.org/images/entities/char_2009.gif) 5 5![[thin space (1/6-em)]](https://www.rsc.org/images/entities/char_2009.gif) : :![[thin space (1/6-em)]](https://www.rsc.org/images/entities/char_2009.gif) 5, wt/wt/wt 5, wt/wt/wt |
450 °C | 2 h |
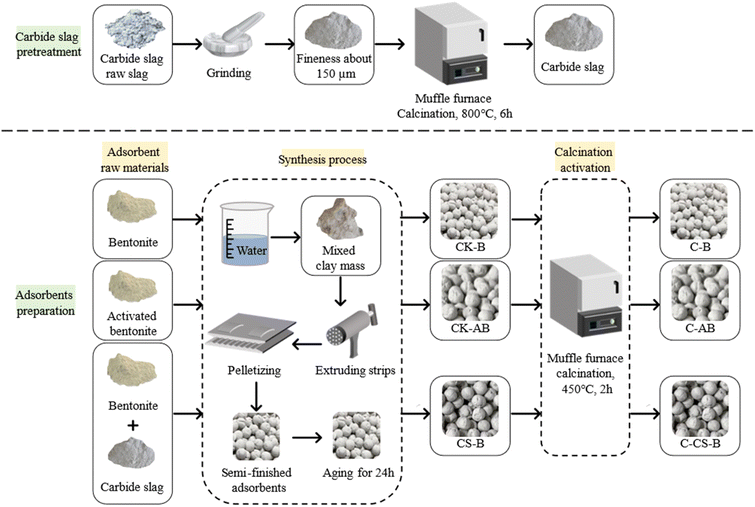
Activated bentonite does not bond well with calcium carbide slag; therefore, a total of 10 adsorbents were prepared, which were noted as CK-B, CK-AB, C-B, C-AB, CS-B (1![[thin space (1/6-em)]](https://www.rsc.org/images/entities/char_2009.gif) :
:![[thin space (1/6-em)]](https://www.rsc.org/images/entities/char_2009.gif) 5), CS-B (2
5), CS-B (2![[thin space (1/6-em)]](https://www.rsc.org/images/entities/char_2009.gif) :
:![[thin space (1/6-em)]](https://www.rsc.org/images/entities/char_2009.gif) 5), CS-B (3
5), CS-B (3![[thin space (1/6-em)]](https://www.rsc.org/images/entities/char_2009.gif) :
:![[thin space (1/6-em)]](https://www.rsc.org/images/entities/char_2009.gif) 5), C-CS-B (1
5), C-CS-B (1![[thin space (1/6-em)]](https://www.rsc.org/images/entities/char_2009.gif) :
:![[thin space (1/6-em)]](https://www.rsc.org/images/entities/char_2009.gif) 5), C-CS-B (2
5), C-CS-B (2![[thin space (1/6-em)]](https://www.rsc.org/images/entities/char_2009.gif) :
:![[thin space (1/6-em)]](https://www.rsc.org/images/entities/char_2009.gif) 5), and C-CS-B (3
5), and C-CS-B (3![[thin space (1/6-em)]](https://www.rsc.org/images/entities/char_2009.gif) :
:![[thin space (1/6-em)]](https://www.rsc.org/images/entities/char_2009.gif) 5). The maximum loading of carbide slag on bentonite under the experimental conditions was 3
5). The maximum loading of carbide slag on bentonite under the experimental conditions was 3![[thin space (1/6-em)]](https://www.rsc.org/images/entities/char_2009.gif) :
:![[thin space (1/6-em)]](https://www.rsc.org/images/entities/char_2009.gif) 5, beyond which the adsorbent could not be bonded into shape.
5, beyond which the adsorbent could not be bonded into shape.
Fig. 1 shows the preparation process of the adsorbents. Volatile impurities were removed from carbide slag by calcination. The diameter specification of the extrusion machine and ball rolling board was 3 mm; therefore, the diameter of the prepared spherical adsorbents was 3 mm. During aging, the raw material needs to be evenly infiltrated by water to prevent the disintegration of the adsorbent due to water vaporization during calcination. The aging time was generally 24 h.
2.2. Analysis and characterization methods
Scanning electron microscopy (SEM) images were obtained on Nova NanoSEM field emission scanning electron microscope (Frequency Electronics, Inc., USA). Chromium was used as a conductive material to coat the samples.N2-BET isotherms were measured with a Quadrasorb Evo fully-automatic specific surface and pore size distribution analyzer (Quantachrome, Inc., USA).
Raman spectra were collected with a LabRAM HR Evolution Raman spectrometer (Horiba, Inc., Japan). The wavenumber range was 50–4000 cm−1.
X-ray diffraction (XRD) measurements were performed using an X'Pert3 powder X-ray diffractometer (PANalytical, Inc., Netherlands).
X-ray photoelectron spectroscopy (XPS) was carried out using a K-Alpha X-ray photoelectron spectrometer (Horiba, Inc., Japan). The excitation source was Al Kα rays (hv = 1486.6 eV) with a beam spot of 400 μm.
FTIR spectra were collected using a Nicolet iS10 FTIR spectrometer (Thermo Fisher, Inc., USA). The wavenumber range was 4000–400 cm−1.
TD-DTG was collected with HCT-1 synchronous TG-DTA thermal analyzer (Beijing Hengjiu Experimental Equipment Co. Ltd., China).
2.3. H2S breakthrough capacity
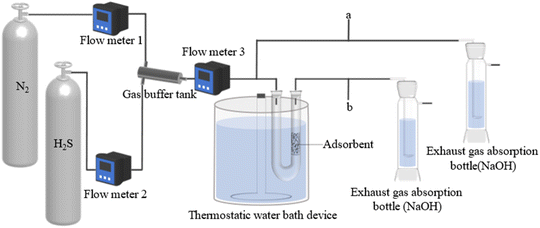
A dynamic H2S adsorption device was designed under laboratory conditions to evaluate the ability of the adsorbent to remove H2S, in Fig. 2. A mixture of H2S and N2 was flowed into the gas buffer tank and obtained the desired H2S concentration (850 mg m−3). The total gas flow rate was adjusted to 100 mL min−1. U-shaped glass tubes (inner diameter 17 mm) were used to fix the adsorbent. The pre-sorption H2S concentration was labeled as C0 and the post-sorption H2S concentration was labeled as C. The mass of the adsorbent was 5 g. The concentration of H2S was measured using a gas chromatograph (GC9790II, Zhe Jiang Fuli Analytical Instruments Co., Ltd., China). The test was stopped after the penetration point concentration, which was defined as 10% of the pre-adsorbed H2S concentration (C/C0 = 0.1).18 After the test, the adsorption capacity of H2S was calculated with the following integral formula:19
 | (1) |
In this formula, q is the adsorption capacity (mg g−1); Q is the total gas flow (m3 min−1); t is the adsorption time (min); C0 is the pre-sorption H2S concentration (mg m−3); C is the post-sorption H2S concentration (mg m−3); m is the adsorbent quality (g).
3. Results and discussion
3.1. Adsorption of H2S by different types of bentonite-based adsorbents
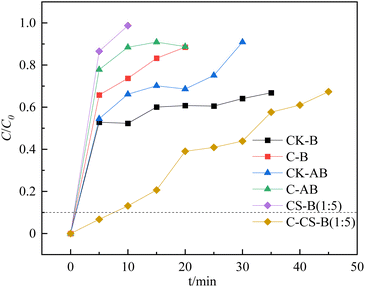
The hydrogen sulfide breakthrough capacity curves for the prepared bentonite adsorbents are presented in Fig. 3. Only the adsorbents modified by carbide slag with high-temperature activation showed a higher H2S adsorption capacity. Except for C-CS-B (1![[thin space (1/6-em)]](https://www.rsc.org/images/entities/char_2009.gif) :
:![[thin space (1/6-em)]](https://www.rsc.org/images/entities/char_2009.gif) 5), other adsorbents rapidly penetrated and deactivated at the start of the test.
5), other adsorbents rapidly penetrated and deactivated at the start of the test.
According to the H2S breakthrough curves, the breakthrough adsorption capacities of CK-B, C-B, CK-AB, C-AB, CS-B (1![[thin space (1/6-em)]](https://www.rsc.org/images/entities/char_2009.gif) :
:![[thin space (1/6-em)]](https://www.rsc.org/images/entities/char_2009.gif) 5), and C-CS-B (1
5), and C-CS-B (1![[thin space (1/6-em)]](https://www.rsc.org/images/entities/char_2009.gif) :
:![[thin space (1/6-em)]](https://www.rsc.org/images/entities/char_2009.gif) 5) were 0.06, 0.06, 0.06, 0.05, 0.05, and 0.23 mg g−1, respectively. Comparing these adsorbents shows that high-temperature calcination negatively affected the single bentonite adsorbent, while the bentonite adsorbent loaded with carbide slag was suitable for high-temperature activation. The excellent adsorption performance of C-CS-B (1
5) were 0.06, 0.06, 0.06, 0.05, 0.05, and 0.23 mg g−1, respectively. Comparing these adsorbents shows that high-temperature calcination negatively affected the single bentonite adsorbent, while the bentonite adsorbent loaded with carbide slag was suitable for high-temperature activation. The excellent adsorption performance of C-CS-B (1![[thin space (1/6-em)]](https://www.rsc.org/images/entities/char_2009.gif) :
:![[thin space (1/6-em)]](https://www.rsc.org/images/entities/char_2009.gif) 5) may be due to the active groups formed after the introduction of Ca(OH)2.
5) may be due to the active groups formed after the introduction of Ca(OH)2.
3.2. Evaluation of the performance of H2S removal
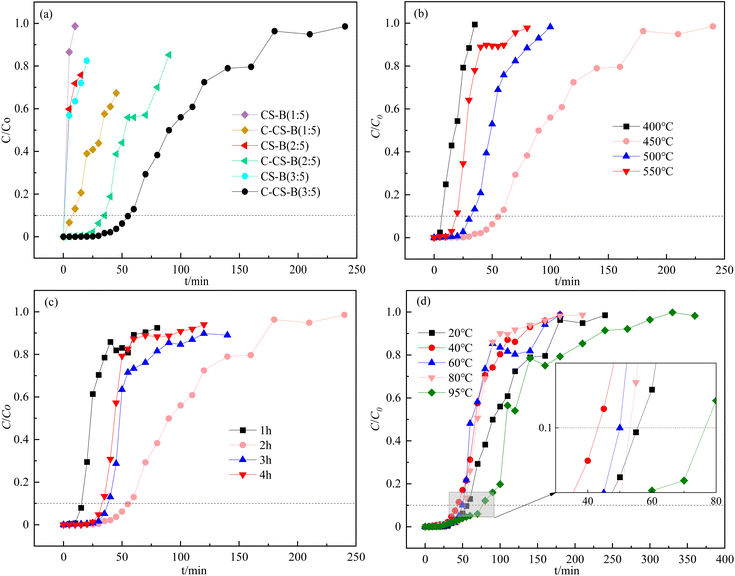
The effects of the carbide slag content on CS-B adsorbents for H2S adsorption removal are shown in Fig. 4(a). According to the adsorption experiments, the carbide slag content was important for removing H2S. Fig. 4(a) shows that the H2S removal efficiency was enhanced upon increasing the carbide slag content. When the ratio of carbide slag to bentonite was 3![[thin space (1/6-em)]](https://www.rsc.org/images/entities/char_2009.gif) :
:![[thin space (1/6-em)]](https://www.rsc.org/images/entities/char_2009.gif) 5, the H2S penetration time of C-CS-B (3
5, the H2S penetration time of C-CS-B (3![[thin space (1/6-em)]](https://www.rsc.org/images/entities/char_2009.gif) :
:![[thin space (1/6-em)]](https://www.rsc.org/images/entities/char_2009.gif) 5) was extended to about 55 min. And the presence of H2S is barely detectable until 30 minutes. In the study by Stepova et al.13 using Fe-modified bentonite and Cu-modified bentonite for H2S removal, the time of appearance of H2S at the outlet was about 17 min and 25 min, respectively. Therefore, carbide slag modified bentonite seems to have more potential for H2S removal. In addition, the breakthrough adsorption capacity increased from an initial value of 0.06 mg g−1 (CK-B) to 0.92 mg g−1. Therefore, the carbide slag content directly affected the adsorption activity. Properly increasing the carbide slag content in the adsorbent increased the coverage of the active sites on the bentonite and accelerated the desulfurization reaction.
5) was extended to about 55 min. And the presence of H2S is barely detectable until 30 minutes. In the study by Stepova et al.13 using Fe-modified bentonite and Cu-modified bentonite for H2S removal, the time of appearance of H2S at the outlet was about 17 min and 25 min, respectively. Therefore, carbide slag modified bentonite seems to have more potential for H2S removal. In addition, the breakthrough adsorption capacity increased from an initial value of 0.06 mg g−1 (CK-B) to 0.92 mg g−1. Therefore, the carbide slag content directly affected the adsorption activity. Properly increasing the carbide slag content in the adsorbent increased the coverage of the active sites on the bentonite and accelerated the desulfurization reaction.
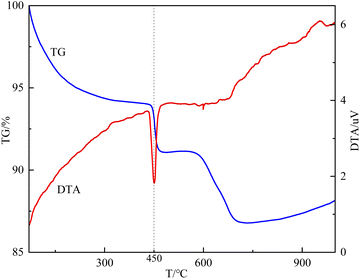
As mentioned in Fig. 1, the calcination temperature of the carbide slag-modified bentonite adsorbent (CS-B) was 450 °C. This temperature was chosen based on the TG-DTA curve of the sample CS-B, as shown in Fig. 5. The TG curve showed an obvious weight loss plateau in the range of 430–475 °C, corresponding to heat absorption decomposition peak in the DTA curve. This indicated that phase transformations occurred in the CS-B (3![[thin space (1/6-em)]](https://www.rsc.org/images/entities/char_2009.gif) :
:![[thin space (1/6-em)]](https://www.rsc.org/images/entities/char_2009.gif) 5) adsorbent at 430–475 °C, which changed its adsorption performance. To accurately determine the optimum temperature and time for adsorbent activation, a single-factor experiment was conducted to examine the effect of the calcination temperature and time. Both the calcination temperature and calcination time greatly influenced the H2S adsorption capacity. In agreement with the results in TG-DTA curves, 450 °C was the optimal calcination temperature (Fig. 4(b)). Fig. 4(c) confirms that 2 h was the optimal calcination time. When the calcination was low or the calcination time was too short, no reaction between carbide slag and bentonite was observed. The surface physicochemical properties of the adsorbent were insufficient to support the adsorption of large amounts of H2S. A high calcination temperature or long calcination time might sinter the adsorbent, which will reduce the adsorption performance of H2S
5) adsorbent at 430–475 °C, which changed its adsorption performance. To accurately determine the optimum temperature and time for adsorbent activation, a single-factor experiment was conducted to examine the effect of the calcination temperature and time. Both the calcination temperature and calcination time greatly influenced the H2S adsorption capacity. In agreement with the results in TG-DTA curves, 450 °C was the optimal calcination temperature (Fig. 4(b)). Fig. 4(c) confirms that 2 h was the optimal calcination time. When the calcination was low or the calcination time was too short, no reaction between carbide slag and bentonite was observed. The surface physicochemical properties of the adsorbent were insufficient to support the adsorption of large amounts of H2S. A high calcination temperature or long calcination time might sinter the adsorbent, which will reduce the adsorption performance of H2S
The adsorption reaction temperature is one of the most important factors affecting the adsorption of H2S by adsorbents. According to Fig. 4(d), upon increasing the adsorption temperature, the H2S adsorption capacity decreased and then increased. As observed, when the adsorption temperature increased from 20 °C to 40 °C, the penetration time decreased from about 55 min to 45 min. And when the adsorption temperature continued to increase, the breakthrough time increased until the maximum value was reached at 95 °C, at which time the breakthrough time was about 75 min and the adsorption capacity was about 2.50 mg g−1. Therefore, the adsorption process of H2S on C-CS-B (3![[thin space (1/6-em)]](https://www.rsc.org/images/entities/char_2009.gif) :
:![[thin space (1/6-em)]](https://www.rsc.org/images/entities/char_2009.gif) 5) was divided into two stages, which indicated that the mechanism of H2S adsorption on C-CS-B (3
5) was divided into two stages, which indicated that the mechanism of H2S adsorption on C-CS-B (3![[thin space (1/6-em)]](https://www.rsc.org/images/entities/char_2009.gif) :
:![[thin space (1/6-em)]](https://www.rsc.org/images/entities/char_2009.gif) 5) adsorbent may be a physical and chemical adsorption process. This phenomenon might be caused that in the low temperature stage (20–40 °C), the physical adsorption process was inhibited as the temperature increased and showed a tendency to decrease the adsorption performance. While the reaction temperature exceeds 40 °C, the adsorption process was dominated by endothermic chemical reaction process, which showed the best adsorption performance at 95 °C. In particular, the adsorption capacity of C-CS-B (3
5) adsorbent may be a physical and chemical adsorption process. This phenomenon might be caused that in the low temperature stage (20–40 °C), the physical adsorption process was inhibited as the temperature increased and showed a tendency to decrease the adsorption performance. While the reaction temperature exceeds 40 °C, the adsorption process was dominated by endothermic chemical reaction process, which showed the best adsorption performance at 95 °C. In particular, the adsorption capacity of C-CS-B (3![[thin space (1/6-em)]](https://www.rsc.org/images/entities/char_2009.gif) :
:![[thin space (1/6-em)]](https://www.rsc.org/images/entities/char_2009.gif) 5) was more than 40 times higher than that of CK-B (0.06 mg g−1) at the optimal conditions of 95 °C. In the study by Nguyen-Thanh et al.14 the CuCl2 modification of activated carbons with bentonite resulted in a 5 times higher H2S breakthrough capacity of the modified adsorbent than the blank adsorbent. In this way, the modification of bentonite with carbide slag may provide better performance in H2S removal.
5) was more than 40 times higher than that of CK-B (0.06 mg g−1) at the optimal conditions of 95 °C. In the study by Nguyen-Thanh et al.14 the CuCl2 modification of activated carbons with bentonite resulted in a 5 times higher H2S breakthrough capacity of the modified adsorbent than the blank adsorbent. In this way, the modification of bentonite with carbide slag may provide better performance in H2S removal.
3.3. H2S adsorption isotherms and kinetic
The H2S adsorption equilibrium curves over C-CS-B (3![[thin space (1/6-em)]](https://www.rsc.org/images/entities/char_2009.gif) :
:![[thin space (1/6-em)]](https://www.rsc.org/images/entities/char_2009.gif) 5) were drawn based on the points where the exit concentrations were 99% of the entrance concentrations (C/C0 = 99%) of 140, 280, 421, 561, 701, and 841 mg m−3 at different temperatures according to eqn (1) calculation of adsorption capacities.19,20 The adsorption isotherms of H2S on C-CS-B (3
5) were drawn based on the points where the exit concentrations were 99% of the entrance concentrations (C/C0 = 99%) of 140, 280, 421, 561, 701, and 841 mg m−3 at different temperatures according to eqn (1) calculation of adsorption capacities.19,20 The adsorption isotherms of H2S on C-CS-B (3![[thin space (1/6-em)]](https://www.rsc.org/images/entities/char_2009.gif) :
:![[thin space (1/6-em)]](https://www.rsc.org/images/entities/char_2009.gif) 5) were measured, and the results are shown in Fig. 6. The experimental data were analyzed following the isotherm models of Langmuir, Freundlich, and Temkin, and the parameters are listed in Table 2. Comparison of the correlation coefficients in Table 2 shows that the data were best-fitted by the Freundlich equation, implying that H2S sorption is a surface sorption process.21
5) were measured, and the results are shown in Fig. 6. The experimental data were analyzed following the isotherm models of Langmuir, Freundlich, and Temkin, and the parameters are listed in Table 2. Comparison of the correlation coefficients in Table 2 shows that the data were best-fitted by the Freundlich equation, implying that H2S sorption is a surface sorption process.21
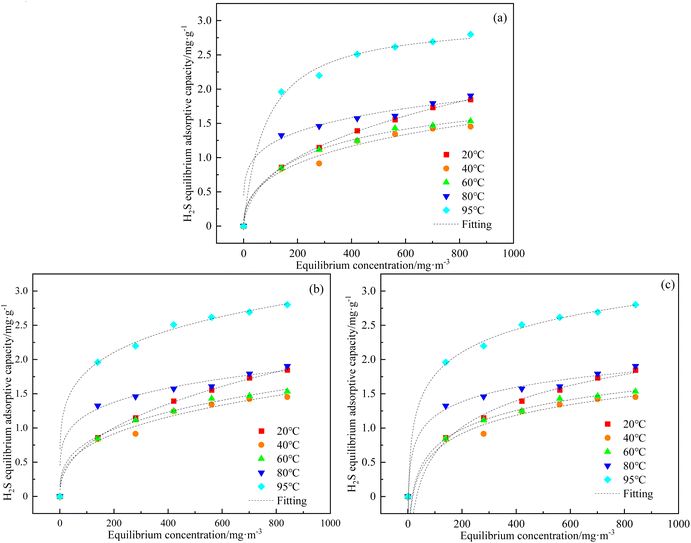 | ||
Fig. 6 (a) Langmuir; (b) Freundlich; (c) Temkin adsorption isotherm fits for H2S adsorption over C-CS-B (3![[thin space (1/6-em)]](https://www.rsc.org/images/entities/char_2009.gif) : :![[thin space (1/6-em)]](https://www.rsc.org/images/entities/char_2009.gif) 5). 5). | ||
![[thin space (1/6-em)]](https://www.rsc.org/images/entities/char_2009.gif) :
:![[thin space (1/6-em)]](https://www.rsc.org/images/entities/char_2009.gif) 5)
5)
| Isotherm model | Parameters | Temperature | ||||
|---|---|---|---|---|---|---|
| 20 °C | 40 °C | 60 °C | 80 °C | 95 °C | ||
| Langmuir | qm | 17.21922 | 5.23121 | 2.24395 | 55.00686 | 3.01403 |
| b | 0.00520 | 0.02022 | 0.01899 | 0.00849 | 0.01191 | |
| R2 | 0.99865 | 0.89846 | 0.98692 | 0.88666 | 0.94171 | |
| Freundlich | qmk | 0.10266 | 0.14741 | 0.17595 | 0.46926 | 0.71740 |
| n | 0.42999 | 0.34425 | 0.32466 | 0.20288 | 0.20299 | |
| R2 | 0.99888 | 0.92294 | 0.97946 | 0.91581 | 0.98049 | |
| Temkin | a0 | 0.03086 | 0.05482 | 0.06188 | 0.46446 | 0.40331 |
| f | 1.80063 | 2.60573 | 2.55853 | 3.27514 | 2.08390 | |
| R2 | 0.98464 | 0.91262 | 0.98957 | 0.88633 | 0.98043 | |
The Langmuir model is described by eqn (2):
| θ = q/qm = bc/(1 + bc) | (2) |
The fitted form of Langmuir model is described by eqn (3):
| q = qmbc/(1+bc) | (3) |
The Freundlich model is described by eqn (4):
| θ = q/qm = kcn | (4) |
The fitted form of Freundlich model is shown by eqn (5):
| q = qmkcn | (5) |
The Temkin model is described by eqn (6):
θ = q/qm = ln![[thin space (1/6-em)]](https://www.rsc.org/images/entities/char_2009.gif) a0c/f a0c/f
| (6) |
![[thin space (1/6-em)]](https://www.rsc.org/images/entities/char_2009.gif) a0)/f = a, 1/f = b, and a and b are the curve parameters. The fitted form of Temkin model is described by eqn (7):
a0)/f = a, 1/f = b, and a and b are the curve parameters. The fitted form of Temkin model is described by eqn (7):
θ = a + b![[thin space (1/6-em)]](https://www.rsc.org/images/entities/char_2009.gif) ln ln![[thin space (1/6-em)]](https://www.rsc.org/images/entities/char_2009.gif) c c
| (7) |
The adsorption capacity of H2S on C-CS-B (3![[thin space (1/6-em)]](https://www.rsc.org/images/entities/char_2009.gif) :
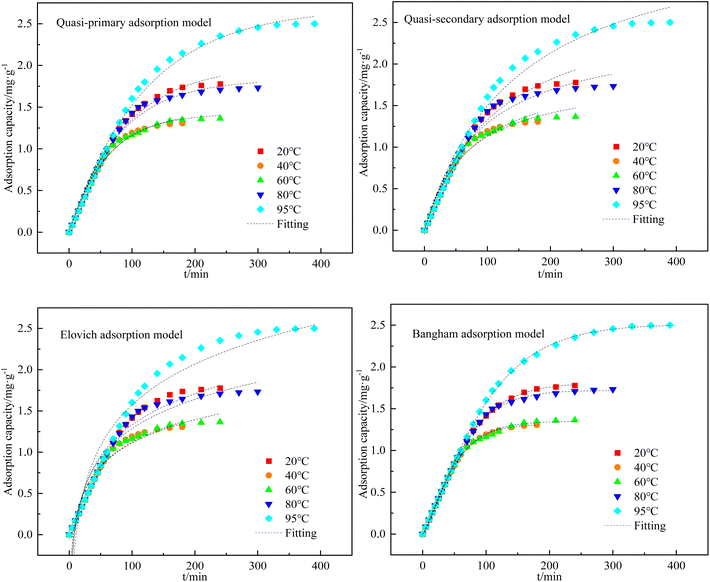
:![[thin space (1/6-em)]](https://www.rsc.org/images/entities/char_2009.gif) 5) at different adsorption temperatures was calculated by eqn (1). The quasi-primary adsorption model, quasi-secondary adsorption model, Elovich adsorption model, and Bangham adsorption model were used to fit the data and determine the adsorption kinetic model most applicable to this experiment. The fitting results are shown in Fig. 7, and the calculated fitting parameters for each kinetic model are shown in Table 3. The results showed that the coefficient of determination was R2 > 0.99 when fitting the data using the Bangham adsorption kinetic equation. Therefore, the Bangham adsorption kinetic model can describe the kinetic process of H2S adsorption by C-CS-B (3
5) at different adsorption temperatures was calculated by eqn (1). The quasi-primary adsorption model, quasi-secondary adsorption model, Elovich adsorption model, and Bangham adsorption model were used to fit the data and determine the adsorption kinetic model most applicable to this experiment. The fitting results are shown in Fig. 7, and the calculated fitting parameters for each kinetic model are shown in Table 3. The results showed that the coefficient of determination was R2 > 0.99 when fitting the data using the Bangham adsorption kinetic equation. Therefore, the Bangham adsorption kinetic model can describe the kinetic process of H2S adsorption by C-CS-B (3![[thin space (1/6-em)]](https://www.rsc.org/images/entities/char_2009.gif) :
:![[thin space (1/6-em)]](https://www.rsc.org/images/entities/char_2009.gif) 5).
5).
| Kinetic equation | Parameters | Temperature | ||||
|---|---|---|---|---|---|---|
| 20 °C | 40 °C | 60 °C | 80 °C | 95 °C | ||
| Quasi-primary | qe | 1.99974 | 1.44155 | 1.42475 | 1.83317 | 2.69068 |
| k1 | 0.01132 | 0.01630 | 0.01678 | 0.01291 | 0.00836 | |
| R2 | 0.99230 | 0.98985 | 0.99164 | 0.98860 | 0.99356 | |
| Quasi-secondary | qe | 2.85648 | 2.01711 | 1.88004 | 2.44068 | 3.69499 |
| k2 | 0.00304 | 0.00644 | 0.00793 | 0.00458 | 0.00184 | |
| R2 | 0.98487 | 0.98061 | 0.98008 | 0.97486 | 0.98545 | |
| Elovich | α | 0.20958 | 0.34527 | 0.37204 | 0.23987 | 0.12785 |
| β | 1.83150 | 2.38407 | 2.45062 | 1.95160 | 1.40386 | |
| R2 | 0.94178 | 0.95486 | 0.96044 | 0.94543 | 0.94003 | |
| Bangham | qe | 1.80602 | 1.31016 | 1.34950 | 1.71820 | 2.50985 |
| n | 1.25596 | 1.30355 | 1.22441 | 1.29637 | 1.22513 | |
| k | 0.00468 | 0.00599 | 0.00773 | 0.00430 | 0.00349 | |
| R2 | 0.99965 | 0.99924 | 0.99763 | 0.99886 | 0.99945 | |
The quasi-primary adsorption model differential equation is:
| dq/dt = k1(qe − qt) | (8) |
After integrating eqn (8) from t = 0 to t > 0 (q = 0 to q > 0), the conversion equation is obtained as:
| qt = qe − qee−k1t | (9) |
where qt is the adsorption capacity at t time (mg g−1); t is the adsorption time (min); qe is the adsorption capacity at equilibrium (mg g−1); k1 is the quasi-primary adsorption rate constant.
The quasi-secondary adsorption model differential equation is:
| dq/dt = k2(qe − qt)2 | (10) |
After integrating eqn (10) from t = 0 to t > 0 (q = 0 to q > 0), the conversion equation was obtained as:
| qt = k2qe2t/(1 + k2qet) | (11) |
The Elovich adsorption model expression is:
qt = (1/β)ln(α/β) + (1/β)ln![[thin space (1/6-em)]](https://www.rsc.org/images/entities/char_2009.gif) t t
| (12) |
The Bangham adsorption model differential equation is:
| dq/dt = k(qe − q)/tn | (13) |
Integration of eqn (13) yields:
 | (14) |
where n and k are constants, and the other meanings were the same as those in eqn (8)
3.4. Adsorbent characterization
![[thin space (1/6-em)]](https://www.rsc.org/images/entities/char_2009.gif) :
:![[thin space (1/6-em)]](https://www.rsc.org/images/entities/char_2009.gif) 3) was relatively flat, with small particles attached to the surface. This morphology might have been produced by the mixing of a large amount of carbide slag to fill the cracks on the bentonite surface, which reduced the specific surface area of the sample. The coverage of a large number of metal atoms made the adsorption of H2S tend more towards chemisorption. According to Fig. 8(b) and (c), the surface morphology of sample C-CS-B (5
3) was relatively flat, with small particles attached to the surface. This morphology might have been produced by the mixing of a large amount of carbide slag to fill the cracks on the bentonite surface, which reduced the specific surface area of the sample. The coverage of a large number of metal atoms made the adsorption of H2S tend more towards chemisorption. According to Fig. 8(b) and (c), the surface morphology of sample C-CS-B (5![[thin space (1/6-em)]](https://www.rsc.org/images/entities/char_2009.gif) :
:![[thin space (1/6-em)]](https://www.rsc.org/images/entities/char_2009.gif) 3) before and after H2S adsorption was similar, showing that the adsorption of H2S did not cause significant surface breakage or agglomeration. Sample C-CS-B (5
3) before and after H2S adsorption was similar, showing that the adsorption of H2S did not cause significant surface breakage or agglomeration. Sample C-CS-B (5![[thin space (1/6-em)]](https://www.rsc.org/images/entities/char_2009.gif) :
:![[thin space (1/6-em)]](https://www.rsc.org/images/entities/char_2009.gif) 3) was defined as C-CS-B (5
3) was defined as C-CS-B (5![[thin space (1/6-em)]](https://www.rsc.org/images/entities/char_2009.gif) :
:![[thin space (1/6-em)]](https://www.rsc.org/images/entities/char_2009.gif) 3)-H2S after the adsorption of H2S.
3)-H2S after the adsorption of H2S.
![[thin space (1/6-em)]](https://www.rsc.org/images/entities/char_2009.gif) :
:![[thin space (1/6-em)]](https://www.rsc.org/images/entities/char_2009.gif) 3) and C-CS-B (5
3) and C-CS-B (5![[thin space (1/6-em)]](https://www.rsc.org/images/entities/char_2009.gif) :
:![[thin space (1/6-em)]](https://www.rsc.org/images/entities/char_2009.gif) 3)-H2S also formed an insignificant H3 hysteresis loop. Due to the complex pore structure of the materials, the hysteresis ring reflects the characteristics of the integrated pore structure. Based on the analysis of the bentonite, samples CK-B, C-CS-B (5
3)-H2S also formed an insignificant H3 hysteresis loop. Due to the complex pore structure of the materials, the hysteresis ring reflects the characteristics of the integrated pore structure. Based on the analysis of the bentonite, samples CK-B, C-CS-B (5![[thin space (1/6-em)]](https://www.rsc.org/images/entities/char_2009.gif) :
:![[thin space (1/6-em)]](https://www.rsc.org/images/entities/char_2009.gif) 3), and C-CS-B (5
3), and C-CS-B (5![[thin space (1/6-em)]](https://www.rsc.org/images/entities/char_2009.gif) :
:![[thin space (1/6-em)]](https://www.rsc.org/images/entities/char_2009.gif) 3)-H2S were both laminar structures with flat slit-like pores and fissure pores.
3)-H2S were both laminar structures with flat slit-like pores and fissure pores.
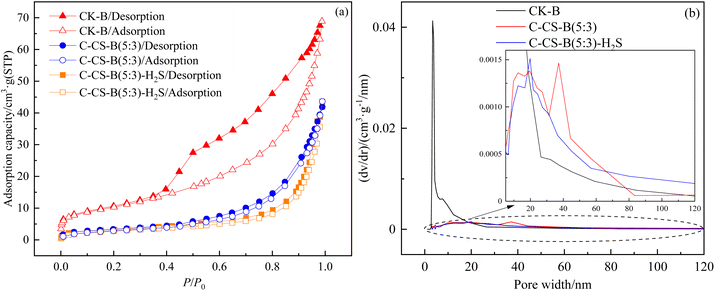 | ||
Fig. 9 N2 adsorption/desorption isotherms (a) and pore size distribution curves (b) for CK-B, C-CS-B (5![[thin space (1/6-em)]](https://www.rsc.org/images/entities/char_2009.gif) : :![[thin space (1/6-em)]](https://www.rsc.org/images/entities/char_2009.gif) 3) and C-CS-B (5 3) and C-CS-B (5![[thin space (1/6-em)]](https://www.rsc.org/images/entities/char_2009.gif) : :![[thin space (1/6-em)]](https://www.rsc.org/images/entities/char_2009.gif) 3)-H2S. 3)-H2S. | ||
The pore size distribution curves (Fig. 9(b)) of the samples were calculated by Barrett-Joiner-Halenda model.23 The BET surface area, total pore volume, average pore size and micropore volume of the three samples are listed in Table 4. As seen from Fig. 9(b), the pore size distribution of sample CK-B was very different from that of other samples, and its pore size was mainly distributed in the mesoporous range of 2.7–18.4 nm. Comparisons between CK-B and C-CS-B (5![[thin space (1/6-em)]](https://www.rsc.org/images/entities/char_2009.gif) :
:![[thin space (1/6-em)]](https://www.rsc.org/images/entities/char_2009.gif) 3) suggested that carbide slag modification blocked most pores, but it also expanded pores in the 19.6–83.4 nm size range. Combined with Fig. 9 and Table 4 and comparing C-CS-B (5
3) suggested that carbide slag modification blocked most pores, but it also expanded pores in the 19.6–83.4 nm size range. Combined with Fig. 9 and Table 4 and comparing C-CS-B (5![[thin space (1/6-em)]](https://www.rsc.org/images/entities/char_2009.gif) :
:![[thin space (1/6-em)]](https://www.rsc.org/images/entities/char_2009.gif) 3) samples before and after adsorption, the specific surface area of C-CS-B (5
3) samples before and after adsorption, the specific surface area of C-CS-B (5![[thin space (1/6-em)]](https://www.rsc.org/images/entities/char_2009.gif) :
:![[thin space (1/6-em)]](https://www.rsc.org/images/entities/char_2009.gif) 3)-H2S decreased by 10%, and the total pore volume increased. H2S underwent both pore filling (2.9–16.7 nm, 19.8–56.9 nm) and pore expansion (16.7–19.8 nm, 56.9–120 nm) on the adsorbent.
3)-H2S decreased by 10%, and the total pore volume increased. H2S underwent both pore filling (2.9–16.7 nm, 19.8–56.9 nm) and pore expansion (16.7–19.8 nm, 56.9–120 nm) on the adsorbent.
| Samples | BET surface area (m2 g−1) | Total pore volume (cm3 g−1) | Average pore size (nm) | Micropore volume (cm3 g−1) |
|---|---|---|---|---|
| CK-B | 38 | 0.107 | 0.11 | 0.015 |
C-CS-B (5![[thin space (1/6-em)]](https://www.rsc.org/images/entities/char_2009.gif) : :![[thin space (1/6-em)]](https://www.rsc.org/images/entities/char_2009.gif) 3) 3) |
12 | 0.065 | 0.22 | 0.004 |
C-CS-B (5![[thin space (1/6-em)]](https://www.rsc.org/images/entities/char_2009.gif) : :![[thin space (1/6-em)]](https://www.rsc.org/images/entities/char_2009.gif) 3)-H2S 3)-H2S |
10 | 0.068 | 0.26 | 0.004 |
![[thin space (1/6-em)]](https://www.rsc.org/images/entities/char_2009.gif) :
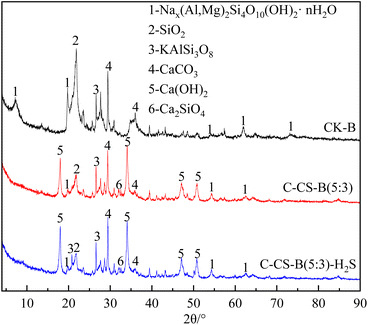
:![[thin space (1/6-em)]](https://www.rsc.org/images/entities/char_2009.gif) 3) changed. A large amount of Ca(OH)2 (JCPDS 78-0315) was loaded onto the adsorbent, and some SiO2 in bentonite combined with CaO to form dicalcium silicate (Ca2SiO4, JCPDS 49-1673). In addition, the XRD peaks of the modified adsorbent C-CS-B (5
3) changed. A large amount of Ca(OH)2 (JCPDS 78-0315) was loaded onto the adsorbent, and some SiO2 in bentonite combined with CaO to form dicalcium silicate (Ca2SiO4, JCPDS 49-1673). In addition, the XRD peaks of the modified adsorbent C-CS-B (5![[thin space (1/6-em)]](https://www.rsc.org/images/entities/char_2009.gif) :
:![[thin space (1/6-em)]](https://www.rsc.org/images/entities/char_2009.gif) 3) before and after the adsorption of H2S did not change significantly. This indicated that the adsorption of H2S did not affect the crystal structure of the adsorbent.
3) before and after the adsorption of H2S did not change significantly. This indicated that the adsorption of H2S did not affect the crystal structure of the adsorbent.
![[thin space (1/6-em)]](https://www.rsc.org/images/entities/char_2009.gif) :
:![[thin space (1/6-em)]](https://www.rsc.org/images/entities/char_2009.gif) 3) and C-CS-B (5
3) and C-CS-B (5![[thin space (1/6-em)]](https://www.rsc.org/images/entities/char_2009.gif) :
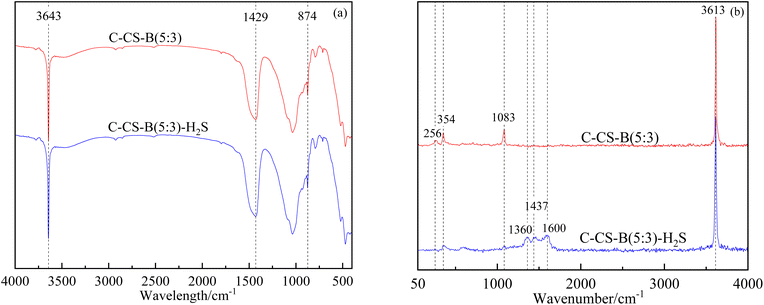
:![[thin space (1/6-em)]](https://www.rsc.org/images/entities/char_2009.gif) 3)-H2S (Fig. 11(a)), two bands with almost complete overlap were observed. The band at 3643 cm−1 was assigned to the O–H stretching vibration of structural OH groups coordinated with the cation in the octahedral sheet.24,25 Furthermore, a strong and broad peak at 1429 cm−1 and a weak and narrow peak at 874 cm−1 indicated the presence of CaCO3.26 These characteristic peaks all originated from Ca(OH)2 and CaCO3 in the carbide slag.
3)-H2S (Fig. 11(a)), two bands with almost complete overlap were observed. The band at 3643 cm−1 was assigned to the O–H stretching vibration of structural OH groups coordinated with the cation in the octahedral sheet.24,25 Furthermore, a strong and broad peak at 1429 cm−1 and a weak and narrow peak at 874 cm−1 indicated the presence of CaCO3.26 These characteristic peaks all originated from Ca(OH)2 and CaCO3 in the carbide slag.
In the Raman spectra of samples C-CS-B (5![[thin space (1/6-em)]](https://www.rsc.org/images/entities/char_2009.gif) :
:![[thin space (1/6-em)]](https://www.rsc.org/images/entities/char_2009.gif) 3) and C-CS-B (5
3) and C-CS-B (5![[thin space (1/6-em)]](https://www.rsc.org/images/entities/char_2009.gif) :
:![[thin space (1/6-em)]](https://www.rsc.org/images/entities/char_2009.gif) 3)-H2S (Fig. 11(b)), the peaks at 256 cm−1, 354 cm−1, and 3615 cm−1 represented O–H vibrations, which mainly originated from Ca(OH)2.27 The weakening of the O–H vibrational peak after the adsorption of H2S by C-CS-B (5
3)-H2S (Fig. 11(b)), the peaks at 256 cm−1, 354 cm−1, and 3615 cm−1 represented O–H vibrations, which mainly originated from Ca(OH)2.27 The weakening of the O–H vibrational peak after the adsorption of H2S by C-CS-B (5![[thin space (1/6-em)]](https://www.rsc.org/images/entities/char_2009.gif) :
:![[thin space (1/6-em)]](https://www.rsc.org/images/entities/char_2009.gif) 3) indicated the involvement of hydroxyl groups in the adsorption process. The peaks of sample C-CS-B (5
3) indicated the involvement of hydroxyl groups in the adsorption process. The peaks of sample C-CS-B (5![[thin space (1/6-em)]](https://www.rsc.org/images/entities/char_2009.gif) :
:![[thin space (1/6-em)]](https://www.rsc.org/images/entities/char_2009.gif) 3) at 1083 cm−1 and sample C-CS-B (5
3) at 1083 cm−1 and sample C-CS-B (5![[thin space (1/6-em)]](https://www.rsc.org/images/entities/char_2009.gif) :
:![[thin space (1/6-em)]](https://www.rsc.org/images/entities/char_2009.gif) 3)-H2S at 1437 cm−1 both represented telescopic vibration of CO32+ originating from the CaCO3 component.28 The change in the position of the spectral peaks before and after adsorption occurred because CaCO3 was involved in the adsorption process and the crystalline form of CaCO3 was changed. The Raman spectrum of the sample with adsorbed H2S contained bands at 1360 cm−1 and 1600 cm−1, which are characteristic of graphite.29,30 The appearance of the carbon peaks indicates that a redox reaction involving the carbonaceous material occurred during adsorption.
3)-H2S at 1437 cm−1 both represented telescopic vibration of CO32+ originating from the CaCO3 component.28 The change in the position of the spectral peaks before and after adsorption occurred because CaCO3 was involved in the adsorption process and the crystalline form of CaCO3 was changed. The Raman spectrum of the sample with adsorbed H2S contained bands at 1360 cm−1 and 1600 cm−1, which are characteristic of graphite.29,30 The appearance of the carbon peaks indicates that a redox reaction involving the carbonaceous material occurred during adsorption.
![[thin space (1/6-em)]](https://www.rsc.org/images/entities/char_2009.gif) :
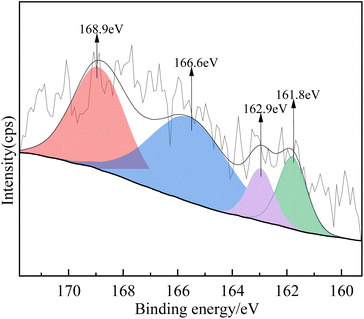
:![[thin space (1/6-em)]](https://www.rsc.org/images/entities/char_2009.gif) 3) were examined by XPS. Fig. 12 shows the XPS S2p spectrum after adsorption. The XPS fitting data of the S peaks, the possible S states, and their relative percentages are summarized in Table 5. As shown in Fig. 12, the fitted peaks at 161.8 eV and 162.9 eV were assigned to Ca-S 2p1/2 and Ca-S 2p3/2, while the peaks at 166.6 eV and 168.9 eV indicated the presence of O–S2+ and SO42−, respectively.31–33 SO42− was generated by oxidation, and the relative percentage of CaSO4 (0.42%) was higher than that of CaS (0.27%) (Table 5), which indicates that CaSO4 and CaS may be the species produced during H2S adsorption.
3) were examined by XPS. Fig. 12 shows the XPS S2p spectrum after adsorption. The XPS fitting data of the S peaks, the possible S states, and their relative percentages are summarized in Table 5. As shown in Fig. 12, the fitted peaks at 161.8 eV and 162.9 eV were assigned to Ca-S 2p1/2 and Ca-S 2p3/2, while the peaks at 166.6 eV and 168.9 eV indicated the presence of O–S2+ and SO42−, respectively.31–33 SO42− was generated by oxidation, and the relative percentage of CaSO4 (0.42%) was higher than that of CaS (0.27%) (Table 5), which indicates that CaSO4 and CaS may be the species produced during H2S adsorption.
| S status | Before adsorption | After adsorption | |
|---|---|---|---|
| S 2p | Ca-S | SO42− | |
| Binding energy of S 2p (eV) | — | 161.8 | 168.9 |
| FWHM (eV) | — | 2.03 | 3.06 |
| Calculated S percentage (%) | 0 | 0.27 | 0.42 |
3.5. Mechanism analysis of H2S adsorption
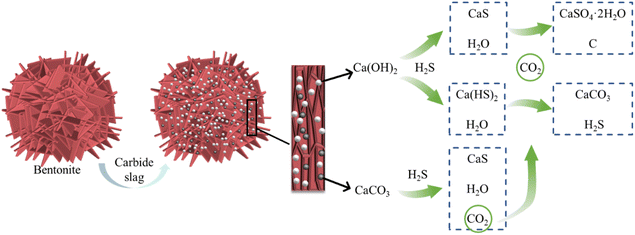
Combining spectral (Fig. 11) and XPS (Fig. 12) characterization results, H2S existed as CaS and sulfate on C-CS-B (3![[thin space (1/6-em)]](https://www.rsc.org/images/entities/char_2009.gif) :
:![[thin space (1/6-em)]](https://www.rsc.org/images/entities/char_2009.gif) 5). As shown in Fig. 13, after the bentonite was modified by carbide slag, a large number of calcium atoms were introduced, and the surface of the sample was dominated by a large amount of Ca(OH)2 and a small amount of CaCO3. When H2S diffused into the adsorbent, some H2S reacted with Ca(OH)2 to form CaS and Ca(HS)2 via eqn (15) and (16). According to Sahu et al.,34 the gas–solid reactions of H2S on CaCO3 were divided into two stages. First, CaCO3 reacted with H2S to form CaS, H2O, and CO2, then some of the products underwent redox reactions to form calcium sulfate dihydrate crystals (CaSO4·2H2O) and singlet carbon. Eqn. (17) and (18) explain this process. Notably, when CO2 and H2O appeared in the system, Ca(HS)2 was reconverted to CaCO3 and H2S by their combined action (eqn (19)). This process explains the appearance of a new CaCO3 peak (1437 cm−1) in the Raman spectrum (Fig. 11). In addition, the hydrolysis of calcium sulfide at low temperatures made the adsorption of H2S more suitable for high temperatures (eqn (20)).35,36
5). As shown in Fig. 13, after the bentonite was modified by carbide slag, a large number of calcium atoms were introduced, and the surface of the sample was dominated by a large amount of Ca(OH)2 and a small amount of CaCO3. When H2S diffused into the adsorbent, some H2S reacted with Ca(OH)2 to form CaS and Ca(HS)2 via eqn (15) and (16). According to Sahu et al.,34 the gas–solid reactions of H2S on CaCO3 were divided into two stages. First, CaCO3 reacted with H2S to form CaS, H2O, and CO2, then some of the products underwent redox reactions to form calcium sulfate dihydrate crystals (CaSO4·2H2O) and singlet carbon. Eqn. (17) and (18) explain this process. Notably, when CO2 and H2O appeared in the system, Ca(HS)2 was reconverted to CaCO3 and H2S by their combined action (eqn (19)). This process explains the appearance of a new CaCO3 peak (1437 cm−1) in the Raman spectrum (Fig. 11). In addition, the hydrolysis of calcium sulfide at low temperatures made the adsorption of H2S more suitable for high temperatures (eqn (20)).35,36| Ca(OH)2 + H2S → CaS + 2H2O | (15) |
| Ca(OH)2 + 2H2S → Ca(HS)2 + 2H2O | (16) |
| CaCO3 + H2S → CaS + H2O + CO2 | (17) |
| CaS + 2H2O + 2CO2 → CaSO4·2H2O + 2C | (18) |
| Ca(HS)2 + H2O + CO2 → CaCO3 + 2H2S | (19) |
| CaS + H2O → Ca(OH)2 + H2S | (20) |
4. Conclusions
In this study, a H2S adsorbent based on bentonite and carbide slag was prepared using bentonite, an abundant natural mineral, and carbide slag, an industrial waste. The preparation conditions of the adsorbent had a strong effect on the adsorption performance of H2S. The mixture of carbide slag was proportional to the adsorption performance, and the best ratio was bentonite: carbide slag: water = 5![[thin space (1/6-em)]](https://www.rsc.org/images/entities/char_2009.gif) :
:![[thin space (1/6-em)]](https://www.rsc.org/images/entities/char_2009.gif) 3: 5, and roasting at 450 °C for 2 h was the optimal preparation condition.
3: 5, and roasting at 450 °C for 2 h was the optimal preparation condition.
The adsorption capacity and breakthrough time of carbide slag-modified adsorbent were greatly improved compared with the single bentonite adsorbent. The adsorption temperature had a strong effect on the H2S adsorption process, with higher temperatures favoring chemisorption. Under optimal conditions, the adsorption capacity of the carbide slag modified adsorbent for H2S was 40 times higher than that of the blank bentonite-based adsorbent. The Freundlich isotherm model best described the adsorption of H2S. The results of the computational fitting of the adsorption kinetics showed that the Bangham adsorption kinetic model beset described the kinetic process of H2S adsorption by C-CS-B (5![[thin space (1/6-em)]](https://www.rsc.org/images/entities/char_2009.gif) :
:![[thin space (1/6-em)]](https://www.rsc.org/images/entities/char_2009.gif) 3).
3).
The adsorption of H2S occurred via chemisorption, which occurred mainly in mesopores and macropores. An acid-base neutralization reaction, redox reaction, and hydrolysis reaction all occurred during adsorption. H2S was removed in the form of CaS and sulfate.
Author contributions
Qi Jiang: Writing - original draft; Tianci Han and Yonglan Zong: writing - optimization and modification; Yongmei He and Youbo Su: supervision; Yonglin Wu and Bo Dian: writing - review and editing; Jilai Zhang: conceptualization; Tianguo Li: project administration; Ming Jiang: idea and funding acquisition.Conflicts of interest
There are no conflicts to declare.Acknowledgements
The authors gratefully acknowledge the National Natural Science Foundation of China (No 51768074) for the support.References
- H. Aljama, Z. Alaithan and A. Almofleh, J. Phys. Chem. C, 2023, 127, 9022–9029, DOI:10.1021/acs.jpcc.3c00903.
- X. Zhou, L. Xu, S. Yang, S. Zhu, X. Chen, B. Dong, X. Bai, W. Xu, G. Lu and H. Song, Sens. Actuators, B, 2020, 309, 127802, DOI:10.1016/j.snb.2020.127802.
- Q. Wang, Y. Chen, Y. Chen, D. Chen, X. Tian, J. Zhou, X. Li and Y. Wang, Energy Fuels, 2023, 37, 1169–1179, DOI:10.1021/acs.energyfuels.2c03067.
- A. Ahmed, S. A. Onaizi and S. Elkatatny, ACS Omega, 2022, 7, 28361–28368, DOI:10.1021/acsomega.2c02890.
- M. Askari, E. Salehi and A. Baluchi, Chem. Eng. Res. Des., 2022, 188, 545–554, DOI:10.1016/j.cherd.2022.10.004.
- A. T. Zoghi, M. Shokouhi, F. Naderi, M. Abbasghorbani, A. Fatehi, B. Pouladi and M. A. Adhami, J. Solution Chem., 2022, 51, 84–96, DOI:10.1007/s10953-021-01131-1.
- Q. Jiang, T. G. Li, Y. M. He, Y. L. Wu, J. L. Zhang and M. Jiang, Environ. Chem. Lett., 2022, 20, 1403–1419, DOI:10.1007/s10311-021-01366-w.
- S. Y. Jung, S. J. Lee, J. J. Park, S. C. Lee, H. K. Jun, T. J. Lee, C. K. Ryu and J. C. Kim, Sep. Purif. Technol., 2008, 63, 297–302, DOI:10.1016/j.seppur.2008.05.013.
- D. D. E. Koyuncu and S. Yasyerli, Ind. Eng. Chem. Res., 2009, 48, 5223–5229, DOI:10.1021/ie8017059.
- K. Yu, J. Xu, X. Jiang, C. Liu, W. McCall and J. Lu, Chemosphere, 2017, 184, 884–891, DOI:10.1016/j.chemosphere.2017.06.040.
- X. Guo, Z. Wu, Z. Wang, F. Lin, P. Li and J. Liu, ACS Omega, 2023, 8, 19455–19463, DOI:10.1021/acsomega.3c00745.
- W. Sun, J. Li, H. Li, B. Jin, Z. Li, T. Zhang and X. Zhu, Chemosphere, 2022, 296, 133962, DOI:10.1016/j.chemosphere.2022.133962.
- K. V. Stepova, D. J. Maquarrie and I. M. Krip, Appl. Clay Sci., 2009, 42, 625–628, DOI:10.1016/j.clay.2008.05.001.
- D. Nguyen-Thanh and T. J. Bandosz, Carbon, 2005, 43, 359–367, DOI:10.1016/j.carbon.2004.09.023.
- W. Tian, Z. Li, K. Zhang and Z. Ge, RSC Adv., 2019, 9, 19675–19679, 10.1039/c9ra02134e.
- T. Wen, Y. Zhao, L. Chen, Y. Miao, Z. Zhang, S. Song and T. Zhang, J. Cleaner Prod., 2023, 414, 137650, DOI:10.1016/j.jclepro.2023.137650.
- Y. Li, W. Wang, X. Cheng, M. Su, X. Ma and X. Xie, Fuel, 2015, 142, 21–27, DOI:10.1016/j.fuel.2014.10.071.
- X. Wang, Y. Ma, P. Ning, J. Qiu, X. Ren, Z. Li, W. Chen and W. Liu, Adsorption, 2014, 20, 623–630, DOI:10.1007/s10450-014-9607-y.
- X. Wang, P. Ning, Y. Shi and M. Jiang, J. Hazard. Mater., 2009, 171, 588–593, DOI:10.1016/j.jhazmat.2009.06.046.
- M. Jiang, Z. Wang, P. Ning, S. Tian, X. Huang, Y. Bai, Y. Shi, X. Ren, W. Chen, Y. Qin, J. Zhou and R. Miao, J. Taiwan Inst. Chem. Eng., 2014, 45, 901–907, DOI:10.1016/j.jtice.2013.08.008.
- Q. Zhao, S. Tian, J. Zhang, S. Zhan, T. Sheng and P. Ning, Can. J. Chem. Eng., 2015, 93, 1247–1253, DOI:10.1002/cjce.22208.
- C. Sangwichien, G. L. Aranovich and M. D. Donohue, Colloids Surf., A, 2002, 206, 313–320, DOI:10.1016/S0927-7757(02)00048-1.
- T. M. Oliver, K. Jugoslav, P. Aleksandar and D. Nikola, Chem. Eng. Process., 2005, 44, 1181–1187, DOI:10.1016/s0140-6701(06)81163-x.
- J. Madejová, Vib. Spectrosc., 2003, 31, 1–10, DOI:10.1016/S0924-2031(02)00065-6.
- M. Tanaka, A. Itadani, T. Abe, H. Taguchi and M. Nagao, J. Colloid Interface Sci., 2007, 308, 285–288, DOI:10.1016/j.jcis.2006.12.002.
- G. Wu, Y. Wang, S. Zhu and J. Wang, Powder Technol., 2007, 172, 82–88, DOI:10.1016/j.powtec.2006.10.031.
- Z. V. Pandanyi, Solid State Commun., 1970, 8, 541–543 CrossRef.
- T. Schmid and P. Dariz, J. Raman Spectrosc., 2015, 46, 141–146, DOI:10.1002/jrs.4622.
- A. Manivannan, M. Chirila, N. C. Giles and M. S. Seehra, Carbon, 1999, 37, 1741–1747, DOI:10.1016/S0008-6223(99)00052-4.
- I. Prasetyo and D. D. Do, Carbon, 1999, 37, 1909–1918, DOI:10.1016/S0008-6223(99)00065-2.
- F. Zhu, X. Hu, L. Kong and X. Peng, J. Hazard. Mater., 2022, 421, 126745, DOI:10.1016/j.jhazmat.2021.126745.
- S. Zou, Y. Liao, S. Xiong, N. Huang, Y. Geng and S. Yang, Environ. Sci. Technol., 2022, 51, 3426–3434, DOI:10.1021/acs.est.6b05765.
- Z. Zhang, J. Wang, W. Li, M. Wang, W. Qiao, D. Long and L. Ling, Carbon, 2016, 96, 608–615, DOI:10.1016/j.carbon.2015.10.001.
- R. C. Sahu, R. Patel and B. C. Ray, Fuel Process. Technol., 2011, 92, 1587–1592, DOI:10.1016/j.fuproc.2011.04.002.
- B. Sun, G. Yi, D. Chen, Y. Zhou and J. Cheng, J. Mater. Chem., 2002, 12, 1194–1198, 10.1039/b109352e.
- M. Alla, A. Harrou, M. L. Elhafiany, D. Azerkane, M. El Ouahabi and E. K. Gharibi, Phosphorus Sulfur, 2002, 197, 1026–1035, DOI:10.1080/10426507.2022.2052881.
| This journal is © The Royal Society of Chemistry 2023 |

