DOI:
10.1039/D3RA03350C
(Paper)
RSC Adv., 2023,
13, 20799-20809
Boosted formic acid electro-oxidation on platinum nanoparticles and “mixed-valence” iron and nickel oxides†
Received
19th May 2023
, Accepted 23rd June 2023
First published on 11th July 2023
Abstract
The modification of Pt nanoparticles (nano-Pt, assembled electrochemically onto a glassy carbon (GC) substrate) with hybrid multivalent nickel (nano-NiOx) and iron (nano-FeOx) oxide nanostructures was intended to steer the mechanism of the formic acid electro-oxidation (FAO) in the desirable dehydrogenation pathway. This binary modification with inexpensive oxides succeeded in mediating the reaction mechanism of FAO by boosting reaction kinetics “electron transfer” and amending the surface geometry of the catalyst against poisoning. The sequence of deposition was optimized where the a-FeOx/NiOx/Pt/GC catalyst (where “a” denotes a post-activation step for the catalyst at −0.5 V in 0.5 mol L−1 NaOH) reserved the best hierarchy. Morphologically, while nano-Pt appeared to be spherical (ca. 100 nm in average diameter), nano-NiOx appeared as flowered nanoaggregates (ca. 56 nm in average diameter) and nano-FeOx (after activation) retained a plate-like nanostructure (ca. 38 nm in average diameter and 167 nm in average length). This a-FeOx/NiOx/Pt/GC catalyst demonstrated a remarkable catalytic efficiency (125 mA mgPt−1) for FAO that was ca. 12.5 times that of the pristine Pt/GC catalyst with up to five times improvement in the catalytic tolerance against poisoning and up to −214 mV shift in the FAO's onset potential. Evidences for equipping the a-FeOx/NiOx/Pt/GC catalyst with the least charge transfer resistance and the highest stability among the whole investigated catalysts are provided and discussed.
1. Introduction
The quest for clean, long-lasting, and efficient energy conversion devices, such as proton exchange membrane fuel cells (PEMFCs), to address the concerns of rising energy consumption and pollution has attracted great attention.1,2 Due to the safety and storage issues associated with hydrogen, researchers have focused on developing PEMFCs, utilizing small organic molecules (e.g., methanol, formic acid, and ethanol) as a fuel source.3 Among these fuel cells (FCs), direct formic acid fuel cells (DFAFCs) use formic acid (FA, HCOOH) as a chemical energy source and operate with a high power density (∼271 mW cm−2 at 30 °C (ref. 4) employing a Pd catalyst).5–7 In fact, FA stands out among all other potential hydrogen carriers as a clean, nontoxic, nonflammable, stable, and renewable energy resource with a high energy density (2086 W h L−1),6,8 low fuel crossover rate through polymeric Nafion membranes, high theoretical electromotive force (open circuit voltage ∼1.48 V), and low-cost for a liquid organic molecule under atmospheric conditions.9–11 As such, FA is considered as an ideal power source for portable applications, vehicles, and small power generation devices.12–14 In this regard, DFAFCs have received great interest in recent decades with the objective of developing a high-efficiency catalyst along with the illustration of the associated oxidation mechanism.1,15 Thanks to the pioneer work of Capon and Parson, who used differential electrochemical mass spectrometry (DEMS) and provided evidence for a dual path mechanism for formic acid electro-oxidation (FAO);16 direct dehydrogenation (desirable) to yield CO2 and indirect dehydration (undesirable) to produce CO intermediate species that is because of its strong adsorption, the Pt surface became poisoned.16–20 The Pt surface tends to mechanistically catalyze FAO via the cleavage of the C–O and C–H bonds mostly at low potentials, whereas the O–H bond is quickly cleaved at high potentials.21 Among the most inspected platinum group metals, Pd-based electrocatalysts have exhibited better FAO activities through the preferential dehydrogenation pathway than those based on Pt. However, they also suffer from much lower stabilities in extreme acidic and oxidative environments, not to mention the toxic CO species produced by a reverse CO2 reduction, which poisons the Pd surface.22–24 Because of its partially filled 5d orbital, Pt has been deemed the best option for a single metal electrocatalyst for the cathodes and anodes of FCs to date.25 To enhance the encountered kinetics of FAO and minimize the adsorption of CO on Pt, numerous strategies have been investigated with the focus on investigating the catalytic activity of Pt-based binary and ternary alloys/composites, including elements such as Pb, Bi, Rh, Au, Pd, and Sn.11,26,27 Modulating the morphology of the Pt-based catalysts by alloying with other elements is considered an effective way to reduce the poisoning by CO and to increase the durability of the catalysts through a bifunctional mechanism and/or enhanced electronic, ensemble, and synergistic effects for the employed elements.11,28,29 The modification of Pt with transition metal oxide nanostructures could improve Pt's selectivity for the dehydrogenation pathway of FAO. The fabrication of metal oxides that exhibit an inverse switch between low and high oxidation states at a potential close to the thermodynamic potential of a target reaction is the current point of interest.30 Furthermore, metal oxides with different valence states (e.g., FeOx, MnOx, and WOx) contain significant oxygen vacancies, compared with metal oxides with a single valence state. Mixed-valence metal oxides have also been applied as reduced substrates for CO oxidation.12 The current study is interested in investigating FAO at Pt nanoparticles (nano-Pt) that were deposited onto a glassy carbon (GC) substrate and amended with nickel (nano-NiOx) and iron (nano-FeOx) oxides nanostructures. The modification of nano-Pt with nano-NiOx and/or nano-FeOx was planned from their excellent catalytic characteristics toward the oxidation of small organic molecules.6,31–33 Interestingly, with this modification, the catalyst's cost was reduced by lowering the Pt content, and the catalyst's activity toward FAO was boosted with a longer lifetime and a remarkable tolerance against CO poisoning, which are the requirements to enhance the performance of DFAFCs.
2. Experimental section
2.1. Materials and characterization methods
All the chemicals used were of the highest quality and used without further purification. Potassium hexachloroplatinate (K2PtCl6), ferrous sulfate heptahydrate (FeSO4·7H2O), nickel sulfate hexahydrate (NiSO4·6H2O), sodium hydroxide pellets (NaOH), sulfuric acid (H2SO4), sodium sulphate (Na2SO4), disodium hydrogen phosphate (Na2HPO4), hydrochloric acid (HCl), and formic acid (HCOOH) were purchased from Sigma Aldrich, Riedel-de Haen, and Merck. Electrochemical measurements and electrochemical impedance spectroscopy (EIS) were performed in a conventional three-electrode glass cell at room temperature (25 ± 1 °C) using an EG&G potentiostat (model 273A) operated with Echem 270 software. A glassy carbon (GC, 3.0 mm) disk was connected before and after modifications with the different catalytic ingredients as the working electrode, while Ag/AgCl/KCl (sat.) and Pt wire served as the reference and counter electrodes, respectively. The GC electrode was mechanically polished with Al2O3 slurries, followed by 10 min sonication in water and finally rinsed with distilled water. A field emission scanning electron microscope (FE-SEM, FEI, QUANTA FEG 250) connected with an energy dispersive X-ray spectrometer (EDX) unit was applied to identify the morphologies and elemental composition of the prepared catalysts. ImageJ software was used to calculate the average particle size distributions from the FE-SEM images for the prepared nanocatalysts. An X-ray powder diffractometer (PANalytical, Empyrean) operated with Cu target (λ = 1.54 Å) was used to investigate the crystallographic structure of the prepared catalysts.
2.2. Catalyst preparation
The deposition of nano-Pt on the GC electrode was carried out via potential step electrolysis (from 1 to 0.1 V) for 300 s in 0.1 mol L−1 H2SO4 containing 1 mmol L−1 K2PtCl6 solution. Electrode modification with nano-NiOx was achieved in three sequential steps. Metallic nickel (Ni) nanostructures were deposited on the GC surfaces by applying a constant voltage of −1.0 V for 120 s in 1.0 mmol L−1 NiSO4·6H2O and 0.1 mol L−1 Na2SO4 solution. The metallic nickel nanostructures were then converted to nickel oxide (passivation step) by cycling the potential from −0.5 to 1 V at 200 mV s−1 in 0.1 mol L−1 phosphate buffer solution (PBS, pH = 7).15 Finally, the as-prepared electrode was activated by cycling the potential between −1 and 0.6 V at a scan rate of 200 mV s−1 for 25 cycles in 0.5 mol L−1 NaOH solution.26,30 The electrodeposition process of the nano-FeOx was carried out in 0.02 mol L−1 FeSO4·7H2O aqueous solution by running a two-cycle potential scan between −0.855 and −1.205 V at a scan rate of 100 mV s−1,33–35 followed by an activation step for the electrodeposited nano-FeOx by holding the applied voltage at −0.5 V for 10 min in 0.2 mol L−1 NaOH solution.
3. Results and discussion
3.1. Electrochemical characterization
The electrochemical characterization of the catalyst can sometimes have the ability to track minute amounts of even minor electroactive species, which are presumably undetectable under typical material characterization techniques. The electrochemical measurements were performed to confirm the successful deposition of all components of the catalyst. Hence, Fig. 1 and 2 demonstrate the cyclic voltammograms (CVs) in alkaline (0.5 mol L−1 NaOH) and acidic (0.5 mol L−1 H2SO4) media, respectively, on the GC-modified electrodes. The CV of the nano-Pt/GC electrode (curve a in Fig. 1) depicts the typical characteristics of a polycrystalline Pt electrode in alkaline medium, including the characteristic surface oxidation (Pt/PtO) extending from ca. –0.2 to 0.6 V, surface reduction (PtO/Pt) at ca. −0.35 V, and the two peaks for the Hads/des appearing between −0.6 and −1.0 V.36 At the nano-NiOx/GC electrode (curve b, Fig. 1), the well-defined redox couple observed at ca. 0.4 V is assigned to the Ni(OH)2/NiOOH reversible transformations, according to eqn (1).22,26,30,37| | |
Ni(OH)2 ↔ NiOOH + H+ + e−, e0rev = 1.36 V
| (1) |
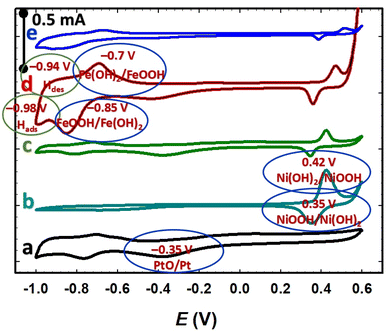 |
| | Fig. 1 CVs obtained for the Pt/GC (a), NiOx/GC (b), NiOx/Pt/GC (c), FeOx/NiOx/Pt/GC (d), and a-FeOx/NiOx/Pt/GC electrodes (e) in 0.5 mol L−1 NaOH solution at a scan rate of 200 mV s−1. | |
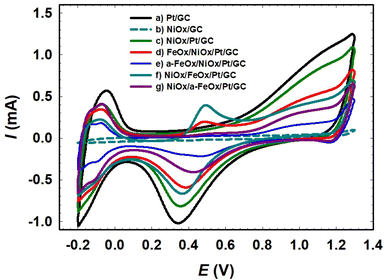 |
| | Fig. 2 CVs obtained for the Pt/GC (a), NiOx/GC (b), NiOx/Pt/GC (c), FeOx/NiOx/Pt/GC (d), a-FeOx/NiOx/Pt/GC (e), NiOx/FeOx/Pt/GC (f), and NiOx/a-FeOx/Pt/GC (g) in 0.5 mol L−1 H2SO4 at a scan rate of 200 mV s−1. | |
Interestingly, in the case of the NiOx/Pt/GC electrode (curve c, Fig. 1) for which nano-Pt was first deposited followed by nano-NiOx, a remarkable decrease in the intensity of the PtO reduction and the characteristic Hads/des peaks was observed, indicating a significant decrease in the accessible surface area of Pt due to the deposition of the nano-NiOx, which showed a phase transformation at ca. 0.4 V. At the FeOx/NiOx/Pt/GC electrode (curve d, Fig. 1) where the nano-FeOx structures were finally deposited on the NiOx/Pt/GC electrode, several new features appeared. This included the well-defined redox peak couple in alkaline medium at ca. −0.70 V (oxidation) and −0.85 V (reduction), which could likely be entrusted to the Fe2+/Fe3+ transformations,38–40 with the early and intense evolution of oxygen at the end of the CV scan in the positive direction of voltages, if compared to other aforementioned catalysts in Fig. 1. After the activation step for the FeOx/NiOx/Pt/GC electrode at −0.50 V and here, referred as the a-FeOx/NiOx/Pt/GC electrode (curve e, Fig. 1), the characteristic features of the Pt, NiOx, and FeOx nanoparticles were observed but with lower intensities compared to what was observed for the non-activated surface (curve d).
Fig. 2 shows the CVs of the prepared catalysts in 0.5 mol L−1 H2SO4. For the Pt/GC electrode (curve a), an exemplary CV was observed, featuring the polycrystalline Pt surfaces in acidic media, with the characteristic Pt/PtO (ca. 0.34 V) and Hads/des (−0.2 to 0.1 V) transformation peaks. It is worth pointing out that these peaks (PtO → Pt or Hdes) can be used to assess the electrochemically active surface area (ECSA) of Pt in the catalyst, which can be influenced by numerous factors such as the different mole ratios and structures of the catalysts' components. The deposition conditions of the catalytic components (nano-FeOx and nano-NiOx), including the electrolyte's composition and concentration, operating temperature, applied potential, and post-activation, can certainly justify not only the coverage of this component onto the Pt surface but also its facet orientation, which in turn affect the ECSA of the catalyst. However, in this investigation, we avoided calculating the ECSA from the PtO → Pt reduction peak as it might interfere with the reduction of nano-FeOx. The steps for the ECSA calculation from the Hdes peak in Fig. 2 are detailed in the ESI (see Fig. S1†). The ECSA (cm2) was calculated employing the monolayer adsorption charge for platinum (210 μC cm−2).32,34,41 The calculated ECSA values of the studied catalysts were 0.200, 0.126, 0.110, 0.070, 0.110, and 0.090 cm2 for Pt/GC, NiOx/Pt/GC, FeOx/NiOx/Pt/GC, a-FeOx/NiOx/Pt/GC, NiOx/FeOx/Pt/GC, and NiOx/a-FeOx/Pt/GC, respectively, and the corresponding data are listed in Table 1.
Table 1 A summary of the important catalytic indices of Fig. 5A
| Electrode |
ECSA (cm2) |
Idp (mA cm−2) |
Iindp (mA cm−2) |
Ib (mA cm−2) |
Idp/Iindp |
Idp/Ib |
Eonset (mV) |
| Pt/GC |
0.200 |
1.2 |
0.6 |
6.5 |
2.0 |
0.18 |
42 |
| NiOx/Pt/GC |
0.126 |
3.3 |
0.4 |
5.9 |
8.3 |
0.56 |
−102 |
| FeOx/NiOx/Pt/GC |
0.110 |
4.8 |
0.3 |
5.5 |
16.0 |
0.87 |
−178 |
| a-FeOx/NiOx/Pt/GC |
0.070 |
7.5 |
0.3 |
8.6 |
25.0 |
0.87 |
−172 |
| NiOx/FeOx/Pt/GC |
0.110 |
3.8 |
0.3 |
5.7 |
12.7 |
0.67 |
−102 |
| NiOx/a-FeOx/Pt/GC |
0.090 |
3.6 |
0.40 |
7.0 |
9.0 |
0.51 |
−32 |
The a-FeOx/NiOx/Pt/GC electrode had the lowest ECSA value when compared to Pt/GC catalyst. Interestingly, the electrodeposition of nano-FeOx (vide infra for the observed morphology) on top of the NiOx/Pt/GC electrode, and especially after activation at −0.5 V (curve e), resulted in a considerable decrease in the peak current intensities for the Pt/PtO oxidation and Hads/des transformations. The ECSA was utilized to estimate the surface coverage (θ) of the nano-NiOx or/and nano-FeOx on the Pt/GC electrodes according to  where, Amod and Aunmod refer to the ECSA of the modified and the unmodified Pt/GC electrodes, respectively. The surface coverages of nano-NiOx or/and nano-FeOx nanoparticles for the NiOx/Pt/GC, FeOx/NiOx/Pt/GC, a-FeOx/NiOx/Pt/GC, NiOx/FeOx/Pt/GC, and NiOx/a-FeOx/Pt/GC modified electrodes were estimated to be ca. 37, 45, 65, 45, and 55%, respectively. It is worth noting here that the CV of the NiOx/Pt/GC electrode in acidic medium did not display any redox peaks characteristic for nickel oxides, which are unstable and dissolve in acidic media,42 whereas the redox peak for the Fe2+/Fe3+ transformation appeared in the potential range from 0.4 to 0.6 V, confirming the successful deposition of the iron species.
3.2. Morphological and surface characterization
The catalyst's structural and morphological information are not only imperative for the elucidation of the employed catalytic mechanisms but also for the design and further development of different electroactive materials.43 As such, we characterized the morphology of the different studied electrodes, as shown in the FE-SEM micrographs in Fig. 3 (the particle size distributions are depicted whenever possible in the insets of Fig. 3) for the Pt/GC, NiOx/GC, NiOx/Pt/GC, FeOx/NiOx/Pt/GC, and a-FeOx/NiOx/Pt/GC electrodes. Interestingly, Pt was electrodeposited on the bare GC substrate in the form of spherical nanoparticles with an average particle diameter of ca. 100 nm (Fig. 3a). On the other hand, nano-NiOx in the passivated NiOx/GC surface was observed in the form of nanoparticles, with an average particle diameter of ca. 24.0 nm, along with aggregated dendritic structures at the micrometer scale (ca. 10 μm) (Fig. 3b). The deposition of nano-NiOx in the NiOx/Pt/GC-modified electrode (Fig. 3c), however, resulted in the appearance of spherical flower-like nanoaggregates (average particle diameter of ca. 56 nm) that uniformly covered a large portion of the GC. Further modification with nano-FeOx resulted in the formation of nanoparticles aggregates with an average diameter of ca. 108 nm (Fig. 3d). The activation of the latter electrode at −0.5 V in 0.2 mol L−1 NaOH solution was found to completely change the morphology of the FeOx/NiOx/Pt/GC electrode and the appearance of plate-like nanostructures (ca. 38 nm average diameter and 167 nm average length, Fig. 3e). The elemental composition of the FeOx/NiOx/Pt/GC electrode was investigated by EDX (Fig. S2†), which indicated the existence of Pt, Ni, and Fe as well as a high percentage (51.67%, at%) of oxygen, thus revealing the oxide nature of the catalytic surface. The observed sulfur signal might be attributed to the surface adsorption of sulphate ions (SO42−) that was not removed after copiously rinsing with water following the deposition step.
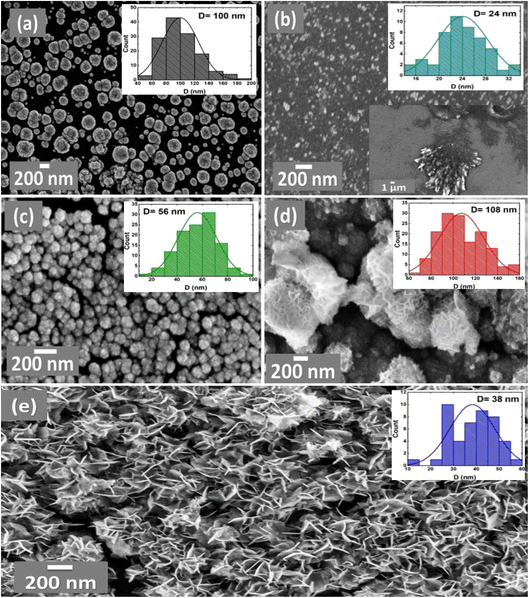 |
| | Fig. 3 FE-SEM images and particle size distributions (top right insets) obtained for the Pt/GC (a), NiOx/GC (b), NiOx/Pt/GC (c), FeOx/NiOx/Pt/GC (d), and a-FeOx/NiOx/Pt/GC (e) electrodes. Lower right inset of (b) is for the Ni/GC electrode before passivation. | |
Fig. 4 shows the observed XRD patterns for the different studied electrodes and reveals the crystalline nature of nano-Pt, nano-NiOx, and nano-FeOx species. In all the XRD profiles shown in Fig. 4, diffraction peaks corresponding to the (0 0 2), (1 0 1), and (1 1 0) planes of the carbon substrate appeared at 2θ values of ca. 25.0, 43.3, and 78.0°, respectively (JCPDS Card No. 00-026-1077).42,44 As shown in Fig. 4a, the five diffraction peaks at 2θ of 37.0, 39.8, 46.3, 67.5, and 81.3° corresponded to the Pt (1 0 1), Pt (1 1 1), Pt (2 0 0), Pt (2 2 0), and Pt (3 1 1) planes, respectively, for face centered cubic (fcc) Pt (JCPDS Card No. 00-004-0802).32,45,46 For the NiOx/GC electrode (Fig. 4b), diffraction peaks observed at ca. 2θ of 25.2, 37.9, and 43.1° were assigned to the NiOOH phase (JCPDS Card No. 00-006-0075), while the other two diffraction peaks observed at 2θ of 62.2 and 78.6° were assigned to the NiO phase (JCPDS Card No. 01-071-4750).26,47 On the other hand, for the FeOx/GC electrode (Fig. 4c), the diffraction peaks for the α-FeOOH phase were detected at 2θ of 36.2, 36.8, 42.1, 46.3, and 62.5° corresponding to the (0 4 0), (1 1 1), (1 4 0), (0 4 1), and (0 0 2) crystallographic planes, respectively (JCPDS Card No. 29-0713).48–51 Moreover, the typical characteristic peaks for the δ-FeOOH phase were observed at ca. 2θ of 40.13 and 62.89° corresponding to the (1 0 1) and (1 1 0) planes, respectively.52 In addition, a diffraction peak, corresponding to the (2 2 0) facet of iron(II) oxide (FeO), was observed at 2θ 75.6° (JCPDS Card No. 02-1186).53 The same peaks of nano-Pt and nano-NiOx with their previous assignments were obvious for the NiOx/Pt/GC catalyst (Fig. 4d). It is also worth noting that the diffraction signal from the Pt structures was not revealed after the deposition of nano-FeOx in the FeOx/NiOx/Pt/GC electrode (Fig. 4e), indicating an effective coating with nano-FeOx atop the Pt facets, but the diffraction peaks corresponding to NiOOH, NiO, and α-FeOOH were observed. However, after the activation of the FeOx/NiOx/Pt/GC electrode at −0.5 V (Fig. 4f), the Pt diffraction peaks reappeared together with only the NiO and α-FeOOH diffractions. This indicates a partial detachment/dissolution of α-FeOOH covering the Pt structures while boosting the surface oxidation of Fe2+ to Fe3+ with the inward diffusion of oxygen along the catalyst surface.
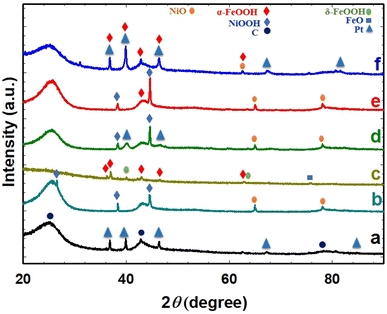 |
| | Fig. 4 XRD patterns for Pt/GC (a), NiOx/GC (b), FeOx/GC (c), NiOx/Pt/GC (d), FeOx/NiOx/Pt/GC (e), and a-FeOx/NiOxNiOx/Pt/GC (f) electrodes. | |
3.3. Electrocatalysis of FAO
The FAO on a pure Pt surface is well-known to proceed via a dual-pathway mechanism. The produced intermediate CO molecules from the dehydration reaction can poison the Pt surface and inhibit its catalytic activity. In the forward scan of the CV plots of the prepared catalysts, two types of peak currents (Idp and Iindp) were observed. The first peak current (Idp) at ∼0.3 V and the second peak current (Iindp) at ∼0.65 V were credited to the direct oxidation of FA to CO2 (dehydrogenation process) and the oxidation of CO produced from FA (dehydration process), respectively.1,46 As shown in Fig. 5, the electrocatalytic behavior of the various modified electrodes toward FAO is determined by measuring the CVs in 0.3 mol L−1 FA (pH = 3.5) solution. The current ratio of these two peaks (Idp/Iindp) reflected the preferential oxidation pathway of FA at a particular catalyst. Fig. 5A & B summarize the activities of the different prepared nanocatalysts, in which the a-FeOx/NiOx/Pt/GC electrode exhibited the highest catalytic activity (Idp/Iindp = 25.0) and tolerance (Idp/Ib = 0.87) against the formation of the poisoning CO species. This activity of the a-FeOx/NiOx/Pt/GC electrode was about 12.5, 3.0, 2.8, 2.0, and 1.6 times higher than those of the Pt/GC, NiOx/Pt/GC, NiOx/a-FeOx/Pt/GC, NiOx/FeOx/Pt/GC, and FeOx/NiOx/Pt/GC catalysts, respectively. Moreover, it was also noticed that there was a favorable negative shift (ca. 218 mV) in the onset potential (Eonset) of FAO reaction at the a-FeOx/NiOx/Pt/GC electrode relative to that of the Pt/GC electrode (see Tables 1 and 2). A key issue in the fabrication of the catalyst is its proper design that ensures a continuous and efficient use of its components, especially precious elements. For instance, nano-FeOx and nano-NiOx-modified GC electrodes do not show any electrocatalytic activity toward FAO; however, their binary mixtures with Pt showed much improved catalytic activities, vide supra. We also investigated the influence of the deposition sequence of nano-NiOx and nano-FeOx nanostructures (Fig. 5) on the electrocatalytic performance toward FAO. Fig. 5A & B (plots c) show the CVs of FAO at the FeOx/NiOx/Pt/GC electrode, whereas (plots e) in the same figures show the catalytic performance of the NiOx/FeOx/Pt/GC electrode. Interestingly, the FeOx/NiOx/Pt/GC electrode promoted a stronger catalytic activity toward FAO compared to the NiOx/FeOx/Pt/GC electrode. In other words, the deposition sequence of both nano-FeOx and nano-NiOx influenced the Idp and Iindp values. Thus, the ratios of Idp/Iindp and Idp/Ib were higher at the FeOx/NiOx/Pt/GC electrode (Idp/Iindp = 16.0 and Idp/Ib = 0.87, plot c in Fig. 5A & B) than those (Idp/Iindp = 12.7, Idp/Ib = 0.67, plots e in Fig. 5A & B) obtained for its “mirror image” electrode, NiOx/FeOx/Pt/GC. This emphasized the necessity of nano-FeOx as the final layer atop the nano-NiOx layer on the Pt/GC electrode; this sequence might be beneficial for enhancing the adsorption of FA but not the CO species. Interestingly, moreover, the activation of nano-FeOx in the a-FeOx/NiOx/Pt/GC electrode (plots d in Fig. 5A & B) resulted in a superb enhancement of Idp (7.5 mA cm−2) with a concurrent depression of Iindp (0.3 mA cm−2) and thus increases in the Idp/Iindp and Idp/Ib ratios of the a-FeOx/NiOx/Pt/GC electrode. It seemed that the activation of iron oxide at −0.5 V might lead to the formation of iron oxide in different oxidation states, and thus, the final nano-FeOx surface structures retarded the formation of CO and/or accelerated its oxidative removal. Such findings indicated the great improvement of the ternary composition of FeOx-NiOx-Pt over the binary composition (NiOx-Pt or FeOx-Pt) in boosting FAO reaction in a synergism involving the three catalytic ingredients. From another projection, if the activity of the FeOx/NiOx/Pt/GC electrode is inspected relative to that of the FeOx/Pt/GC electrode, one can easily notice the decrease, but in different proportions, of its Idp (3 times) and Iindp (10 times). Interestingly, the great reduction in the Iindp eventually enhanced the Idp/Iindp ratio from 5 for the FeOx/Pt/GC electrode6 to 16 for the FeOx/NiOx/Pt/GC electrode, an increase by a factor of ca. 3.2. In addition, the Idp/Ib ratio increased from 0.35 for the FeOx/Pt/GC electrode to 0.87 in the case of the FeOx/NiOx/Pt/GC electrode (an increase by a factor of ca. 2.5), indicating an improved catalytic tolerance of the FeOx/NiOx/Pt/GC electrode against CO poisoning. In Fig. 5A, specific activities were normalized to the real surface areas that were calculated from Fig. 2.31,54 On the other hand, in Fig. 5B, mass activities were normalized to the mass of Pt that was computed from the charge (Q) related to the i–t curve obtained during deposition according to Faraday's law (Fig. S3†).55 Interestingly, this ternary FeOx/NiOx/Pt/GC catalyst was superior to several other catalysts toward FAO, according to the literature (see Table 3).11,31,56–64
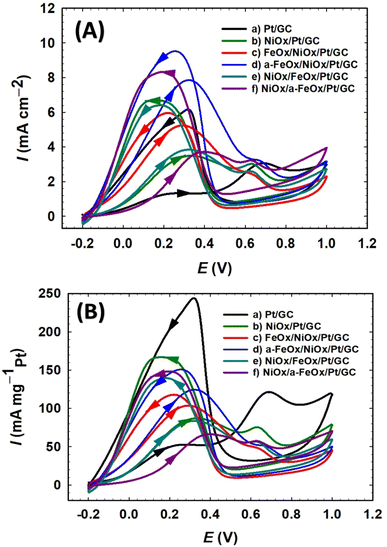 |
| | Fig. 5 CV curves of specific (A) and mass (B) activities for the FAO on the Pt/GC (a), NiOx/Pt/GC (b), FeOx/NiOx/Pt/GC (c), a-FeOx/NiOx/Pt/GC (d), NiOx/FeOx/Pt/GC (e), and NiOx/a-FeOx/Pt/GC (f) catalysts obtained in 0.3 mol L−1 FA (pH = 3.5) aqueous solution. | |
Table 2 A summary of the important catalytic indices of Fig. 5B
| Electrode |
Idp (mA mgPt−1) |
Iindp (mA mgPt−1) |
Ib (mA mgPt−1) |
Idp/Iindp |
Idp/Ib |
| Pt/GC |
42.7 |
21.4 |
237.2 |
2.0 |
0.18 |
| NiOx/Pt/GC |
85.0 |
10.3 |
151.0 |
8.3 |
0.56 |
| FeOx/NiOx/Pt/GC |
94.1 |
5.8 |
108.6 |
16.0 |
0.87 |
| a-FeOx/NiOx/Pt/GC |
125.0 |
5.0 |
143.7 |
25.0 |
0.87 |
| NiOx/FeOx/Pt/GC |
84.0 |
6.6 |
125.0 |
12.7 |
0.67 |
| NiOx/a-FeOx/Pt/GC |
65.0 |
7.2 |
127.0 |
9.0 |
0.51 |
Table 3 A comparison of the electrocatalytic activities for several catalysts toward FAO
| Electrode |
Idp (mA cm−2) |
Iindp (mA cm−2) |
Idp/Iindp |
Idp/Ib |
Ref. |
| Pt black |
0.458 |
1.828 |
0.250 |
0.231 |
56 |
| Pt/MEA-C |
0.077 |
0.547 |
0.141 |
0.658 |
56 |
| Pt/PDAN/GC |
0.61 |
0.84 |
0.72 |
0.90 |
57 |
| 2Pt4Pd/PVA/GO |
0.92 |
1.23 |
0.75 |
0.69 |
64 |
| Pd/Pt/PDAN/GC |
1.51 |
1.23 |
1.20 |
0.77 |
57 |
| Pt/NGA |
4.63 |
7.48 |
0.62 |
0.71 |
58 |
| Pt/BGA |
5.57 |
10.08 |
0.55 |
0.58 |
58 |
| Pt/GA |
6.78 |
11.46 |
0.59 |
0.74 |
58 |
| Pt/C |
0.43 |
1.50 |
0.29 |
0.20 |
59 |
PtPd (2![[thin space (1/6-em)]](https://www.rsc.org/images/entities/char_2009.gif) : :![[thin space (1/6-em)]](https://www.rsc.org/images/entities/char_2009.gif) 1)/C 1)/C |
1.73 |
2.0 |
0.87 |
0.51 |
59 |
| PtBiPd/C |
— |
— |
0.89 |
0.27 |
63 |
| NiOx/Pt/GC |
3.3 |
0.4 |
3.33–8.3 |
0.40–0.56 |
Ref. 31, this work |
| Au/Pt/GC (thin film) |
— |
— |
3.44 |
0.54 |
60 |
| Si-TiOx/Pt/TiOx (700 °C) |
— |
— |
10.0 |
0.67 |
61 |
| Nano-PtAu2/C |
4.0 |
5.06 |
0.79 |
— |
11 |
| MnOx/Pt (θMnOx = 30%) |
7.6 |
0.5 |
15.2 |
0.85 |
62 |
| FeOx/NiOx/Pt/GC |
4.8 |
0.3 |
16.0 |
0.87 |
This work |
| a-FeOx/NiOx/Pt/GC |
7.5 |
0.3 |
25.0 |
0.87 |
This work |
Fig. 6A & B summarize the activities of these investigated electrocatalysts toward FAO, in which the a-FeOx/NiOx/Pt/GC exhibited the highest catalytic activities (Idp = 7.5 mA cm−2 = 125.0 mA mgPt−1). This denoted ca. 6.3, 2.3, 2.1, 2.0, and 1.6 times higher specific activity than that observed for the Pt/GC, NiOx/Pt/GC, NiOx/a-FeOx/Pt/GC, NiOx/FeOx/Pt/GC, and FeOx/NiOx/Pt/GC catalysts, respectively.
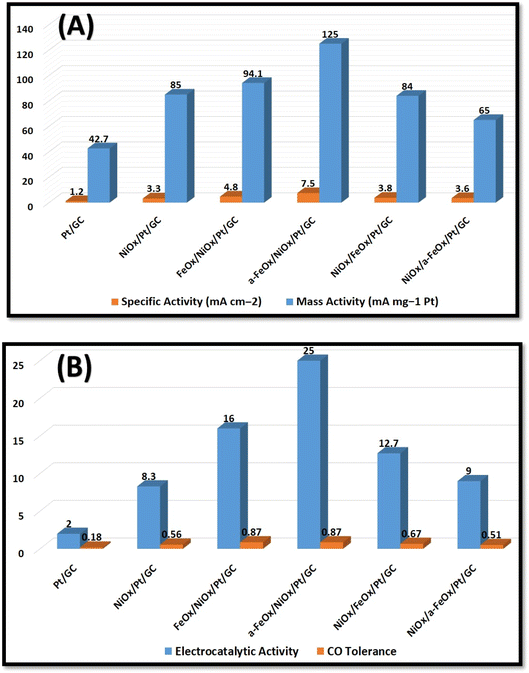 |
| | Fig. 6 Histograms of specific (Idp mA cm−2) and mass activities (Idp mA mgPt−1) (A), and electrocatalytic activity (Idp/Iindp) and CO tolerance (Idp/Ib) (B) of the Pt/GC, NiOx/Pt/GC, FeOx/NiOx/Pt/GC, a-FeOx/NiOx/Pt/GC, NiOx/FeOx/Pt/GC, and NiOx/a-FeOx/Pt/GC electrocatalysts. | |
3.4. Stability of the catalysts
Chronoamperometry (CA) measurements were performed to check the stability of the investigated catalysts. The CA of the Pt/GC, NiOx/Pt/GC, FeOx/NiOx/Pt/GC, and a-FeOx/NiOx/Pt/GC electrodes were conducted in 0.3 mol L−1 FA (pH = 3.5) at 0.3 V for 3 h. As shown in Fig. 7, the current density profile of the a-FeOx/NiOx/Pt/GC catalyst is much higher than that of the other investigated catalysts. For instance, after a period of 3 h, the current densities were ca. 1.0, 0.6, 0.2, and 0.2 mA cm−2 for the a-FeOx/NiOx/Pt/GC, FeOx/NiOx/Pt/GC, NiOx/Pt/GC, and Pt/GC electrodes, respectively. Thus, it is clearly seen that the a-FeOx/NiOx/Pt/GC catalyst maintained the maximum current density among these catalysts, indicating a high stability of the catalyst toward FAO and unlikely electrochemical oxidative dissolution pathways. It should be noted here that the initial decay in the current density from these electrodes might be caused by a different degree of accumulation by COads at the electrode's surface.22,65 Also, a partial dissolution and/or detachment of nano-NiOx and/or nano-FeOx might be possible. Moreover, the observed decay in current density might originate as a transition from the catalytically active to the less active/inactive phases of nano-NiOx and/or nano-FeOx.26
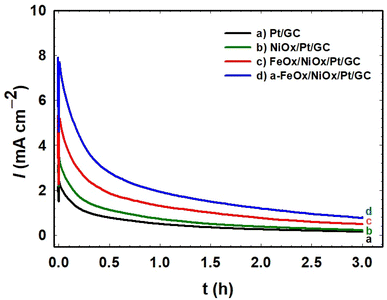 |
| | Fig. 7 Current–time relation obtained during the potentiostatic oxidation of formic acid at 0.3 V on the Pt/GC (a), NiOx/Pt/GC (b), FeOx/NiOx/Pt/GC (c), and a-FeOx/NiOx/Pt/GC (d) electrodes in 0.3 mol L−1 HCOOH (pH = 3.5). | |
3.5. Impedance measurements
To further elaborate on the electron transfer kinetics of FAO on the as-prepared Pt/GC, NiOx/Pt/GC, FeOx/NiOx/Pt/GC, and a-FeOx/NiOx/Pt/GC electrodes, selected EIS measurements were then performed. Fig. 8 shows the representative Nyquist impedance (Fig. 8A) and Bode plots (Fig. 8B) recorded in 0.3 mol L−1 FA (pH 3.5) at 0.1 V in the frequency range of 10 mHz to 100 kHz. The EIS spectra were fitted to the chosen equivalent circuit (inset of Fig. 8A) using the EC-Lab software. Table 4 compares the EIS parameters (Rs: solution resistance, Rct: charge transfer resistance, and CPE: constant phase element) for the different catalyst/electrolyte systems of this investigation. The Nyquist plots are mostly composed of semicircles where the diameter of each semicircle was proportioned to Rct of the same catalyst in a correlation to its catalytic activity. A smaller semicircle diameter implies a faster reaction kinetics, which results in a higher catalytic activity.66 As seen in Fig. 8A, Rct increases in the order a-FeOx/NiOx/Pt/GC < FeOx/NiOx/Pt/GC < NiOx/Pt/GC < Pt/GC. The Rct of the FeOx/NiOx/Pt/GC and a-FeOx/NiOx/Pt/GC catalysts were obviously smaller than those of the NiOx/Pt/GC and Pt/GC electrodes, indicating a faster FAO on the surfaces of the ternary FeOx/NiOx/Pt/GC and a-FeOx/NiOx/Pt/GC catalysts. Thus, the existence of nano-FeOx, especially after activation, alleviated the CO poisoning on the Pt surfaces. The a-FeOx/NiOx/Pt/GC catalyst displayed the smallest semicircle (Rct = 4.27 kΩ), revealing the fastest rate of FAO on its surfaces. Thus, through the above experimental comparisons, it was found that a-FeOx/NiOx/Pt/GC catalyst demonstrated the best electrocatalytic activity toward FAO among all the catalysts prepared in this investigation.
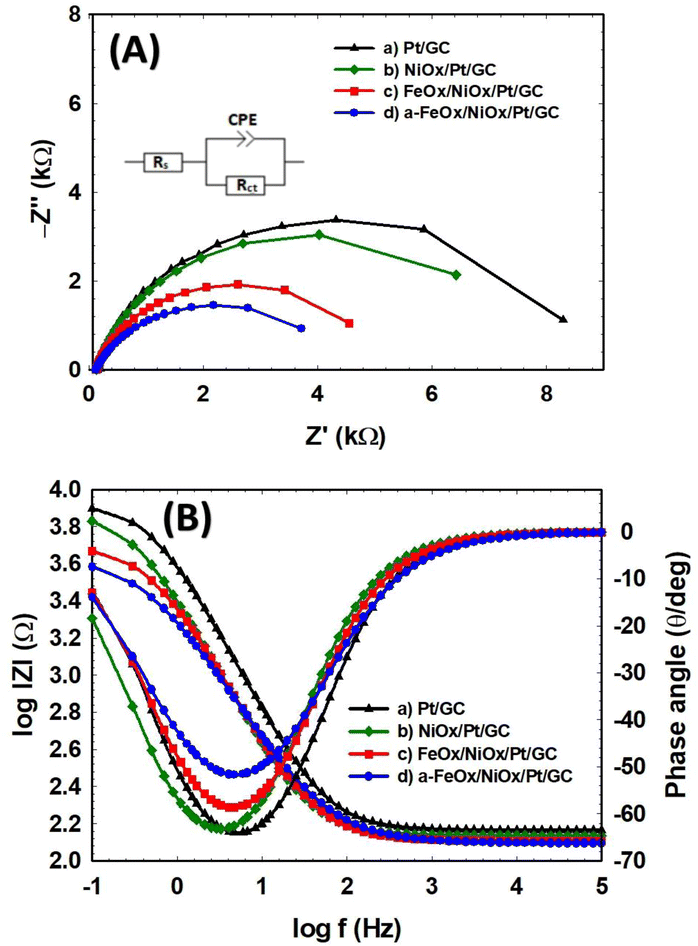 |
| | Fig. 8 Nyquist (A) and Bode (B) plots of the Pt/GC (a), NiOx/Pt/GC (b), FeOx/NiOx/Pt/GC (c), and a-FeOx/NiOx/Pt/GC (d) electrodes obtained at 0.1 V in 0.3 mol L−1 FA (pH 3.5) and equivalent circuit of the system (inset in (A)). | |
Table 4 Impedance parameters obtained during FAO at the Pt/GC, NiOx/Pt/GC, FeOx/NiOx/Pt/GC, and a-FeOx/NiOx/Pt/GC electrodes. The data were obtained from the corresponding EIS spectra (Fig. 8)
| Electrode |
Rs [kΩ] |
Rct [kΩ] |
CPE [μFs(α−1)] |
α |
| Pt/GC |
0.145 |
8.40 |
43.66 |
0.8697 |
| NiOx/Pt/GC |
0.136 |
7.57 |
74.00 |
0.8623 |
| FeOx/NiOx/Pt/GC |
0.127 |
4.98 |
77.43 |
0.8374 |
| a-FeOx/NiOx/Pt/GC |
0.124 |
4.27 |
102.50 |
0.7607 |
3.6. Electrochemical performance analysis
The oxidation of CO was examined to quantitatively estimate its amount on the different inspected catalysts. The improvement of the FAO on Pt by the addition of metal oxide(s) might be caused by the preferred reaction in the dehydrogenation (third-body and/or electronic effect) or by the efficient removal of COads produced in the dehydration route (bifunctional effect).30 The CO-stripping measurements were carried out by holding the catalysts in 0.5 mol L−1 FA solution for 10 min to saturate the electrolyte as well as allow for the adsorption of CO on the electrocatalysts' surfaces. The adsorbed CO species were then desorbed electrochemically during the CV scan shown in Fig. 9. The primary CO oxidation peaks on the Pt/GC, NiOx/Pt/GC, FeOx/NiOx/Pt/GC, and a-FeOx/NiOx/Pt/GC electrodes were located at 0.85, 0.76, 0.72, and 0.70 V, respectively, which indicated a stronger CO adsorption on the “pristine” Pt surface compared to the Pt-modified electrodes. The oxidation peaks potential for CO oxidation on the NiOx/Pt/GC, FeOx/NiOx/Pt/GC, and a-FeOx/NiOx/Pt/GC electrodes, however, were negatively shifted, indicating weaker CO adsorption bonds on the Pt active sites in the presence of the deposited metal oxides (nano-NiOx and/or nano-FeOx). The presence of nano-NiOx and nano-FeOx structures on the surface of the Pt/GC electrode was expected to increase the amount of oxygen and oxygen-containing functional groups and thus minimized the adsorption of COads and the associated poisoning effects.
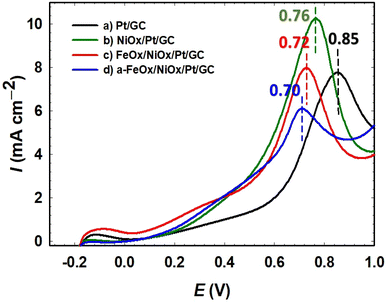 |
| | Fig. 9 CO stripping voltammograms of Pt/GC (a), NiOx/Pt/GC (b), FeOx/NiOx/Pt/GC (c), and a-FeOx/NiOx/Pt/GC (d) electrodes in 0.5 mol L−1 H2SO4 solution. | |
4. Conclusion
The current work demonstrated that the deposition of ferric oxyhydroxide nanoparticles on the surface of NiOx/Pt/GC was critical in improving the catalytic activity (especially with activation at −0.5 V in 0.2 mol L−1 NaOH) for the FAO. The prepared a-FeOx/NiOx/Pt/GC electrode exhibited a catalytic enhancement that is ∼12.5-folds higher, with 214 mV negative shift in the Eonset for FAO and a 5-fold better durability compared to the Pt/GC electrode. The modification of the Pt/GC electrode with nano-NiOx and nano-FeOx nanoparticles provided the presence of surface functionalities and structures that synergistically improved FAO, possibly by favoring the direct route (dehydrogenation) on the expense of the unfavorable indirect route (dehydration). Interestingly, the a-FeOx/NiOx/Pt/GC catalyst exhibited a significant increase in the Idp (from 1.2 mA cm−2, as observed for the Pt/GC electrode, to 7.5 mA cm−2) and decrease in the Iindp (from 0.6 mA cm−2, as observed for the Pt/GC electrode, to 0.3 mA cm−2). In addition, the EIS and CO stripping inspections proved the enhanced charge transfer kinetics in the case of the FeOx/NiOx/Pt/GC electrode compared to the other investigated electrodes. Thus, the FeOx/NiOx/Pt/GC surface is considered as a good candidate for the electrochemical FAO.
Conflicts of interest
There are no conflicts to declare.
Acknowledgements
This work was supported by the Faculty of Science at Cairo University.
References
- Y. Sun, B. Huang, Y. Li, Y. Qin, Z. Fu, M. Sun, L. Wang and S. Guo, Fundam. Res., 2021, 1, 453–460 CrossRef CAS
 .
. - W. Luo, Y. Jiang, M. Wang, D. Lu, X. Sun and H. Zhang, RSC Adv., 2023, 13, 4803–4822 RSC
 .
. - L. Yang, Y. Wang, H. Feng, H. Zeng, C. Tan, J. Yao, J. Zhang, L. Jiang and Y. Sun, Chem.–Asian J., 2021, 16, 34–38 CrossRef CAS PubMed
 .
. - S. Ha, R. Larsen, Y. Zhu and R. Masel, Fuel Cells, 2004, 4, 337–343 CrossRef CAS
 .
. - X. Hu, J. Zou, H. Gao and X. Kang, J. Colloid Interface Sci., 2020, 570, 72–79 CrossRef CAS PubMed
 .
. - B. A. Al-Qodami, H. H. Alalawy, I. M. Al-Akraa, S. Y. Sayed, N. K. Allam and A. M. Mohammad, Int. J. Hydrogen Energy, 2022, 47, 264–275 CrossRef CAS
 .
. - I. M. Al-Akraa, B. A. Al-Qodami, M. S. Santosh, R. Viswanatha, A. K. Thottoli and A. M. Mohammad, Int. J. Electrochem. Sci., 2020, 15, 5597–5608 CrossRef CAS
 .
. - M. Liang, T. Xia, H. Gao, K. Zhao, T. Cao, M. Deng, X. Ren, S. Li, H. Guo and R. Wang, Nano Res., 2022, 15, 1221–1229 CrossRef CAS
 .
. - S. Luo, W. Chen, Y. Cheng, X. Song, Q. Wu, L. Li, X. Wu, T. Wu, M. Li and Q. Yang, Adv. Mater., 2019, 31, 1903683 CrossRef CAS PubMed
 .
. - A. M. Mohammad, I. M. Al-Akraa and M. S. El-Deab, Int. J. Hydrogen Energy, 2018, 43, 139–149 CrossRef CAS
 .
. - X. Wen, S. Yin, H. Yin and Y. Ding, Electrochim. Acta, 2021, 373, 137884 CrossRef CAS
 .
. - Y. Zhu, Y. Pan, Y. Zhu, H. Jiang, J. Shen and C. Li, J. Colloid Interface Sci., 2021, 593, 244–250 CrossRef CAS PubMed
 .
. - Y.-X. Wang, C.-F. Liu, M.-L. Yang, X.-H. Zhao, Z.-X. Xue and Y.-Z. Xia, Chin. Chem. Lett., 2017, 28, 60–64 CrossRef CAS
 .
. - J. V. Perales-Rondón, S. Brimaud, J. Solla-Gullón, E. Herrero, R. J. Behm and J. M. Feliu, Electrochim. Acta, 2015, 180, 479–485 CrossRef
 .
. - D. M. Sayed, G. A. El-Nagar, S. Y. Sayed, B. E. El-Anadouli and M. S. El-Deab, Electrochim. Acta, 2018, 276, 176–183 CrossRef CAS
 .
. - V. Briega-Martos, J. Solla-Gullón, M. T. Koper, E. Herrero and J. M. Feliu, Electrochim. Acta, 2019, 295, 835–845 CrossRef CAS
 .
. - Y. Chen, H.-J. Niu, Y.-G. Feng, J.-H. Wu, A.-J. Wang, H. Huang and J.-J. Feng, Appl. Surf. Sci., 2020, 510, 145480 CrossRef CAS
 .
. - G. A. El-Nagar, A. M. Mohammad, M. S. El-Deab and B. E. El-Anadouli, ACS Appl. Mater. Interfaces, 2017, 9, 19766–19772 CrossRef CAS PubMed
 .
. - D. Minudri, A. Tesio, F. Fungo, R. Palacios, P. Cappellari, E. Pastor, G. Planes and A. Palpalá, J. Power Sources, 2021, 483, 229189 CrossRef CAS
 .
. - Y. M. Asal, A. M. Mohammad, S. S. Abd El Rehim and I. M. Al-Akraa, J. Saudi Chem. Soc., 2022, 101437 CrossRef CAS
 .
. - S. Chen and A. Chen, in Encycl. Inter. Chem., ed. K. Wandelt, Elsevier, Oxford, 2018, pp. 607–619, DOI:10.1016/B978-0-12-409547-2.13321-9
 .
. - G. A. El-Nagar and A. M. Mohammad, Int. J. Hydrogen Energy, 2014, 39, 11955–11962 CrossRef CAS
 .
. - H. H. Farrag, I. M. Al-Akraa, N. K. Allam and A. M. Mohammad, Arabian J. Chem., 2023, 16, 104524 CrossRef CAS
 .
. - M. Lv, W. Li, H. Liu, W. Wen, G. Dong, J. Liu and K. Peng, Chin. J. Catal., 2017, 38, 939–947 CrossRef
 .
. - S. Chen, Q. Yuan and X. Wang, Chem. Commun., 2023, 59, 2473–2476 RSC
 .
. - G. A. El-Nagar, A. M. Mohammad, M. S. El-Deab and B. E. El-Anadouli, J. Electrochem. Soc., 2012, 159, F249 CrossRef CAS
 .
. - Z.-F. Wu, Z.-Q. Jiang, Y.-K. Jin, F. Xiong, G.-H. Sun and W.-X. Huang, Chin. J. Catal., 2016, 37, 1738–1746 CrossRef CAS
 .
. - Y. Xie and N. Dimitrov, Appl. Catal., B, 2020, 263, 118366 CrossRef CAS
 .
. - H. Shi, F. Liao, W. Zhu, C. Shao and M. Shao, Int. J. Hydrogen Energy, 2020, 45, 16071–16079 CrossRef CAS
 .
. - G. A. El-Nagar, A. M. Mohammad, M. S. El-Deab and B. E. El-Anadouli, Electrochim. Acta, 2013, 94, 62–71 CrossRef CAS
 .
. - I. M. Al-Akraa, A. E. Salama, Y. M. Asal and A. M. Mohammad, Arabian J. Chem., 2021, 14, 103383 CrossRef CAS
 .
. - B. A. Al-Qodami, H. H. Farrag, S. Y. Sayed, N. K. Allam, B. E. El-Anadouli and A. M. Mohammad, J. Nanotechnol., 2018, 2018, 4657040 Search PubMed
 .
. - B. A. Al-Qodami, H. H. Alalawy, S. Y. Sayed, I. M. Al-Akraa, N. K. Allam and A. M. Mohammad, RSC Adv., 2022, 12, 20395–20402 RSC
 .
. - Y.-X. Chen, S.-P. Chen, Q.-S. Chen, Z.-Y. Zhou and S.-G. Sun, Electrochim. Acta, 2008, 53, 6938–6943 CrossRef CAS
 .
. - Z. Dongsheng, G. Wenqiang, C. Guozhang, L. Shuai, J. Weizhou and L. Youzhi, Adv. Powder Technol., 2019, 30, 581–589 CrossRef
 .
. - S. Banik, A. Mahajan, S. R. Chowdhury and S. K. Bhattacharya, RSC Adv., 2016, 6, 92490–92501 RSC
 .
. - M. Saleh, Curr. Top. Electrochem., 2014, 18, 45–70 Search PubMed
 .
. - C. X. Guo and C. M. Li, Nano Energy, 2017, 42, 166–172 CrossRef CAS
 .
. - M. Nagasaka, H. Yuzawa, T. Horigome, A. P. Hitchcock and N. Kosugi, J. Phys. Chem. C, 2013, 117, 16343–16348 CrossRef CAS
 .
. - M. Ding, T. Liu, Y. Zhang, Z. Cai, Y. Yang and Y. Yuan, R. Soc. Open Sci., 2019, 6, 181309 CrossRef CAS PubMed
 .
. - M. S. El-Deab and T. Ohsaka, J. Electrochem. Soc., 2007, 155, D14 CrossRef
 .
. - M. G. Abd El-Moghny, H. H. Alalawy, A. M. Mohammad, A. A. Mazhar, M. S. El-Deab and B. E. El-Anadouli, Int. J. Hydrogen Energy, 2017, 42, 11166–11176 CrossRef CAS
 .
. - G. Cabello, R. A. Davoglio, F. W. Hartl, J. F. Marco, E. C. Pereira, S. R. Biaggio, H. Varela and A. Cuesta, Electrochim. Acta, 2017, 224, 56–63 CrossRef CAS
 .
. - C. Prabhu, A. Valechha, S. Wanjari, N. Labhsetwar, S. Kotwal, T. Satyanarayanan and S. Rayalu, J. Mol. Catal. B: Enzym., 2011, 71, 71–78 CrossRef CAS
 .
. - A. C. Garcia, E. B. Ferreira, V. V. S. de Barros, J. J. Linares and G. Tremiliosi-Filho, J. Electroanal. Chem., 2017, 793, 188–196 CrossRef CAS
 .
. - A. O. Elnabawy, J. A. Herron, J. Scaranto and M. Mavrikakis, J. Electrochem. Soc., 2018, 165, J3109 CrossRef CAS
 .
. - I. M. Sadiek, A. M. Mohammad, M. E. El-Shakre and M. S. El-Deab, Int. J. Hydrogen Energy, 2012, 37, 68–77 CrossRef CAS
 .
. - Y. Jia, T. Luo, X.-Y. Yu, Z. Jin, B. Sun, J.-H. Liu and X.-J. Huang, New J. Chem., 2013, 37, 2551–2556 RSC
 .
. - D. Kumar, H. Singh, S. Jouen, B. Hannoyer and S. Banerjee, RSC Adv., 2015, 5, 7138–7150 RSC
 .
. - R. Chen, S. Zhao, H. Liu, X. Song and Y. Wei, J. Photochem. Photobiol., A, 2015, 312, 73–80 CrossRef CAS
 .
. - S. Wu, J. Lu, Z. Ding, N. Li, F. Fu and B. Tang, RSC Adv., 2016, 6, 82118–82130 RSC
 .
. - H. Zhang, J. Wang, X. Zhang, B. Li and X. Cheng, Chem. Eng. J., 2019, 369, 834–844 CrossRef CAS
 .
. - J. Parhizkar and M. H. Habibi, J. Water Environ. Nanotechnol., 2019, 4, 17–30 CAS
 .
. - A. L. Ong, K. K. Inglis, D. K. Whelligan, S. Murphy and J. R. Varcoe, Phys. Chem. Chem. Phys., 2015, 17, 12135–12145 RSC
 .
. - J. Hu, S. Xue, O. Schneider, G. Yesilbas, A. Knoll and X. Huang, Electrochem. Commun., 2020, 119, 106826 CrossRef CAS
 .
. - M. J. Ooi and A. A. Aziz, Int. J. Hydrogen Energy, 2017, 42, 9063–9068 CrossRef
 .
. - A. Shatla, K. Hassan, A. Abd-El-Latif, A. Hathoot, H. Baltruschat and M. Abdel-Azzem, J. Electroanal. Chem., 2019, 833, 231–241 CrossRef CAS
 .
. - M. S. Çögenli and A. B. Yurtcan, Int. J. Hydrogen Energy, 2020, 45, 650–666 CrossRef
 .
. - M. S. Çögenli and A. B. Yurtcan, Int. J. Hydrogen Energy, 2018, 43, 10698–10709 CrossRef
 .
. - I. M. Al-Akraa, Y. M. Asal and A. M. Mohammad, J. Nanomater., 2019, 2019, 2784708 Search PubMed
 .
. - I. M. Al-Akraa and A. M. Mohammad, Arabian J. Chem., 2020, 13, 4703–4711 CrossRef CAS
 .
. - M. S. El-Deab, J. Adv. Res., 2010, 1, 87–93 CrossRef
 .
. - L. Sui, W. An, C. K. Rhee and S. H. Hur, J. Electrochem. Sci. Technol., 2020, 11, 84–91 CrossRef CAS
 .
. - S. Saipanya, L. Fang, S. Themsirimongkon, S. Maturost, N. Pongpichayakul, N. Promsawan and P. Waenkaew, Polym. Adv. Technol., 2023, 34, 120–133 CrossRef CAS
 .
. - W. Chen and S. Chen, J. Mater. Chem., 2011, 21, 9169–9178 RSC
 .
. - W.-L. Qu, Z.-B. Wang, Y. Gao, C. Deng, R.-H. Wang, L. Zhao and X.-L. Sui, Int. J. Hydrogen Energy, 2018, 43, 407–416 CrossRef CAS
 .
.
|
| This journal is © The Royal Society of Chemistry 2023 |
Click here to see how this site uses Cookies. View our privacy policy here.  Open Access Article
 d and
Ahmad M. Mohammad
 *a
*a

 where, Amod and Aunmod refer to the ECSA of the modified and the unmodified Pt/GC electrodes, respectively. The surface coverages of nano-NiOx or/and nano-FeOx nanoparticles for the NiOx/Pt/GC, FeOx/NiOx/Pt/GC, a-FeOx/NiOx/Pt/GC, NiOx/FeOx/Pt/GC, and NiOx/a-FeOx/Pt/GC modified electrodes were estimated to be ca. 37, 45, 65, 45, and 55%, respectively. It is worth noting here that the CV of the NiOx/Pt/GC electrode in acidic medium did not display any redox peaks characteristic for nickel oxides, which are unstable and dissolve in acidic media,42 whereas the redox peak for the Fe2+/Fe3+ transformation appeared in the potential range from 0.4 to 0.6 V, confirming the successful deposition of the iron species.
![[thin space (1/6-em)]](https://www.rsc.org/images/entities/char_2009.gif) :
:![[thin space (1/6-em)]](https://www.rsc.org/images/entities/char_2009.gif) 1)/C
1)/C
.
.
.
.
.
.
.
.
.
.
.
.
.
.
.
.
.
.
.
.
.
.
.
.
.
.
.
.
.
.
.
.
.
.
.
.
.
.
.
.
.
.
.
.
.
.
.
.
.
.
.
.
.
.
.
.
.
.
.
.
.
.
.
.
.
.


