
 Open Access Article
 This Open Access Article is licensed under a Creative Commons Attribution-Non Commercial 3.0 Unported Licence
A ratiometric electrochemical probe for the quantification of apixaban in unprocessed plasma samples using carbon aerogel/BFO modified glassy carbon electrodes†
Payam Shahbazi-Derakhshiab,
Mohammad Abbasi b,
Amirhossein Akbarzadehc,
Ahad Mokhtarzadehd,
Hamid Hosseinpoure and
Jafar Soleymani*a
b,
Amirhossein Akbarzadehc,
Ahad Mokhtarzadehd,
Hamid Hosseinpoure and
Jafar Soleymani*a
aPharmaceutical Analysis Research Center, Tabriz University of Medical Sciences, Tabriz, Iran. E-mail: jsoleymanii@gmail.com; soleymanij@tbzmed.ac.ir; Tel: +98 413 337 9323
bLiver and Gastrointestinal Research Center, Tabriz University of Medical Sciences, Tabriz, Iran
cCardiovascular Research Center, Tabriz University of Medical Sciences, Tabriz, Iran
dImmunology Research Center, Tabriz University of Medical Sciences, Tabriz, Iran
eDepartment of Neurosurgery, Faculty of Medicine, Urmia University of Medical Sciences, Urmia, Iran
First published on 17th July 2023
Abstract
A novel electrochemical probe was established for the quantification of apixaban (APX) in unprocessed plasma samples. Efficiently oxidized graphene oxide aerogels (EEGO-AGs) and nano-sized Bi2Fe4O9 (BFO) particles were electrodeposited on the surface of a glassy carbon electrode (GCE). In this work, a ratiometric electrochemical method was introduced for APX detection to enhance the specificity of the probe in plasma samples. The fabricated ratiometric probe was employed for the indirect detection determination of APX using K3[Fe(CN)6]/K4[Fe(CN)6] as the redox pair. The differential pulse voltammetry technique was used to record the current alteration of the BFO/EEGO-AG-functionalized GCE probe at various APX concentrations. The probe response was proportional to the APX concentrations from 10 ng mL−1 to 10 μg mL−1 with a low limit of quantification (LLOQ) of 10 ng mL−1. After validation, this method was successfully utilized for the determination of APX in patients' plasma samples who have taken APX regularly. The fabricated chemosensor detected APX concentrations in unprocessed plasma samples with high selectivity, resulting from the physical filtering antifouling activity of aerogels.
1. Introduction
Apixaban (APX) is a molecule with a molecular formula of C25H25N5O4 and a molecular weight of 459.5 g mol−1 and is known as a selective inhibitor of factor Xa.1 Factor Xa is the final enzyme in the coagulation cascade and is responsible for the formation of fibrin clot by converting prothrombin to thrombin.2,3 APX has no direct effect on platelet aggregation but indirectly reduces thrombin-induced clot formation by inhibiting the factor Xa.1 By inhibiting the factor Xa, APX inhibits thrombin generation and thrombus development, showing an antithrombotic effect in the prevention of arterial and venous thrombosis at doses that maintain hemostasis.4 The uses of APX in the treatment of acute venous thromboembolism include the prevention of stroke or systemic embolism in patients with atrial fibrillation, after major orthopedic surgeries, etc.5,6 APX possesses 50% bioavailability and is eliminated through multiple elimination routes, including renal excretion (25%) and hepatic metabolism (75%).7,8 Anticoagulants are broadly employed in the prevention and therapy of thromboembolic diseases.9 Direct oral anticoagulants (DOACs) are one of the popular therapies because of their predictable pharmacological influences and broader therapeutic concentration range.10 One of the important advantages of DOACs such as APX is their targeted effect on a specific coagulation factor.11 DOACs showed more desired pharmacokinetics than traditional coumarin-derived anticoagulants with low drug–drug and drug–food interactions.12,13Currently, different guidelines are given for the dose adjustment of DOACs in specific populations involving hepatic and renal impairment, the elderly, and body weight.10 However, a recent study found that about 25–50% of patients receive off-label doses, suggesting that DOAC overdose is associated with increased mortality and bleeding effects, whereas fewer DOACs with serious cardiovascular effects led to hospitalization.14 Collectively, these facts highlight the significance of therapeutic drug monitoring (TDM) of DOACs, not only to assess patient adherence to therapy but also regulate their possible toxicity.15 This requires the fabrication of reliable bioanalytical probes that can determine the plasma levels of DOACs and hence optimize drug therapy and control drug toxicity.15,16 Conventional laboratory assays for DOACs are activated partial thromboplastin time (APTT) and prothrombin time (PT), which are not appropriate for reliable detection of DOACs.17 Several representative analytical approaches have been reported in the literature for the determination of APX in real samples in the presence of its related impurities, which were mainly based on liquid chromatography.18–20 However, these methods are originally laborious, time-consuming and need highly skilled persons to operate the instrument and interpret the obtained results. Electrochemical methods have some advantages of short analysis time, cost-effectiveness, high sensitivity, and the possibility to be a point-of-care testing method.
Electrochemical methods can convert the biological signals into electrical signals, respectively.21–27 Due to the important progresses in nanotechnology, an increase in the electrochemical sensors is provided by the modification of the surface of electrodes. Bi2Fe4O9 (BFO) is a semiconductor with high surface-to-volume ratio, making it a promising multifunctional material candidate for sensor designing uses.28,29 Aerogels are three-dimensional (3D) and highly porous materials with ultralow density (0.003 g cm−3) and large specific surface area.30 These specific features of aerogels led them to be employed in the fabrication of various devices. Electrochemical polymerization or electropolymerization is an electrode-surface modifying method in which a thin layer of polymer films is produced under an electrochemical condition using mostly potentiostatic (constant potential) or potentiodynamic (linearly scanned potential) techniques.31–34
In this study, a ratiometric electrochemical chemosensor was developed to detect APX in unprocessed plasma samples. To achieve this goal, a multilayer nanocomposite layer of efficiently oxidized graphene oxide aerogels (EEGO-AGs) and BFO were initially synthesized and then immobilized on the surface of the working electrode by the electrodeposition method. BFO/EEGO-AG increases the geometrical surface of the GCE and enhances the interaction between the electrode and analyte. The fabricated sensor displayed significant electrochemical performance towards APX. As a result, with various analytical features, it is possible to identify and detect APX in patients' samples.
2. Experimental
2.1. Chemicals and reagents
APX was purchased from Exir pharmaceutical Co. (Karaj, Iran). Hydrochloric acid (HCl), sodium hydroxide, sulfuric acid (H2SO4), phosphoric acid (H3PO4), phosphorus pentoxide (P2O5), potassium permanganate (KMnO4), graphite, sodium nitrate (NaNO3), hydrogen peroxide (H2O2), and ascorbic acid (AA) were purchased from Sigma (Germany). Phosphate buffer solutions were prepared using NaH2PO4 and Na2HPO4. Also, a stock solution of APX (200 μg mL−1) was prepared by dissolving APX in the buffer solution (50 mM, pH = 6.0). Also, efficiently oxidized graphene oxide (EEGO) aerogel microparticles and BFO nanoparticles were dispersed in water through sonication. Triple deionized water was utilized for the preparation of any solution. Plasma samples were provided by the Iranian Blood Transfusion Organization (Tabriz, Iran). | ||
| Scheme 1 Schematic representation of the sensor fabrication and detection of APX using the electrochemical method. | ||
2.2. Apparatus and measurements
All electrochemical measurements were recorded using an AUTOLAB electrochemical system equipped with a three-electrode system of reference (Ag/AgCl electrode), working (GCE, d = 2 mm, Azar Electrode Company (Urmia, Iran)), and counter (platinum electrode) electrodes. A field emission scanning electron microscope (FESEM, FEG-SEM MIRA3 TESCAN (Brno, Czech Republic)) was used to show the morphology of the materials. Fourier transform infrared (FTIR, Bruker model instrument (Billerica, Massachusetts, US)) was utilized to characterize the functional groups.2.3. Synthesis
![[thin space (1/6-em)]](https://www.rsc.org/images/entities/char_2009.gif) :3 ratio was supplemented into the holes and pores and then kept at 40 °C for another 20 h to create the second stage of EEGO gelation. Finally, the as-prepared EEGO-AGs were collected by the freeze-drying technique.37:2 molar ratio) were added into 7.5 mL of HNO3 (2.0 M) solution. To deposit Bi3+ and Fe3+ ions, about 25 mL of KOH (2.0 M) was supplemented to the solution dropwise. The brown solid was collected using a centrifuge (10.000 rpm, 10 min) and washed with deionized water three times. Afterward, 20 mL of NaOH (12 M) was added to the solid and stirred for about 1 h. The dispersed mixture was moved into a 50 mL Teflon liner autoclave and kept at 180 °C for 24 h. After finishing the hydrothermal treatment, the mixture was cooled down to room temperature. Finally, the brown precipitate was centrifuged and washed several times with water and ethanol and dried at a temperature of 80 °C for about 4 h.38
:3 ratio was supplemented into the holes and pores and then kept at 40 °C for another 20 h to create the second stage of EEGO gelation. Finally, the as-prepared EEGO-AGs were collected by the freeze-drying technique.37:2 molar ratio) were added into 7.5 mL of HNO3 (2.0 M) solution. To deposit Bi3+ and Fe3+ ions, about 25 mL of KOH (2.0 M) was supplemented to the solution dropwise. The brown solid was collected using a centrifuge (10.000 rpm, 10 min) and washed with deionized water three times. Afterward, 20 mL of NaOH (12 M) was added to the solid and stirred for about 1 h. The dispersed mixture was moved into a 50 mL Teflon liner autoclave and kept at 180 °C for 24 h. After finishing the hydrothermal treatment, the mixture was cooled down to room temperature. Finally, the brown precipitate was centrifuged and washed several times with water and ethanol and dried at a temperature of 80 °C for about 4 h.382.4. Sensor fabrication
 | ||
| Fig. 1 The consecutive CVs of the electrodeposition of EEGO-AGs on the surface of a GCE (N = 10 cycles, scan rate = 100 mV s−1, PBS = 50 mM, pH = 7.0). | ||
 | ||
| Fig. 2 The electrodeposition process of BFO NPs on the surface of the EEGO-AG-modified GCE (N = 10 cycles, scan rate 100 mV s−1, PBS 50 mM, pH 7.0). | ||
3. Results and discussion
3.1. Surface modification of the GCE with EEGO-AGs and BFO and characterization of nanoparticles
The EEGO-AG particles were electrodeposited onto the GCE through CV as explained in Section 2.4.2 and presented in Fig. 1. The increment of anodic peak current indicates the attachment of the EEGO-AGs and a growth in the amount of EEGO-AGs upon increasing the number of cycles. The surface of the electrodeposited EEGO-AG GCE electrode is irreversible and stable in the buffer solution. Upon electrodeposition of EEGO-AGs, the enhanced characteristic oxidation peak current at −0.5 V indicates efficient attachment of EEGO-AGs. The enhanced anodic peak current results from the further attachment of EEGO-AGs on the surface of the GCE. After 10-cycle scanning, the anodic peak remained constant, revealing the maximum attachment of GO on the electrode surface. The electrodeposited EEGO-AGs onto the GCE not only improve the electrocatalytic behavior but also enhance the active surface area for grafting BFO nanoparticles.Upon modification of EEGO-AGs/GCE with BFO nanoparticles, the current of the BFO/EEGO-AG/GCE probe was further increased, which is mainly related to the electrocatalytic activity and high surface-to-volume ratio of BFO NPs (Fig. 2). Electrodeposition of BFO can regulate the electroanalytical properties of the EEGO-AGs/GCE by altering the morphology and available cavities. The anodic peak current is increased with increasing the cycle numbers and attachment of more BFO NPs onto the surface of the GCE, approving the improvement of electrocatalytic properties of the electrode. The optimum condition, i.e., high anodic current is observed after 10 cycles, suggesting the lowest number of electrodeposition CVs for functionalization with BFO NPs.
The surface morphology of the BFO/EEGO-AG/GCE layer was investigated using FESEM. Fig. 3a reveals that that BFO/EEGO-AG is uniformly electrodeposited onto the GCE surface and displays rough and wrinkled-like sheets arisen by the GO structure. Indeed, this morphology of the deposited layer can facilitate the target analyte diffusion from the supporting electrolyte to the sensing layer near the surface of the GCE. Furthermore, the well-combined and well-dispersed BFO NPs with EEGO AGs may provide an enhanced surface area as a favourable substrate for the fabrication of highly sensitive electrochemical sensors.
 | ||
| Fig. 3 SEM images of (a) surface of the BFO/EEGO-AG-modified GCE electrode, (b) BFO NPs, and (c) GO AGs on various scales. | ||
Fig. 3b and c shows the FESEM images of the BFO NPs and EEGO AGs, respectively. Compared with the characteristic sheet-like morphology of EEGO, the BFO NPs exhibit a considerably diverse morphology. After electrodeposition of BFO NPs, the thin wrinkled EEGO sheets were totally covered by a layer of BFO NPs, which comprises different cavities to allow APX molecules to electrochemically react on the surface of the modified electrode.
Fig. S1a and b† shows the FTIR spectra of the EEGO AGs and Bi2Fe4O9 particles, respectively. The GO has two chief absorption spectra at 1730 cm−1 and 1055 cm−1 corresponding to the C![[double bond, length as m-dash]](https://www.rsc.org/images/entities/char_e001.gif) O and C–O, respectively.39 The hydrogen bond may be the main interaction to create the aerogel structure, which could be affected by the CO and C–O position at the long wavenumber region (near 1740 cm−1).40 The absorption peak spectra at around 1420 cm−1 and 1610–1630 cm−1 range are attributed to the asymmetric carboxylic stretching vibration and the stretching vibration of CC, respectively. The hydroxyl and carboxyl functional groups increase the integration between BFO and EEGO particles by a wide range of interactions.41
O and C–O, respectively.39 The hydrogen bond may be the main interaction to create the aerogel structure, which could be affected by the CO and C–O position at the long wavenumber region (near 1740 cm−1).40 The absorption peak spectra at around 1420 cm−1 and 1610–1630 cm−1 range are attributed to the asymmetric carboxylic stretching vibration and the stretching vibration of CC, respectively. The hydroxyl and carboxyl functional groups increase the integration between BFO and EEGO particles by a wide range of interactions.41
The stretching and bending vibrations of Fe–O are presented in the range of 400–813 cm−1. BFO NPs have an orthorhombic structure with two different sites for four iron atoms, i.e., octahedral and tetrahedral sites. The absorption peaks of octahedral and tetrahedral sites are present at 440 and 470 cm−1 (Fe cations in FeO6), and 523 and 609 (O–Fe–O and Fe–O–Fe). The absorption peaks at 638 and 840 cm−1 correspond to the stretching vibration of the Fe ions in the FeO4 tetrahedral structure. An absorption peak at 1636 cm−1 is devoted to the O–H stretching vibration of water.42
3.2. Electrochemical characterization of BFO/EEGO-AGs/GCE
Electrochemical performance of the redox probe was studied during step-by-step surface modification of the GCE using the CV technique, which offers important evidence of the BFO/EEGO-AG/GCE electrode performance in the presence and absence of APX. Fig. 4 illustrates the CVs of a bare GCE, EEGO-AGs/GCE, and BFO/EEGO-AGs/GCE in the presence and absence of APX (5 μg mL−1) in the supporting electrolyte phosphate buffer solution (50 mM, pH = 6.0, 5 mM Fe(CN)64−/Fe(CN)63−) at the potential between −1.0 and +1.0 V with a scanning rate of 100 mV s−1.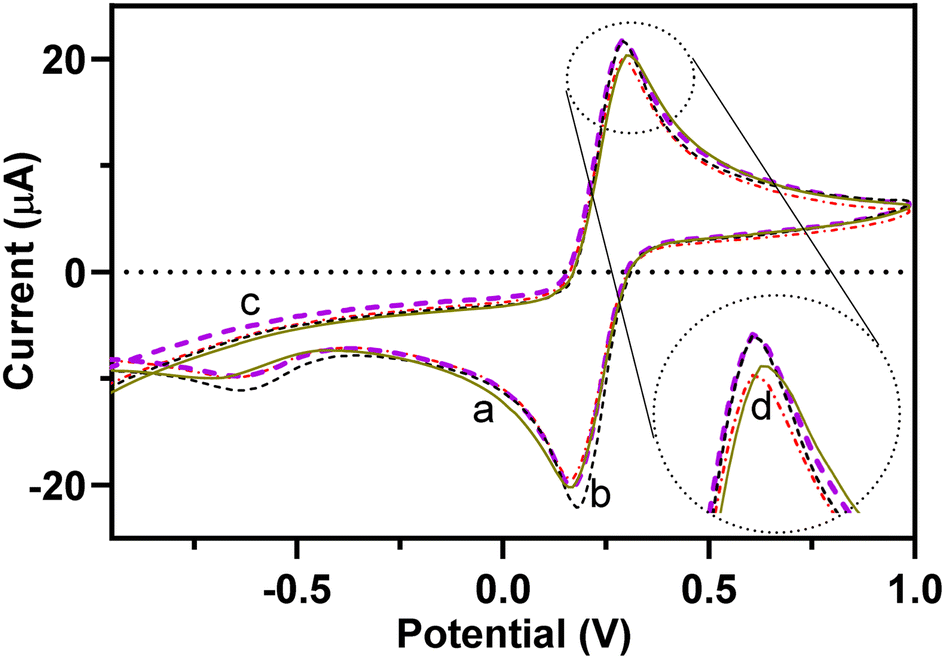 | ||
| Fig. 4 (a) CVs of a bare GCE, (b) EEGO-AG modified GCE, and (c) EEGO-AG/BFO modified GCE in the absence and (d) presence of APX (20 mg L−1) (PBS 50 mM, pH 4.0, scan rate 100 mV s−1). | ||
Upon modification of the surface of the bare GCE with EEGO-AGs and BFO particles, the electrochemical activity of the electrode is increased. The potential of the Fe(CN)64−/Fe(CN)63− redox pair is altered from +0.31 to 0.29 V, approving the surface modification of the GCE with EEGO-AGs and BFO. The peak current at 0.29 V is decreased upon the addition of the analyte, which is a result of blocking of redox pair reduction and oxidation by APX. The nanoparticles enhance the specific surface area to facilitate the Fe(CN)64−/Fe(CN)63− redox reaction.
3.3. Effect of pH
The electrochemical performance of the BFO/EEGO-AG/GCE probe is strongly influenced by the pH value. This effect on the peak potential and current of the redox pair was studied using the CV technique. Fig. 5a demonstrates the CVs at the pH from 2.0 to 10.0. Fig. 5b shows the Epa vs. pH plots, and the following equation (eqn (1)) is obtained.| Epa (V) = 0.02171pH + 0.2079, R2 = 0.9823 | (1) |
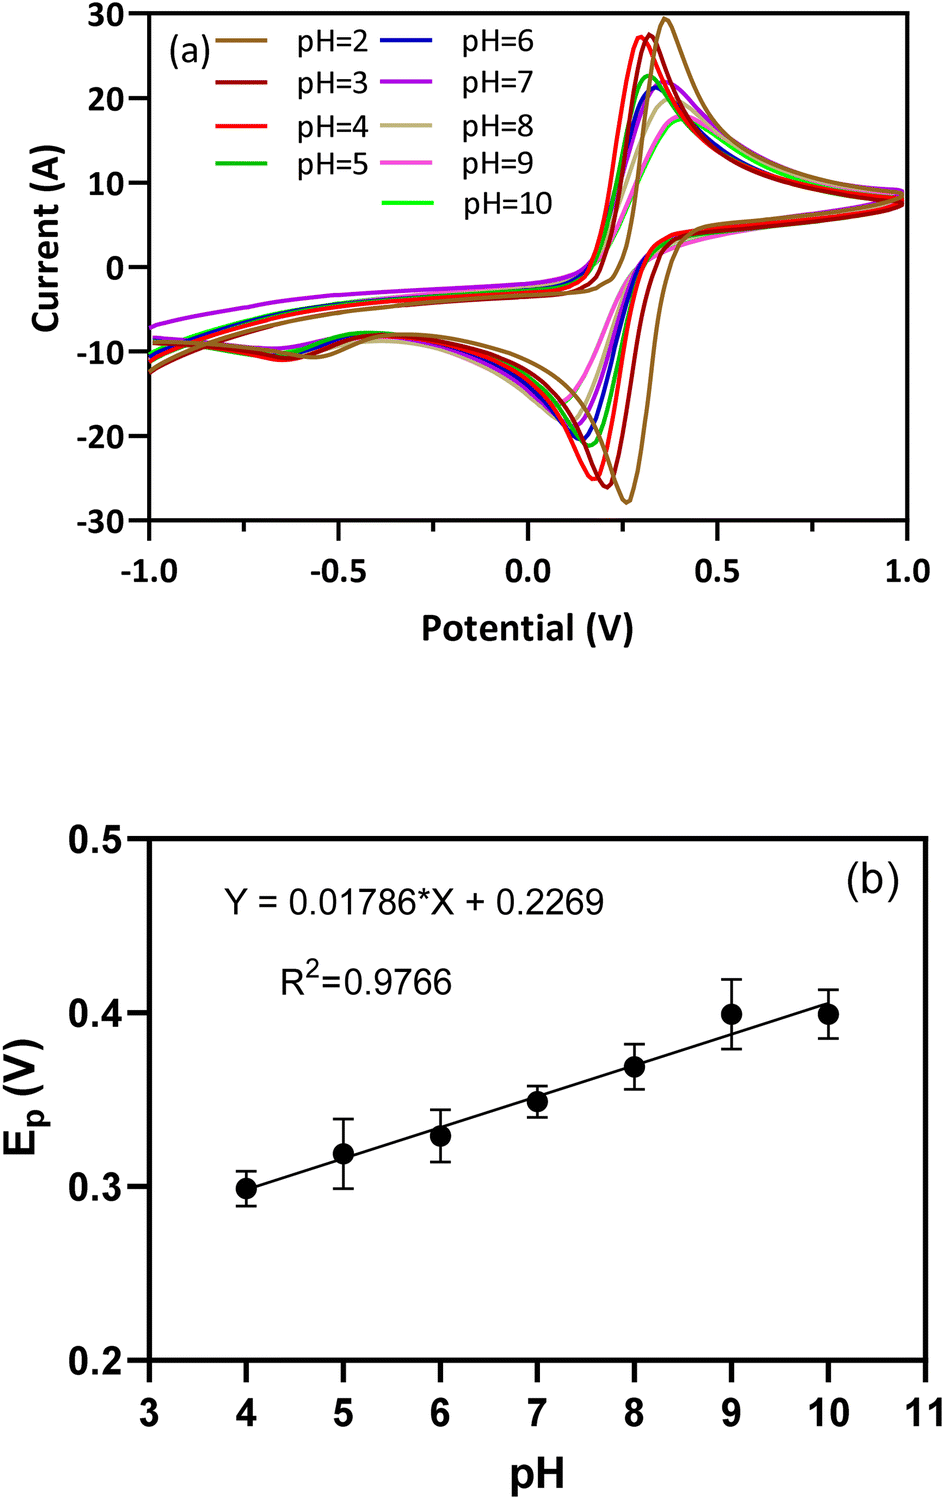 | ||
| Fig. 5 (a) CVs of BFO/EEGO-AGs/GCE at consecutive pH values from 2.0 to 10.0, and (b) Epa vs. pH curve for the Fe(CN)64−/Fe(CN)63− redox pair (PBS 50 mM, potential range from −1.0 to 1.0 V, scan rate 50 mV s−1). | ||
The obtained slope is 0.02171 V per pH, which is 2.5-fold lower than the theoretical value of 0.0592 V per pH, suggesting that in the presence of APX, in the electrochemical activity of the redox pair, the numbers of electrons and protons are not equal. Also, DPV results confirmed that the Ipa of BFO/EEGO-AGs/GCE was largely influenced by APX at pH = 4.0. Hence, pH = 4.0 was selected as the optimum pH value for recognition of APX in plasma samples.
3.4. Kinetic study
The investigation of the influence of scan rate on the electrochemical reaction provides valuable information relating to the mechanism of mass transport and electron transfer. The mass transport mechanism in the electrochemical system could be controlled by adsorption and/or diffusion. Also, the electron transfer coefficient (α) and coverage of specific area (Γ*) were calculated using the effect of scan rate. So, the kinetics of the BFO/EEGO-AG/GCE probe were evaluated in the presence of Fe(CN)64−/Fe(CN)63− by plotting CVs at various scan rates ranging from 5 to 1000 mV s−1 (Fig. S2a†). The oxidation peak of Fe(CN)64−/Fe(CN)63− appeared at the potentials higher than around +0.29 V at the scan rates between 5 mV s−1 and 1000 mV s−1 (Fig. S2a†). As seen, upon increasing the scan rate, the peak current also increased and the diffusion layer thickness decreased.43The increase in peak current is proportional to the scan rate (Fig. S2b†), the determination of the surface area for electron transfer of the BFO/EEGO-AGs/GCE and the supporting electrolyte. The mathematical form of Ipa vs. ν plot could be obtained as Ipa (μA) = 140.4ν + 10.19 with R2 of 0.9586.
From Fig. S2c,† it is obvious that there is a linear relationship between anodic peak potential and lnν (V s−1), which can confirm the irreversible nature of electrochemical reactions at the BFO/EEGO-AGs/GCE. The Epa is changed to the positive potentials by enhancing scan rate. The equation of Epa vs. lnν is as follows: Epa (V) = 0.01965lnν (V s−1) + 0.3366 with R2 of 0.9536. The correlation between Epa and scan rate is expressed by the Laviron theory for irreversible electrochemical reactions as follows:
 | (2) |
493 C mol−1) and temperature (K) and R and n describe the gas constant (8.314 J mol−1 K−1) and the number of electron transfer, respectively.  is the formal potential, which could be calculated as
  α and k° describe the coefficient of electron transfer and the reaction standard rate constant, respectively.
The mechanism of the redox process on the BFO/EEGO-AGs/GCE was checked using Ipa vs. lnν and Ipa vs. ν0.5 (Fig. S2b and d†). The obtained findings proposed that the Ipa vs. ν0.5 has a linear trend with an intercept around zero in low scan rates, proposing the diffusion-controlled mechanism of the electrooxidation process. Also, the diffusion mechanism was further confirmed by the ln(Ipa) vs. ln(υ) plot with a general equation of ln(Ipa) = 0.4494lnν + 4.323 (R2 of 0.9977) (Fig. S2e†). The slope of 0.4494 is close to 0.5, proposing the diffusion-controlled mechanism of the oxidation.
3.5. Analytical features of the developed probe
The analytical feature of the EEGO AG/BFO modified GCE probe was determined using a [APX] vs. Ip plot and the DPV technique. Fig. 6a shows the DPV spectra of the EEGO AG/BFO modified GCE with increasing concentrations of APX in the plasma matrix. By increasing the APX level in plasma, the oxidation current of the redox pair is proportionally decreased. The deceased current displayed a wide linear range from 10 ng mL−1 to 10 μg mL−1 with a low limit of quantification (LLOQ) of 10 ng mL−1 (Fig. 6b). The fabricated sensor provided a wide-ranging response and favorable sensitivity, enabling it for use in the detection of APX in unprocessed human plasma samples.
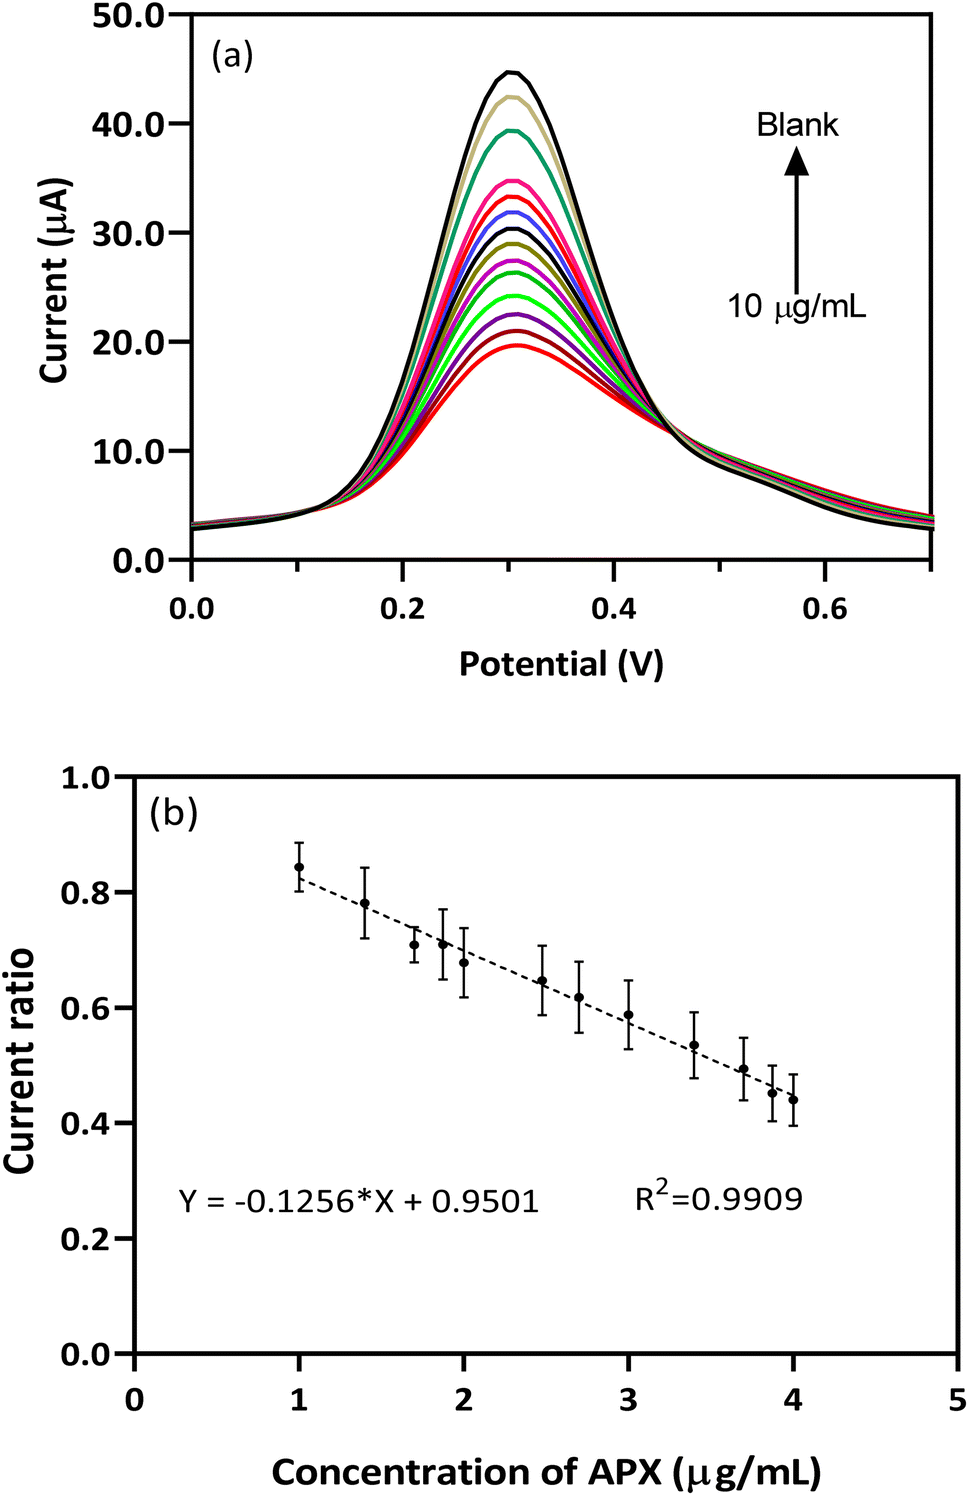 | ||
| Fig. 6 (a) DPVs of BFO/EEGO-AGs/GCE in the presence of various concentrations of APX and (b) corresponding calibration curve in plasma samples (PBS 50 mM, scan rate 50 mV s−1, pH = 4.0). | ||
The analytical features of the developed method were compared with those of the previously reported method and are collected in Table 1. It is concluded that the fabricated probe is able to determine APX concentrations in a wide range, and also this probe can detect APX in plasma samples without any need for the pretreatment steps. Usually, separation-based and optical methods require a protein precipitation step to remove interfering biomolecules, resulting in the washing out of the analyte. This type of analytical probe is advantageous in clinical use, especially when a large number of plasma samples should be determined in a short period.45–47
| Technique | Dynamic range | LOD | LOQ | Ref. |
|---|---|---|---|---|
| LC/MS-MS | 5–500 μg L−1 | 2.0 μg L−1 | 4.1 μg L−1 | 48 |
| UPLC-MS/MS | 1.0–100 ng mL−1 | — | — | 49 |
| Electrochemical | 1.99 μM–0.11 mM | 0.68 μM | 1.99 μM | 50 |
| HPLC-UV | — | — | 8–39 ng mL−1 | 51 |
| HPLC | — | 1.02 μg mL−1 | 3.091 μg mL−1 | 52 |
| HPLC | — | 0.05 g mL−1 | 0.15 μg mL−1 | 53 |
| Spectrofluorometric | 0.2–6 μg mL−1 | 0.017 g mL−1 | 0.057 μg mL−1 | 54 |
| LC-MS/MS | — | 4 ng mL−1 | 12 ng mL−1 | 55 |
| Electrochemical | 10 ng mL−1 to 10 μg mL−1 | LLOQ: 10 ng mL−1 | Plasma | This work |
3.6. Method validation
| Nominal concentration (μg mL−1) | Intraday precision (RSD%) | Interday precision (RSD%) | Intraday accuracy (RE%) | Interday accuracy (RE%) |
|---|---|---|---|---|
| 0.3 | 9.3 | 10.0 | 8.1 | 13.0 |
| 2.5 | 10.7 | 11.5 | 9.2 | 14.0 |
| 5.0 | 10.9 | −2.5 | −10.1 | −11.5 |
Reproducibility is another form of precision, which refers to the consistency of measurement results obtained in different laboratories. Reproducibility is not always necessary for validating methods in a single laboratory; it can be useful when standardizing analytical methods or using them across multiple labs. To test, two concentrations from the dynamic range, i.e., 1.0 and 2.5 μg mL−1 were selected and determined by the developed approach. The obtained data approved the reproducibility of the probe with 13.1% and 11.8% for 1.0 and 2.5 μg mL−1, respectively.
| Concentration (μg mL−1) | Stock solution | Freeze–thaw | ||
|---|---|---|---|---|
| Mean found (μg mL−1) | Accuracy (RE%) | Mean found (μg mL−1) | Accuracy (RE%) | |
| 0.3 | 0.29 | 3.3 | 0.23 | 10.0 |
| 2.5 | 2.23 | 10.8 | 2.26 | 9.6 |
The stability of the fabricated BFO/EEGO AG modified GCE probe was also investigated by plotting CVs at different cycle numbers. As shown in Fig. S4,† upon increasing the CV number, the peak current remained constant, proposing a stable response of the EEGO AG/BFO modified GCE during various CVs. However, the fabricated device could be utilized for only one test of real samples.
3.7. Applications of the sensor for detection of APX in patients' plasma samples
The BFO/EEGO AG modified GCE probe was employed to quantify APX levels in patients' plasma samples. To measure APX in patients' samples, about 0.25 mL of plasma samples was added to about 4.75 mL of Fe(CN)64−/Fe(CN)63− solution (without any protein precipitation). The peak currents were recorded in the blank and patients' plasms by the DPV technique. The calibration curve equation was used to calculate the APX concentration. The obtained concentrations of APX in patients' plasma samples are presented in Table 4.| Sample No. | Sexuality | Age (year) | Prescribed dose (mg) | Consumption in 24 h | Detected concentration (mg L−1) |
|---|---|---|---|---|---|
| 1 | Male | 76 | 2.5 | 4 | 1.34 |
| 2 | Male | 58 | 2.5 | 2 | 1.11 |
| 3 | Female | 78 | 5.0 | 2 | 0.66 |
| 4 | Male | 81 | 2.5 | 2 | 0.49 |
| 5 | Female | 70 | 5.0 | 2 | 0.11 |
4. Conclusion
A novel electrochemical sensor was fabricated by layer-by-layer modification of the surface of a GCE with BFO and EEGO AG particles. The fabricated probe was used to determine APX in plasma samples. The signal of the electrode for APX was optimized to provide the highest oxidation current and also the accuracy and precision of the fabricated method were validated to assure reliable detection of APX. This probe showed a wide dynamic range from 10 ng mL−1 to 10 μg mL−1 with a low limit of quantification (LLOQ) of 10 ng mL−1. The BFO/EEGO AG modified GCE probe was employed for direct detection of APX in plasma samples without any need for pre-concentration and protein precipitation steps. Hence, the fabricated sensor has a promising potential for the quantification of trace concentrations of APX in unprocessed plasma samples.Conflicts of interest
There are no conflicts to declare.Acknowledgements
The authors would like to thank the financial supports from the Pharmaceutical Analysis Research Center, Tabriz University of Medical Sciences with grant number of 69992.References
- P. C. Wong, D. J. P. Pinto and D. Zhang, J. Thromb. Thrombolysis, 2011, 31, 478–492 CrossRef CAS PubMed.
- S. Krishnaswamy, J. Thromb. Haemostasis, 2013, 11(1), 265–276 CrossRef.
- H. A. Hillarp, F. Baghei, I. Fagergerg Blixter, K. M. Gustafsson, L. Stigendal, M. Sten-Linder, K. Strandberg and T. L. Linahl, J. Thromb. Haemostasis, 2011, 9, 133–139 CrossRef PubMed.
- S. J. Wilson, T. M. Connolly, G. Peters, A. Ghosh, M. Johnson and D. E. Newby, Cardiovasc. Res., 2019, 115, 669–677 CrossRef CAS PubMed.
- S. J. Connolly, J. Eikelboom, C. Joyner, H.-C. Diener, R. Hart, S. Golitsyn, G. Flaker, A. Avezum, S. H. Hohnloser, R. Diaz, M. Talajic, J. Zhu, P. Pais, A. Budaj, A. Parkhomenko, P. Jansky, P. Commerford, R. S. Tan, K.-H. Sim, B. S. Lewis, W. Van Mieghem, G. Y. H. Lip, J. H. Kim, F. Lanas-Zanetti, A. Gonzalez-Hermosillo, A. L. Dans, M. Munawar, M. O'Donnell, J. Lawrence, G. Lewis, R. Afzal and S. Yusuf, N. Engl. J. Med., 2011, 364, 806–817 CrossRef CAS PubMed.
- L. Fauchier and N. Clementy, N. Engl. J. Med., 2011, 365, 1844–1845 CrossRef CAS PubMed.
- W. Byon, S. Garonzik, R. A. Boyd and C. E. Frost, Clin. Pharmacokinet., 2019, 58, 1265–1279 CrossRef PubMed.
- Y.-K. Lee and M. R. Player, Med. Res. Rev., 2011, 31, 202–283 CrossRef CAS PubMed.
- H. Partsch, Vasa, 2009, 38, 13–29 CrossRef.
- F. Gouveia, J. Bicker, J. Santos, M. Rocha, G. Alves, A. Falcão and A. Fortuna, J. Pharm. Biomed. Anal., 2020, 181, 113109 CrossRef CAS PubMed.
- M. M. Samama and G. T. Gerotziafas, J. Thromb. Thrombolysis, 2010, 29, 92–104 CrossRef CAS PubMed.
- J.-P. Bassand, EP Eur., 2012, 14, 312–324 Search PubMed.
- J. Stangier, Clin. Pharmacokinet., 2008, 47, 285–295 CrossRef CAS PubMed.
- J. Santos, N. António, M. Rocha and A. Fortuna, Br. J. Clin. Pharmacol., 2020, 86, 533–547 CrossRef PubMed.
- J. M. Andreu Cayuelas, C. Caro Martínez, P. J. Flores Blanco, G. Elvira Ruiz, H. Albendin Iglesias, J. J. Cerezo Manchado, J. L. Bailen Lorenzo, J. L. Januzzi, A. García Alberola and S. Manzano-Fernández, Eur. J. Clin. Invest., 2018, 48, e12907 CrossRef PubMed.
- L. F. Buckley, E. Rybak, A. Aldemerdash, J. W. M. Cheng and J. Fanikos, Clin. Cardiol., 2017, 40, 46–52 CrossRef PubMed.
- M. M. Samama and C. Guinet, Clin. Chem. Lab. Med., 2011, 49, 761–772 CrossRef CAS.
- J. Albiol-Chiva, J. Peris-Vicente, D. García-Ferrer and J. Esteve-Romero, J. Chromatogr. B: Anal. Technol. Biomed. Life Sci., 2019, 1120, 8–15 CrossRef CAS PubMed.
- M. Szultka-Młyńska, S. Bajkacz, M. Kaca, I. Baranowska and B. Buszewski, J. Chromatogr. B: Anal. Technol. Biomed. Life Sci., 2018, 1093–1094, 100–112 CrossRef PubMed.
- J. Lagoutte-Renosi, J. Le Poupon, A. Girard, D. Montange and S. Davani, J. Chromatogr. B: Anal. Technol. Biomed. Life Sci., 2018, 1100–1101, 43–49 CrossRef CAS.
- A. Jouyban, M. Shaghaghi, J. L. Manzoori, J. Soleymani and J. Vaez-Gharamaleki, Iran. J. Pharm. Res., 2011, 10, 695–704 CAS.
- P. Shahbazi-Derakhshi, E. Mahmoudi, M. M. Majidi, H. Sohrabi, M. Amini, M. R. Majidi, A. Niaei, N. Shaykh-Baygloo and A. Mokhtarzadeh, Biosensors, 2023, 13 Search PubMed.
- H. Sohrabi, M. R. Majidi, O. Arbabzadeh, P. Khaaki, S. Pourmohammad, A. Khataee and Y. Orooji, Environ. Res., 2022, 204, 112082 CrossRef CAS PubMed.
- J. Soleymani, D. Perez-Guaita, M. Hasanzadeh, N. Shadjou and A. Jouyban, TrAC, Trends Anal. Chem., 2017, 86, 122–142 CrossRef CAS.
- J. Soleymani, M. Hasanzadeh, M. H. Somi and A. Jouyban, Mater. Sci. Eng., C, 2020, 107, 110320 CrossRef CAS.
- H. Kholafazad Kordasht, M.-H. M.-H. Moosavy, M. Hasanzadeh, J. Soleymani and A. Mokhtarzadeh, Anal. Methods, 2019, 11, 3910–3919 RSC.
- V. Shafiei-Irannejad, J. Soleymani, S. Azizi, M. KhoubnasabJafari, A. Jouyban and M. Hasanzadeh, TrAC, Trends Anal. Chem., 2019, 116, 1–12 CrossRef CAS.
- J. Soleymani, M. Hasanzadeh, M. Eskandani, M. Khoubnasabjafari, N. Shadjou and A. Jouyban, Mater. Sci. Eng., C, 2017, 77, 790–802 CrossRef CAS PubMed.
- A. Saenchoopa, W. Boonta, C. Talodthaisong, O. Srichaiyapol, R. Patramanon and S. Kulchat, Spectrochim. Acta, Part A, 2021, 251, 119433 CrossRef CAS PubMed.
- W. Zhao, H. Zhang, J. Liu, L. Xu, H. Wu, M. Zou, Q. Wang, X. He, Y. Li and A. Cao, Small, 2018, 14, 1802394 CrossRef PubMed.
- H. Maleki, Chem. Eng. J., 2016, 300, 98–118 CrossRef CAS.
- B. Khalilzadeh, N. Shadjou, H. N. Charoudeh and M.-R. Rashidi, Microchim. Acta, 2017, 184, 3651–3662 CrossRef CAS.
- R. Pourakbari, N. Shadjou, H. Yousefi, I. Isildak, M. Yousefi, M.-R. Rashidi and B. Khalilzadeh, Microchim. Acta, 2019, 186, 820 CrossRef CAS PubMed.
- H. Nasrollahpour, M. Mahdipour, I. Isildak, M.-R. Rashidi, A. Naseri and B. Khalilzadeh, Biosens. Bioelectron., 2021, 178, 113023 CrossRef CAS PubMed.
- M. Moradi, J. Soleymani and A. Jouyban, J. Pharm. Biomed. Anal., 2022, 214, 114746 CrossRef CAS PubMed.
- C.-H. Chen, S. Hu, J.-F. Shih, C.-Y. Yang, Y.-W. Luo, R.-H. Jhang, C.-M. Chiang and Y.-J. Hung, Sci. Rep., 2017, 7, 3908 CrossRef PubMed.
- L. Ruiyi, W. Jiajia, L. Ling and L. Zaijun, Microchim. Acta, 2016, 183, 1641–1649 CrossRef.
- K. Wang, X. Xu, L. Lu, H. Wang, Y. Li, Y. Wu, J. Miao, J. Z. Zhang and Y. Jiang, ACS Appl. Mater. Interfaces, 2018, 10, 12698–12707 CrossRef CAS PubMed.
- X. Mi, G. Huang, W. Xie, W. Wang, Y. Liu and J. Gao, Carbon, 2012, 50, 4856–4864 CrossRef CAS.
- J. Soleymani, F. Feyzi, S. Dastmalchi, F. Ranjbar and A. Jouyban, J. Sep. Sci., 2023, 2201028 Search PubMed.
- G. Gorgolis and C. Galiotis, 2D Mater., 2017, 4, 32001 CrossRef.
- H. Zhang, T. Tong, J. Chen and J. Cheng, J. Sol-Gel Sci. Technol., 2016, 78, 135–143 CrossRef CAS.
- A. J. Bard and L. R. Faulkner, in Electrochemical Methods, Wiley, New York, 2nd edn, 2001, pp. 580–632 Search PubMed.
- M. Mahmoudpour, A. Jouyban, J. Soleymani and M. Rahimi, Adv. Colloid Interface Sci., 2022, 302, 102637 CrossRef CAS PubMed.
- J. Soleymani, D. Perez-Guaita, M. Hasanzadeh, N. Shadjou and A. Jouyban, TrAC, Trends Anal. Chem., 2017, 86, 122–142 CrossRef CAS.
- J. Soleymani, M. Hasanzadeh, M. Eskandani, M. Khoubnasabjafari, N. Shadjou and A. Jouyban, Mater. Sci. Eng., C, 2017, 77, 790–802 CrossRef CAS PubMed.
- J. Soleymani, M. Hasanzadeh, N. Shadjou, M. H. Somi and A. Jouyban, J. Pharm. Biomed. Anal., 2020, 180, 113077 CrossRef CAS.
- X. Delavenne, P. Mismetti and T. Basset, J. Pharm. Biomed. Anal., 2013, 78, 150–153 CrossRef PubMed.
- W. Zhang, D. Lou, D. Zhang, Y. Zhang and H. Huang, J. Thromb. Thrombolysis, 2016, 42, 205–211 CrossRef CAS PubMed.
- M. Rizk, M. A. Sultan, E. A. Taha, A. K. Attia and Y. M. Abdallah, Anal. Methods, 2017, 9, 2523–2534 RSC.
- M. Cini, C. Legnani, R. Padrini, B. Cosmi, C. Dellanoce, G. De Rosa, R. Marcucci, V. Pengo, D. Poli, S. Testa and G. Palareti, Int. J. Lab. Hematol., 2020, 42, 214–222 CrossRef PubMed.
- H. K. Jain and V. K. Nikam, Int. J. Pharm. Pharm. Sci., 2017, 9, 24–32 CrossRef CAS.
- S. S. Prabhune, R. S. Jaguste, P. L. Kondalkar and N. S. Pradhan, Sci. Pharm., 2014, 82, 777–786 CrossRef CAS PubMed.
- R. I. El-Bagary, E. F. Elkady, N. A. Farid and N. F. Youssef, Spectrochim. Acta, Part A, 2017, 174, 326–330 CrossRef CAS PubMed.
- S. Lessire, A. Dincq, R. Siriez, L. Pochet, A. Sennesael, O. Vornicu, M. Hardy, O. Deceuninck, J. Douxfils and F. Mullier, Int. J. Lab. Hematol., 2020, 42, 394–402 CrossRef PubMed.
Footnote |
| † Electronic supplementary information (ESI) available. See DOI: https://doi.org/10.1039/d3ra03293k |
| This journal is © The Royal Society of Chemistry 2023 |