 Open Access Article
Creative Commons Attribution 3.0 Unported Licence
Effect of SiO2/Al2O3 ratio on the electrochemical performance of amorphous zeolite loaded with cobalt oxide grown via steam-assisted crystallization method
Saureille Ngouana Moafor *ab,
Patrice Kenfack Tsobnangc,
Kabir Oyeniran Oyedotun
 d,
Roussin Lontio Fomekong
 b,
Guy L. Kabongoe,
Macheli Lebohang
 a,
John Ngolui Lambi
 *b and
Linda L. Jewell
 a
a
aDepartment of Chemical Engineering, University of South Africa (UNISA), Christiaan De Wet & Pioneer Avenue, Florida 1710, South Africa. E-mail: saureilemoafor@gmail.com; jewelll@unisa.ac.za
bLaboratory of Material Chemistry, Department of Inorganic Chemistry, University of Yaoundé I (UYI), P. O. Box 812, Yaoundé, Cameroon
cLaboratory of Solid State and Molecular Inorganic Chemistry, Department of Chemistry, University of Dschang, Cameroon
dCollege of Science, Engineering and Technology (CSET), University of South Africa, Florida Campus, Johannesburg 1710, South Africa
eDepartment of Physics, College of Science, Engineering and Technology, University of South Africa, Johannesburg 1710, South Africa
First published on 17th July 2023
Abstract
Improving the performance of a supercapacitor is one of the main approaches to solve the energy shortage problem. Electrode material is one of the key components limiting the efficiency of a supercapacitor. Discovering, tuning, and improving electrode materials are very important. This work reports the effect of SiO2/Al2O3 ratio on electrochemical performances of amorphous zeolites ZSM5 (AZ) and H-ZSM5 (H-AZ) loaded with cobalt oxide. Two SiO2/Al2O3 ratios (1 = 6.2 and 2 = 8.3) of AZ1, AZ2 and H-AZ1, H-AZ2 were synthesized by a facile impregnation method. Then, controlled masses of cobalt oxide were introduced to enhance the supercapacitive performances of the amorphous zeolite. Investigation of the SiO2/Al2O3 ratio in the cobalt oxide/zeolite composite (Co/AZ and Co/H-AZ) was carried out to unveil its effect on the electrochemical properties. Worthy of note is the fact that the resulting electrode materials exhibited supercapacitive behavior that is effective over a potential window ranging from 0 to 0.5 V in potassium hydroxide (1 M KOH) aqueous electrolyte. Results from Galvanometry Charging and Discharging (GCD) analyses show that the modified Ni-foam electrodes loaded with Co/H-AZ1 and Co/H-AZ2 are capable of delivering a relatively high specific capacity from 45.97 mA h g−1 to a high value of 72.5 mA h g−1 at 1 A g−1 and Ni-foam electrodes loaded with Co/AZ1 and Co/AZ2 exhibited values from 26 mA h g−1 to 52.83 mA h g−1 respectively. It is clearly shown that, when the mass ratio SiO2/Al2O3 increases, the specific capacity increases as well. It was also noticed that after 2000 cycles, Co/H-AZ1 and Co/AZ1 have a poor coulombic efficiency while Co/H-AZ2 and Co/AZ2 exhibited 98% for coulombic efficiency. Finally, this study shows that to fabricate high performance supercapacitors with amorphous zeolite loaded with cobalt oxide, one should keep the ratio of SiO2/Al2O3 as high as possible during synthesis.
1. Introduction
The scientific community is increasingly attracted by electrochemistry and more precisely by supercapacitors in recent years.1 Supercapacitors are characterized by their capability of delivering high power, fast charge and discharge rates, and long cycle life required for power devices.2 It is one of the possible solutions to provide energy in rural areas, where there is no electricity. Some portable common electronic devices like smart phones, laptops, etc. can also use supercapacitors as a power bank. Among active materials for the fabrication of electrodes for supercapacitors, transition metal oxides, working mostly as pseudocapacitors,3 are a very good choice.4 The most popular are Co3O4,5 RuO2,6 MnO2,3 NiO,7 and MoO2 because of their environmental affability, easy accessibility and higher energy density.8 Among all these, Co3O4 has attracted a particular interest because of its high theoretical specific potential and good electrochemical capability.9,10 However, Co3O4 has a low inherent conductivity, a limited potential or energy density and small cycling stability. For example Indira et al. obtained 500 cycles while with other electrode materials, 2000 to 5000 cycles can easily be reached.11 These limitation for Co3O4 can be overcome by preparing composite-based cobalt oxide materials. In recent years, Co3O4 has been coupled with rGO, Ni(OH)2, NiO, ZnO, etc. for high performance electrode material for supercapacitor.12,13 Although great progress has been made on Co3O4 based composite materials, it is still very important to develop composite electrodes comprising Co3O4 as the most favorable candidates for high performance supercapacitor electrodes.Zeolites have played a very important role in the chemical and petroleum industries for many years. Zeolites are known as a unique tetrahedral structured material arranged in connected rings forming micropores which offer a high surface area and high ion exchange capacity. Based on that and its ability to increase its porosity, zeolites can be used as a matrix in order to enhance the specific capacitance or specific capacity of metal oxides.14 It is important to mention that previous reports have demonstrated that zeolite alone is not a good candidate as electrode materials for supercapacitor.15
It should also be noted that zeolites can be categorized in relation to the Si/Al ratio, i.e. low silica zeolites (Si/Al mole ratio = 1–2, SiO2/Al2O3 mass ratio = 1.18–2.35), medium silica zeolites (Si/Al mole ratio = 3–10, SiO2/Al2O3 mass ratio = 3.53–11.76) and high silica zeolites (Si/Al mole ratio = 10–∞, SiO2/Al2O3 mass ratio = 11.76–∞).16 So, the physical and chemical properties of zeolites vary according to the SiO2/Al2O3 ratio.17 A synthesized zeolite from silica and aluminium essentially provides acidic sites.18 The study of the impact of the Si/Al ratio is applied in several fields of science. For example, for zeolite, Y (FAU), the higher the SiO2/Al2O3 ratio is, the more stable is its structure, but it is limited in terms of thermal and hydrothermal stability. It is also the most widely used zeolite in oil refineries due to its large pores and its surface area.19 Therefore, a thermally stable Y, called ultra-stable Y zeolite (USY), was developed by dealumination of the frame by controlled steam supply.20 The reduced ion exchange capacity and a smaller unit cell are indications of the removal of aluminium from the framework.21,22 Fuat et al. established the effects of zeolite framework structure and Si/Al ratio on the gas phase carboxylation of DMM to MMAc and found that the effects of zeolite framework structure and SiO2/Al2O3 ratio are interpreted in the light of a proposed reaction mechanism.23 Patrick J. et al. tested the hypothesis that SiO2/Al2O3 mass ratio was responsible for the systematic variation in EPR parameters for group 1 and 2 zeolites. For this purpose, a series of copper-exchanged zeolites with different SiO2/Al2O3 ratios were prepared.
In this work, for the first time, to the best of our knowledge, synthetised amorphous zeolite ZSM5 (named AZ) and HZSM5 (named H-AZ) materials with 2 SiO2/Al2O3 mass ratios are used to prepare amorphous zeolite loaded with cobalt oxide (named Co/AZ and Co/H-AZ) as new electrode material for supercapacitor. Moreover, the effect of SiO2/Al2O3 mass ratio on electrochemical properties of the prepared composite material was also investigated. The results obtained indicate that the high value of SiO2/Al2O3 mass ratio is beneficial for electrochemical properties in pristine and composite based zeolite material.
2. Experimental section
2.1 Chemicals
Tetraethyl-orthosilicate (TEOS, 98%, Aldrich), aluminium hydroxide (Al(OH)3, 99.6%, Aldrich), tetra propylammonium bromide (TPABr, 99%, Aldrich), ammonium nitrate (98%, Sigma-Aldrich), ethanol (98%, Merck) and cobalt nitrate hexahydrate (99%, Aldrich) were used without further purification.2.2 Co/AZ and Co/H-AZ preparation at 2 mass ratio SiO2/Al2O3
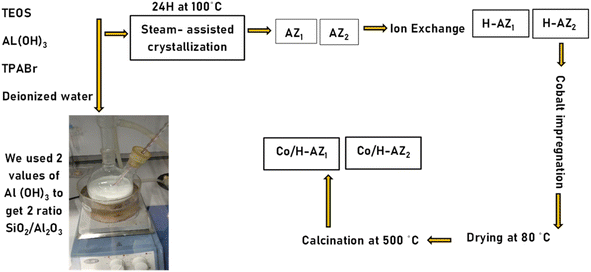
2 mass ratios SiO2/Al2O3 of mesoporous zeolites ZSM5 and H-ZSM5 were synthesized by the steam-assisted crystallization method (SAC) (see Scheme 1).24 For the first mass ratio (SiO2/Al2O3: 6.2), 11.32 g of tetra propylammonium bromide (TPABr) and 0.3275 g of aluminium hydroxide (Al(OH)3) were first added in sequence into 100 mL H2O, followed by dropping 27 mL of tetraethyl orthosilicate (TEOS) and the mixture was stirred for 5 h at 60 °C. The mixture was then transferred in a Teflon bottle into an autoclave, aged for 12 h at 80 °C and finally steam treated at 100 °C for 12 h. The precipitate obtained (called AZ1) was washed with ethanol, dried at room temperature, and calcined at 300 °C in a furnace for 4 h. A second reaction was performed under the same synthesis conditions except that the mass of Al(OH)3 was 0.2275 g (mass ratio 2 SiO2/Al2O3: 8.3) and gave zeolite AZ2. An ion exchange process was performed using a 1 M solution of NH4NO3 and AZ1, AZ2 at 60 °C for 2 h. After this process, the materials obtained were filtered and washed with de-ionized water and further dried in an oven at 60 °C overnight. The resulting NH4–AZ1 and NH4–AZ2 were calcined in a furnace at 300 °C for 3 h to obtain H-AZ1 and H-AZ2. Cobalt nitrate (1.766 g) was dissolved in the required volume of deionized water (1.5 mL) to obtain 15 wt% Co solution to impregnate the supports AZ1, AZ2 and H-AZ1, H-AZ2 (2 g of zeolite) with a mass-loading of 85%. The obtained catalysts were then dried in an oven at 60 °C for 6 h and calcined at 400 °C for 4 h. The obtained materials were named Co/AZ1, Co/AZ2 and Co/H-AZ1, Co/H-AZ2 respectively.2.3 Materials characterization
X-ray diffraction (XRD) analysis was employed for the phase identification of the catalysts. The powder XRD machine (Rigaku Smart lab diffractometer) which was equipped with a monochromatic Cu Kα radiation (λ = 1.54 Å) source was operated at 200 mA and 45 kV. The morphologies and microstructures of the as-prepared materials were analysed by scanning electron microscopy (SEM) using a JSM-7100 L, JEOL instrument. The surface area of the materials was analysed using the N2 adsorption–desorption Brunauer–Emmett–Teller (BET) method, while pore size distribution was determined using the Barrett–Joyner–Halenda (BJH) method on the Tristar II instrument. Fourier transform infra-red (FTIR) analyses, carried out on a Bruker FTIR spectrometer (Vertex 70 model), provided more information on the chemical structure.2.4 Electrochemical measurements
For the electrochemical measurements, the working electrodes were prepared by mixing each sample (Co/AZ1, Co/AZ2 and Co/H-AZ1, Co/H-AZ2) with carbon black mesoporous and polyvinylidene fluoride (PVDF) in a ratio of 16![[thin space (1/6-em)]](https://www.rsc.org/images/entities/char_2009.gif) :
:![[thin space (1/6-em)]](https://www.rsc.org/images/entities/char_2009.gif) 2
2![[thin space (1/6-em)]](https://www.rsc.org/images/entities/char_2009.gif) :
:![[thin space (1/6-em)]](https://www.rsc.org/images/entities/char_2009.gif) 2 into dimethyl sulfoxide (DMSO). The slurries, obtained with the assistance of ultrasonication for 15 min, were then drop-cast onto 1 × 1 cm pieces of nickel foam previously washed with a solution of 8.3 mL hydrochloric acid and 50 mL of distilled water. The electrodes so prepared were dried at 110 °C for 1 h and the electrochemical data was subsequently collected on an Auto lab PGSTAT302N Potentiostat using a three-electrode system. Platinum wire and Ag/AgCl (3 M KCl-filled) were used as counter and reference electrodes, respectively. A 1 M KOH solution served as the electrolyte. Electrochemical Impedance Spectroscopy (EIS) measurements were performed with an AC amplitude of 5 mV in the frequency range of 100 kHz to 100 mHz. Finally, Linear Sweep Voltammetry (LSV) was also performed.
2 into dimethyl sulfoxide (DMSO). The slurries, obtained with the assistance of ultrasonication for 15 min, were then drop-cast onto 1 × 1 cm pieces of nickel foam previously washed with a solution of 8.3 mL hydrochloric acid and 50 mL of distilled water. The electrodes so prepared were dried at 110 °C for 1 h and the electrochemical data was subsequently collected on an Auto lab PGSTAT302N Potentiostat using a three-electrode system. Platinum wire and Ag/AgCl (3 M KCl-filled) were used as counter and reference electrodes, respectively. A 1 M KOH solution served as the electrolyte. Electrochemical Impedance Spectroscopy (EIS) measurements were performed with an AC amplitude of 5 mV in the frequency range of 100 kHz to 100 mHz. Finally, Linear Sweep Voltammetry (LSV) was also performed.
3. Results and discussion
3.1 XRD analysis
The XRD patterns of all the samples are depicted in Fig. 1. The results show that AZ1, AZ2 and H-AZ1, H-AZ2 exhibited two broad peaks at 2θ positions of 8° and 23° for AZ1, H-AZ1 and 9° and 22° for AZ2, H-AZ2 respectively. This confirms that amorphous zeolite ZSM5 has been successfully obtained, which is in agreement with previous reports.15,25,26. Upon incorporating cobalt, it was noticed that the zeolite peaks intensity decreased considerably, indicating that the cobalt oxide has certainly covered the zeolite surface. The data shows variable Co oxidation states that are influenced by Co incorporation and Co particle sizes.27 Co/AZ1 and Co/H-AZ1 (Co/AZ2 and Co/H-AZ2) are not similar, which implies that H+ ions affected the XRD of Co/H-AZ1 and Co/H-AZ2. We also have Co3O4 peaks on Co/AZ1, Co/AZ2 and Co/H-AZ1, Co/H-AZ2. Hence, it was obvious that the zeolite materials synthesized with different SiO2/Al2O3 mass ratios are not very similar.28 The diffraction peaks at 31.54°, 37.19°, 56° and 65° which correspond to (2 2 0), (3 1 1), (5 1 1) and (4 4 0) lattice planes, respectively, for Co3O4 indicate that cobalt zeolite composite was successfully obtained.29,30 The structure obtained was indexed to JCPDS no. 43-1003 card number, which confirmed its cubic crystalline nature.31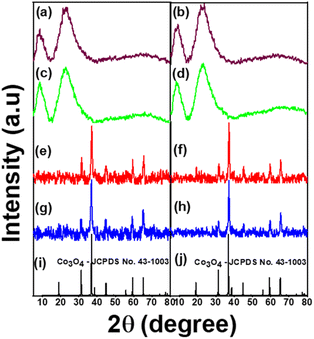 | ||
| Fig. 1 XRD pattens of (a) AZ1, (b) AZ2, (c) H-AZ1, (d) H-AZ2, (e) Co/AZ1, (f) Co/AZ2, (g) Co/H-AZ1, (h) Co/H-AZ2, (i and j) Co3O4-JCPDS no. 43-1003. | ||
3.2 FTIR analysis
FT-IR measurements were performed to elucidate the chemical bonds in the prepared samples. The spectra of all the samples are presented in Fig. 2. It was observed that all the samples exhibited a wideband between 3000 and 3750 cm−1, which corresponds to the stretching vibration of the hydroxyl (OH) group due to adsorbed water and the Si–OH and Al–OH bonds of the HZSM-5 surface groups.32 So, it can be noticed that the mass ratio SiO2/Al2O3 did not affect much the bonds. The peaks at 2351 cm−1 and 2991 cm−1 can be associated with the stretching vibrations of the C–H bond on the 1-heptyl group. The peak around 1612 cm−1 is attributed to the bending mode of the OH of water absorbed in the channels of the zeolite while the peaks at 1218 cm−1 and 1451 cm−1 can be associated with the vibration of the imidazole ring.33,34 The band at around 950–1090 cm−1 is due to the asymmetric stretching mode of Si–O–T (T = Si or Al).35,36 The vibrational frequencies at about 502, 560, 809, 1034–1292 cm−1 are characteristic of MFI type zeolites.37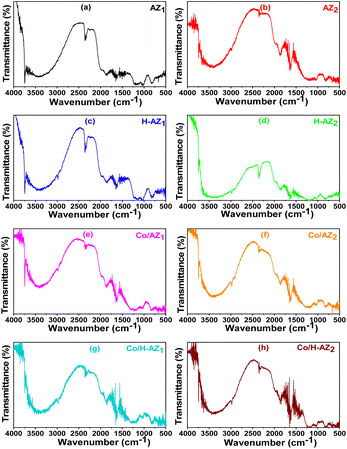 | ||
| Fig. 2 FTIR patterns for (a) AZ1, (b) AZ2, (c) H-AZ1, (d) H-AZ2, (e) Co/AZ1, (f) Co/AZ2, (g) Co/H-AZ1, (h) Co/H-AZ2. | ||
3.3 SEM analysis
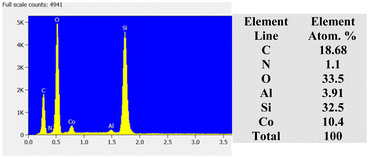
The microstructural analysis of the zeolite composites was further examined by HRSEM. The SEM micrographs (Fig. 3) reveal that AZ1, AZ2 and H-AZ1, H-AZ2 exhibit relatively amorphous particles formed by agglomerates of nano-sized crystals.38 Moreover, it can be noticed that when SiO2/Al2O3 mass ratio increases, the same happened for the agglomeration.39 Interestingly, Fig. 3e–h show clearly that the impregnation with cobalt considerably increased the agglomeration of the zeolites. Nevertheless, after adding cobalt on H-AZ1 and H-AZ2 (Fig. 3g and h), the crystalline shape remained almost the same with different SiO2/Al2O3 mass ratios, which is in agreement with the XRD results.40 EDS and elemental composition of Co/H-AZ2 are shown in Fig. 4 and the results indicate that the expected composition was obtained.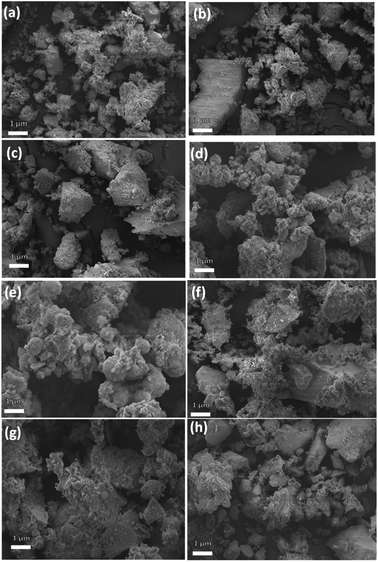 | ||
| Fig. 3 SEM images of (a and b) AZ1 and AZ2 (c and d) H-AZ1 and H-AZ2, (e and f) Co/AZ1 and Co/AZ2, (g and h) Co/H-AZ1 and Co/H-AZ2. | ||
3.4 N2 adsorption/desorption analysis
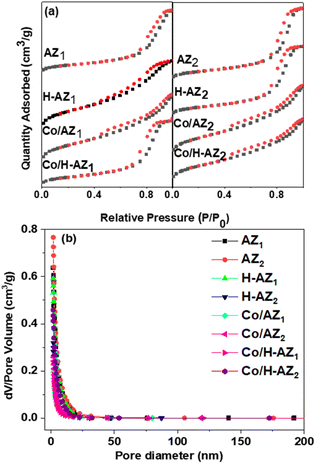
Nitrogen adsorption–desorption measurements were carried out using BET. The results of the pore structures and surface areas of AZ1, AZ2 and H-AZ1, H-AZ2, Co/AZ1, Co/AZ2 and Co/H-AZ1, Co/H-AZ2 are displayed in Fig. 5. The results (Fig. 5a) show clearly defined hysteresis loops typical of type IV isotherms (based on the IUPAC classification), thus, revealing a mesoporous structure for the zeolites.41,42 It can be noticed that all the samples that contained H+ had their isotherm shape changed when the mass ratio SiO2/Al2O3 increased while still belonging to type IV isotherms. Fig. 5b shows the pore diameter distribution for all the samples, while the textural properties of the samples are displayed in Table 1. The BJH pore size distribution for all the samples (Fig. 5b) shows a narrow pore size distribution not centered alongside a wide pore size distribution. The main effect of the sample preparation is an increase in the pore sizes in the range of 20 nm.43 This confirms that all the samples are characteristically mesoporous materials and the mass ratio SiO2/Al2O3 did not affect it. The mesopores for the samples show a pore size distribution in the range 5.45–11.56 nm, which is also characteristic of mesoporous materials.| Bet surface areaa (m2 g−1) | Micropore areab (m2 g−1) | External areac (m2 g−1) | Pore diameterd (nm) | Pore volumee (cm3 g−1) | Co3O4 size (nm) from XRD | |
|---|---|---|---|---|---|---|
| a Surface area.b Microporous surface area.c External surface area.d Pore diameter.e Pore volume. | ||||||
| AZ1 | 458.05 | — | 464.71 | 10.81 | 1.39 | — |
| AZ2 | 490.87 | — | 595 | 2.52 | 0.26 | — |
| H-AZ1 | 366.97 | — | 373.61 | 9.93 | 1.05 | — |
| H-AZ2 | 390.19 | 14.06 | 376 | 5.2 | 0.5 | — |
| Co/AZ1 | 275.84 | — | 282.35 | 9.6 | 0.79 | 6.54 |
| Co/AZ2 | 348.32 | — | 355.98 | 7.5 | 0.72 | 6.61 |
| Co/H-AZ1 | 254.62 | — | 268.59 | 6.2 | 0.45 | 6.49 |
| Co/H-AZ2 | 298.98 | — | 302.20 | 9.95 | 0.86 | 6.69 |
The specific surfaces area of all the samples are presented in Table 1 indicating that when the mass ratio SiO2/Al2O3 increased, the surface area also increased, which is an important indication that the material would be very good for electrochemical applications.
3.5 XPS analysis
X-ray photoelectron spectroscopy (XPS) was used to analyse the surface chemical composition of Co/AZ1, Co/AZ2 and Co/H-AZ1, Co/H-AZ2. The high-resolution of the Si 2p core levels of all the samples are shown in Fig. 6a. For the Co/H-AZ1 and Co/H-AZ2 sample, the Si 2p peak can be fitted with 2 Gaussian components at 103.8 and 104.6 eV which are deconvoluted into Si 2p3/2 and Si 2p1/2 with a spin–orbit splitting of 0.6 eV.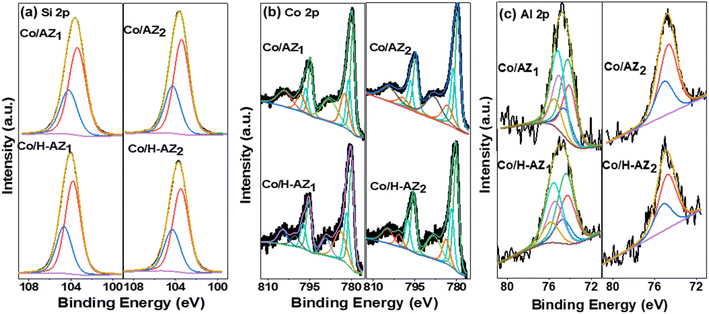 | ||
| Fig. 6 XPS of (a) Si 2p, (b) Co 2p and (c) Al 2p core level for Co/AZ1, Co/AZ2, Co/H-AZ1 and Co/H-AZ2. | ||
Comparatively, Si 2p appeared for Co/AZ1 and Co/AZ2 at 103.4 and 104.1 eV, respectively, and is associated with Si4+.44 Upon the introduction of H+ ions, the positions of these peaks were shifted towards higher binding energies as observed for Co/H-AZ1 and Co/H-AZ2 suggesting that H+ acts as an electron donor to Si, revealing the change in chemical environment. These shifts and changes are common when silica is functionalized with other elements to create absorbents or catalysts such as zeolites and clays.45 On the other hand, when the SiO2/Al2O3 mass ratio increased, there was no change meaning that the mass ratio did not affect Si 2p core level. The high-resolution Co 2p core levels were deconvoluted and several prominent peaks were noticed (Fig. 6b). The deconvolution for sample Co/AZ1, Co/AZ2 and Co/H-AZ1, Co/H-AZ2 Co 2p core levels unveiled peaks at 779.98 eV and 781.67 eV which belong to the Co 2p3/2 state of Co3+ and Co2+, respectively, while the peaks at 795.24 eV and 797.34 eV correspond to the Co 2p1/2. So, it can be noticed that the SiO2/Al2O3 mass ratio did not affect the Co 2p core level. More importantly, satellite peaks were detected at 782.81 and 803.38 eV. It is plausible that if the Co3+/Co2+ ratio is 2, cobalt exists in the Co3O4 phase. Finally, following deconvolution, two spin–orbit doublets (D1 and D2) emerged, indicating the coexistence of Co2+ and Co3+ according to XRD results as well.46 Furthermore, Fig. 6c depicts the high-resolution Al 2p core levels. The Al 2p photoemission peak for Co/AZ1 and Co/H-AZ1 can only be fitted to 2 peaks (fitted with a doublet with a spin–orbit splitting of 0.42 eV) peaking at 74.3 eV and 74.9 eV. This peak can be ascribed to Al in the +III oxidation state.47 However, when the SiO2/Al2O3 mass ratio increased, the Al 2p photoemission peak of Co/AZ2 and Co/H-AZ2 can be deconvoluted into several peaks corresponding to Al3+ existing in the bulk of the zeolite and Al3+ (Al–O–M) on the surface of the zeolite (Al–OH).47 Several prominent peaks could be explained by the fact that the chemical shift strongly depends on the SiO2/Al2O3 mass ratio and increases with increasing SiO2/Al2O3 ratios in the order O 1s > Si 2p > Na 1s > Al 2p.48 Dealumination must have led to the decrease in Si–O–Al proportion and, therefore increased the Si/Al ratio.49,50
3.6 Electrochemical analysis
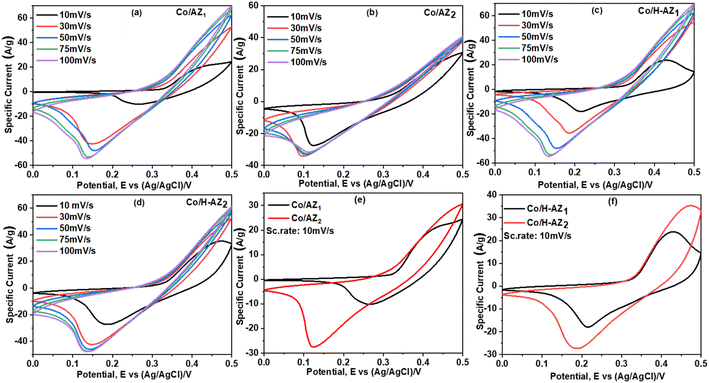
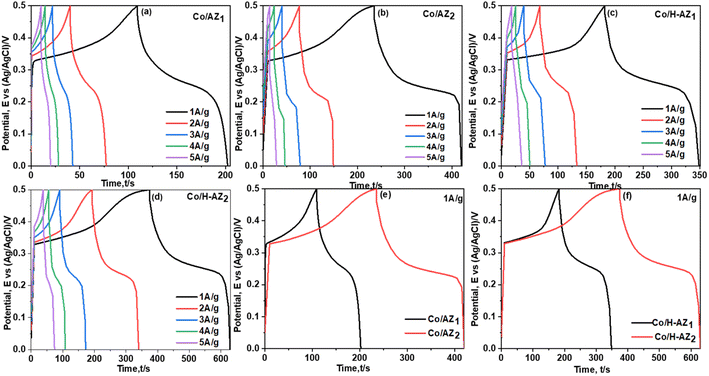
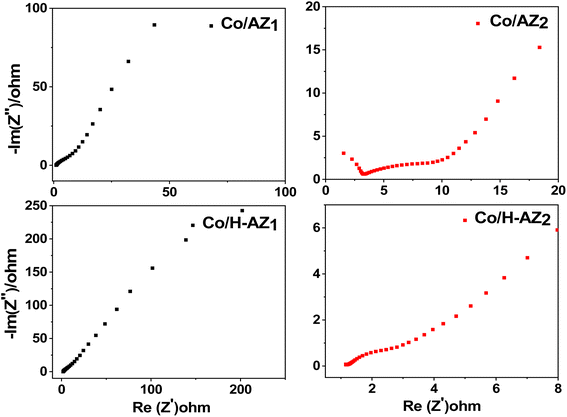
The electrochemical performance of the samples was investigated using cyclic voltammetry (CV), galvanostatic charge–discharge (GCD), electrochemical impedance spectroscopy (EIS) and linear sweep voltammetry (LSV) in a three-electrode system using 1.0 M KOH aqueous electrolyte. Fig. 7a–d display the CV curves of Co/AZ1, Co/AZ2 and Co/H-AZ1, Co/H-AZ2 measured at the scan rate of 10–100 mV s−1 in a potential window ranging from 0.0 to 0.5 V. For all the samples, typical redox peaks due to pseudocapacitive faradaic reactions of oxygen-derived functional groups in the porous structure were observed at 0.14 for all the samples. The observed polarization in the CV profiles for all samples suggests some difficulties in charge propagation, means there was no free ion insertion and ion diffusion at the low scan rate of 10 mV s−1 for all the samples. The behavior is attributed to faradaic hydrogen electrosorption occurs alongside electric double-layer charging therefore, induces non-symmetry CV profiles and separation of all the curves.51 Interestingly, the CV curves were distorted at higher scan rates as a result of weaker contributions from some pseudocapacitive species involved in the redox reactions at higher sweeping rates. It can be noticed that the SiO2/Al2O3 mass ratio increased with the surface area (Table 1), as well as the CV as Fig. 7e and f shows clearly, which is good for supercapacitor properties. Furthermore, EIS results (Fig. 11) corroborate this observation and also reveal that the Co/H-AZ2 electrode exhibited relatively smaller charge transfer resistance compared to the Co/AZ2 and comparatively, Co/AZ1 and Co/H-AZ1 which exhibited a bad charge transfer resistance when the SiO2/Al2O3 mass ratio increased. The Co/H-AZ2 and Co/AZ2 electrodes present a more vertical line in the low-frequency region compared with Co/AZ1 and Co/H-AZ1, indicating a better capacitive behavior.52 Fig. 8 shows the galvanostatic charge/discharge (GCD) curves for all the samples in a potential window of 0 to 0.5 V at various current densities (1, 2, 3, 4 and 5 A g−1). It is evident that the discharge time of the Co/AZ2 and Co/H-AZ2 electrodes (mass ratio 2 SiO2/Al2O3) are much longer than that of its counterpart, thus, indicating that its specific capacity is much higher than that of the Co/AZ1 and Co/H-AZ1 electrodes (mass ratio 1 SiO2/Al2O3). This is also in agreement with the CV results discussed earlier. It can be noticed that when the mass ratio SiO2/Al2O3 increased, the time of charging and discharging increased which is good for supercapacitor properties. These GCD curves displayed non-linear shapes, thus, exposing the faradaic behaviour of both electrodes.53 Fig. 9 displayed the specific capacity at different scan rates for all the samples. As can be observed, the specific capacity decreases with increasing scan rate. This general trend already reported in the literature is certainly due to the fact that when the current density increased, the charges did not have enough time to move through the pores during the charge/discharge process, leading to the low specific capacity.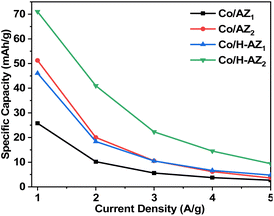 | ||
| Fig. 9 Specific capacity at various current densities for Co/AZ1, Co/AZ2, Co/H-AZ1 and Co/H-AZ2 electrode. | ||
From the results, it can be seen that the Co/H-AZ2 electrode exhibited a specific capacity of 72.5 mA h g−1 at 1 A g−1 which is much higher than that of 52.83 mA h g−1 at 1 A g−1 for the Co/AZ2 electrode. On the other hand, the Co/H-AZ2 electrode exhibited a specific capacity of 72.5 mA h g−1 at 1 A g−1 which is much higher than that of 45.97 F g−1 at 1 A g−1 for the Co/H-AZ1 electrode. So, when the SiO2/Al2O3 mass ratio increased, the specific capacity increased and this is in accordance with CV, GCD and EIS results. This may be due to the chemical stability of Co/H-AZ2 and Co/H-AZ1 as a result of the presence of H+ (ZSM5 has a high silicon to aluminium ratio). Whenever an Al3+ cation replaces a Si4+ cation, an additional positive charge is needed to keep the material charge neutral. This could be provided by H+, Na+.
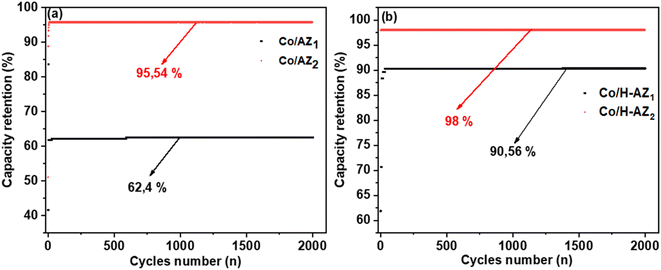
Fig. 10a displays the coulombic efficiency for Co/AZ1 and Co/AZ2 electrodes with the current density at 5 A g−1. Interestingly, the Co/AZ2 coulombic efficiency was 95.54% after 2000 cycles compared to Co/AZ1 electrode which was 62.4%. Fig. 10b shows coulombic efficiency for Co/H-AZ2 and Co/H-AZ1 electrodes at 5 A g−1. Interestingly, the Co/H-AZ2 electrode coulombic efficiency was 98% after 2000 cycles and Co/H-AZ1 was 90.56%. This is also proof that despite the presence of the proton H+ which improves the electrochemical performance with increasing of SiO2/Al2O3 mass ratio. The higher value of the capacity retention suggests that the electrode might be stable for a longer period. This result is also in good agreement with those of CV, GCD and EIS, which clearly shows that when the SiO2/Al2O3 mass ratio increased, the supercapacitive performance increased as well.
The specific capacity of Co/AZ1, Co/AZ2 and Co/H-AZ1, Co/H-AZ2 were calculated from GCD curves at 1 A g−1 using eqn (1) and (2),54 (where Cs is the specific capacitance (F g−1), Qs is the specific capacity (mA h g−1), I is the constant discharge current (A), Δt is the discharge time (s), ΔV is the potential window (V) and m is the mass of the sample in the electrode (g))55
 | (1) |
 | (2) |
From Table 1, sample Co/AZ2 possesses the highest specific surface area as compared to Co/AZ1 and the same applies to sample Co/H-AZ2 and Co/H-AZ1. It is widely reported that an electrode material with a high specific surface area very often yields high supercapacitive performance.41,42 Inherently, the present work reveals that Co/H-AZ1 and Co/H-AZ2 exhibit a high specific surface area relative to their counterparts and their electrodes displayed a higher specific capacity in comparison with its counterpart. This observation implies that the specific surface area is not the only factor that contributes to the overall electrochemical performance, there is also the effect of the SiO2/Al2O3 ratio which may also play a role.
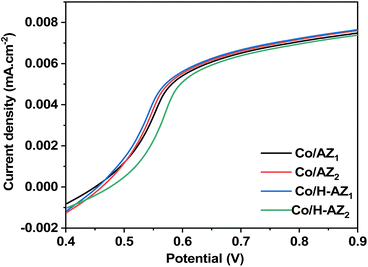
The linear sweep voltammetry curves of Co/AZ1, Co/AZ2, Co/H-AZ1 and Co/H-AZ2 electrodes are shown in Fig. 12 which is a typical LSV plot for a non-diffusion limited redox system. Co/AZ1, Co/AZ2, Co/H-AZ1 show their activity with half-wave potentials (E1/2 = E2/2 = E3/3 = 0.525) V and current density (JL = 0.0020 mA cm−2). Co/H-AZ2 shows its activity with half-wave potential (E4/2 = 0.550 V) and current density (JL = 0.0025 mA cm−2). So we can conclude that among these results, the best result is obtained for Co/H-AZ2 (mass ratio 2: 8.3) compared to Co/H-AZ1 (mass ratio 1: 6.3).56,57 It can be seen that the proton H+ and the SiO2/Al2O3 mass ratio have played a significant role.
4. Conclusions
In summary, the present work shows that we have synthesized successfully amorphous zeolites loaded with cobalt oxide at two different SiO2/Al2O3 mass ratios via the steam-assisted crystallization method for supercapacitor electrode application. It was demonstrated that when the mass ratio SiO2/Al2O3 (8.3) increased, the super capacitive performance increased and LSV also shows a good result. The impregnation of cobalt oxide on amorphous zeolites H-AZ1, AZ1, H-AZ2, AZ2, used as electrodes, were observed to significantly enhance the electrochemical performance. The specific capacity (Cs) value obtained for Co/H-AZ2 was about 72.5 mA h g−1 compared to that of Co/H-AZ1 (45.97). The specific capacity (Cs) value obtained for Co/AZ2 was about 52.83 mA h g−1 compared to that of Co/AZ1 (26). It was clearly shown that Co/H-AZ2 and Co/H-AZ1 exhibited an excellent coulombic efficiency of 98% and 90.56% respectively, after 2000 cycles from GCD. Although improved electrochemical performance is attributed to the effect of H+ ions in H-AZ1 and H-AZ2 zeolites and the optimal faradaic nature, it can be noticed that when the SiO2/Al2O3 mass ratio increased, the supercapacitor properties increased as well. Finally, it has been demonstrated in this work that Co/H-AZ2 with a high ratio SiO2/Al2O3 ratio (8.3) has a good super capacitive performance owing to the synergistic effect of H+ ions at the electrode/electrolyte interface. This work sheds new light on the improvement of the electrochemical performance of zeolite based supercapacitors precisely through the effect of the SiO2/Al2O3 mass ratios.Author contributions
Saureille Ngouana Moafor contributed to conceptualizing, the experiment, analysis and writing of the manuscript. Linda Jewell and Lambi John Ngolui have contributed to the supervision. All the others co-authors have discussed the results and commented on the manuscript.Conflicts of interest
There are no conflicts of interest to declare.Acknowledgements
The authors are grateful to the University of South Africa (UNISA) for reagents and laboratory equipments and the Organization for Women in Science for the Developing World (OWSD) for its financial support.References
- J. C. Ellenbogen, M. S. Halper, Supercapacitors: A Brief overview, 2006, pp. 1–34 Search PubMed.
- M. A. Guerrero, E. Romero, F. Barrero, M. I. Milanes and E. Gonzalez, Przegl. Elektrotech., 2009, 85, 188–195 Search PubMed.
- S. Chen, J. Zhu, X. Wu, Q. Han and X. Wang, ACS Nano, 2010, 4, 2822–2830 CrossRef CAS.
- K. Deori, S. K. Ujjain, R. K. Sharma and S. Deka, ACS Appl. Mater. Interfaces, 2013, 5, 10665–10672 CrossRef CAS PubMed.
- S. Hee, J. Kim and Y. Soo, J. Power Sources, 2004, 135, 286–290 CrossRef.
- M. N. Patel, X. Wang, D. A. Slanac, D. A. Ferrer, S. Dai, P. Johnston and K. J. Stevenson, J. Mater. Chem., 2012, 22, 3160–3169 RSC.
- S. Vijayakumar, S. Nagamuthu and G. Muralidharan, ACS Appl. Mater. Interfaces, 2013, 5, 2188–2196 CrossRef CAS PubMed.
- X. Li, J. Shao, J. Li, L. Zhang, Q. Qu and H. Zheng, J. Power Sources, 2013, 237, 80–83 CrossRef CAS.
- S. Zallouz, B. Réty, L. Vidal, J. M. Le Meins and C. M. Ghimbeu, ACS Appl. Nano Mater., 2021, 4, 5022–5037 CrossRef CAS.
- S. K. Meher and G. R. Rao, J. Phys. Chem. C, 2011, 115, 15646–15654 CrossRef CAS.
- C. Indira Priyadharsini, G. Marimuthu, T. Pazhanivel, P. M. Anbarasan, V. Aroulmoji, V. Siva and L. Mohana, J. Sol-Gel Sci. Technol., 2020, 96, 416–422 CrossRef.
- R. M. Obodo, S. M. Mbam, H. E. Nsude, M. Ramzan, S. C. Ezike, I. Ahmad, M. Maaza and F. I. Ezema, Appl. Surf. Sci., 2022, 9, 100254 CrossRef.
- E. M. Abebe and M. Ujihara, ACS Omega, 2021, 6, 23750–23763 CrossRef CAS PubMed.
- E. Olegario, C. M. Pelicano, J. C. Felizco and H. Mendoza, Mater. Res. Express, 2019, 6, 085204 CrossRef CAS.
- R. Chen, C. Yang, Q. Zhang, B. Zhang and K. Deng, J. Catal., 2019, 374, 297–305 CrossRef CAS.
- C. Wang, S. Leng, H. Guo, J. Yu, W. Li, L. Cao and J. Huang, Appl. Surf. Sci., 2019, 498, 143874 CrossRef CAS.
- N. Jiang, R. Shang, S. G. J. Heijman and L. C. Rietveld, Water Res., 2018, 144, 145–161 CrossRef CAS.
- M. Yao, N. Yao, B. Liu, S. Li, L. Xu and X. Li, Catal. Sci. Technol., 2015, 5, 2821–2828 RSC.
- A. A. Pimerzin, N. N. Tomina, P. A. Nikul'shin, N. M. Maksimov, A. V. Mozhaev, D. I. Ishutenko and E. E. Vishnevskaya, Catal. Ind., 2015, 7, 30–37 CrossRef.
- R. A. Beyerlein, C. Choi-feng, J. B. Hall, B. J. Huggins and G. J. Ray, Top. Catal., 1997, 4, 27–42 CrossRef CAS.
- R. Szostak, Stud. Surf. Sci. Catal., 2001, 137, 261–297 CrossRef CAS.
- B. Xu, S. Bordiga, R. Prins and J. A. van Bokhoven, Appl. Catal., A, 2007, 333, 245–253 CrossRef CAS.
- F. E. Celik, T. J. Kim and A. T. Bell, J. Catal., 2010, 270, 185–195 CrossRef CAS.
- M. Rilyanti, R. R. Mukti, G. T. M. Kadja, M. Ogura, H. Nur, E. P. Ng and Ismunandar, Microporous Mesoporous Mater., 2016, 230, 30–38 CrossRef CAS.
- M. Arumugam, C. K. Goh, Z. Zainal, S. Triwahyono, A. F. Lee, K. Wilson and Y. H. Taufiq-yap, Nanomaterials, 2021, 11, 1–11 CrossRef.
- J. A. Hunns, M. Arroyo, A. F. Lee, J. M. Escola, D. Serrano and K. Wilson, Catal. Sci. Technol., 2016, 6, 2560–2564 RSC.
- Y. Xu, M. Chen, T. Wang, B. Liu, F. Jiang and X. Liu, J. Catal., 2020, 387, 102–118 CrossRef CAS.
- M. W. Munthali, M. A. Elsheikh, E. Johan and N. Matsue, Molecules, 2014, 19, 20468–20481 CrossRef PubMed.
- M. Javed, S. Cheng, G. Zhang, P. Dai, Y. Cao, C. Lu, R. Yang, C. Xing and S. Shan, Fuel, 2018, 215, 226–231 CrossRef CAS.
- P. Mente, T. N. Phaahlamohlaka, V. Mashindi and N. J. Coville, J. Mater. Sci., 2021, 56, 2113–2128 CrossRef CAS.
- M. Gopalakrishnan, G. Srikesh, A. Mohan and V. Arivazhagan, Appl. Surf. Sci., 2017, 403, 578–583 CrossRef CAS.
- Y. K. Krisnandi, B. A. Samodro, R. Sihombing and R. F. Howe, Indones. J. Chem., 2015, 15, 263–268 CrossRef CAS.
- N. H. Chung, L. Q. Dien, T. D. Cuong, N. Van Lieu and P. H. Hoang, RSC Adv., 2018, 8, 41776–41781 RSC.
- Y. Hong, Y. Fang, D. Sun and X. Zhou, Open Chem., 2019, 17, 639–646 CAS.
- Y. K. Ma, S. Rigolet, L. Michelin, J. L. Paillaud, S. Mintova, F. Khoerunnisa, T. J. Daou and E. P. Ng, Microporous Mesoporous Mater., 2021, 311, 110683 CrossRef CAS.
- B. Herreros and J. Klinowski, J. Chem. Soc., Faraday Trans., 1995, 91, 1147–1154 RSC.
- Y. Zhao, D. He, D. Chen, J. Lu, J. Yu, J. Liu, X. Cao, C. Han and Y. Luo, Catal. Lett., 2020, 150, 2763–2773 CrossRef CAS.
- T. Xue, Y. M. Wang and M. Y. He, Microporous Mesoporous Mater., 2012, 156, 29–35 CrossRef CAS.
- L. Meng, G. Vanbutsele, R. Pestman, A. Godin, D. E. Romero, A. J. F. van Hoof, L. Gao, T. F. Kimpel, J. Chai, J. A. Martens and E. J. M. Hensen, J. Catal., 2020, 389, 544–555 CrossRef CAS.
- H. Ye, Y. Zhang and Z. Yu, BioResources, 2018, 13, 2499–2514 CAS.
- S. Wang, Y. Zou, F. Xu, C. Xiang, H. Peng, J. Zhang and L. Sun, J. Energy Storage, 2021, 41, 102862 CrossRef.
- T. Y. Wei, C. H. Chen, H. C. Chien, S. Y. Lu and C. C. Hu, Adv. Mater., 2010, 22, 347–351 CrossRef CAS PubMed.
- E. Kantarelis, R. Javed, S. Stefanidis, A. Psarras, E. Iliopoulou and A. Lappas, Top. Catal., 2019, 62, 773–785 CrossRef CAS.
- P. Post, L. Wurlitzer, W. Maus-Friedrichs and A. P. Weber, Nanomaterials, 2018, 8, 1–19 CrossRef PubMed.
- T. L. Barr, Appl. Surf. Sci., 1983, 15, 1–35 CrossRef CAS.
- W. Ma, D. Ye and H. Wang, Appl. Sci., 2022, 12, 1–16 Search PubMed.
- J. R. Lindsay, H. J. Rose, W. E. Swartz, P. H. Watts and K. A. Rayburn, Appl. Spectrosc., 1973, 27, 1–5 CrossRef CAS.
- X. Xv, S. Ye, L. Pan, P. Lin, H. Liao and D. Wang, Materials, 2022, 15, 7431–7443 CrossRef CAS.
- M. Wark, M. Koch, A. Brückner and W. Grünert, J. Chem. Soc., Faraday Trans., 1998, 94, 2033–2041 RSC.
- M. Huang, A. Adnot and S. Kaliaguine, J. Am. Chem. Soc., 1992, 114, 10005–10010 CrossRef CAS.
- K. O. Oyedotun, A. A. Mirghni, O. Fasakin, D. J. Tarimo, B. A. Mahmoud and N. Manyala, J. Energy Storage, 2021, 36, 102419 CrossRef.
- J. Zhu, X. Shen, L. Kong, G. Zhu, Z. Ji, K. Xu, B. Li, H. Zhou and X. Yue, Dalton Trans., 2019, 48, 10661–10668 RSC.
- J. Zhang, Z. Chen, Y. Wang, X. Yan, Z. Zhou and H. Lv, Nanoscale Res. Lett., 2019, 14, 1–11 CrossRef.
- K. O. Oyedotun, M. J. Madito, D. Y. Momodu, A. A. Mirghni, T. M. Masikhwa and N. Manyala, Chem. Eng. J., 2018, 335, 416–433 CrossRef CAS.
- S. P. Jahromi, A. Pandikumar, B. T. Goh, Y. S. Lim, W. J. Basirun, H. N. Lim and N. M. Huang, RSC Adv., 2015, 5, 14010–14019 RSC.
- B. Wang, Y. Ye, L. Xu, Y. Quan, W. Wei, W. Zhu, H. Li and J. Xia, Adv. Funct. Mater., 2020, 30, 2005834–2005842 CrossRef CAS.
- T. Li and D. Ding, Materials, 2019, 12, 4102 CrossRef CAS.
| This journal is © The Royal Society of Chemistry 2023 |

