 Open Access Article
Integrating a micro-mixing mechanism and on-line thermal processing for the large-scale ejection of polymeric liquid threads for producing ultrafine fibers
Jesús Olmedo-Pradasa,
Alfonso M. Gañán-Calvo ab and
Luis B. Modesto-López
 *a
*a
aDepartment of Aerospace Engineering and Fluid Mechanics, ETSI, Universidad de Sevilla, Camino de los Descubrimientos s/n, 41092 Sevilla, Spain. E-mail: lmodesto@us.es; Tel: +34-954-48-7339
bENGREEN, Laboratory of Engineering for Energy and Environmental Sustainability, Universidad de Sevilla, 41092, Spain
First published on 20th June 2023
Abstract
Micro/nanofibers are structures that nowadays have a wide range of cutting-edge applications including energy generation and storage devices, smart textiles, cell growth, and tissue engineering. These fibrous materials are mostly produced from polymer solutions spun, under laminar flow conditions, into nanofibers by external forces. However, the turbulent interaction of gas–liquid interfaces offers an innovative approach for the high-throughput production of nanofibers. Here, we present Flow Blurring (FB), a solely pneumatic approach for the massive production of liquid threads of polymer solutions, which relies on a micro-mixing mechanism that triggers a turbulent motion capable of fragmenting a viscous flow. The as-ejected threads are subsequently processed thermally, on-line in a single-step, thus producing micro/nanofibers that form mats. The method operates with relatively large liquid flow rates, equivalent of a high production rate, and is thus suitable for industrial production of engineered nanomaterials. In this work, we used solutions of poly(vinyl alcohol) (PVA) to study its ejection and fragmentation dynamics through computational fluid dynamics (CFD) simulations. In addition, the physics underlying the regulation of the liquid flow rate in FB atomizers are proposed. Fibers with typical diameters in the range 400–800 nm were produced by online heating of the liquid threads. Liquid ejection experiments were performed under different operating conditions thus verifying the capability of the method for synthesizing submicrometer-sized fibers with high uniformity and production rates suitable for scaling up.
1. Introduction
Micro and nanofibers are ubiquitous structures in cutting-edge applications including electrodes for energy generation and storage devices, smart textiles, cell growth, tissue engineering, coatings, and catalysts.1 Many of those fibrous materials are produced from polymer solutions,2–4 which may contain additives such as nanoparticles, nanotubes, or soluble precursors.3,5–10 The polymer matrix either serves as a template for micro/nanofiber fabrication or is the material of interest itself. The applications of such polymer fibers are determined not only by the structure of the polymer's repeating building block or their physicochemical surface properties but also by their dimensions, such as their length and diameter.Polymer micro- or nanofibers are generally obtained from the drying of a liquid filament drawn from a bulk by external forces as it occurs in techniques such as meltblowing,11 electrospinning,3,12–18 or straining flow spinning.19 The industrial demand for polymeric fibrous materials has prompted intense research to develop efficient and scalable fabrication methods to produce tailored materials.11 This quest has often resulted in the merging of two or more techniques to take advantage of their strengths. Thus, for instance, a centrifugal electrospinning method was presented that diverges from the traditional electrospinning in that it utilizes a type of rotating, bell-shaped ejector20 instead of the typical, single needle-type. Likewise, a centrifugal multispinning technique was proposed, which consisted of a cylindrical reservoir with orifices on lateral, main surface from which the solution was ejected towards a rotating mesh.21 These methods are based on the ejection and subsequent collection of thin liquid threads, where the interplay of surface tension forces, viscous forces, and other external forces, such as electrical, are evident and critical to achieve rather thin and long fibrous materials. There should be therefore an energy input to overcome unfavorable forces, surface tension in this case, acting on the threads. Therein, it is consequently required the liquid to be electrically conductive to respond to external stimuli effected by the field from the collector electrode. Furthermore, from an engineering viewpoint the key features a method should fulfil to be implemented in practical applications are: simplicity and yet robustness, versatility to be used with a wide range of materials, consistency in its feeding system, and capability for large-scale production. In that sense, liquid atomization techniques offer a stable source of precursors and are widely used in materials synthesis.22
Here, we present the coupling of a micro-mixing-based liquid atomization technique, for generating threads of polymer solutions, with an on-line thermal treatment to achieve high-volume production of ultrafine polymer fibers. The term micro-mixing refers to an intricate intermixing phenomenon occurring at small length scales, typically within the micrometer range, resulting in the mixing of both fluid phases. The approach is based on a pneumatic ejection of polymer solutions at high liquid flow rates,23–25 of the order of tens of milliliters per hour, much higher than those used by standard techniques (≪1 mL h−1),26,27 followed by thermal treatment with a tubular furnace, in a single-step. Our method uses a so-called Flow Blurring (FB) atomizer23,25,28–30, to fragment a liquid stream with a gas current, thus generating multiple, thin liquid threads that elongate as they move forward25,31,32 and are dried in-flight producing micro/nanofiber mats. Because the method functions with relatively low or medium temperatures it allows for the processing of materials which may undergo thermal degradation when exposed to higher temperatures.
A fundamental and unique feature of the method presented herein is its capability of mixing at micrometer length scales both fluid phases, liquid and gas. Such vigorous micro-mixing is triggered by a radial implosion of the gas into the liquid stream which causes the formation of bubbles within it.23 As the bubbles recirculate in the liquid interior and move forward with the main current the fragment the liquid bulk thus originating the threads.23,29,33–35 Thus, this approach is suitable for the processing of viscous, polymer solutions. Although flow blurring atomization has been performed with water and other Newtonian liquids, its use for production of micro/nanofibers remains largely unexplored.
Furthermore, we used computational fluid dynamics (CFD) simulations as guidance to study the evolution of polymeric solution's ejection patterns and fragmentation, followed by fibers' production under different ambient conditions. Herein we used poly(vinyl alcohol) (PVA) as the test polymer due to its ease to dissolve in common solvents such as water or water/ethanol mixture, and because of its immense range of applications.36 Furthermore, we delve into the physics underlying the critical ejection process, which dictates the inception of liquid threads leading to ultrafine fibers.
2. Experimental methods
2.1 Materials and preparation of solutions
Poly(vinyl alcohol) (PVA, Mowiol 40–88, CAS: 9002-89-5) of average molecular weight of 205![[thin space (1/6-em)]](https://www.rsc.org/images/entities/char_2009.gif) 000 g mol−1 was purchased from Sigma-Aldrich and used as received, without further purification. Water (Wasserlab, Type II, Analytical grade) and ethanol (PanReac, 99.5% v/v, CAS: 64-17-5) were used as solvents. The solutions were prepared by adding a previously weighted mass of PVA powder to a water/ethanol mixture (water mass fraction, χw = 0.35) to result in a PVA concentration of 6 wt%. Subsequently, the solution was stirred using a hot plate (Corning PC-420D) until it became homogeneous and transparent. Mild heating was applied during the stirring process to facilitate polymer dissolution. To ensure uniform heating during stirring, the solution was submerged in a water bath. Once the stirring process was finished, the solution was allowed to cool to room temperature before using it in atomization experiments.
000 g mol−1 was purchased from Sigma-Aldrich and used as received, without further purification. Water (Wasserlab, Type II, Analytical grade) and ethanol (PanReac, 99.5% v/v, CAS: 64-17-5) were used as solvents. The solutions were prepared by adding a previously weighted mass of PVA powder to a water/ethanol mixture (water mass fraction, χw = 0.35) to result in a PVA concentration of 6 wt%. Subsequently, the solution was stirred using a hot plate (Corning PC-420D) until it became homogeneous and transparent. Mild heating was applied during the stirring process to facilitate polymer dissolution. To ensure uniform heating during stirring, the solution was submerged in a water bath. Once the stirring process was finished, the solution was allowed to cool to room temperature before using it in atomization experiments.
2.2 Density, surface tension, and viscosity measurements
The density of the PVA solution was obtained by weighting a known volume of solution and was found to be 885.3 kg m−3. The surface tension of the polymeric solution in air was measured with a KSV Instruments' contact angle meter (model CAM100) set up in a pendant drop configuration for static measurements in the range 0–180°. The instrument is equipped with a FireWire video camera module with a resolution of 640 × 480 pixels and with a light-emitting diode, monochromatic, light source. The objective lens provided with the camera is telecentric with a 55 mm focal length. The instrument's software applies a curve fitting using the Young–Laplace equation to calculate surface tension, which in this case was found to be 0.0324 N m−1. The solution viscosity was characterized using a TA Instruments rheometer (Discovery HR-3) with cone–plate configuration with a gap of 52 μm. The cone angle and the plate diameter were 2.009° and 60 mm, respectively. Temperature control is achieved using a Peltier plate equipped in the instrument. The zero-shear viscosity, μ0, was taken as the viscosity at the lowest shear rate measured (25 Pa s). The viscosity measurements were performed at room temperature and ambient relative humidity (in the range of 50–60%).2.3 Experimental setup for microfiber production
Fig. 1a depicts the experimental setup consisting of a tubular furnace (Carbolite Gero TF1-1200) equipped with a ceramic tube and a FB nebulizer (Ingeniatrics Tecnologías, Seville, Spain). A cylindrical, metallic mesh, formed by galvanized wires (Fig. 1b), was placed in the interior of the ceramic tube to collect the fibrous material and provide it with structural support. The tubular furnace has a maximum operating temperature of 1200 °C. Nevertheless, in our experiments the operating temperature ranged from 150 °C to 600 °C. Such range corresponds to the nominal furnace temperature (Tf), which is higher than the real temperature (Tr) in the interior of the ceramic tube. Two temperature profiles along the lube length are presented in Fig. 1c to highlight such difference and to quantify Tr in the tube. As shown in the graph, there is a zone with a length of 20 cm in the central part of the furnace where the temperature is nearly-constant. The temperature gradient from the tube's center to its extremes is caused because of both ends are open (to allow for a free gas flow) and not thermally insulated. The ceramic tube had inner and outer diameters of 7.4 cm and 8.4 cm respectively, and a length of 80 cm.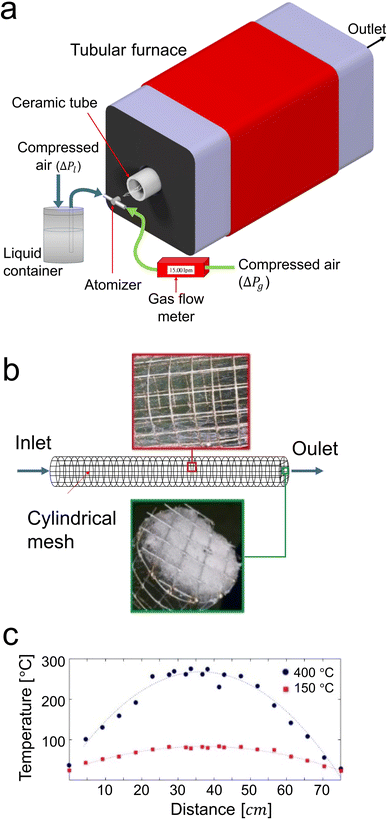 | ||
| Fig. 1 (a) Experimental setup, (b) sketch of metallic mesh for fiber collection, and (c) furnace temperature profile. | ||
The Flow Blurring atomizer consists of two concentric tubes, with the inner one carrying the liquid and the outer one carrying the gas. It is characterized by its nominal orifice diameter D = 1200 μm and gap H = 250 μm, thus resulting in a Φ = H/D = 0.21 (Fig. 2a). It has two inlets, one for the 6 wt% PVA solution and the other for the gas (air) flow. The air overpressure (ΔPg) was measured with a digital manometer (Digitron 2026P) to deliver a specific gas flow rate (Qg) measured by a digital flow meter (Red-y compact series, Vögtlin Instruments) as indicated in Fig. 1. The polymer solution was supplied pneumatically by feeding pressurized air into a hermetic, liquid container. The liquid flows through a polyamide tube with outer diameter 4 mm, inner diameter Di = 2.5 mm, and length L = 0.88 m. The liquid flow rate, Ql, was thus controlled by adjusting the overpressure in the liquid container, ΔPl, together with the gas overpressure ΔPg. The FB atomizer's unique geometry causes the gas flow to collapse radially inward towards the liquid stream coming from the liquid feeding tube at the atomizer discharge zone (Fig. 2a). As a result, a stagnation region is formed at the discharge of the liquid feeding tube, where the pressure exceeds that of the outer ambient environment Pa equal to a fraction of ΔPg.
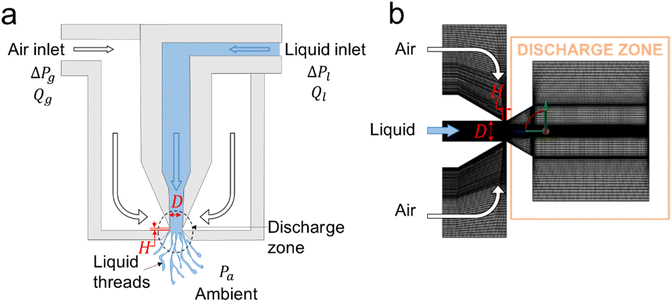 | ||
| Fig. 2 (a) Sketch of a 2D cross-sectional view of FB atomizer; D = 700 μm and H = 100 μm; (b) structured mesh for CFD simulations. | ||
Regarding the experimental procedure, the FB atomizer was positioned at the furnace entrance. As a result, the polymer filaments, once ejected, passed through the ceramic tube where the applied heat facilitated rapid solvent evaporation. Depending on the liquid flow rate and furnace temperature, the filaments could either fully dry in-flight, resulting in fiber formation, or undergo partial drying. In the former case, solid fibers would impact both the mesh's wall, which runs parallel to the main flow direction, and the end wall, perpendicular to the flow direction. Conversely, if the filaments only partially dried, wetted fibers may impact both walls of the mesh, completing their drying process after landing. Once the atomization experiment concluded, the mesh was carefully removed from the furnace to prevent potential thermal degradation of the fibers. When detaching the fibrous material from the mesh collector, it is crucial to differentiate between material deposited on the mesh's lateral wall and that deposited on the cross-section of the outlet zone (refer to Fig. 1b). All experiments were conducted under atmospheric conditions at an average ambient temperature of 25 °C and relative humidity of 45%.
2.4 CFD simulations
A 3D structured mesh composed of 2![[thin space (1/6-em)]](https://www.rsc.org/images/entities/char_2009.gif) 454
454![[thin space (1/6-em)]](https://www.rsc.org/images/entities/char_2009.gif) 027 tetrahedrons was implemented for simulations. Thin elements were positioned in regions where the micro-mixing and the ejections occur. Conversely, the size of elements at positions away from those regions of interest is considerably larger to decrease the computational cost without incurring in gross solution errors. The mesh quality was assessed using two the so-called orthogonal quality and skewness. Both of these parameters exceeded 0.9 and were lower than 0.5, respectively, in the regions of high interest, namely the micro-mixing zone and the discharge zone. These values indicate a highly reliable mesh in those critical areas. The simulation was conducted for a sufficient duration to allow the phenomenon to reach a steady state, in which the underlying rules governing the micro-mixing and ejection phenomena appeared to remain consistent over time, considering the inherently chaotic nature of the phenomenon. It is noteworthy to mention that we have extensive experience observing the ejection phenomena with ultra-high-speed cameras. That valuable knowledge is beneficial in understanding simulations' results, and in turn, it could be helpful to avoid excessive mesh refinements that would otherwise consume computational resources.
027 tetrahedrons was implemented for simulations. Thin elements were positioned in regions where the micro-mixing and the ejections occur. Conversely, the size of elements at positions away from those regions of interest is considerably larger to decrease the computational cost without incurring in gross solution errors. The mesh quality was assessed using two the so-called orthogonal quality and skewness. Both of these parameters exceeded 0.9 and were lower than 0.5, respectively, in the regions of high interest, namely the micro-mixing zone and the discharge zone. These values indicate a highly reliable mesh in those critical areas. The simulation was conducted for a sufficient duration to allow the phenomenon to reach a steady state, in which the underlying rules governing the micro-mixing and ejection phenomena appeared to remain consistent over time, considering the inherently chaotic nature of the phenomenon. It is noteworthy to mention that we have extensive experience observing the ejection phenomena with ultra-high-speed cameras. That valuable knowledge is beneficial in understanding simulations' results, and in turn, it could be helpful to avoid excessive mesh refinements that would otherwise consume computational resources.
 | (1) |
 | (2) |
The solution of the problem has been tackled using the commercial CFD software, ANSYS Fluent®. The PISO scheme is used to solve the pressure–velocity coupling. Within the spatial discretization, the Green-Gauss Node Based Model is used and the PRESTO! method has been selected for the resolution of the pressure terms. Additionally, a second-order upwind scheme has been selected for the momentum resolution and the transient problem has been formulated following a Bounded Second Order Implicit Scheme. High order term relaxation has been used to achieve a faster convergence and VOF solution stability controls was activated to avoid oscillations and divergence phenomena during training. Furthermore, a variable time step was selected based on the Courant–Friedrichs–Lewy (CFL) number, which controls the convergence comparing the temporal and spatial feedforward. CFL number was fixed at a value of 2, giving a timestep of the order of 10−8 seconds. The inlet conditions were specified as Pressure Inlet for both the gaseous and liquid phases. The discharge zone was defined as a Pressure Outlet at ambient, atmospheric pressure and no suction conditions. Finally, when simulating FB atomization of polymeric solutions, a power-law viscosity model was implemented to consider the shear-rate dependant viscosity.
The multiphase system was modelled using the volume-of-fluid (VOF) framework, which is a surface-tracking technique applied to a fixed Eulerian mesh. It was designed to study the position of the interface between immiscible fluids. VOF is a multiscale approach with a wide range of applications including the prediction of jet breakup, the motion of bubbles in a liquid, and the steady or transient tracking of liquid–gas interfaces. In this work, the VOF framework was implemented to study the evolution of the interface between the polymer solution and air as a result of their mixing at the micrometer length scale. The tracking of the interface between the two fluid phases was accomplished by the solution of a continuity equation for the volume fraction of the liquid. This equation has the following form,
 | (3) |
| ρ = αgρg + αlρl, |
| μ = αgμg + αlμl, |
To cope with the turbulent flow and the viscous effects taking part in the formation of inner bubbles and subsequent filament ejections23,24,32,33 the LES (large eddy simulation) model was selected. In LES, large eddies are resolved directly using the Navier–Stokes equations, while small eddies are resolved applying a Reynolds-Averaged-Navier–Stokes (RANS) model. The main feature of the LES model is the ability to spatially filter small-scale phenomena, which is performed by the following expression:
![[small phi, Greek, macron]](https://www.rsc.org/images/entities/i_char_e0d6.gif) (x) is the filtered flow variable.35 The subgrid-scale stresses are computed from:
(x) is the filtered flow variable.35 The subgrid-scale stresses are computed from:where
![[S with combining macron]](https://www.rsc.org/images/entities/i_char_0053_0304.gif) ij is the rate-of-strain for the resolved scale and μt is the subgrid-scale turbulent viscosity, which was modelled using the Smagorinsky–Lilly model,
ij is the rate-of-strain for the resolved scale and μt is the subgrid-scale turbulent viscosity, which was modelled using the Smagorinsky–Lilly model,where Ls is the mixing length for subgrid scales, which is computed with Ls = min(κ × d, Cs × Δ) where κ is the von Kármán constant (typically 0.4), d is the distance to the closest wall, Cs is the Smagorinsky–Lilly constant and Δ is the local grid scale. Cs is used to adjust the magnitude of subgrid-scale turbulence, which was determined to be 0.23 for homogeneous isotropic turbulence within the inertial subrange. However, it was observed that this value resulted in excessive damping of large-scale fluctuations in the presence of mean shear and in transitional flows near solid boundaries, and it needs to be reduced in such regions. A value of approximately 0.1 yields optimal results for a broad range of flows, and this value is the default option in ANSYS Fluent®, and thus it was employed in this study too.35,37
3. Results and discussion
3.1 Computational results
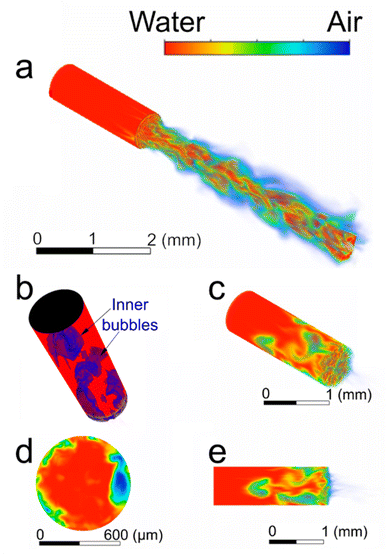
In the first case, despite the geometrical constrain Φ < 0.25, which dictates whether the micro-mixing occurs, the gas overpressure is not sufficiently high so as to implode into the liquid feeding tube. As a result, a gas cavity and inner bubbles are not formed and thus the micro-mixing is not triggered. As depicted in Fig. 3a, in this case, a surface-disturbed liquid jet is ejected, which corresponds to the regime known as Turbulent Flow Focusing (TFF30). Under these conditions, a nearly axial liquid vein (red color) surrounded by a liquid mist composed of droplets is ejected. Also, the conical shape of the ejection is remarkable thus representing the dynamics of TFF reported theoretically by us.30
By increasing the gas overpressure to 350 kPa, the flow blurring regime is achieved (Fig. 3b–e). Particularly, the perspective view of Fig. 3b depicts inner bubbles (blue color) in the interior of the tube. In this case, the ΔPg is sufficiently high to implode into the liquid feeding tube and produce the inner gas cavity, thus triggering the micro-mixing mechanism. Furthermore, a cross-sectional view (Fig. 3d) at a position just upstream of the liquid feeding tube's outlet evidences the presence of numerous inner bubbles not only in the vicinity of the walls, but also in positions close to the central axis of the tube. The bubbles introduce a turbulence component into the liquid, which causes the mixing at micrometer length scales that leads to the formation of a polydisperse aerosol. The formation of bubbles in the atomizer interior is the main characteristic of the flow blurring regime as reported by us and others.23,30,34,35
Rather than a liquid vein surrounded by droplets as in the TFF (Fig. 3a), in this case, the outcome is a fine aerosol. In this situation, the development of a boundary layer appears to be responsible for the formation of a thin air layer between water and the tube wall.24 Note that the simulation captured the recirculation of the gas flux observed by us and other authors,42,43 which is indicated by the presence of a bubble (mainly green color) in the center of the liquid feeding tube (Fig. 3e). The qualitative results presented here agree with the physical characteristics of flow blurring atomization process that are reported in the literature.23,24,32 It is important to emphasize that such bubble can be observed in both Fig. 3c and d, as they represent the same timestep from perspective and lateral views, respectively. The phenomenon is similar to that of Fig. 3b, where all internal bubbles are distinctly highlighted in blue. It is noteworthy to mention that in these simulations the bubbles do not consist entirely of air in the majority of cases. This is evident in Fig. 3d, where a lateral bubble exhibits a predominantly blue color (indicating a predominantly air-filled composition), while other greenish regions likely represent smaller bubbles. Owing to limitations in mesh resolution, the precise definition of bubble edges is not achieved, resulting in the simulation depicting these areas as regions with an approximate air-to-liquid volumetric fraction ranging from 40% to 60%. In spite of that, the simulations capture the essence of the phenomenon, and we thus conclude that the model is adequate to proceed with simulations of flow blurring atomization of polymer solutions as well as to obtain valid qualitative and quantitative results.
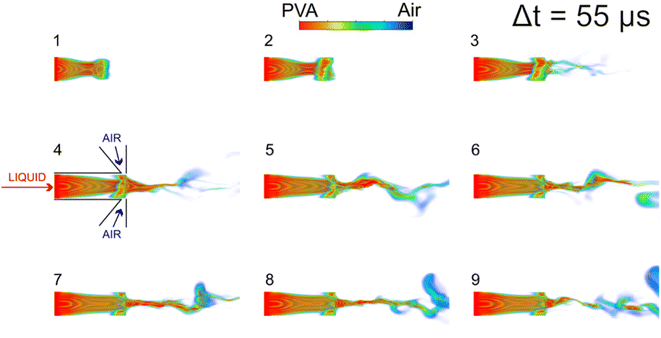
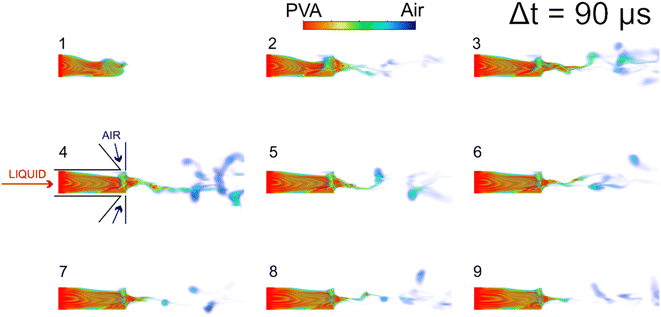
There exist key differences between atomization of PVA and that of water. For instance, rather than a gas cavity, in the PVA cases the air stream envelops the liquid jet and causes the diameter of liquid stream to reduce as it proceeds forward, out of the liquid feeding tube. Furthermore, a thin liquid column is ejected in both PVA cases, which downstream breaks up producing liquid filaments. This behavior was indeed observed by Ramos-Escobar et al.24 and Marín-Brenes et al.,44 using PVA and poly(ethylene oxide) solutions.
Comparison of simulations of both PVA cases evidences the effect of ΔPg or decreasing Ql. For lower ΔPg, the ejected liquid column appears to have a larger characteristic diameter and travels further before it breaks up. The sequential frames of Fig. 4 depict a continuous liquid vein that appears to move in a chaotic fashion driven by the turbulence, and filament fragmentation is not observed. Conversely, rising the gas overpressure ΔPg leads to an ejection of a thinner liquid column, which rapidly breaks up producing filament-like ejections in a chaotic and turbulent fashion, as shown in the frames of Fig. 5, particularly from frame 5 onwards. Rising ΔPg equals to increasing the available energy to induce liquid filament thinning and its subsequent break up. In FB atomization, ΔPg in combination with ΔPl regulate the liquid flow rate, which implies that, in general, for a given liquid overpressure a higher gas overpressure results in a lower Ql. These simulations represent well direct observations reported by Modesto-López et al.,32 Ramos-Escobar et al.,24 and Marín-Brenes et al.44 and confirm that for polymer solutions, in the FB regime, a lower liquid flow rate produces several, dispersed filaments, while increasing the liquid flow rate produces a continuum structure.
As the liquid structures move downstream, they undergo diverse transformations led mainly by inertio-capillary phenomena.24,44 Such mechanisms, described by Ramos-Escobar and others24 distinguish between those involving a single fluid entity and those related to two or more liquid structures' interactions. Several of those transformations are present in our CFD simulations herein. Fig. 6a depicts the so-called elongation phenomenon where a relatively thick liquid filament is elongated by means of inertia leading to a thinner structure. The transition from droplet to a filament due to inertia-capillary forces is clearly depicted in Fig. 6b similar to that captured by the high-speed recording of Ramos-Escobar et al.24 Furthermore, Fig. 6c captures the collision of an upcoming filament with a droplet leading to a new ejection, which later develops into a filament with two small spheres at both ends (see Fig. 5 of ref. 31).
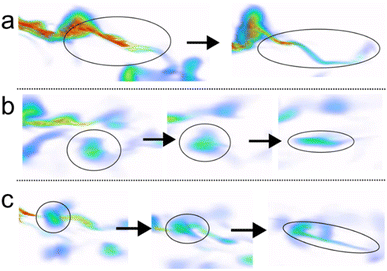 | ||
| Fig. 6 Transformation mechanisms during ejection of polymer solution threads. (a) elongation, (b) droplet to filament, and (c) ejection. Red indicates αl = 1, and blue indicates αg = 1. | ||
The liquid ejection's velocity in the vicinity of the liquid discharge region (U*) and the as-ejected liquid vein's diameter (L*) strongly influence the evolvement of the liquid filaments. A scaling analysis was used to propose an equation for U* based on operation parameters:24
 | (4) |
Additionally, in the atomizer interior the Reynolds number was assumed to be Re ≫ 1 and Bo ≪ 1, which makes it reasonable to neglect gravity effects. Furthermore, in the current case, in which either the liquid flow rate or the viscosity are large enough to prevent the formation of the gas cavity, the characteristic diameter of the liquid vein L* is assumed to be24
 | (5) |
The values of U* and L* calculated with eqn (5) and (6) based on the simulations' conditions are summarized in Table 1. The equivalent values obtained directly through the simulations are indicated in Fig. 7. It is noteworthy to mention that the values obtained in the simulations are of the same order of magnitude as those obtained with the scaling law proposed in Ramos-Escobar et al.24 Both results, from the simulations and from the scaling law, fit very well and thus describe the ejection phenomena with the micro-mixing mechanism accurately. Looking at the characteristic diameters, the trend represented by the scaling law indicates that increasing the liquid flow rate produces thicker liquid veins. This phenomenon is also shown in the CFD simulations and can be observed directly in the color plots (Fig. 7). Although the frames shown in Fig. 7 were chosen arbitrarily, the orders of magnitude were verified in several frames to add confidence to the results.
| Case | ΔPg (kPa) | ρl (kg m−3) | Ql (L h−1) | U* (m s−1) | L* (μm) |
|---|---|---|---|---|---|
| 1 | 300 | 885.3 | 3.041 | 18.408 | 214.225 |
| 2 | 330 | 885.3 | 1.615 | 19.307 | 152.430 |
The liquid ejection velocities away from the exit orifice are shown in Fig. 8. Notice the high acceleration that the liquid vein experiences in such region, increasing its velocity from nearly 10 m s−1 to 100 m s−1 in a distance no longer than 5 mm. Furthermore, the order of magnitude of the velocities represented here are consistent with those reported in Modesto-López et al.32 measured from ultra-high speed videos which were of the order of 80–100 m s−1.
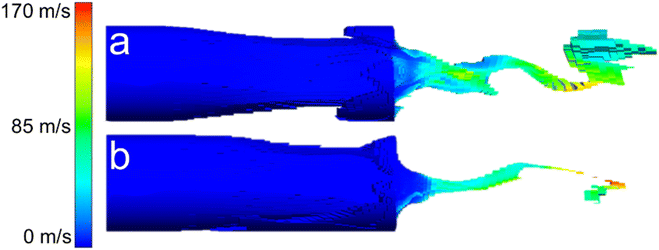 | ||
| Fig. 8 Velocity fields values obtained from simulations for PVA with ΔPl = 200 kPa and ΔPg of (a) 300 kPa; (b) 330 kPa. | ||
In order to obtain quantitative data of the filaments' diameter downstream of the ejection orifice, where the liquid jet has already evolved, measurements were performed using the software ImageJ.45 Approximately 50% of all measurements were in the range of 40–90 μm while the remaining 50% were in the range of 90–180 μm. Therefore, roughly, a characteristic diameter of the filaments at a 5 mm distance from the outlet orifice would be 100 μm.
3.2 Liquid flow rate and driving pressures in the flow blurring atomizer
The regulation of Ql is critical in achieving a good control of the liquid threads' diameters. Given the relatively large values of Ql in our experiments, the use of volumetric means as syringe pumps was not a practical solution. Thus, we opted for a continuous pressure differential system. However, determining such a differential to calculate the liquid flow rate is not trivial for FB atomizers because of the particular fashion in which the liquid ejection takes places, that is, through a radial implosion of the gas. As a result, a stagnation region is formed at the discharge of the liquid feeding tube, where the pressure exceeds that of the outer ambient environment Pa equal to a fraction of ΔPg. In the following analyses, the physics underlying the liquid flow rate regulation are thoroughly described. First, the discharge coefficient is defined as:where Qg,t is the theoretical volumetric gas flow rate, calculated assuming isentropic conditions and flat velocity profile at the discharge, and Qg is the experimentally measured volumetric gas flow rate (measured at standard conditions). It is normally coincident with the discharge coefficient of a circular outlet (Cd ≅ 0.8, e.g. see ref. 46). The latter coefficient will also be calculated from experimental measurements. The discharge coefficient of the atomizer used herein satisfies the experimental fitting:
which is consistent with other studies of gas discharge coefficients from small orifices.46 This fitting yields accurate results with errors below 0.5% along the experimental ranges of ΔPg used in this study.
In addition, the gas and liquid overpressures, ΔPg and ΔPl, driving Qg and Ql within the ranges of interest for producing the desired output, result relatively close. That is because the FB atomizer's unique geometry causes the gas discharge to collapse radially inward towards the liquid stream coming from the liquid feeding tube, at the atomizer discharge. Such radial implosion produces a relatively stagnant region with comparable liquid and gas velocities at the discharge of the feeding tube with an absolute pressure P1g equal to a fraction of the absolute gas pressure upstream of the atomizer (Pog), i.e. P1g = kn1Pog = kn1(ΔPg + Pa), with 0 < kn1 < 1. The gas is unsteadily forced inside the liquid tube, in the vicinity of its outlet, producing the characteristic recirculating liquid–gas region of the flow blurring technology. The upstream front of this recirculating region has an absolute pressure PoR = konPog such that PoR > P1g, and therefore 0 < kn1 < kon < 1 since the liquid–gas bi-phasic flow must be accelerated towards the tube outlet. Thus, the total pressure driving the liquid column from the pressurized container is given by the formula:
| ΔPTl = (ΔPl + Pa) − konPog, ≡ Pol − konPog |
Both kon and kn1 are expected to be slightly dependent on Pog owing to the nonlinear (turbulent) nature of the whole gas and liquid flow outlets from flow blurring atomizers. In our setup, the Reynolds number of the liquid flow in the liquid tubing between the pressurized container and the atomizer is smaller than unity, and therefore the liquid flow rate is finally given by the formula:
 | (6) |
Care is taken to keep the liquid level in the pressurized container at the same height as the atomizer outlet. However, the hydrodynamic resistance, kL, of our setup is small (kL = 3.82 × 10⁻³ bar min mL−1), resulting in small pressures compared to both ΔPl and ΔPg. Thus, experimental measurements for the calculation of kon for the specific atomizer used will entail large errors using standard pressure sensors. This value is usually comparable to the coefficient of discharge Cd of the atomizer.
A way to assess the consistency of all those experimental measurements is to evaluate the value of an applied gas pressure  , a critical pressure above which the value of kn1 becomes independent of Pog: this occurs when the gas outlet becomes sonic. Naturally, the stagnation pressure of this sonic discharge must be approximately equal to P1g. Since we use air (adiabatic constant γ = 1.4) discharging at atmospheric pressure Pa = 1.012 bar, the critical pressure must be
  , and therefore the eventual constant value of
  must be:
 | (7) |
The data in Table 2 allow a quite precise calculation of  above which
  becomes constant and equal to
  . From eqn (7) above, one has
  , thus proving the consistency of measurements, where an expected pressure drop equal to
  will accelerate the liquid and push the liquid–gas biphasic flow across the recirculating region for
  .
.
| ΔPg (bar) | Qg (L min−1) | ΔPl (bar) | Ql (mL h−1) | Tf (°C) | Tr (°C) | |
|---|---|---|---|---|---|---|
| Set 1 | 1.30 | 20 | 1.1 | 68.18 | 300 | 195 |
| 0.82 | 15 | 0.71 | 50.37 | |||
| 1.80 | 25 | 1.43 | 38.17 | |||
| 2.29 | 30 | 1.82 | 34.96 | |||
| Set 2 | 0.82 | 15 | 0.71 | 50.37 | 150 | 75 |
| 300 | 195 | |||||
| 450 | 315 | |||||
| 600 | 435 |
An interesting by-product of the above-described investigation is the description of the cascade of pressures occurring at the outlet of flow blurring atomizers, which, to the best of our knowledge, has not been attempted at this level of detail before.
3.3 Microfiber production
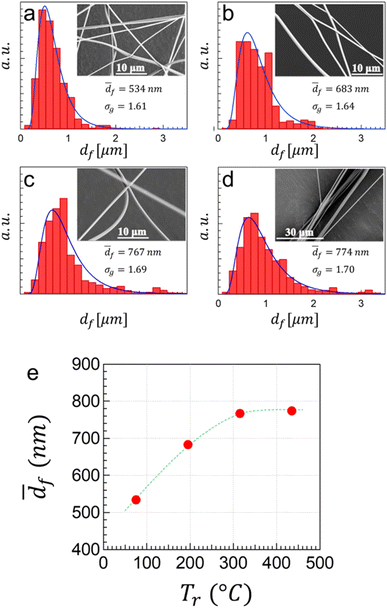
The performed experiments and their conditions are listed in Table 2. Two set of experiments were carried out; in the first set, the gas flow rate Qg vas varied to study its effect on the final fiber diameter and structure. It is noteworthy to mention that a change of Qg inherently implies that Ql should be varied to adjust the atomization conditions to the flow blurring regime, in which the micro-mixing takes place. That is, ΔPl was maintained to a minimum admissible for the atomization process to occur.In those experiments, Tr was kept constant at 195 °C (Tf = 300 °C). In the second set of experiments, Qg and Ql were fixed at 15 L min−1 and 50.37 mL h−1, respectively, while varying Tr in the range from 75 °C to 435 °C. This second set of experiments aimed at elucidating the effect of solvent evaporation rate on the diameter and structure of the fibers. Those experiments combined with data from the CFD simulations allowed to estimate the in-flight stretching rate of the filaments.
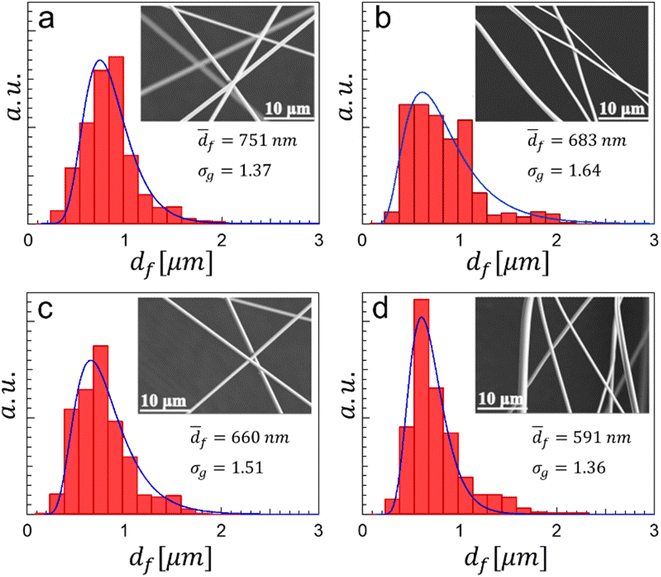
![[d with combining macron]](https://www.rsc.org/images/entities/i_char_0064_0304.gif) f ∼ Ql0.307. Recalling the scaling analysis, this tendency is consistent with the experimental results since the diameter of the ejected liquid vein grows with the liquid flow rate. Thus, it seems reasonable to think that as the liquid vein becomes thicker, the phenomenon propagates downstream leading to the production of thicker fibers. Furthermore, despite the relatively high liquid flow rates employed for atomization experiments, the fiber mean diameters are in the submicrometer regime, below 750 nm, and the mode diameter is of the order of 500 nm. The results thus indicate that the liquid flow rate is one of the main operating parameters influencing the size of both, the liquid filaments and the fibers.
f ∼ Ql0.307. Recalling the scaling analysis, this tendency is consistent with the experimental results since the diameter of the ejected liquid vein grows with the liquid flow rate. Thus, it seems reasonable to think that as the liquid vein becomes thicker, the phenomenon propagates downstream leading to the production of thicker fibers. Furthermore, despite the relatively high liquid flow rates employed for atomization experiments, the fiber mean diameters are in the submicrometer regime, below 750 nm, and the mode diameter is of the order of 500 nm. The results thus indicate that the liquid flow rate is one of the main operating parameters influencing the size of both, the liquid filaments and the fibers.
Indeed, for Tr ≥ 300 °C the fiber diameter appears to remain constant, implying that independently of how high Tr is, under such ejection conditions the maximum achievable ![[d with combining macron]](https://www.rsc.org/images/entities/i_char_0064_0304.gif) f is of the order of 800 nm, as depicted in Fig. 10e. In addition, as reported by us in previous works and as demonstrated in our simulations, liquid threads undergo different transformation mechanisms (ejections, elongation, rotation, etc.) in flight. One of the most frequent and, perhaps, one of the most important for producing thin fibers is the elongation process, which arises from an inertia-capillary mechanism. The elongation takes place as long as the liquid threads preserve their mobility, which is, at least partially, dependent on ambient temperature through solvent evaporation. Increasing temperature in the furnace leads to an acceleration of solvent evaporation and further solidification of the liquid filaments, thus stopping or retarding the elongation process and, consequently, preventing the reduction of the fiber diameter simultaneously decreasing the length of collected fibers. This phenomenon is of significant importance at lower temperatures and becomes less relevant at higher temperatures where, as shown in Fig. 10, the increment of geometric mean diameter was smaller. For instance, at Tr = 315 °C,
f is of the order of 800 nm, as depicted in Fig. 10e. In addition, as reported by us in previous works and as demonstrated in our simulations, liquid threads undergo different transformation mechanisms (ejections, elongation, rotation, etc.) in flight. One of the most frequent and, perhaps, one of the most important for producing thin fibers is the elongation process, which arises from an inertia-capillary mechanism. The elongation takes place as long as the liquid threads preserve their mobility, which is, at least partially, dependent on ambient temperature through solvent evaporation. Increasing temperature in the furnace leads to an acceleration of solvent evaporation and further solidification of the liquid filaments, thus stopping or retarding the elongation process and, consequently, preventing the reduction of the fiber diameter simultaneously decreasing the length of collected fibers. This phenomenon is of significant importance at lower temperatures and becomes less relevant at higher temperatures where, as shown in Fig. 10, the increment of geometric mean diameter was smaller. For instance, at Tr = 315 °C, ![[d with combining macron]](https://www.rsc.org/images/entities/i_char_0064_0304.gif) f = 767 nm and at Tr = 435 °C,
f = 767 nm and at Tr = 435 °C, ![[d with combining macron]](https://www.rsc.org/images/entities/i_char_0064_0304.gif) f = 774 nm, that is a difference of less than 1%. However, between Tr = 75 °C and Tr = 195 °C the fiber geometric mean diameter increased from 534 nm to 683 nm, approximately 22%. For the flow conditions and the geometry of the furnace and collector considered herein, there is a critical Tr ∼ 300 °C (Tf ∼ 450 °C) at which further temperature increase does not result in variation of fiber diameter in fibers collected on the lateral zone of the mesh. Since the solvent of the 6 wt% PVA solution was a mixture of water/ethanol (35/65 w/w), following Raoult's law, it is reasonable to assume that the boiling point of the solvent is approximately 80 °C (molar fraction of ethanol 0.42, molar fraction of water 0.58) and at the 75 °C of the furnace the filaments had longer time to elongate as they travel before the solvent evaporates completely. In addition, fibers produced at Tr > 315 °C exhibited calcination effects, as observed when the mesh was removed from the furnace. The melting point of PVA is approximately 200 °C, thus exposing the fibers to higher temperature may result in thermal degradation. Furthermore, increasing Tr above 315 °C not only has minor impact on the fibers' diameters, but it also leads to poor quality fibers, probably as a consequence of extremely fast evaporation resulting from both the high temperatures and high velocities (increasing dramatically heat transfer by convection).
f = 774 nm, that is a difference of less than 1%. However, between Tr = 75 °C and Tr = 195 °C the fiber geometric mean diameter increased from 534 nm to 683 nm, approximately 22%. For the flow conditions and the geometry of the furnace and collector considered herein, there is a critical Tr ∼ 300 °C (Tf ∼ 450 °C) at which further temperature increase does not result in variation of fiber diameter in fibers collected on the lateral zone of the mesh. Since the solvent of the 6 wt% PVA solution was a mixture of water/ethanol (35/65 w/w), following Raoult's law, it is reasonable to assume that the boiling point of the solvent is approximately 80 °C (molar fraction of ethanol 0.42, molar fraction of water 0.58) and at the 75 °C of the furnace the filaments had longer time to elongate as they travel before the solvent evaporates completely. In addition, fibers produced at Tr > 315 °C exhibited calcination effects, as observed when the mesh was removed from the furnace. The melting point of PVA is approximately 200 °C, thus exposing the fibers to higher temperature may result in thermal degradation. Furthermore, increasing Tr above 315 °C not only has minor impact on the fibers' diameters, but it also leads to poor quality fibers, probably as a consequence of extremely fast evaporation resulting from both the high temperatures and high velocities (increasing dramatically heat transfer by convection).
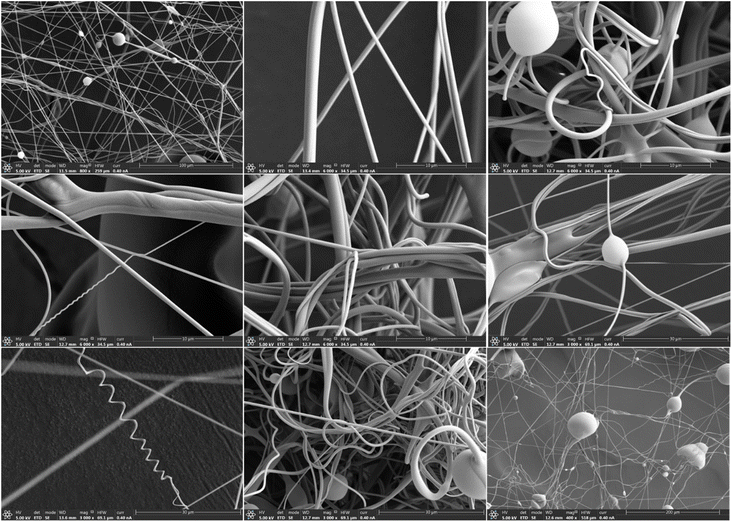
Fig. 11 show several SEM images of fibers collected on the lateral mesh under varying conditions. The images show PVA fibers of varying diameters and it elucidates the versatility of the technique as facilitator of novel micro- and nanofibrous materials.
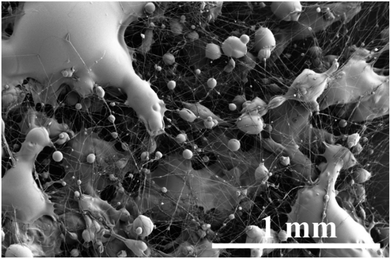
The SEM images shown in Fig. 11 represent fibers collected in the lateral zone of the cylindrical mesh. Nevertheless, a SEM image showing material collected on the transversal section, at the end of the cylindrical mesh, is depicted in Fig. 12. Albeit the presence of fibers is noticeably in this zone, the dominant structures are large spheroids and smaller quasi-perfect spheres, both significantly large compared with the dimensions of the fibers. Two facts are evident from such image, first, filaments elongate in flight before colliding on the mesh were they stop and dry thus leading to solid structures, and at the final stages of evaporation, surface tension forces take over forming the spheres. Second, a longer heating zone would be required to evaporate the solvent contained in the filaments thus increasing the fiber production rate, implying that liquid ejection technique does not limit the fiber production. Nevertheless, these type of beaded micro- and nanofibers find use in high-added value applications such as microencapsulation for drug delivery or as filter media.47–50
To estimate the elongation rate of filaments per unit distance of flight, a correlation between the data obtained using CFD simulations and the data collected with the experimental setup was established. First, a representative filament’ initial diameter of D0 = 50 μm for the ejection zone is selected. Furthermore, it will be assumed that the filament is a perfect cylinder and because the PVA concentration is 6 wt%, the fiber will be considered to constitute the 6% of the mass of the cylindrical filament volume, thus:
 | (8) |
 | (9) |
Furthermore, fibers collected at 50 cm from the ejection point had a characteristic diameter of 0.8 μm thus implying Dfil ∼ 4.35 μm and, according to our CFD simulations, the velocity of the filaments was of the order of vflight = 100 m s−1. Therefore, a filament diameter reduction of 91% occurred in only 5 ms. If the initial liquid threads did not undergo branching, splitting or breakup, its length would increase more than two orders of magnitude.
4. Conclusions
This study presents a micro-mixing-based method for the large-scale production of submicrometer-sized polymer fibers. The method involves ejecting polymer solutions at high liquid flow rates using a Flow Blurring (FB) atomizer, followed by on-line thermal treatment, resulting in the production of micro/nanofiber mats in a single step. The atomizer plays a crucial role in fragmenting the liquid stream with a gas current to generate thin filaments. Computational Fluid Dynamics (CFD) simulations were employed to investigate the dynamics of polymer solution ejection and fragmentation, while experiments were conducted to examine the impact of gas pressure and furnace temperature on the final fiber diameter and structure.The simulations demonstrated that the flow blurring regime was attained when the gas overpressure was sufficiently high to implode into the liquid feeding tube, creating an interior gas cavity and triggering the micro-mixing mechanism. Moreover, cross-sectional views obtained from the simulations revealed the presence of numerous inner bubbles not only near the walls but also in positions close to the central axis of the tube. By utilizing CFD simulations to study the dynamics of polymer solution ejection and fragmentation, a deeper understanding and control of the atomization process can be achieved, potentially leading to the development of more efficient and precise methods for polymer fiber production.
Poly(vinyl alcohol) (PVA) solutions were utilized in the fiber production experiments. In the initial set of experiments, the gas flow rate was varied while maintaining a constant liquid flow rate to examine its influence on the final fiber diameter and structure. The furnace was held at a nominal temperature of 300 °C. In the second set of experiments, the gas and liquid flow rates were fixed while the furnace temperature was varied from 150 °C to 600 °C. Increasing the liquid flow rate resulted in an increase in the fiber diameter, which can be expressed as a geometric mean diameter (![[d with combining macron]](https://www.rsc.org/images/entities/i_char_0064_0304.gif) f) ∼ Ql0.3. Furthermore, the experiments carried out at lower furnace temperatures (150 °C and 300 °C) resulted in fibers with a diameter of approximately 600 nm, while those carried out at higher temperatures (450 °C and 600 °C) resulted in fibers with a diameter of nearly 770 nm. Such fact suggests that the solvent evaporation rate has a significant effect on the diameter and structure of the fibers.
f) ∼ Ql0.3. Furthermore, the experiments carried out at lower furnace temperatures (150 °C and 300 °C) resulted in fibers with a diameter of approximately 600 nm, while those carried out at higher temperatures (450 °C and 600 °C) resulted in fibers with a diameter of nearly 770 nm. Such fact suggests that the solvent evaporation rate has a significant effect on the diameter and structure of the fibers.
The method described herein has the potential for efficient and scalable production of polymer fibers for a variety of cutting-edge applications. The use of relatively low or medium temperatures allows for the processing of materials which may undergo thermal degradation at higher temperatures, and the capability of functioning with high liquid flow rates, which can reach tens of milliliters per hour, allows for the production of large amounts of fibers in a short period of time.
Conflicts of interest
There are no conflicts to declare.Acknowledgements
LBML and AMGC acknowledge financial support from the Government of Spain through a RETOS grant (PID2019-108278RB-C31). LBML acknowledges partial financial support from Junta de Andalucía through PAIDI (P18-FR-3623) and FEDER (US-1380775) grants.References
- J. Drabek and M. Zatloukal, Phys. Fluids, 2019, 31, 091301 CrossRef.
- R. Sattler, S. Gier, J. Eggers and C. Wagner, Phys. Fluids, 2012, 24, 023101 CrossRef.
- J. Hou, C. Park, W. Jang and H. Byun, RSC Adv., 2021, 11, 678–683 RSC.
- S. Yang, W. Ma, A. Wang, J. Gu and Y. Yin, RSC Adv., 2018, 8, 23390–23396 RSC.
- M. Alberghini, S. Hong, L. M. Lozano, V. Korolovych, Y. Huang, F. Signorato, S. H. Zandavi, C. Fucetola, I. Uluturk, M. Y. Tolstorukov, G. Chen, P. Asinari, R. M. Osgood, M. Fasano and S. V. Boriskina, Nat. Sustain., 2021, 4, 715–724 CrossRef.
- G. W. Peterson, D. T. Lee, H. F. Barton, T. H. Epps and G. N. Parsons, Nat. Rev. Mater., 2021, 6(7), 605–621 CrossRef CAS.
- B. Fang, J. Yan, D. Chang, J. Piao, K. M. Ma, Q. Gu, P. Gao, Y. Chai and X. Tao, Nat. Commun., 2022, 13(1), 1–9 Search PubMed.
- N. Sezer and M. Koç, Nano Energy, 2021, 80, 105567 CrossRef CAS.
- B. Wang, A. Facchetti, B. Wang and A. Facchetti, Adv. Mater., 2019, 31, 1901408 CrossRef PubMed.
- C. Park, J. Seol, A. Aldalbahi, M. Rahaman, A. L. Yarin and S. S. Yoon, Phys. Fluids, 2023, 35, 027126 CrossRef CAS.
- J. Drabek and M. Zatloukal, Phys. Fluids, 2019, 31, 091301 CrossRef.
- J. L. Lowery, N. Datta and G. C. Rutledge, Biomaterials, 2010, 31, 491–504 CrossRef CAS PubMed.
- L. B. Modesto-López, R. J. Chimentão, M. G. Álvarez, J. Rosell-Llompart, F. Medina and J. Llorca, Appl. Clay Sci., 2014, 101, 461–467 CrossRef.
- D. H. Reneker, A. L. Yarin, E. Zussman and H. Xu, Adv. Appl. Mech., 2007, 41, 43–346 Search PubMed.
- M. Lauricella, F. Cipolletta, G. Pontrelli, D. Pisignano and S. Succi, Phys. Fluids, 2017, 29, 082003 CrossRef.
- E. Zhmayev, D. Cho and Y. Lak Joo, Phys. Fluids, 2011, 23, 073102 CrossRef.
- F. Li, A. M. Gañán-Calvo and J. M. López-Herrera, Phys. Fluids, 2011, 23, 094108 CrossRef.
- C. Belbéoch, J. Lejeune, P. Vroman and F. Salaün, Environ. Chem. Lett., 2021, 19, 1737–1763 CrossRef PubMed.
- R. Madurga, A. M. Gañán-Calvo, G. R. Plaza, G. V. Guinea, M. Elices and J. Pérez-Rigueiro, Green Chem., 2017, 19, 3380–3389 RSC.
- F. Müller, S. Jokisch, H. Bargel and T. Scheibel, ACS Appl. Polym. Mater., 2020, 2, 4360–4367 CrossRef.
- B. E. Kwak, H. J. Yoo, E. Lee and D. H. Kim, ACS Macro Lett., 2021, 10, 382–388 CrossRef CAS PubMed.
- M. Bruening and D. Dotzauer, Nat. Mater., 2009, 8, 449–450 CrossRef CAS PubMed.
- A. M. Gañán-Calvo, Appl. Phys. Lett., 2005, 86, 214101 CrossRef.
- A. Ramos-Escobar, R. Uceda-Gallegos, L. Modesto-López and A. Gañán-Calvo, Phys. Fluids, 2020, 32, 122101 CrossRef CAS.
- L. B. Modesto-López and J. Olmedo-Pradas, ACS Omega, 2022, 7(15), 12549–12555 CrossRef PubMed.
- C. Wang and T. Hashimoto, Macromolecules, 2018, 51, 4502–4515 CrossRef CAS.
- G. Chen, H. Lai, P. Lu, Y. Chang and C. Wang, Macromol. Rapid Commun., 2023, 44, 2200273 CrossRef CAS PubMed.
- B. M. Simmons and A. K. Agrawal, Combust. Sci. Technol., 2012, 184, 660–675 CrossRef CAS.
- L. B. Modesto-López and A. M. Gañán-Calvo, Aerosol Sci. Technol., 2018, 52, 198–208 CrossRef.
- J. Rosell-Llompart and A. M. Gañán-Calvo, Phys. Rev. E: Stat., Nonlinear, Soft Matter Phys., 2008, 77, 036321 CrossRef PubMed.
- M. Hermosín-Reyes, A. M. Gañán-Calvo and L. B. Modesto-López, J. Aerosol Sci., 2019, 137, 105429 CrossRef.
- L. B. Modesto-López, A. Pérez-Arjona and A. M. Gañán-Calvo, ACS Omega, 2019, 4, 2693–2701 CrossRef PubMed.
- L. Jiang and A. K. Agrawal, Flow, Turbul. Combust., 2015, 94, 323–338 CrossRef CAS.
- A. Kourmatzis, O. J. Jaber, G. Singh and A. R. Masri, Energy Fuels, 2022, 36, 4224–4233 CrossRef CAS.
- R. Murugan, P. S. Kolhe and K. C. Sahu, Eur. J. Mech. B Fluids, 2020, 84, 528–541 CrossRef.
- A. Kumar and S. S. Han, Int. J. Polym. Mater. Polym. Biomater., 2017, 66, 159–182 CrossRef CAS.
- M. Chouak, L. Dufresne and P. Seers, J. Fluids Eng., 2019, 141, 1–13 CrossRef.
- A. M. Gañán-Calvo, Phys. Rev. Lett., 1998, 80, 285–288 CrossRef.
- B. M. Simmons and A. K. Agrawal, Combust. Sci. Technol., 2012, 184, 660–675 CrossRef CAS.
- R. Murugan, B. Bollu, K. Sekhar and P. Kolhe, Experimental study of flow blurring twin fluid atomization concept using transparent injector, in ILASS-Americas, Chicago, USA, 2018 Search PubMed.
- J. Serrano, F. J. Jiménez-Espadafor, A. Lora, L. Modesto-López, A. Gañán-Calvo and J. López-Serrano, Energy, 2019, 168, 737–752 CrossRef CAS.
- B. M. Simmons and A. K. Agrawal, Atomization Sprays, 2010, 20, 821–835 Search PubMed.
- S. R. Agrawal, L. Jiang, A. K. Agrawal and K. C. Midkiff, in 8th U. S. National Combustion Meeting, Western States Section of the Combustion Institute, 070-HE-0317, University of Utah, 2013 Search PubMed.
- F. Marín-Brenes, J. Olmedo-Pradas, A. M. Gañán-Calvo and L. Modesto-López, Materials, 2021, 14, 3399 Search PubMed.
- M. D. Abràmoff, P. J. Magalhães and S. J. Ram, Biophot. Int., 2004, 11, 36–42 Search PubMed.
- G. Belforte, T. Raparelli, V. Viktorov and A. Trivella, Tribol. Int., 2007, 40, 512–521 CrossRef.
- H. Liu, L. Liu, J. Yu, X. Yin and B. Ding, Compos. Commun., 2020, 22, 100493 CrossRef.
- S. Somvipart, S. Kanokpanont, R. Rangkupan, J. Ratanavaraporn and S. Damrongsakkul, Int. J. Biol. Macromol., 2013, 55, 176–184 CrossRef CAS PubMed.
- H. Qi, P. Hu, J. Xu and A. Wang, Biomacromolecules, 2006, 7, 2327–2330 CrossRef CAS PubMed.
- K. M. Yun, C. J. Hogan, Y. Matsubayashi, M. Kawabe, F. Iskandar and K. Okuyama, Chem. Eng. Sci., 2007, 62, 4751–4759 CrossRef CAS.
| This journal is © The Royal Society of Chemistry 2023 |


