
 Open Access Article
 This Open Access Article is licensed under a Creative Commons Attribution-Non Commercial 3.0 Unported Licence
Machine learning-assisted flexible wearable device for tyrosine detection†
Qiwen Baoa,
Gang Lia,
Wenbo Chengb,
Zhengchun Yang c,
Zilian Qud,
Jun Weie and
Ling Lin*a
c,
Zilian Qud,
Jun Weie and
Ling Lin*a
aSchool of Precision Instrument and Optoelectronic Engineering, The State Key Laboratory of Precision Measuring Technology and Instruments, Tianjin University, 92 Weijin Road, Tianjin 300072, China. E-mail: linling@tju.edu.cn
bSuzhou Institute of Biomedical Engineering and Technology, Chinese Academy of Sciences, Suzhou, 215163, P. R. China
cSchool of Electrical and Electronic Engineering, Tianjin Key Laboratory of Film Electronic & Communication Devices, Advanced Materials and Printed Electronics Center, Tianjin University of Technology, Tianjin 300384, China
dBeijing Informat Technol Coll, Beijing 100015, P. R. China
eSchool of Materials Science and Engineering, Harbin Institute of Technology, Shenzhen 518055, China
First published on 8th August 2023
Abstract
Early diagnosis of pathological markers can significantly shorten the rate of viral transmission, reduce the probability of infection, and improve the cure rate of diseases. Therefore, analytical techniques for identifying pathological markers and environmental toxicants have received considerable attention from researchers worldwide. However, the most popular techniques used in clinical settings involve expensive precision instruments and complex detection processes. Thus, a simpler, more efficient, rapid, and intelligent means of analysis must be urgently developed. Electrochemical biosensors have the advantages of simple processing, low cost, low sample preparation requirements, rapid analysis, easy miniaturization, and integration. Thus, they have become popular in extensive research. Machine learning is widely used in material-assisted synthesis, sensor design, and other fields owing to its powerful data analysis and simulation learning capabilities. In this study, a machine learning-assisted carbon black–graphene oxide conjugate polymer (CB–GO/CP) electrode, in conjunction with a flexible wearable device, is proposed for the smart portable detection of tyrosine (Tyr). Input feature value data are obtained for the artificial neural network (ANN) and support vector machines (SVM) model learning via multiple data collections in artificial urine and by recording the pH and temperature values. The results reveal that a machine-learning model that integrates multiple external factors is more accurate for the prediction of Tyr concentration.
1. Introduction
A biosensor device measures biomarkers using components such as recognizers and signal converters. It accomplishes the identification and quantification of the analyte to be measured in two steps: (1) specific identification of the analyte to be measured by various aptamers, such as enzymes, nanomaterials, and antibodies; and (2) conversion of the biochemical signal generated by the binding of the target analyte and the receptor active substance into a signal that can be easily analyzed by a signal converter. It is a rapid assay with low cost, good selectivity, and high sensitivity, and is used extensively in the field of biochemical analysis. Another important feature is that it does not require complex and expensive sample pretreatment or sophisticated equipment, making it suitable for application in portable in situ analysis. This is important for immediate diagnosis, disease treatment, quality control of food and environmental samples, drug development, and biomedical research.1 Depending on the signal converter used, biosensors can be further classified into optical or electrochemical biosensors.2Electrochemical biosensors are classified as either amperometric, impedance, or voltage electrochemical biosensors according to the binding mechanism and the interaction between the analyte to be measured and the electrochemical signal transducer to produce current, resistance, and potential. These include test methods such as cyclic voltammetry (CV), electrochemical impedance spectroscopy (EIS), differential pulse voltammetry (DPV), solvation voltammetry (SV), alternating current voltammetry (ACV), polarimetry, ordinary pulse voltammetry (NPV), linear scanning voltammetry (LSV), square wave voltammetry (SWV), chronoamperometry (CA), and open circuit voltage (OP). Recently, electrochemical biosensors have been combined with different types and forms of emerging active materials, such as nanomaterials, semiconductors, and ceramics, to enhance the sensitivity, specificity, and limit of detection (LOD) of assays.3,4 In addition, these biosensors can be easily combined with microfluidic systems for the development of a rapid, accurate, and sensitive miniaturized electrochemical analysis method and has received considerable attention from domestic and international researchers.5–7 Portable electrochemical biosensors offer the following advantages over conventional electrochemical biosensors. They are more cost-effective, faster, require a smaller sample volume, and support a multiplexed mode for the simultaneous detection of multiple target substances. It has been applied to various physiological markers, environmental toxicity detection, and disease diagnosis.8–11
Machine learning has received extensive attention in the fields of material search,12 mechanical structure performance testing,13 and drug prediction.14 Machine learning can be effective in processing sensor phone data for large numbers of samples or complex matrix data. The ML application to electrochemical biosensors facilitates the acquisition of reasonable analytical results from disordered and low-resolution sensing data. Correlations between potential biological agents and target signals, properly using ML methods potentially reveals unseen relationships between sensed signals and specimen parameters. In addition, ML-based biosensors can be used to analyze raw sensing data in various approaches such as classification, anomaly detection, noise reduction, and pattern recognition. The performance of biosensors is inevitably affected in actual testing, and the field use of biosensors is generally polluted by interference. ML plays a very important role for examining the signal quality in such cases. The use of ML enables the sensor performance to be improved due to interference and biological contamination in the actual samples, as well as the observation of noise contained in the sensed signals. Machine learning models which extract quality signals from signals containing noise can be used to interpret the sensed data efficiently and easily.15 For in situ diagnosis or detection, that ML is very important to assist biosensors to obtain fast, accurate, automated and direct readout of the results. Rao et al.16 used in situ hydrothermal synthesis to prepare in one step kudzu biochar (BC)-modified graphene-like molybdenum selenide (MoSe2) with oxidative enzyme-like activity as a smart nano-enzymatic sensing platform to potentiostatically perform the hesperidin (HP) in orange peel detection. An intelligent sensing of HP was achieved using machine learning technique and the performance evaluation of the technique was evaluated using regression analysis. Kammarchedu et al.17 demonstrated a kinetic multimodal analyzer based on ML and molybdenum polysulfide (eMoSx) electrodeposited on laser-induced graphene (LIG) for the detection of tyrosine (Tyr) and UA in sweat and salivary multiplex detection of UA. Xu et al.18 presented a nano-enzymatic sensor based on ML and MWCNTs/GO/dendritic silver nanoparticles (AgNPs) prepared and characterized by voltammetry for the determination of benzoyl (BN) residues in tea and cucumber samples. Support vector machine (SVM) algorithm and least squares support vector machine (LS-SVM) algorithm were used to realize the intelligent sensing of BN as compared to the conventional methods. The most commonly used techniques in the field of pathological marker detection are reverse transcription quantitative real-time (RT-qPCR)-based RNA detection and enzyme-linked immunoassay (ELISA)- and LFICS-based antibody detection techniques; however, both methods have some practical limitations. Biosensors, particularly smartphone-driven biosensors, are expected to be the next generation of popular immunoassay technologies because they can provide fast, accurate, and sensitive early detection.19–21 These biosensors include electrochemical biosensors, fluorescence-based biosensors, colorimetric biosensors, localized surface plasmon resonance (LSPR) and surface-enhanced Raman scattering (SERS) biosensors.22–25 Among them, electrochemical and SERS biosensors are the most popular. For example, a label-free electrochemical immunosensor was prepared using a N-GQD/GNR composite-modified electrode to detect carbohydrate antigen 15-3 (CA15-3) biomarkers.26 Electrochemical biosensors offer various advantages, such as low cost, simplicity, ease of miniaturization, and batch manufacturing. In addition, they are used as nursing devices at home or in physicians' offices. Owing to the disadvantages of the time-consuming, expensive, and complicated operation of traditional detection methods used for tyrosine (Tyr), this study proposed a composite-modified electrode based on a carbon-based material preparation. The carbon-based electrode exhibited good sensing action, response speed, selectivity, sensitivity, and stability. Considering the demand for convenient detection, a wearable smart carbon-based electrochemical sensor for quantitative Tyr detection was successfully constructed by combining the designed portable detection device and a machine learning-based sensor.
2. Materials and methods
2.1 Construction of flexible and wearable Tyr detection equipment
As shown in Fig. 1, 5 g ethyl cellulose (main hydrophobic agent) was added to 100 mL pine oil alcohol (organic solvent) in small quantities and several times while stirring at 60 °C using a magnetic stirrer until a colorless and uniform viscous colloid was obtained. Next, a yellow oil dye was added to the mixed colloidal solution, thus resulting in yellow hydrophobic slurry with good flowability. A 350 mesh screen was selected, and the cut A4 size filter paper and the screen were placed and printed using a screen printer. The obtained filter paper with the hydrophobic pattern was placed in a drying oven at 60 °C for 30 min. Using the obtained filter paper, hydrophobic ink was screen printed on the filter paper through a custom patterned stencil and placed in an oven at 120 °C for 30 min to form paper electrodes. The carbon black–graphene oxide (CB–GO) inks for printing were prepared using the following steps. Two 10 mL solutions containing 1 mg CB powder and 1 mL GO dispersion were continuously stirred in a centrifuge at 1000 rpm for 1 h; the CB solution (3 mL) and GO dispersion (4 mL) were uniformly mixed and treated with ultrasonication for 30 min at room temperature (22.1 °C); subsequently, deionized (DI) water (70 mL) and PVA (3 g) were added to this solution and the mixture was uniformly stirred at 120 °C for 1 h; finally, the prepared CB–GO mixture was treated in an ultrasonic cell mill for 20 min to obtain CB–GO ink. The pure carbon ink for printing the conductive substrate pattern, the Ag/AgCl ink for printing the reference electrode pattern, and the prepared CB–GO ink were used to print the corresponding layers on the paper-based electrodes in the order presented using a screen printer.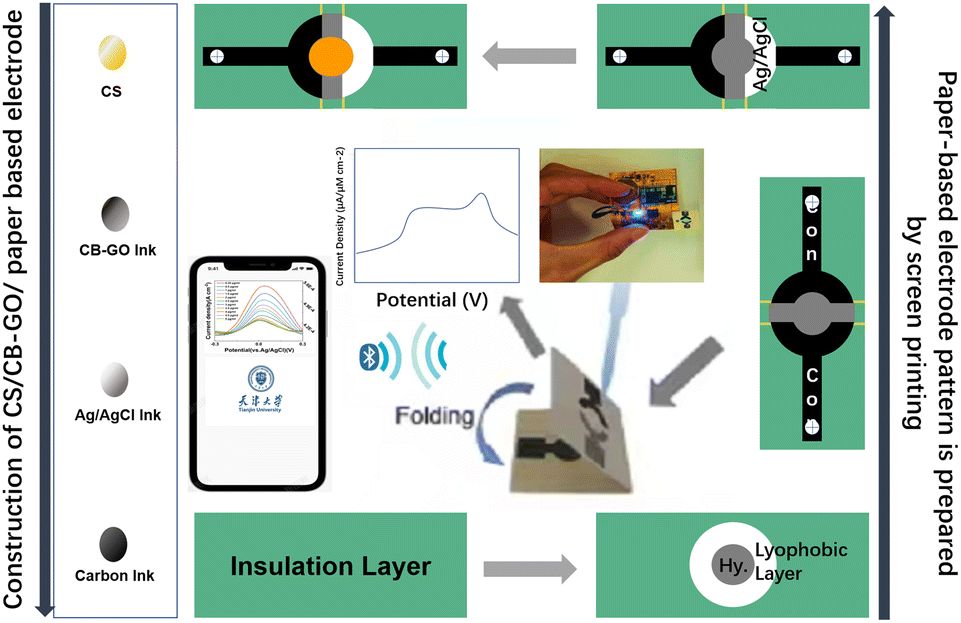 | ||
| Fig. 1 Preparation of paper-based CS/CB–GO/CP electrodes for flexible device connection. | ||
The hardware circuit and software interface of the portable device are shown in Fig. 2. A lithium battery was used to supply power to the device at a stable voltage of 3.3 V, which was converted by two linear voltage regulator modules. The main part of the constant potential meter consisted of a digital-to-analog converter (DAC) module with I2C for control and communication. Considering the flexibility and portability of the wearable device, polyimide (PI) was chosen as the substrate material for the circuit board, and the electrodes were connected using screws and nuts through the three through-holes left in the paper-based electrodes (Fig. 2). The app was developed using the WeChat app developer tool and then released to the cell phone for use with a built-in, low-power Bluetooth interface for data transmission.
 | ||
| Fig. 2 Circuit block diagram and software interface of the flexible wearable immune sensor. | ||
2.2 Reagents
The CB (carbon Vulcan XC-72), GO solutions (mean radial dimension: 5–8 μm, thickness: 1 nm, dispersion in H2O: 2 mg mL−1), L-Tyr (99%, 60-18-4, 25 g), N,N-dimethylformamide (DMF) (AR, 99.5%, 500 mL), ethyl cellulose, pinoresinol, and artificial urine were all purchased from Shanghai Macklin Biochemical Co., Ltd.2.3 Electrochemical testing
Artificial urine containing PBS (0.01 M, pH 7.2) was used as the reaction cell environment solution. The DPV method was chosen for the tests within a voltage range of −0.5 to +1.8 V. All electrochemical tests were performed on a magnetic stirrer with heating, which facilitated the adjustment of the temperature in the reaction cell. The pH of the solution was adjusted using 1 M solutions of HCl and NaOH. Real-time temperature and pH values were measured online using an ion pH temperature tester with an accuracy of 0.01.2.4 Modeling and evaluation
The system consists of input, hidden, and output layers. As presented in Table 1, the input parameters were composed of 11 factors related to the current, voltage, and Tyr concentration values on the DPV response curve, as well as the pH and temperature values that affect the Tyr current values. The selection of the input and output layer functions significantly influenced the prediction accuracies of the artificial neural network (ANN) and support vector machine (SVM) models.| N | 1 | 2 | 3 | 4 | 5 | 6 | 7 |
| V | I_0 | I_1 | I_2 | V_0 | V_1 | V-2 | Vp_0 |
| 8 | 9 | 10 | 11 | 12 | 13 | ||
| Vp_1 | Vp_2 | Con_1 | Con_2 | pH | Temp. |
SVM is a method used to map a nonlinear mapping p in the sample space to a high-dimensional feature space such that the original nonlinearly separable problem in the sample can be transformed into a linearly separable problem in the feature space. SVM has shown good results in solving problems with a small number of samples and linear regression. Approximately 80% of the sample data obtained from the experiments were used for model training and approximately 20% were used for model validation and prediction. The performance of each model was evaluated using root mean square error (RMSE), coefficient of determination (R2), mean absolute error (MAE), and residual prediction deviation (RPD).
2.5 Data acquisition
A flexible electrochemical workstation (Fig. 1) was used for Tyr detection and data collection. A magnetic stirrer with heating capability was used to provide rapid sample dispersion homogeneity and temperature maintenance, and a commercial pH–temperature meter (SevenExcellence S400-Basic) was used to monitor and record the sample pH and temperature continuously. The phonological test mode and operating parameters were entered into the cell phone software (Fig. 2) and the commands were entered into a flexible electrochemical workstation via Bluetooth. A method for adjusting the temperature and pH of the environment was chosen for testing, as described in Section 2.3. Before each detection test for Tyr, the heating temperature of the magnetic stirrer and the addition of HCl and NaOH solutions were adjusted, the probe of the pH–temperature tester was inserted, and the corresponding values were recorded while waiting for the temperature and pH of the solution to stabilize. After each adjustment of Tyr concentration, the solution in the electrolytic cell was added to the working electrode area of the paper-based electrode in Fig. 1 by pipetting 10–100 μL. Finally, the data transmitted from the workstation was collected in real time for the next machine learning model.3. Results and discussion
3.1 Electrochemical characteristics
To test the Tyr in the prepared CS/CB–GO, paper-based electrode for use in body fluids (artificial urine), the external factors of the experimental environment were maintained constant (pH = 8.1, temperature = 24.3 °C), as described in Section 2.3. Tyr was sequentially added to the electrolytic cell to adjust the Tyr concentration (40–2080 μM). Finally, 50 μL Tyr solution was added dropwise to the working area of the paper-based electrode using a pipette, and the assay and data collection were completed. Before each sample was added to the paper-based electrode, the electrode surface was washed with DI water and dried before the Tyr solution was added dropwise.The collected DPV response curves of the CS/CB–GO/paper-based electrode for different concentrations (40–2080 μM) are shown in Fig. 3. Evidently, the CS/CB–GO/paper-based electrode equipped with a flexible sensor platform for Tyr detection had a good electrochemical response while keeping the external environment factors (pH and temperature) constant. The oxidation peak near +1.5 V of the DPV curve gradually shifted to the left as the Tyr concentration increased, and the current density data near the +1.5 V pole point was calculated. The average value was calculated and fitted to the corresponding Tyr concentration value, and the linear functions and linearity of the current response to log10(c(Tyr)) are as follows.
| y = −4.8088 × 10⁻⁷x + 4.1123 × 10⁻⁶, |
| R2 = 0.93382. |
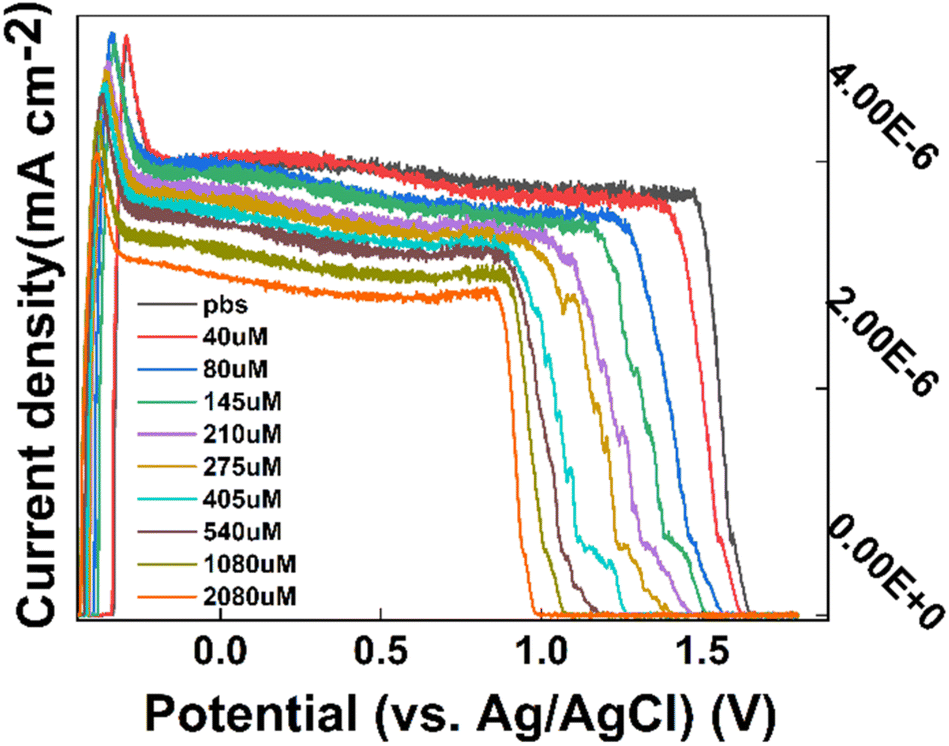 | ||
| Fig. 3 CS/CB–GO/paper-based electrodes titrated with DPV curves of artificial urine containing 40–2080 μM tyrosine (Tyr). | ||
Evidently, the CS/CB–GO/paper-based electrode design of the flexible wearable device for Tyr detection had good sensitivity (0.48088 μA cm−2), linearity (R2 = 0.93382), and a wide detection interval (40–2080 μM).
3.2 Influence of temperature and pH on Tyr detection
The portable electrochemical workstation operating mode was set to DPV, electrode mode was set to double electrode, start potential was −0.5 V, end potential was +1.8 V, step potential was 20 mV, amplitude was 100 mV, pulse width was 10 ms, and pulse period width was 30 ms. To study the effect of pH on the CS/CB–GO/paper-based electrode for Tyr detection and to separately analyze the effect of pH on the test system, the ambient temperature of each experiment was kept constant (24 °C), and the solution was continually stirred to ensure homogeneous mixing. Electrochemical reactions were performed in 200 mL artificial urine containing 40 μM Tyr. The experiments started with successive drops of a small amount of KOH into the solution until the pH reached 10.80. The pH of the system and the DPV curve of the CS/CB–GO/SPCE for Tyr detection were recorded and the results are shown in Fig. 4. In addition, results with a lower pH were reported with an HCl solution using the same procedure.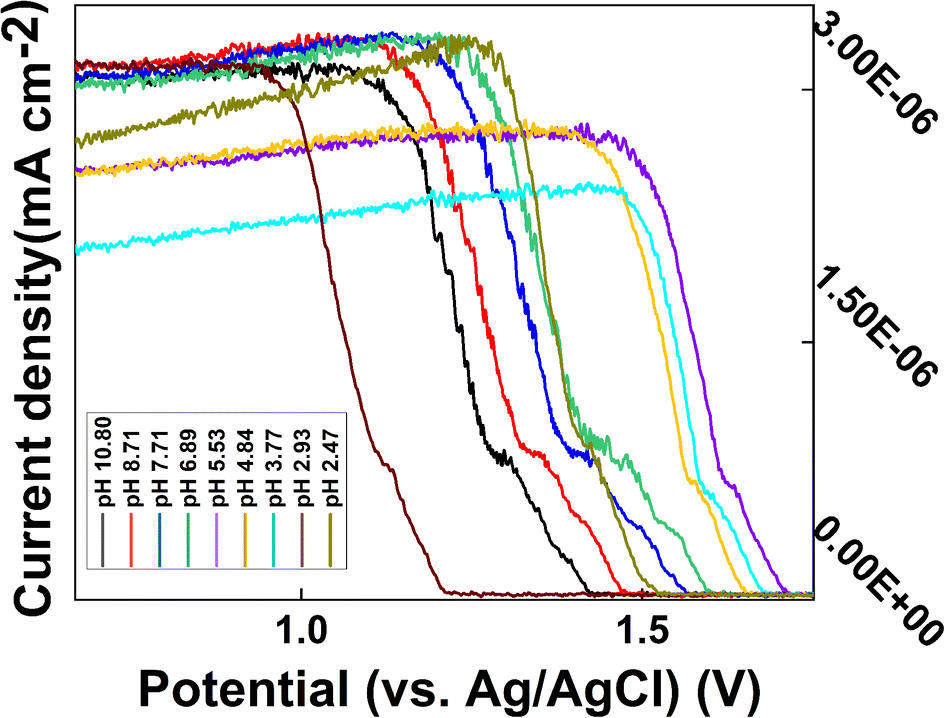 | ||
| Fig. 4 DPV curves of CS/CB–GO/paper-based electrode in artificial urine containing 40 μM Tyr at different pH values (2.47–10.86). | ||
To investigate the effect of temperature on the CS/CB–GO/paper-based electrode for Tyr detection, a heating stirrer was used to heat the electrolyte. A complete heating–warming–natural cooling process was used to analyze the effect of temperature on the CS/CB–GO/paper-based electrode for Tyr detection. Other external environmental factors, such as solution pH (8.1), stirred solution, and constant Tyr concentration (40 μM), were maintained during the experiment. The temperature and DPV curves during warming and cooling were recorded over time, as shown in Fig. 5.
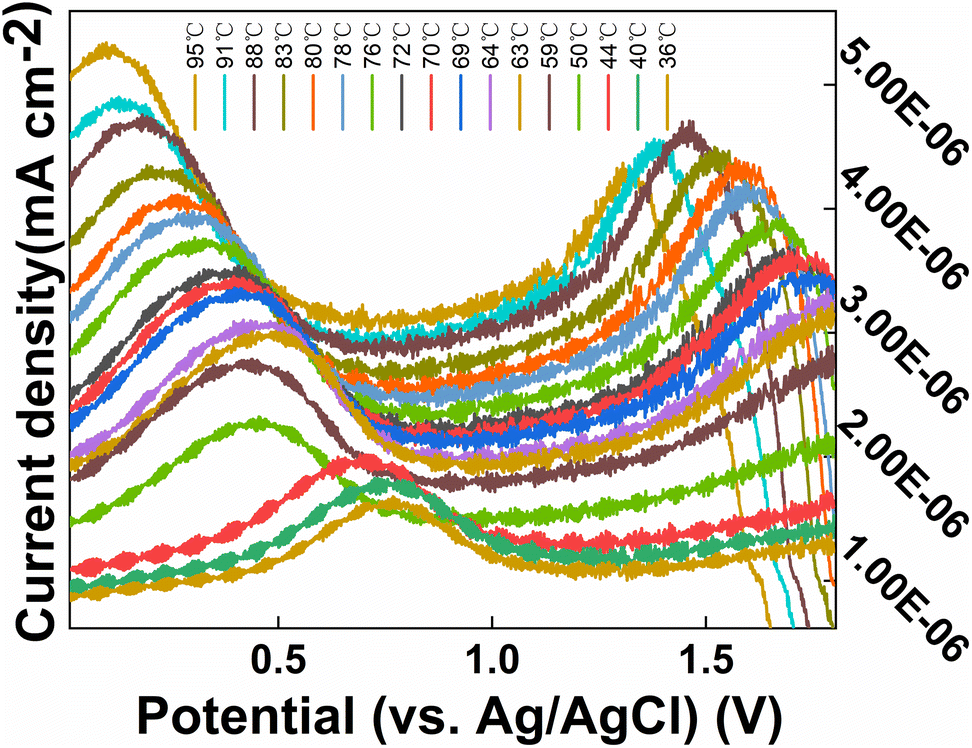 | ||
| Fig. 5 DPV curves of CS/CB–GO/paper-based electrode in artificial urine containing 40 μM Tyr at different temperature (36–95 °C). | ||
Evidently, the effect of pH on this electrochemical reaction system was evident and consistent; essentially, the current response of the electrode significantly decreased during the transition from an alkaline to an acidic electrolyte. In addition, the oxidation peak near +0.5 V gradually decreased, which may be related to the gradual increase of hydrogen ions. The DPV curve shifted in the positive direction, which affected the detection of Tyr by the CS/CB–GO/paper-based electrodes. The warming process is clearly an accelerated ion migration and exchange process, which is consistent with the principles of electrochemical kinetics. In addition to a significant weakening of the electrochemical reaction rate, the cooling process also revealed a gradually enhanced oxidation peak near +1.5 V, which does not appear during the warming process. This could be caused by electrochemical side reactions occurring in the electrolytic cell during the high-temperature process. Therefore, in conclusion, temperature and pH are influential factors that should not be neglected in the design of wearable device equipped with a CS/CB–GO/paper-based electrode for the Tyr-testing scheme, and the pH value during the actual test must be considered in the next step of the characteristic value selection.
3.3 Machine learning algorithms application
The linearity of the sensor described in Section 3.1 (R2 = 0.93382) can be used to predict unknown concentrations of Tyr solutions based on the current response. Here, it is proposed to further enhance the accuracy of the sensor in predicting Tyr concentrations by incorporating a machine learning model. Sets of 32 data samples were acquired, as described in Section 3.1, except that sample data were acquired at different temperatures and pH. The 32 sets of DPV curves are shown in Fig. S1.† The eigenvalues of the sample data are presented in Fig. 6. The 13 eigenvalues are: current intensity and potential at the three extreme points, known solution concentration (Con_1 = 35.7 μM), predicted target concentration (Con_2 = 66.64 μM), pH (8.03), and temperature (33.9 °C). A specific list of the parameters is presented in Table 1. The statistics for the collected eigenvalue data are listed in Table S1.†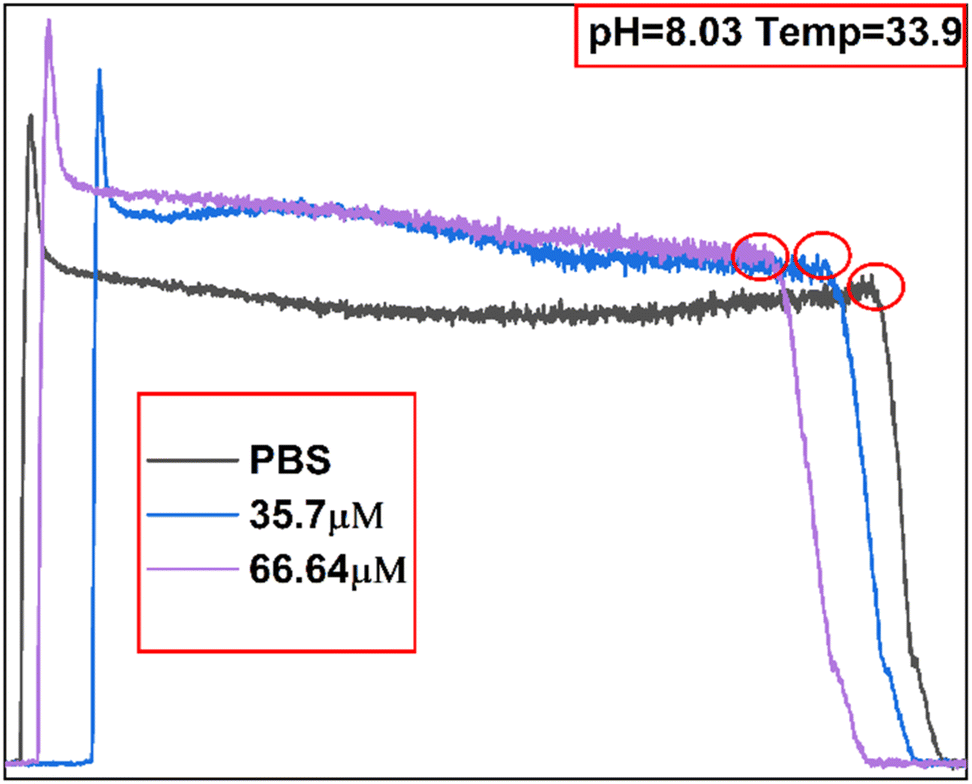 | ||
| Fig. 6 Characteristic value selection diagram of CS/CB–GO/paper-based electrodes. | ||
Owing to the small number of samples (32 × 13), choosing a smaller network could reduce model overfitting. Therefore, the ANN model was designed as a 4-layer network in which the two hidden layers each contained 64 neurons. In this study, the sigmoid transfer function was used as the input–output transfer function. The regressions of the SVM and ANN on the relationship between the reaction currents and different Tyr concentrations were compared. SVMs are widely used for classification and nonlinear function estimation and have a better nonlinear modeling capability when the kernel function is introduced. In this study, the ANN and SVM algorithm models were implemented using the Python language based on the scikit-learn (sklearn) open-source framework for machine learning, and experiments were conducted using four kernel functions: radial basis function (RBF), linear kernel function (linear), polynomial kernel function (poly), and two-layer neural network kernel function (linear).
3.4 Machine-learning-aided Tyr concentration prediction
The Sklearn library contains common regression algorithm models, such as linear, elastic net, kernel nonlinear regression (KNR), decision tree regression (DTR), lasso, Bayesian ridge, and ridge regression (ridge). These regression analysis models were easily imported and used herein. Our training dataset comprised 70% of the original sample data, and all data were centered and scaled using the StandardScaler function of the preprocessing library. The model is built in the following steps: first, standardization of the samples is necessary; it is not safe to input data with large values and heterogeneous data into the neural network model, and it will lead to larger gradient updates, which in turn will lead to the network failing to converge. So in this paper, the following criteria are used to standardize the input data: (1) making most of the data distributed in the range of 0–1; (2) keeping all the eigenvalues in roughly the same range. Normalization of the data can be easily accomplished using Numpy, a third-party function package for Python. The sample data then need to be grouped as follows: 70% of the 32-sample data (electrodes used for DPV data with different concentrations of Tyr detection) are used as the training set and 30% as the testing set. Keras is a model-level library that provides a high level of building models for deep learning developers. The evaluation models such as ANN, SVM, etc. built in this paper are constructed with the support of this third-party library. Once the model is constructed, it is then ready to be trained and validated according to the agreed grouping of samples. The predicted values of the output of each group of data are finally compared with the corresponding labeled values, and some commonly used statistical variables are chosen to assess how close the predicted values are to the true values. Finally, the training process is concluded with an agreed level of satisfaction and the final output is computed on the test set. For each regression model, we evaluated the prediction results using R2, RMSE, MAE and recovery (%) as evaluation parameters. Table 2 presents the statistics obtained for each model in one run. Each model was tested five times to reduce the chance of error, as presented in Table S2.† The results exhibited high degrees of linearity, small RMSE and MAE values, and a recovery rate close to 100%. In particular, the ridge regression model exhibited the best prediction of Tyr concentration when applied to this dataset, with R2 = 0.9828, RMSE = 5.4170, MAE = 4.4912, and recovery = 99.24%.| Models | R2 | RMSE | MAE | Recovery (%) |
|---|---|---|---|---|
| Linear | 0.9433 | 7.0993 | 5.9615 | 98.43 |
| Elastic net | 0.9473 | 7.3974 | 6.2411 | 99.39 |
| KNR | 0.7319 | 16.9687 | 15.1117 | 86.94 |
| DTR | 0.8305 | 13.6664 | 6.5352 | 91.53 |
| Lasso | 0.9415 | 7.5584 | 5.8636 | 97.48 |
| Bayesian ridge | 0.9369 | 8.7832 | 7.4365 | 96.91 |
| Ridge | 0.9828 | 5.4170 | 4.4912 | 99.24 |
3.5 Machine learning with ANN and SVM models
ANN is a mathematical structure used for discovering complex nonlinear relationships between inputs and outputs. The specific network construction is described in Section 3.3. In this model, the x-matrix is the input layer, which consists of 12 eigenvalues, except for the Con_2 target concentration eigenvalue, and consists of 12 columns and 32 rows. The input matrix is populated with 12 eigenvalues as columns, and 32 different electrode samples as rows.The y-matrix is the output layer composed of data from the target concentration labeled Con_2. As described in Section 3.4, the dataset was randomly divided into two groups: 70% for the training dataset and 30% for the prediction dataset. During the learning process of the ANN, the model continuously compared the output values of the network with the real values to calculate the loss values and automatically adjusted the node weights and network parameters to optimize the network. As shown in Fig. 7, the model was validated 500 times per training and plotted the trend of loss and MAE, considering the overfitting of the network and the computational power of the computer. Evidently, as the model learned on this dataset, the loss and MAE gradually decreased until they were close to zero with increasing rounds. No overfitting occurred, thus indicating that the model could accurately predict the concentration of Tyr when used on this dataset.
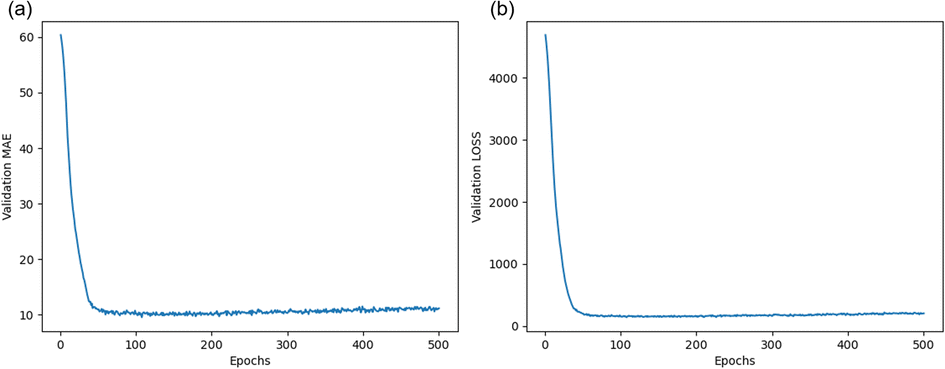 | ||
| Fig. 7 Loss–epoch and MAE–epoch curves on the verified data set. | ||
An SVM converts nonlinear problems in a low-dimensional space into linear problems in a high-dimensional space, and can eliminate the problem of computational complexity owing to the number of input dimensions. The introduction of kernel functions transforms the inner product operation in a high-dimensional space into the computation of kernel functions in the original space; therefore, the form of the nonlinear changes need not be known.
In SVM research, the selection of kernel functions and parameters is key to model selection, and proper kernel functions and parameters can greatly improve the classification and regression performance of SVMs. The dataset in this study was small; hence, the grid search (GridSearchCV) function of the sklearn library was employed to search for the optimal kernel function and parameters of the SVM. The search results are presented in Table 3. GridSearchCV can guarantee the determination of parameters with the highest accuracy within the specified parameter range, adjust the parameters according to the step size, train the learner using the adjusted parameters, and determine the parameters with the highest accuracy in the validation set from all parameters. In addition, the output values (predicted values) of the SVM model were compared with the optimal kernel function and parameters with the true values to calculate the recovery rate results of the model, as presented in Tables 3 and S2.† Fig. 8 shows the proximity curves of the predicted values to the true values for the SVM applied to the test set (30%). Evidently, the optimal kernel function for the SVM model on this small data set was linear with the parameters: penalty coefficient (c = 5) and gamma = 0.001. The recovery rate of the SVM model was 98.1509%.
| Models | C | Gamma | Kernel | Recovery (%) |
|---|---|---|---|---|
| SVM | 5 | 0.001 | Linear | 98.1509 |
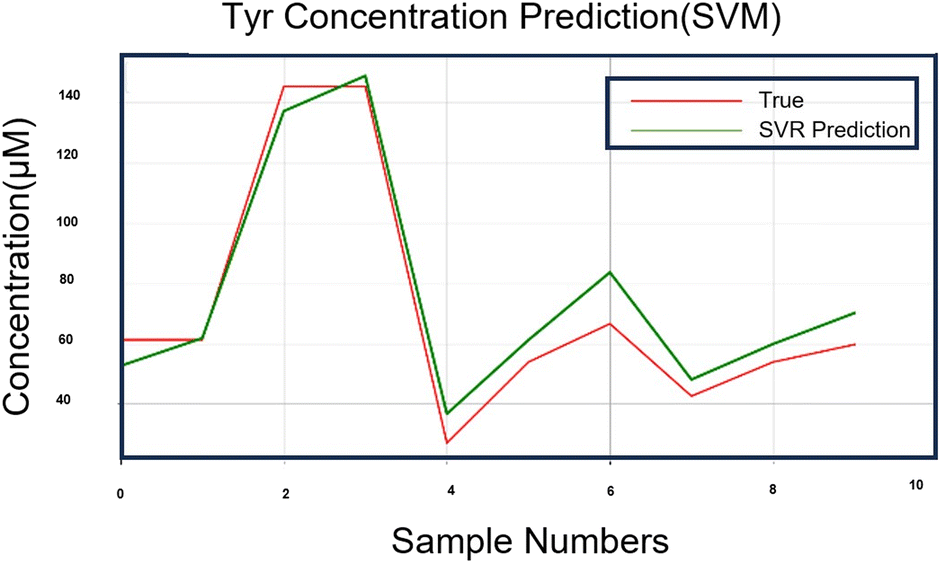 | ||
| Fig. 8 Approximation curve between the predicted value and the true value of the SVM algorithm model running on 30% of the samples. | ||
4. Conclusions
In this study, a flexible wearable device that incorporated machine learning was developed for the quantitative determination of Tyr concentrations. CS/CB–GO/paper-based electrodes were prepared using a cost-effective screen-printing process and connected to a small flexible electrochemical analysis device for rapid quantitative analysis of Tyr. Transmission of the test results were uploaded to a machine learning terminal for artificial intelligence (AI) analysis. The experiments revealed that the platform, combined with the constructed ANN/SVM/Line/DTR/Lasso algorithm models, achieved satisfactory confidence and linearity. This platform provides a new solution for the development of an AI-based, accurate online detection of Tyr, which can significantly improve the flexibility, practicality, intelligence, and miniaturization of the system. In the future, this multichannel electrochemical workstation, equipped with embedded machine learning algorithms, can detect biochemical signals in more complex field environments.Conflicts of interest
There are no conflicts to declare.Acknowledgements
This research was supported by the Tianjin Natural Science Foundation (Grant No. 18JCZDJC99800, 17JCQNJC00900), National Natural Science Foundation of China (Grant No. 51502203), Tianjin Young Overseas High-level Talent Plans (Grant No. 01001502), Tianjin Science and Technology Foundation (Grant No. 17ZXZNGX00090), Tianjin Distinguished Professor Foundation of Young Researchers, and Tianjin Development Program for Innovation and Entrepreneurship. The authors thank the State Key Laboratory of Precision Measuring Technology and Instruments for providing their equipment. The authors are also thankful to Prof. Yang, Prof. Pan and Ruizhao Tian from Tianjin University of Technology for their guidance regarding experimental ideas and techniques, as well as to the Suzhou Institute of Biomedical Engineering and Technology for providing access to the laboratory site and required equipment.References
- N. Bhalla, P. Jolly, N. Formisano and P. Estrela, Introduction to biosensors, in Biosensor Technologies for Detection of Biomolecules, ed. P. Estrela, 2016, pp. 1–8 Search PubMed.
- L. Z. Xu, N. Shoaie, F. Jahanpeyma, J. J. Zhao, M. Azimzadeh and K. T. Al-Jamal, Optical, electrochemical and electrical (nano)biosensors for detection of exosomes: a comprehensive overview, Biosens. Bioelectron., 2020, 161, 112222 CrossRef CAS PubMed.
- S. Yazdanparast, A. Benvidi, M. Azimzadeh, M. D. Tezerjani and M. R. Ghaani, Experimental and theoretical study for miR-155 detection through resveratrol interaction with nucleic acids using magnetic core-shell nanoparticles, Microchim. Acta, 2020, 187(8), 479 CrossRef CAS PubMed.
- S. N. Topkaya, M. Azimzadeh and M. Ozsoz, Electrochemical Biosensors for Cancer Biomarkers Detection: Recent Advances and Challenges, Electroanalysis, 2016, 28(7), 1402–1419 CrossRef CAS.
- L. Y. Zheng, G. Z. Cai, S. Y. Wang, M. Liao, Y. B. Li and J. H. Lin, A microfluidic colorimetric biosensor for rapid detection of Escherichia coli 0157:H7 using gold nanoparticle aggregation and smart phone imaging, Biosens. Bioelectron., 2019, 124, 143–149 CrossRef PubMed.
- J. Liu, X. T. Jiang, R. Y. Zhang, Y. Zhang, L. M. Wu, W. Lu, J. Q. Li, Y. C. Li and H. Zhang, MXene-Enabled Electrochemical Microfluidic Biosensor: Applications toward Multicomponent Continuous Monitoring in Whole Blood, Adv. Funct. Mater., 2019, 29(6), 1807326 CrossRef.
- S. Jafari, M. Dehghani, N. Nasirizadeh, M. H. Baghersad and M. Azimzadeh, Label-free electrochemical detection of Cloxacillin antibiotic in milk samples based on molecularly imprinted polymer and graphene oxide-gold nanocomposite, Measurement, 2019, 145, 22–29 CrossRef.
- G. G. Qiu, Z. B. Gai, Y. L. Tao, J. Schmitt, G. A. Kullak-Ublick and J. Wang, Dual-Functional Plasmonic Photothermal Biosensors for Highly Accurate Severe Acute Respiratory Syndrome Coronavirus 2 Detection, ACS Nano, 2020, 14(5), 5268–5277 CrossRef CAS PubMed.
- B. Liu, J. Y. Zhuang and G. Wei, Recent advances in the design of colorimetric sensors for environmental monitoring, Environ. Sci.: Nano, 2020, 7(8), 2195–2213 RSC.
- K. Takeda, R. Kusuoka, M. Inukai, K. Igarashi, H. Ohno and N. Nakamura, An amperometric biosensor of L-fucose in urine for the first screening test of cancer, Biosens. Bioelectron., 2021, 174, 112831 CrossRef CAS PubMed.
- H. U. Chung, A. Y. Rwei, A. Hourlier-Fargette, S. Xu, K. Y. Lee, E. C. Dunne, Z. Q. Xie, C. R. Liu, A. Carlini, D. H. Kim, D. Ryu, E. Kulikova, J. Y. Cao, I. C. Odland, K. B. Fields, B. Hopkins, A. Banks, C. Ogle, D. Grande, J. B. Park, J. Kim, M. Irie, H. Jang, J. H. Lee, Y. Park, J. Kim, H. H. Jo, H. Hahm, R. Avila, Y. H. Xu, M. Namkoong, J. W. Kwak, E. Suen, M. A. Paulus, R. J. Kim, B. V. Parsons, K. A. Human, S. S. Kim, M. Patel, W. Reuther, H. S. Kim, S. H. Lee, J. D. Leedle, Y. J. Yun, S. Rigali, T. Son, I. W. Jung, H. Arafa, V. R. Soundararajan, A. Ollech, A. Shukla, A. Bradley, M. Schau, C. M. Rand, L. E. Marsillio, Z. L. Harris, Y. G. Huang, A. Hamvas, A. S. Paller, D. E. Weese-Mayer, J. Y. Lee and J. A. Rogers, Skin-interfaced biosensors for advanced wireless physiological monitoring in neonatal and pediatric intensive-care units, Nat. Med., 2020, 26(3), 112831 CrossRef PubMed.
- X. Li, G. C. Shan, H. B. Zhao and C. H. Shek, Domain knowledge aided machine learning method for properties prediction of soft magnetic metallic glasses, Trans. Nonferrous Met. Soc. China, 2023, 33(1), 209–219 CrossRef CAS.
- W. Tong, Q. Wei, H.-Y. Yan, M.-G. Zhang and X.-M. Zhu, Accelerating inverse crystal structure prediction by machine learning: a case study of carbon allotropes, Front. Phys., 2020, 15(6), 63501 CrossRef.
- L. Han, G. Shan, B. Chu, H. Wang, Z. Wang, S. Gao and W. Zhou, Accelerating drug repurposing for COVID-19 treatment by modeling mechanisms of action using cell image features and machine learning, Cogn. Neurodynamics, 2023, 17(3), 803–811 CrossRef PubMed.
- K. A. Vakilian and J. Massah, A Portable Nitrate Biosensing Device Using Electrochemistry and Spectroscopy, IEEE Sens. J., 2018, 18(8), 3080–3089 CAS.
- L. M. Rao, X. Y. Lu, L. L. Xu, Y. F. Zhu, T. Xue, Y. Ge, Z. S. Duan, X. M. Duan, Y. P. Wen and J. K. Xu, Green synthesis of kudzu vine biochar decorated graphene-like MoSe2 with the oxidase-like activity as intelligent nanozyme sensing platform for hesperetin, Chemosphere, 2022, 289, 133116 CrossRef CAS PubMed.
- V. Kammarchedu, D. Butler and A. Ebrahimi, A machine learning-based multimodal electrochemical analytical device based on eMoSx-LIG for multiplexed detection of tyrosine and uric acid in sweat and saliva, Anal. Chim. Acta, 2022, 1232, 340447 CrossRef CAS PubMed.
- L. L. Xu, Y. Xiong, R. M. Wu, X. Geng, M. H. Li, H. Yao, X. Wang, Y. P. Wen and S. R. Ai, An Emerging Machine Learning Strategy for the Fabrication of Nanozyme Sensor and Voltametric Determination of Benomyl In Agro-Products, J. Electrochem. Soc., 2022, 169(4), 047506 CrossRef CAS.
- Y. Fan, S. Y. Shi, J. S. Ma and Y. H. Guo, Smartphone-based electrochemical system with multi-walled carbon nanotubes/thionine/gold nanoparticles modified screen-printed immunosensor for cancer antigen 125 detection, Microchem. J., 2022, 174, 107044 CrossRef CAS.
- S. Eissa, K. Al-Kattan and M. Zourob, Combination of Carbon Nanofiber-Based Electrochemical Biosensor and Cotton Fiber: A Device for the Detection of the Middle-East Respiratory Syndrome Coronavirus, ACS Omega, 2021, 6(47), 32072–32080 CrossRef CAS PubMed.
- J. J. Liu, N. Xu, H. Men, S. Li, Y. L. Lu, S. S. Low, X. Li, L. H. Zhu, C. Cheng, G. Xu and Q. J. Liu, Salivary Cortisol Determination on Smartphone-Based Differential Pulse Voltammetry System, Sensors, 2020, 20(5), 1422 CrossRef CAS PubMed.
- Y. J. Gao, D. T. Nguyen, T. Yeo, S. B. Lim, W. X. Tan, L. E. Madden, L. Jin, J. Long, F. A. Aloweni, Y. J. A. Liew, M. L. Tan, S. Y. Ang, S. D. O. Maniya, I. Abdelwahab, K. P. Loh, C. H. Chen, D. L. Becker, D. Leavesley, J. S. Ho and C. T. Lim, A flexible multiplexed immunosensor for point-of-care in situ wound monitoring, Sci. Adv., 2021, 7(21), eabg9614 CrossRef CAS PubMed.
- Z. Guo, O. Smutok, W. A. Johnston, C. E. Ayva, P. Walden, B. McWhinney, J. P. J. Ungerer, A. Melman, E. Katz and K. Alexandrov, Circular Permutated PQQ-Glucose Dehydrogenase as an Ultrasensitive Electrochemical Biosensor, Angew. Chem., Int. Ed., 2022, 61(6), e202109005 CrossRef CAS PubMed.
- A. N. Masterson, T. Liyanage, H. Kaimakliotis, H. G. Derami, F. Deiss and R. Sardar, Bottom-Up Fabrication of Plasmonic Nanoantenna-Based High- throughput Multiplexing Biosensors for Ultrasensitive Detection of microRNAs Directly from Cancer Patients' Plasma, Anal. Chem., 2020, 92(13), 9295–9304 CrossRef CAS PubMed.
- E. Zavyalova, O. Ambartsumyan, G. Zhdanov, D. Gribanyov, V. Gushchin, A. Tkachuk, E. Rudakova, M. Nikiforova, N. Kuznetsova, L. Popova, B. Verdiev, A. Alatyrev, E. Burtseva, A. Ignatieva, A. Iliukhina, I. Dolzhikova, A. Arutyunyan, A. Gambaryan and V. Kukushkin, SERS-Based Aptasensor for Rapid Quantitative Detection of SARS-CoV-2, Nanomaterials, 2021, 11(6), 1394 CrossRef CAS PubMed.
- M. Mavaei, A. Fattahi and A. Khoshroo, Electrochemical Immunosensor Based on Catalytic Activity of Nitrogen-doped Graphene Quantum Dots Supported by Graphene Nanoribbon Composite for Carbohydrate Antigen 15-3 Detection, Anal. Bioanal. Chem. Res., 2022, 9(2), 201–208 CAS.
Footnote |
| † Electronic supplementary information (ESI) available. See DOI: https://doi.org/10.1039/d3ra02900j |
| This journal is © The Royal Society of Chemistry 2023 |