DOI:
10.1039/D3RA02891G
(Paper)
RSC Adv., 2023,
13, 16342-16351
Methanol steam reforming for hydrogen production over NiTiO3 nanocatalyst with hierarchical porous structure†
Received
2nd May 2023
, Accepted 25th May 2023
First published on 31st May 2023
Abstract
Steam reforming for hydrogen production is one of the important research directions for clean energy. NiTiO3 catalysts with a hierarchical porous structure are prepared and applied to methanol steam reforming for hydrogen production. The results show that the optimum catalyst (10% Ni–Ti–Ox) not only has a hierarchical porous structure, but it also involves the coexistence of NiTiO3, anatase TiO2 and rutile TiO2. The formation of NiTiO3 is beneficial to the adsorption and activation of methanol molecules on the surface of the Ni–Ti–Ox catalyst, and the main intermediate species of the methanol molecular reaction are hydroxyl groups, methoxy species and formic acid species. Furthermore, the methanol steam reforming reaction is mainly dominated by methanol decomposition at low temperature (350–500 °C), while it is mainly dominated by methanol and water molecular reactions at high temperature (500–600 °C).
1. Introduction
Due to widespread concern over the shortage of fossil fuels, renewable and clean energy sources such as wind, solar, tidal and hydrogen have been developing rapidly in recent years.1–3 Among them, green hydrogen energy has a high energy calorific value, wide source and high conversion efficiency, and can be used as an efficient energy storage carrier, which is considered as one of the most promising renewable clean energy sources.4–6 Therefore, the production, transportation and storage of hydrogen are currently important research directions and urgent needs.7,8 Compared with hydrogen production methods such as photocatalysis, electrocatalysis and biotransformation, catalytic reforming is the most likely way to achieve large-scale application.9–11 At present, there are many reforming hydrogen production technologies for methane, formaldehyde, methanol, formic acid, ethanol and other small molecules.12–14 Among them, methanol steam reforming has become one of the mainstream technologies for hydrogen production due to its mature technology, high methanol conversion rate and low CO content.15 Although noble metal catalysts have excellent reforming hydrogen production performance and carbon deposition resistance, the cost is high, which is not conducive to large-scale application.16–18 Therefore, the study of non-noble metal reforming catalysts for hydrogen production is of great significance.
NiO has excellent breaking ability of C–C, C–H and C–O bond and dehydrogenation ability, so it is often used as active component of reforming catalyst.19–21 Titanium dioxide has become a commonly used catalyst carrier because of its excellent stability and mesoporous structure.22–24 Meanwhile, NiO can produce a certain synergistic catalytic effect with TiO2.19 Therefore, theoretically NiO/TiO2 catalyst can be used as one of the alternative catalysts for methanol reforming to produce hydrogen.25 Furthermore, hierarchical porous structure is conducive to promoting the adsorption and activation of reaction molecules at the active sites on the catalyst surface, thereby improving the reaction activity.26–28 Therefore, NiO loaded on TiO2 surface and forming hierarchical porous structure should be able to make the catalyst have excellent methanol reforming activity.
Under the guidance of the above theory, Ni–Ti–Ox catalysts were prepared by using polyethylene oxide–polypropylene oxide–polyethylene oxide triblock copolymer (denoted as P123) as template and tetrabutyl titanate as gel at room temperature. In addition, according to the literature, the presence of chloride ions may have a certain role in promoting the performance of reforming hydrogen production,29–31 so nickel chloride and nickel nitrate were used as precursors of NiO in this work. Based on the obtained Ni–Ti–Ox, the catalytic performance of Ni–Ti–Ox for methanol reforming to hydrogen was investigated, and the reaction mechanism of methanol reforming to hydrogen was obtained by in situ DRIFT study and VASP calculation.
2. Experimental
The details about characterization were provided in ESI.†
2.1 Catalyst preparation
Synthesis of TiO2. The P123 surfactant (2 g) with an average molecular weight of 5800 g mol−1 and citric acid monohydrate (5 g) as complexing agent were added to the mixed solution of ethanol (35 mL) and methanol (15 mL), and stirred for 1 h to obtain uniform precursor solution. Then 13 mL tetrabutyl titanate was dissolved and transparent solution was stirred at 35 °C for 4 h, and then placed at room temperature for 2 days. The obtained mixture was dried in air at 50 °C for 24 h. The dried samples were then calcined in a muffle furnace at 600 °C for 2 h.
Synthesis of Ni–Ti–Ox. When tetrabutyl titanate was added, appropriate amount of nickel chloride hexahydrate was added into the mixed solution at the same time, and the other steps were the same as the synthesis process of TiO2. The loadings of nickel oxide were 5%, 10%, 15% and 20%, respectively. According to the different amounts of nickel chloride, the catalysts were abbreviated as 5% Ni–Ti–Ox, 10% Ni–Ti–Ox, 15% Ni–Ti–Ox and 20% Ni–Ti–Ox, respectively.
Synthesis of 5% Ni–Ti–Ox–N. The other steps were consistent with the preparation method of Ni–Ti–Ox, except replacing nickel chloride hexahydrate with nickel nitrate hexahydrate.
2.2 Catalysis measurement and characterization
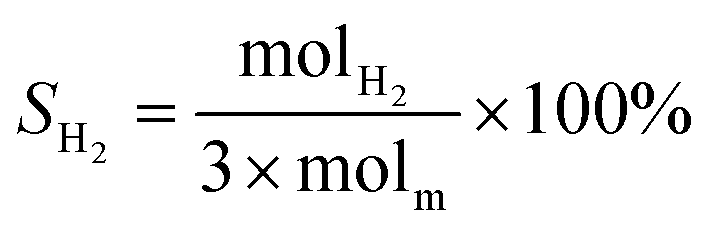
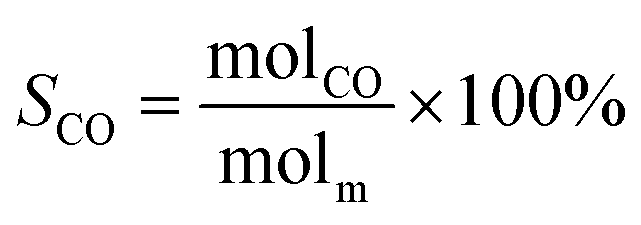
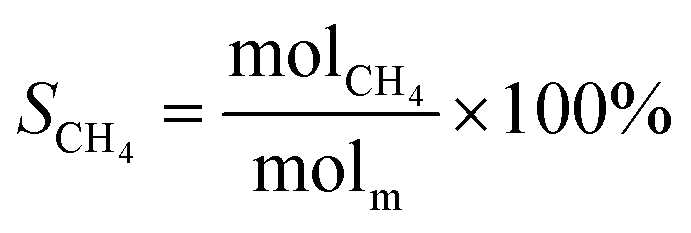
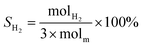
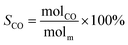
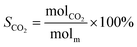
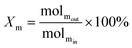
The schematic diagram of the catalytic reaction device was shown in Fig. S1.† The flow rate of nitrogen (carrier gas) was 90 mL min−1, and the mass ratio of methanol to deionized water was 2.5 to 1. The furnace was in horizontal position. The particle size of the catalyst was 0.63–0.85 mm, and its dosage was 1 g. The catalyst was not pretreated before the catalytic reaction. The weight hourly space velocity (MHSV) of reaction was 20![[thin space (1/6-em)]](https://www.rsc.org/images/entities/char_2009.gif) 000 mL (g h)−1. The mixture of methanol and deionized liquid was vaporized in the preheating furnace through a peristaltic pump, and then the mixture gas entered the reaction furnace and reacted with the catalyst. Finally, the gas after the reaction was passed into the gas chromatography for testing. The models and test methods for gas chromatography were described in detail in the ESI file.† The abbreviation of H2, CO, CO2 and CH4 selectivity were SH2, SCO, SCO2 and SCH4, and the methanol conversion was abbreviated as Xm.
000 mL (g h)−1. The mixture of methanol and deionized liquid was vaporized in the preheating furnace through a peristaltic pump, and then the mixture gas entered the reaction furnace and reacted with the catalyst. Finally, the gas after the reaction was passed into the gas chromatography for testing. The models and test methods for gas chromatography were described in detail in the ESI file.† The abbreviation of H2, CO, CO2 and CH4 selectivity were SH2, SCO, SCO2 and SCH4, and the methanol conversion was abbreviated as Xm.| |
 | (1) |
| |
 | (2) |
| |
 | (3) |
| |
 | (4) |
| |
 | (5) |
3. Results and discussion
3.1 Physical structure and chemical properties
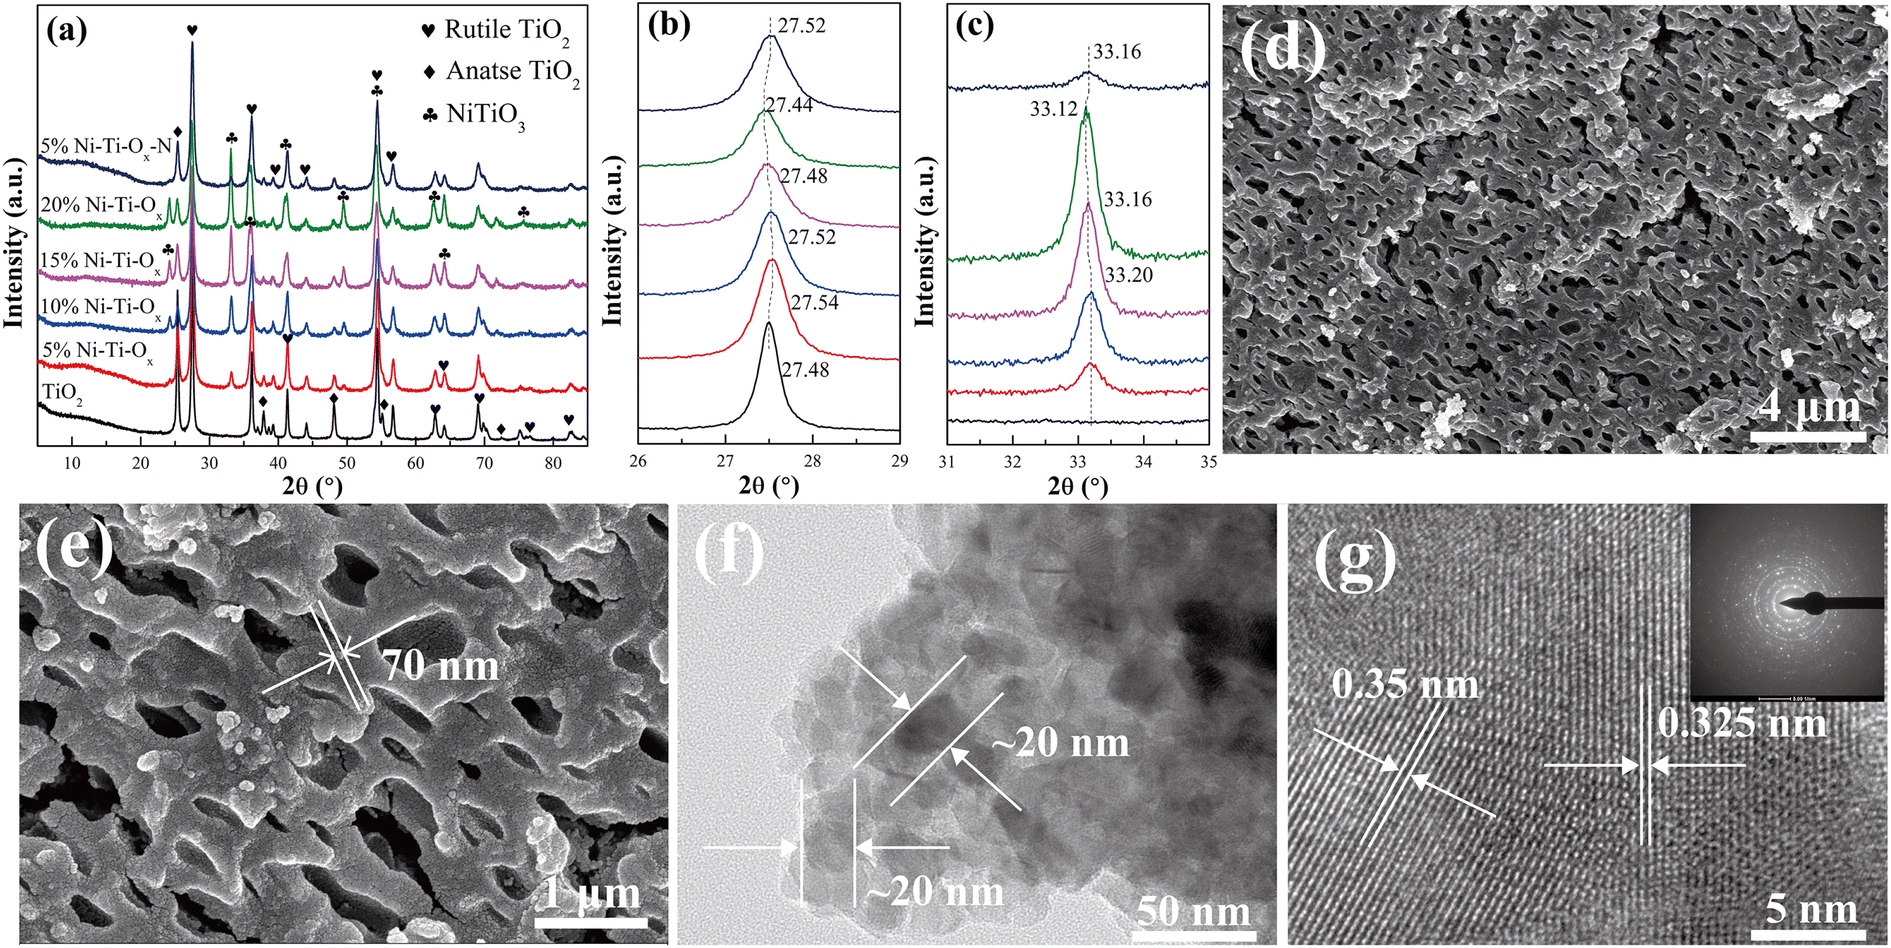
Fig. 1 showed the X-ray diffraction (XRD) patterns of TiO2 and Ni–Ti–Ox catalysts. For pure TiO2, the characteristic diffraction peaks corresponded to rutile TiO2 (PDF-ICDD 21-1276) and anatase TiO2 (PDF-ICDD 21-1272), and the characteristic peak intensity of rutile TiO2 was higher than that of anatase TiO2. This indicated that TiO2 was composed of two different crystal forms, and rutile was the main component. In addition, the characteristic diffraction peak corresponding to NiTiO3 (PDF-ICDD 33-0960) appeared when NiO was doped with TiO2. With the gradual increase of NiO content, the intensity of characteristic diffraction peak of TiO2 gradually decreased, while that of NiTiO3 gradually increased. It indicated that NiO did not exist on the surface of TiO2 carrier in the form of nanoparticles, but reacted with some TiO2 to form NiTiO3 and was uniformly loaded on TiO2. Meanwhile, the characteristic diffraction peaks of NiTiO3 and TiO2 gradually migrated to the low angle direction with the increase of NiO content (Fig. 1(b) and (c)). This may be due to the lattice distortion of TiO2 caused by the existence of NiTiO3.21
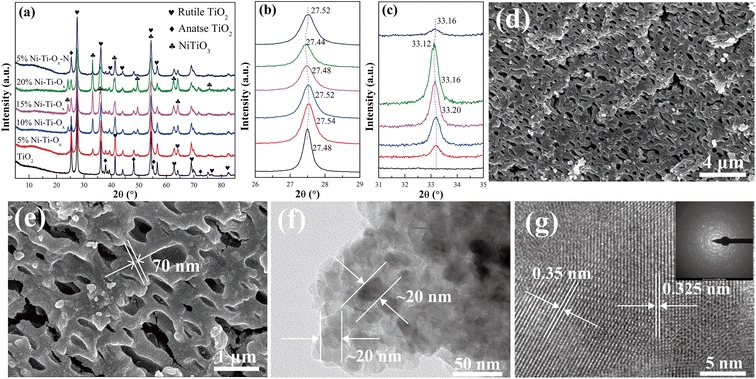 |
| | Fig. 1 (a) XRD patterns, (b) and (c) detail information of XRD patterns; (d) and (e) FE-SEM micrograph of 10% Ni–Ti–Ox catalyst; (f) and (g) HR-TEM micrograph of 10% Ni–Ti–Ox catalyst. | |
Fig. 1(d) and (e) showed the field emission scanning electron microscopy (FE-SEM) of 10% Ni–Ti–Ox catalyst. It could be seen from the figure that the catalyst was agglomerated by about 70 nm nanoparticles to form a micron-sized structure. In addition, there were abundant sub-micron pores (with the size of 250–800 nm) in the micron block particles, and the pores were interconnected. Combined with BET results, it could be seen that the Ni–Ti–Ox catalyst has both mesopores of about 2–20 nm and submicron pores of about 250–800 nm. In other words, Ni–Ti–Ox catalyst had hierarchical porous structure.
Fig. 1(e), (f) and S2–S4† showed the high-resolution transmission electron microscopy (HR-TEM) images and element mapping images of TiO2 and 10% Ni–Ti–Ox catalysts, respectively. According to the Fig. S2 and S3,† the TiO2 catalyst was composed of nanoparticles about 28–45 nm, and its lattice fringe spacing was 0.325 nm, corresponding to the (110) crystal plane of rutile TiO2.32–34 In addition, its element composition was also Ti and O elements, no other impurities appear. Corresponding to the results of TiO2, the particle size of 10% Ni–Ti–Ox catalyst was about 20 nm, which indicated that the grain growth of TiO2 was inhibited due to the formation of NiTiO3. Combined with SEM and TEM data, it could be found that for the 10% Ni–Ti–Ox catalyst, the nanoparticles at about 20 nm were firstly agglomerated into submicron bulk particles at 70–150 nm, and then submicron particles were agglomerated to form micron particles with hierarchical pore structure. Furthermore, the lattice fringe spacing of 10% Ni–Ti–Ox catalyst were 0.35 nm and 0.325 nm, corresponding to (101) crystal plane of anatase TiO2 and (110) crystal plane of rutile TiO2, respectively.35,36 Finally, according to the Fig. S4,† it could be found that Ni element was uniformly distributed in TiO2. Combined with XRD data, it was proved that NiTiO3 structure was formed in 10% Ni–Ti–Ox catalyst.
Fig. S5† and Table 1 showed the nitrogen adsorption and desorption curves, pore size distribution and specific surface area of TiO2 and Ni–Ti–Ox catalysts. It could be seen that the nitrogen adsorption and desorption curves of all the six groups of catalysts have hysteresis loops, indicating that there were mesopores in the catalysts.37 Furthermore, it could be seen from the pore size distribution that after a small amount of NiO was doped, the most probable pore size of the catalyst was 3.8 nm, and its average pore size was also reduced. On the contrary, when the NiO content was increased, the average pore diameter and the most probable pore diameter were increased. However, the 5% Ni–Ti–Ox catalyst had 30 m2 g−1 and the others had close values to the 5% Ni–Ti–Ox.
Table 1 Physical properties of different catalysts
| Samples |
BET surface area/(m2 g−1) |
Pore volume/(cm3 g−1) |
Average pore diameter/nm |
Most probable pore size/nm |
| TiO2 |
26.0 |
0.0816 |
17.7 |
9.7 |
| 5% Ni–Ti–Ox |
30.0 |
0.0649 |
13.2 |
3.8 |
| 10% Ni–Ti–Ox |
32.7 |
0.0778 |
14.7 |
7.9 |
| 15% Ni–Ti–Ox |
39.9 |
0.1240 |
16.1 |
12.6 |
| 20% Ni–Ti–Ox |
31.3 |
0.1187 |
18.3 |
12.7 |
| 5% Ni–Ti–Ox–N |
29.6 |
0.0694 |
9.5 |
3.8 |
3.2 Chemical properties
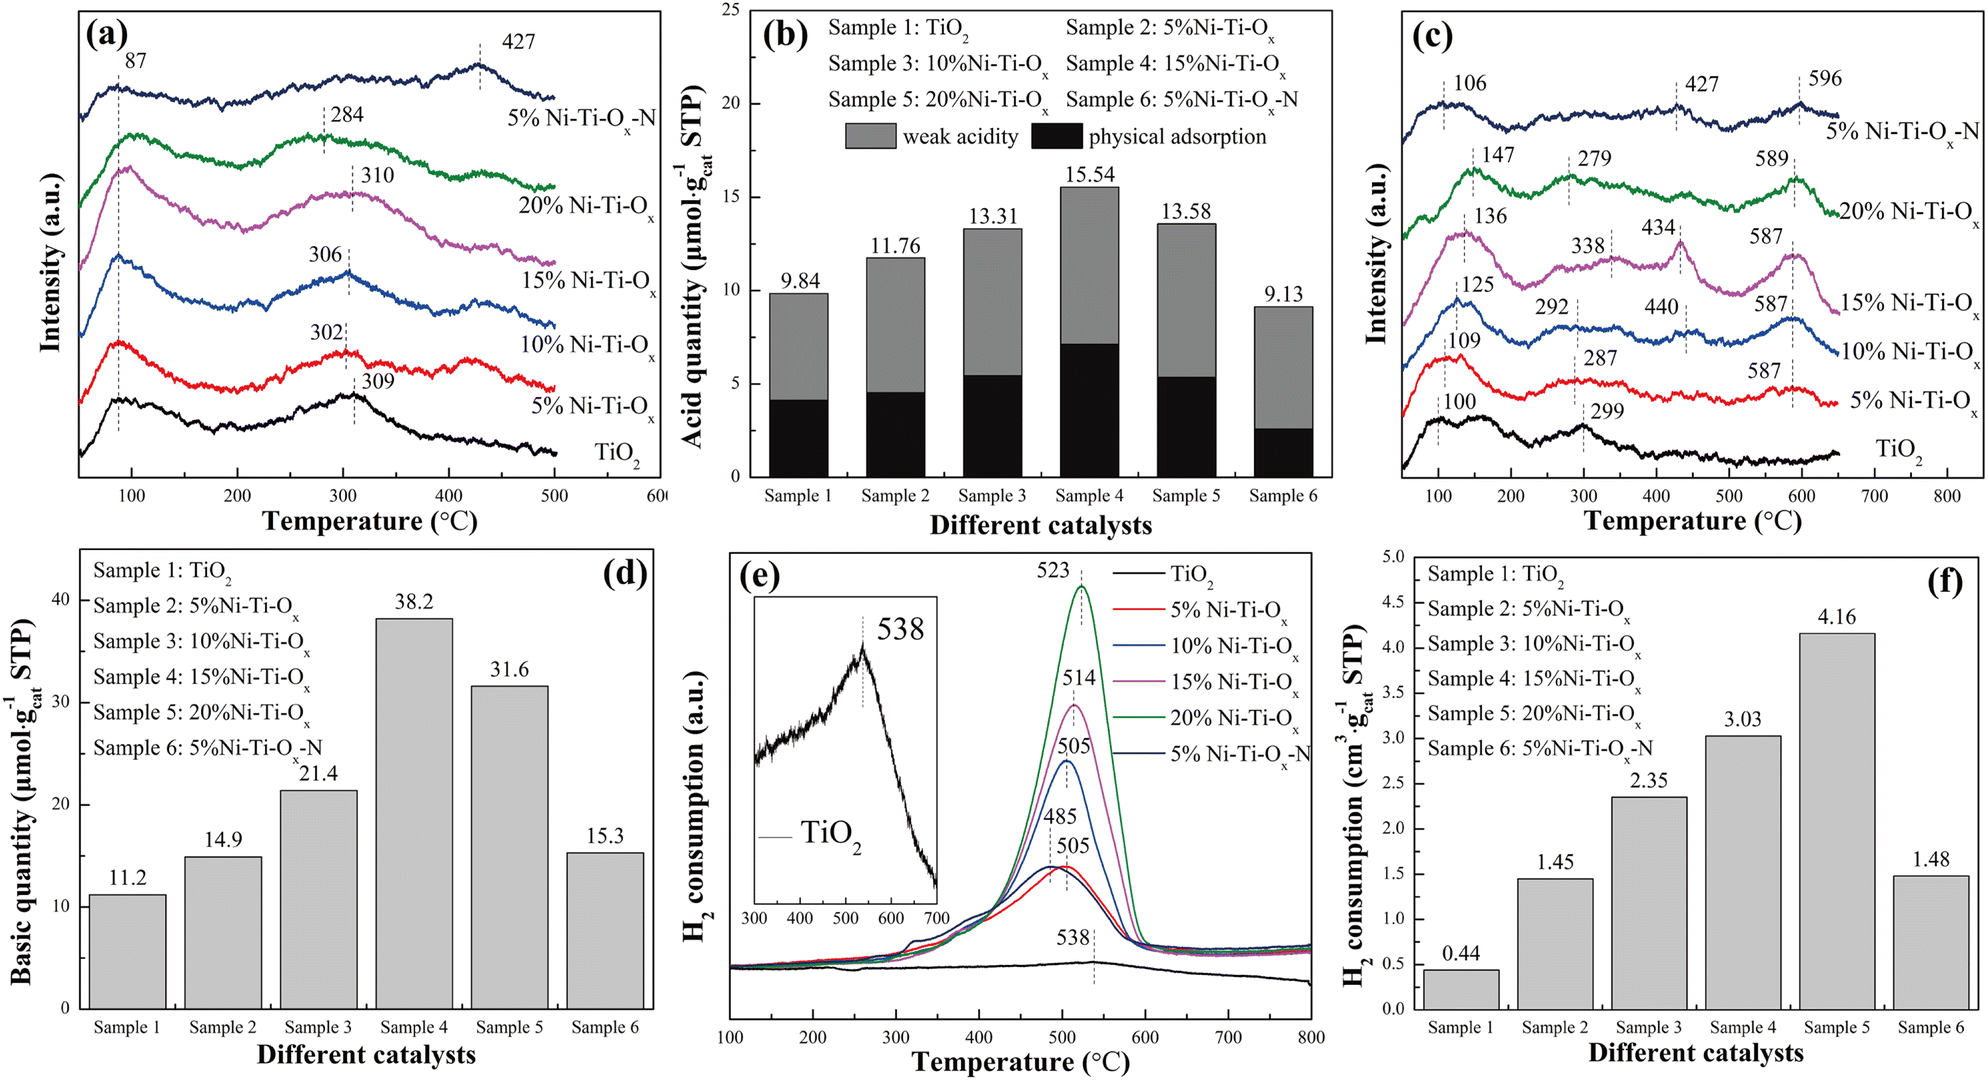
According to our previous studies, the hydroxyl group on the surface of metal oxide was one of the important reaction intermediates in the reforming reaction,38 so the influence of acidity and alkalinity on the catalytic performance was extremely important. For Ni–Ti–Ox catalyst, TiO2 was the main component, and the coordination charge number of oxygen was −2/3. One Ni atom in NiO was coordinated with six O atom, so the net charge value on each Ni–O bond was 1/3 – 2/3 = −1/3. According to Tanabe rule, the surface of NiO doped with TiO2 was Brønsted acid.39 In other words, the incorporation of NiO would increase the surface acidity of Ni–Ti–Ox catalyst. It could be seen from Fig. 2(a) that there were two ammonia desorption peaks of pure TiO2 at 87 °C and 309 °C, representing physical adsorption and weak acidity, respectively.40–42 With the increase of NiO content, the total acid quantity on the catalyst surface showed a trend of increasing first and then decreasing (Fig. 2(b)). It indicated that the incorporation of NiO could indeed significantly improve the acid quantity on the catalyst surface. Finally, by comparing the two groups of catalysts of 5% Ni–Ti–Ox and 5% Ni–Ti–Ox–N, it could be found that nickel chloride as a precursor had higher acid quantity than nickel nitrate as a precursor, and its acid strength was also significantly reduced, which was conducive to the improvement of catalytic activity of steam reforming for hydrogen production.
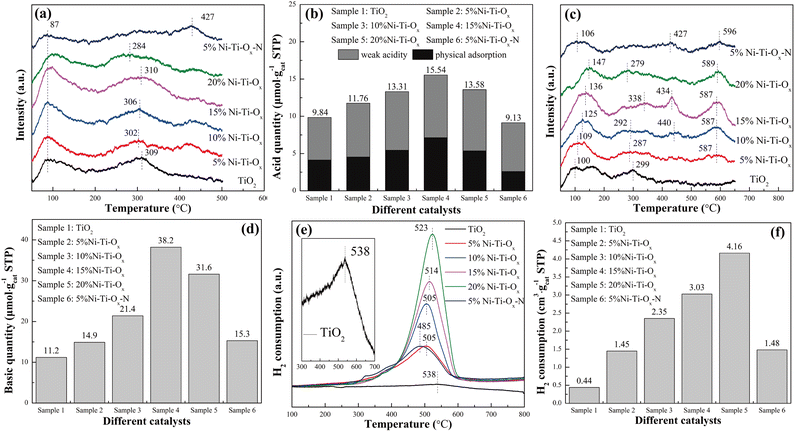 |
| | Fig. 2 (a) NH3-TPD profiles, (b) acid quantity, (c) CO2-TPD profiles, (d) basic quantity, (e) H2-TPR profiles, (f) H2 consumption of different catalysts. | |
NiO is a basic oxide, so the incorporation of NiO can also theoretically enhance the basic surface of the catalyst. It could be seen from Fig. 2(c) that TiO2 had two CO2 desorption peaks at 100 °C and 299 °C, representing the weak basic site and the medium basic site, respectively.43,44 When NiO was doped, two obvious CO2 desorption peaks appeared near 440 °C and 590 °C, corresponding to the strong basic site, which may be attributed to the role of NiTiO3. In addition, with the gradual increase of NiO content, the basic quantity on the catalyst surface increased from 11.2 μmol gcat.−1 of TiO2 to 38.2 μmol gcat.−1 of 15% Ni–Ti–Ox. However, as the content of NiO continued to increase, the basic quantity on the catalyst surface began to decrease (Fig. 2(d)). It may be because the content of NiO was too high, so that the active site was gradually covered by coating. Finally, according to our previous research, carboxylic acid species may appear in the intermediate species of methanol reforming to hydrogen production, so the enhancement of catalyst surface basic may be beneficial to the improvement of catalytic activity.
Redox performance was one of the important factors affecting the hydrogen production performance of reforming, so six groups of catalysts were characterized by H2-TPR, and the results were shown in Fig. 2(e) and (f). It was seen that pure TiO2 had a hydrogen reduction peak at 538 °C, corresponding to the reduction of Ti4+–O–Ti4+.45–47 The reduction peak of Ni–Ti–Ox migrated to low temperature after the addition of NiO and the hydrogen consumption of the catalyst increased linearly with the increase of NiO content (Fig. S6†). Therefore, the hydrogen reduction peak at 485–523 °C should correspond to the reduction of Ni2+–O–Ti4+. This indicated that NiTiO3 exhibited better redox performance than TiO2. The increase of hydrogen consumption also indicated that the catalyst surface had more hydroxyl groups, which was beneficial to the catalytic reaction. Finally, with the increase of NiO content, the hydrogen consumption of the catalyst increased, but the hydrogen reduction peak temperature also gradually increased. That was to say, the number of hydroxyl groups that could easily participate in the reaction was also gradually decreasing. Therefore, Ni–Ti–Ox catalyst had an optimal equilibrium point between redox performance and hydrogen consumption to achieve the best catalytic performance.
3.3 Surface active species
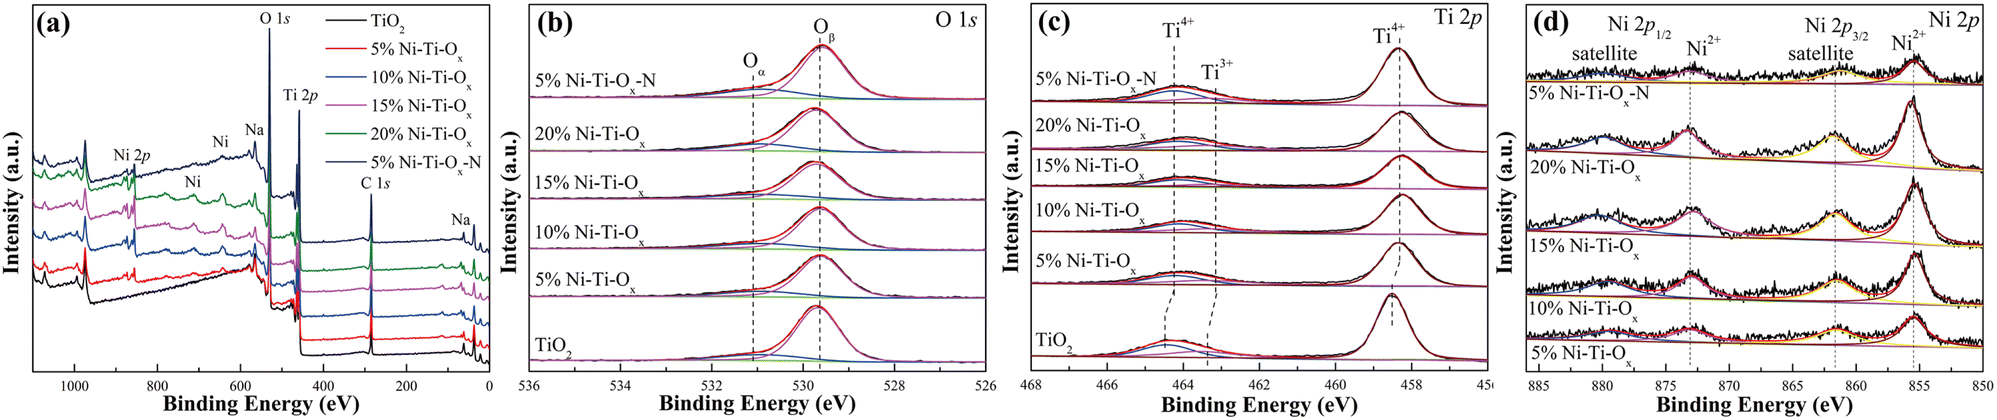
Fig. 3 and Table 2 showed the XPS results of TiO2 and Ni–Ti–Ox catalysts. As shown in Fig. 3(a), there were not only peaks of O 1s and Ti 2p, but also peaks of Na in all samples, which may be due to impurities in tetrabutyl titanate or P123. In addition, the peak intensity of Ni 2p gradually increased with the increase of NiO content. According to Fig. 3(b), O 1s could be divided into two peaks of 531 eV and 529.5 eV, corresponding to chemisorbed oxygen (Oα) and the lattice oxygen (Oβ), respectively.48,49 According to the literature, chemisorbed oxygen was the most active oxygen in the catalytic reaction, so the increase of its concentration was conducive to the catalytic reaction.48,50 It could be found that the proportion of chemisorbed oxygen on the catalyst surface increased from 0.154 to 0.214 with the increase of NiO content. In other words, the incorporation of NiO could effectively promoted the increase of chemisorbed oxygen concentration, thus accelerating the reaction. This was consistent with the hydrogen consumption in H2-TPR results.
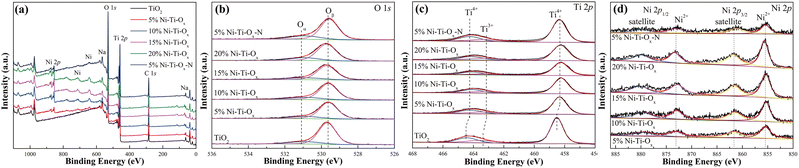 |
| | Fig. 3 (a) Survey, (b) O 1s, (c) Ti 2p and (d) Ni 2p XPS high-resolution scans spectra of different catalysts. | |
Table 2 Atomic distribution of different catalysts
| Sample |
Ti3+/(Ti3+ + Ti4+) |
Oα/(Oα + Oβ) |
| TiO2 |
0.193 |
0.154 |
| 5% Ni–Ti–Ox |
0.181 |
0.175 |
| 10% Ni–Ti–Ox |
0.177 |
0.192 |
| 15% Ni–Ti–Ox |
0.175 |
0.204 |
| 20% Ni–Ti–Ox |
0.192 |
0.214 |
| 5% Ni–Ti–Ox–N |
0.185 |
0.198 |
Fig. 3(c) showed Ti 2p peaks of TiO2 and Ni–Ti–Ox catalysts. It could be seen that the Ti 2p peak of pure TiO2 was divided into three peaks at 464.4 eV, 463.5 eV and 458.5 eV, corresponding to Ti4+ and Ti3+.51 When NiO was doped, the Ti 2p peaks of all catalysts migrated to the low electron binding energies. It indicated that the formation of NiTiO3 changed the chemical environment around TiO2. In addition, the decrease of Ti 2p peak intensity after NiO doping was mainly due to the decrease of the relative content of TiO2 in the catalyst. Finally, it was seen from Table 2 that the concentration of Ti3+ ions gradually decreased with the incorporation of NiO. This may be due to the reaction of some Ti3+ ions with NiO to form NiTiO3, which converted to Ti4+ ions. Fig. 3(d) showed the Ni 2p spectra of TiO2 and Ni–Ti–Ox catalysts. Ni 2p was divided into satellite (879.5 eV and 861.5 eV) and Ni2+ (872.9 eV and 855.4 eV).52 Furthermore, the intensity of Ni 2p peak gradually increased due to the gradual increase of NiO content in the catalyst. Finally, only one valence state of Ni2+ was found in the catalysts. Combined with XRD and other data, NiTiO3 was indeed formed in the catalysts.
3.4 Catalytic performance
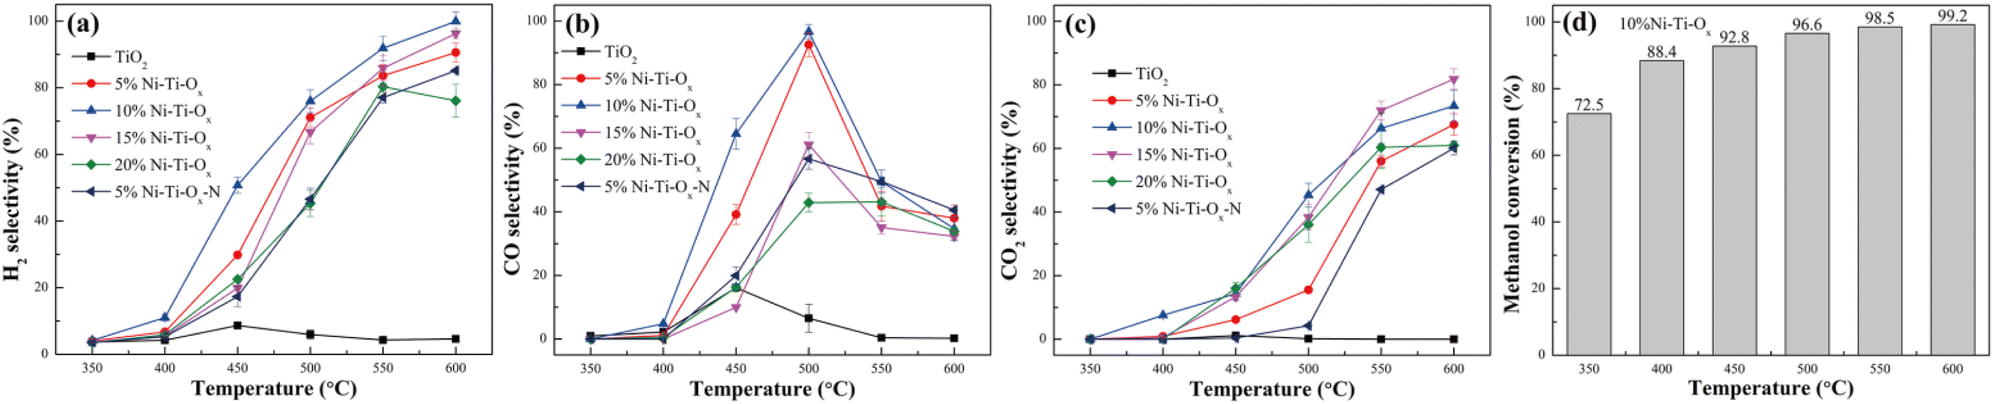
Fig. 4 and S7† showed the selectivity and conversion of TiO2 and Ni–Ti–Ox catalysts. It was seen from Fig. 4(a) that pure TiO2 reached the hydrogen selectivity of only 8.6% at 450 °C. This was mainly because pure TiO2 had the lowest redox performance, hydrogen consumption, surface acid quantity and surface basic quantity among the six groups of catalysts, and TiO2 did not have the same C–O and C–C bond breaking ability as NiO. With the gradual increase of NiO content, the hydrogen selectivity of Ni–Ti–Ox catalyst showed a parabolic trend of first increase and then decrease. Meanwhile, 10% Ni–Ti–Ox catalyst had the highest hydrogen selectivity, and its hydrogen selectivity was higher than 90% in the range of 550–600 °C. The T50 temperature (the temperature at which the hydrogen selectivity reached 50%) was also the lowest, which was 450 °C. Combined with the above characterization results, it could be seen that the redox performance and hydrogen consumption were the two most important parameters for the hydrogen production performance of methanol steam reforming. Finally, comparing the hydrogen selectivity of 5% Ni–Ti–Ox and 5% Ni–Ti–Ox–N catalysts, it was found that 5% Ni–Ti–Ox catalyst had lower acid strength and alkali strength, so its hydrogen selectivity was higher. This indicated that the acidity and alkalinity of the catalyst surface were also important parameters affecting the performance of methanol steam reforming for hydrogen production.
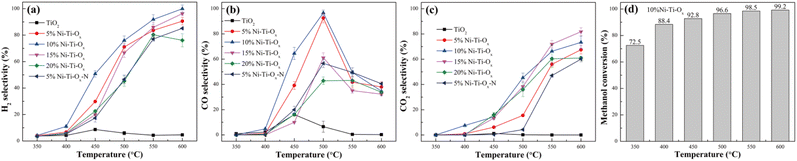 |
| | Fig. 4 (a) H2 selectivity, (b) CO selectivity and (c) CO2 selectivity of different catalysts; (d) methanol conversion of 10% Ni–Ti–Ox catalyst. | |
Fig. 4(b) and (c) showed CO selectivity and CO2 selectivity of TiO2 and Ni–Ti–Ox catalysts, respectively. Similar to the results of hydrogen selectivity, 10% Ni–Ti–Ox catalyst had the highest CO selectivity (92.6%) at 500 °C, while the highest CO selectivity of pure TiO2 was only 16.1% at 450 °C. In addition, the CO selectivity of the six groups of catalysts reached the highest at about 450 °C or 500 °C, and then decreased with the increase of temperature. Correspondingly, except that the CO2 selectivity of TiO2 was always lower than 1.1%, that of the other five groups of Ni–Ti–Ox catalysts increased slowly with the increase of temperature before 450 °C or 500 °C, but increased sharply in the temperature range of 450–600 °C or 500–600 °C. It was speculated that the methanol steam reforming reaction was dominated by CH3OH → H2 + CO below 500 °C and CH3OH + H2O → H2 + CO at 500–600 °C.
Fig. S7† showed the CH4 selectivity of TiO2 and Ni–Ti–Ox catalysts. It was found that CH4 selectivity of TiO2 and 20% Ni–Ti–Ox catalysts was relatively high, reaching 32.2% at 450 °C and 37.7% at 500 °C, respectively. Correspondingly, the CH4 selectivity of the optimal catalyst 10% Ni–Ti–Ox was lower than 12.1% in the whole test temperature range of 350–600 °C. Combined with the results of H2, CO and CO2 selectivity, it was speculated that there were many side reactions for pure TiO2 or Ni–Ti–Ox catalysts with excessive NiO doping. Accordingly, the optimal catalyst 10% Ni–Ti–Ox had less side reaction. Finally, it was seen from Fig. 4(d) that the methanol conversion of 10% Ni–Ti–Ox catalyst reached 88.4% at 400 °C, and that was higher than 92% at 450–600 °C. As shown in Table 3, the catalytic performance of 10% Ni–Ti–Ox was compared with that of other catalysts from the literature. It was verified that NiO/MoO3 had some degree of advantages from the aspects of initiation temperature (the temperature at which the H2 selectivity was higher than 50%), highest hydrogen selectivity. However, the initiation temperature was relatively high and needed to be optimized for subsequent experiments.
Table 3 The comparison with the catalytic performance of reported catalysts
| Catalyst |
Initiation temperature (°C) |
Highest H2 selectivity (%) |
Ref. |
| 10% Ni–Ti–Ox |
450 |
99.9 |
This work |
| 8Ni/TCW |
400 |
99.4 |
37 |
| Cu/ZnO/Al2O3 |
— |
89.0 |
53 |
| 10La–10Ni/Al2O3 |
200 |
85.0 |
54 |
| Cu–Ni/TiO2/monolith |
300 |
85.8 |
55 |
| TiO2–P25 |
400 |
40.0 |
56 |
| TiO2–X |
400 |
70.0 |
57 |
| Pd/TiO2 |
250 |
65.0 |
58 |
3.5 In situ DRIFTS study
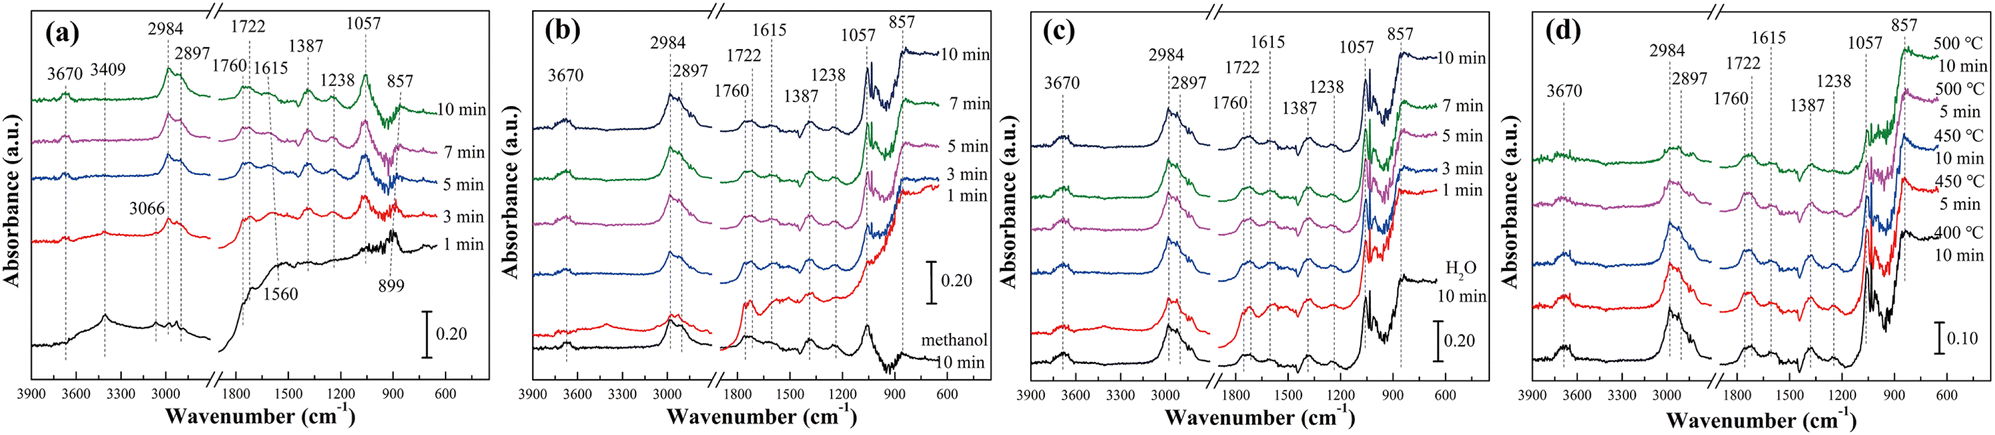
Fig. 5 and S8† showed the in situ diffuse reflectance infrared spectra of methanol adsorption and methanol–H2O reaction of pure TiO2 at different temperatures. It was seen from Fig. 5(a) that with the extension of methanol adsorption time, the main peaks represented hydroxyl group (3670 cm−1), methoxy species (CH3O*, 2984, 2897 and 1057 cm−1), gaseous formaldehyde (1760–1722 cm−1), formic acid species (HCOOad, 1615 and 1387 cm−1) and the ν(OH) of molecular-adsorbed ethanol (1238 cm−1), respectively. The emergence of methoxy species, formaldehyde species and formic acid species indicated that the path of methanol reforming to hydrogen production was similar to that of our previous study.14 In other words, methanol was adsorbed on the surface of the catalyst to form adsorbed methanol, and then dehydrogenation to form formaldehyde species. Formaldehyde species reacted with hydroxyl groups on the surface of the catalyst and adsorbed water molecules. Finally, hydrogen, carbon monoxide and carbon dioxide were generated. However, the presence of molecular-adsorbed ethanol indicated that the methoxy species of pure TiO2 also reacted with adsorbed methanol during the reaction, resulting in by-products. This was also why the H2 selectivity and CO2 selectivity of pure TiO2 were low, but the CO selectivity and CH4 selectivity were high.
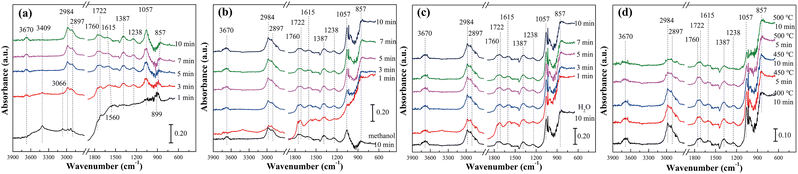 |
| | Fig. 5 In situ DRIFT spectra of TiO2 catalyst at different temperatures: (a) methanol adsorption at 400 °C, (b) H2O adsorption at 400 °C, (c) methanol reacted with H2O at 400 °C and (d) methanol reacted with H2O at different temperatures. | |
As shown in Fig. 5(b) and (c), after the adsorption of methanol for 10 min, the in situ infrared spectra did not change significantly whether the water vapor was introduced or both water vapor and methanol were introduced. Only the peak intensity representing methoxy species was slightly enhanced. This was mainly because the H2 selectivity, CO selectivity, CO2 selectivity and CH4 selectivity were at a very low level at 400 °C. The peaks of all intermediate species decreased significantly when the reaction temperature increased to 450 °C and 500 °C (Fig. 5(d) and S8†). It indicated that methoxy species, formaldehyde, formic acid species and molecular-adsorbed ethanol were involved in the reaction. According to the peak intensity and its variation, it was speculated that methoxy species and formic acid species were the main intermediate species of methanol steam reforming reaction over the TiO2 catalyst. Meanwhile, the hydroxyl group on the catalyst surface was gradually consumed again, indicating that the hydroxyl group was also an important intermediate of the reaction (Table 4).
Table 4 Details of the bands and corresponding species
| Band (cm−1) |
Species |
Ref. |
| 3715–3670 |
Hydroxyl group |
59 |
| 2984–2820, 1057 |
Methoxy species (CH3O*) |
60 |
| 1760–1722 |
Gaseous formaldehyde |
61 |
| 1703 |
v(CO) in HCOOHad |
62 |
| 1615–1353 |
vas(COO) in HCOOad |
63 |
| 1238 |
The ν(OH) of molecular-adsorbed ethanol |
64 |
In order to compare the reaction mechanism of pure TiO2 and Ni–Ti–Ox catalysts, 10% Ni–Ti–Ox catalyst was selected for in situ infrared characterization. The results were shown in Fig. 6 and S9.† According to Fig. 6(a), after methanol adsorption for 10 min, methoxy species (2919 and 2820 cm−1), formic acid species (1580 and 1467 cm−1), and formic acid adsorption species (HCOOHad, 1703 cm−1) that formed hydrogen bonds with hydroxyl groups on the surface of 10% Ni–Ti–Ox catalyst appeared. Compared with the results of pure TiO2, gaseous formaldehyde and molecular-adsorbed ethanol did not appear in the spectrum of 10% Ni–Ti–Ox catalyst, which was mainly because 10% Ni–Ti–Ox had better redox performance and higher selectivity.
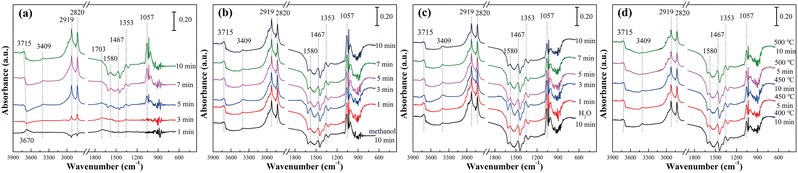 |
| | Fig. 6 In situ DRIFT spectra of 10% Ni–Ti–Ox catalyst at different temperatures: (a) methanol adsorption at 400 °C, (b) H2O adsorption at 400 °C, (c) methanol reacted with H2O at 400 °C and (d) methanol reacted with H2O at different temperatures. | |
Similar to the results of pure TiO2, the spectrum of 10% Ni–Ti–Ox did not change significantly after methanol was added for 10 min and water vapor was added (Fig. 6(b)). When water vapor and methanol were simultaneously introduced, the peak intensity of hydroxyl group, methoxy species and formic acid species gradually decreased with time (Fig. 6(c)). It could be speculated that these three intermediates were involved in the steam reforming reaction for hydrogen production. From Fig. 6(d) and S9,† the peak intensity of hydroxyl group, methoxy species and formic acid species gradually continued to decrease. Based on the results of in situ infrared diffuse reflection characterization and catalytic activity, it could be found that there were two main reaction pathways for methanol steam reforming on the surface of 10% Ni–Ti–Ox catalyst (Fig. 7): (1) methanol was decomposed into methoxy intermediates and hydrogen was generated, and then methoxy continued to decompose; (2) methanol was oxidized to formic acid species, and then reacted with the surface hydroxyl group of the catalyst to generate CO2 and hydrogen, in which water vapor mainly supplemented the surface hydroxyl of the catalyst. Therefore, it was speculated that the methanol steam reforming reaction followed both L–H and E–R mechanisms.
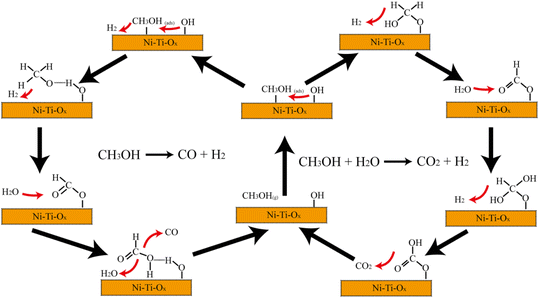 |
| | Fig. 7 Reaction mechanism diagram of Ni–Ti–Ox catalyst. | |
3.6 Adsorption energy calculation
This work simulated the adsorption behaviors that CH3OH on the surface of anatase TiO2, rutile TiO2 and NiTiO3 using the tool of Vienna Ab initio Simulation Package (VASP). According to XRD and TEM results, TiO2 in Ni–Ti–Ox catalyst could be divided into anatase TiO2 and rutile TiO2, and the main exposed crystal planes of anatase TiO2 and rutile TiO2 were (101) and (110), respectively. From Fig. 8(a)–(c) and S10(a)–(c),† the (101) crystal plane of anatase TiO2 was cut and optimized. In order to compare the effect of the position of the methanol molecule on the adsorption energy, two methanol adsorption models (site 1 and site 2) were simulated. Correspondingly, two adsorption models of methanol molecules on the (110) crystal plane of rutile TiO2 were optimized (Fig. 8(d)–(f) and S10(d)–(f)†). Comparing the adsorption energy of methanol molecules of the two TiO2 (Table 5), it could be found that rutile TiO2 may be easier to adsorb methanol molecules. That was to say, the presence of rutile TiO2 in the Ni–Ti–Ox catalyst was beneficial to the adsorption and activation of methanol molecules.
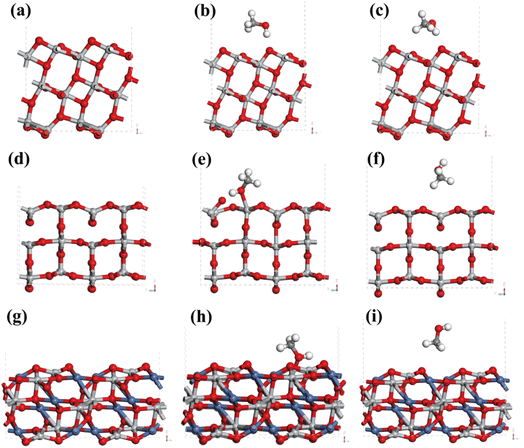 |
| | Fig. 8 (a) The (101) facet of anatase TiO2, (b) the first CH3OH adsorption model (site 1) on the (101) facet of anatase TiO2, (c) the second CH3OH adsorption model (site 2) on the (101) facet of anatase TiO2; (d) the (110) facet of rutile TiO2, (e) the first CH3OH adsorption model (site 1) on the (110) facet of rutile TiO2, (f) the second CH3OH adsorption model (site 2) on the (110) facet of rutile TiO2; (g) the (104) facet of NiTiO3, (h) the first CH3OH adsorption model (site 1) on the (104) facet of NiTiO3, (i) the second CH3OH adsorption model (site 2) on the (104) facet of NiTiO3. | |
Table 5 The adsorption energy of CH3OH on different catalysts
| Sample |
Site 1 |
Site 2 |
| Adsorption energy (eV) |
Adsorption energy (eV) |
| Anatase TiO2 |
−0.165 |
−0.229 |
| Rutile TiO2 |
−0.681 |
−0.230 |
| NiTiO3 |
−1.106 |
−0.038 |
The active component NiO in the Ni–Ti–Ox catalyst mainly existed in the form of NiTiO3, and its main exposed crystal plane was (104). Therefore, Fig. 8(h), (i), S10(h) and (i)† mainly showed two adsorption models of methanol molecules on its (104) crystal face. It was found that the adsorption energy of NiTiO3 for methanol molecules was significantly higher than that of TiO2. Combined with the results of H2-TPR, CO2-TPD and XPS, it could be found that the formation of NiTiO3 was more conducive to the adsorption and activation of methanol molecules. This was one of the reasons why the Ni–Ti–Ox catalyst exhibited excellent methanol steam reforming hydrogen production performance.
4. Conclusions
In this work, Ni–Ti–Ox nanocatalysts with hierarchical porous structure were prepared and the catalytic performance for methanol steam reforming was investigated. It was found that NiO in the Ni–Ti–Ox catalyst existed in the form of NiTiO3, and both anatase TiO2 and rutile TiO2 existed in the carrier. Therefore, it exhibited excellent redox properties, high concentration of chemisorbed oxygen, rich basic sites and acidic sites. The optimal catalyst 10%Ni–Ti–Ox had H2 selectivity higher than 90% and methanol conversion higher than 95% at 550–600 °C. Furthermore, the reaction path of methanol steam reforming of Ni–Ti–Ox was studied by in situ infrared diffuse reflectance spectroscopy. Hydroxyl group, methoxy species and formic acid species were the main intermediates. Finally, the formation of NiTiO3 enhanced the adsorption energy of methanol molecules on the surface of Ni–Ti–Ox catalyst, which promoted the adsorption and activation of methanol molecules.
Author contributions
Qijie Jin: data curation, formal analysis, roles/writing-original draft, funding acquisition. Xuelu Meng: roles/writing-original draft, formal analysis. Peng Wu: computer simulation. Yunhe Li: data curation, formal analysis. Mutao Xu: data curation, formal analysis. Ranran Zhou: methodology, investigation. Mengfei Yang: methodology, formal analysis. Haitao Xu: supervision, validation, funding acquisition, project administration.
Conflicts of interest
There are no conflicts to declare.
Acknowledgements
We would like to acknowledge the financial support from the Natural Science Foundation of Jiangsu Province (BK20220365), National Key Research and Development Program of China (2021YFB3500600, 2021YFB3500605), Industry-University-Research Cooperation Project of Jiangsu Province (BY2022514), Natural Science Foundation of the Jiangsu Higher Education Institutions of China (22KJB610002), Key R&D Program of Jiangsu Province (BE2022142), Jiangsu International Cooperation Project (BZ2021018), Jiangsu Funding Program for Excellent Postdoctoral Talent (2022ZB375), Science and Technology Plan of Yangzhou (YZ2022030), Nanjing Science and Technology Top Experts Gathering Plan and the Priority Academic Program Development of Jiangsu Higher Education Institutions (PAPD). The computational resources generously provided by the High Performance Computing Center of Nanjing Tech University were greatly appreciated. Qijie Jin also thanks Hong Zhou from the School of Materials Science and Engineering, Nanjing Tech University, for helping to characterize the catalyst activity.
Notes and references
- M. G. Schultz, T. Diehl, G. P. Brasseur and W. Zittel, Science, 2003, 302, 624–627 CrossRef CAS PubMed
 .
. - V. G. Sharmila, K. Tamilarasan, M. D. Kumar, G. Kumar, S. Varjani, S. A. Kumar and J. R. Banu, Int. J. Hydrog. Energy, 2022, 47, 15309–15332 CrossRef .
- A. Kumar, P. Daw and D. Milstein, Chem. Rev., 2022, 122, 385–441 CrossRef CAS PubMed .
- H. Wang, L. Wang, D. Lin, X. Feng, X. F. Chu, L. N. Li and F. S. Xiao, Catal. Today, 2021, 382, 42–47 CrossRef CAS .
- H. Y. Lian, J. L. Liu, X. S. Li, X. B. Zhu, A. Z. Weber and A. M. Zhu, Chem. Eng. J., 2019, 369, 245–252 CrossRef CAS .
- Y. C. Wang, Q. Wu, D. Q. Mei and Y. D. Wang, Int. J. Hydrog. Energy, 2020, 45, 25317–25327 CrossRef CAS .
- A. C. Avci and E. Toklu, Int. J. Hydrog. Energy, 2022, 47, 6986–6995 CrossRef .
- M. Q. Chen, G. W. Sun, Y. S. Wang, D. F. Liang, C. Li, J. Wang and Q. Liu, Fuel, 2022, 314, 122733 CrossRef CAS .
- Y. Q. Xu, B. W. Lu, C. Luo, J. Chen, Z. W. Zhang and L. Q. Zhang, Chem. Eng. J., 2021, 406, 126903 CrossRef CAS .
- I. V. Yentekakis, P. Panagiotopoulou and G. Artemakis, Appl. Catal., B, 2021, 296, 120210 CrossRef CAS .
- M. Bianchini, N. Alayo, L. Soler, M. Salleras, L. Fonseca, J. Llorca and A. Tarancon, J. Power Sources, 2021, 506, 230241 CrossRef CAS .
- A. Al-Qahtani, B. Parkinson, K. Hellgardt, N. Shah and G. Guillen-Gosalbez, Appl. Energy, 2021, 281, 115958 CrossRef CAS .
- K. H. Han, W. S. Yu, L. L. Xu, Z. Y. Deng, H. Yu and F. G. Wang, Fuel, 2021, 291, 120182 CrossRef CAS .
- Q. J. Jin, Y. S. Shen, Y. Cai, L. Chu and Y. W. Zeng, J. Hazard. Mater., 2020, 381, 120934 CrossRef CAS PubMed .
- L. L. Lin, W. Zhou, R. Gao, S. Y. Yao, X. Zhang, W. Q. Xu, S. J. Zheng, Z. Jiang, Q. L. Yu, Y. W. Li, C. Shi, X. D. Wen and D. Ma, Nature, 2017, 544, 80 CrossRef CAS PubMed .
- S. Alayoglu, A. U. Nilekar, M. Mavrikakis and B. Eichhorn, Nat. Mater., 2008, 7, 333–338 CrossRef CAS PubMed .
- K. Ghasemzadeh, E. Andalib and A. Basile, Int. J. Hydrog. Energy, 2016, 41, 8745–8754 CrossRef CAS .
- J. Saavedra, T. Whittaker, Z. Chen, C. J. Pursell, R. M. Rioux and B. D. Chandler, Nat. Chem., 2016, 8, 585–590 CrossRef PubMed .
- T. Abbas and M. Tahir, Int. J. Hydrog. Energy, 2021, 46, 8932–8949 CrossRef CAS .
- C. Wu, Z. R. Xiao, L. Wang, G. Z. Li, X. W. Zhang and L. C. Wang, Catal. Sci. Technol., 2021, 11, 1965–1973 RSC .
- S. S. Zhu, Y. Z. Wang, J. C. Lu, H. H. Lu, S. F. He, D. Song, Y. M. Luo and J. P. Liu, Nanomaterials, 2021, 11, 3149 CrossRef CAS PubMed .
- X. L. Liu, C. Bao, Z. H. Zhu, H. B. Zheng, C. Song and Q. Xu, Int. J. Hydrog. Energy, 2021, 46, 26741–26756 CrossRef CAS .
- K. Gao, O. A. Sahraei and M. C. Iliuta, Appl. Catal., B, 2021, 291, 119958 CrossRef CAS .
- K. S. Baamran and M. Tahir, J. Clean. Prod., 2021, 311, 127519 CrossRef CAS .
- T. T. Xu, C. Jiang, X. Wang and B. Xiao, Energy Convers. Manage., 2021, 244, 114512 CrossRef CAS .
- J. Xiong, X. L. Mei, J. Liu, Y. C. Wei, Z. Zhao, Z. A. Xie and J. M. Li, Appl. Catal., B, 2019, 251, 247–260 CrossRef CAS .
- X. L. Wang, P. Du, Z. Zhao, J. L. Mei, Z. T. Chen, Y. Y. Li, P. Zheng, J. Y. Fan, A. J. Duan and C. M. Xu, Energy Fuels, 2018, 32, 7800–7809 CrossRef CAS .
- T. Wang, L. Chang, H. Wu, W. H. Yang, J. R. Cao, H. Fan, J. Q. Wang, H. T. Liu, Y. H. Hou, Y. C. Jiang and H. Zhu, J. Colloid Interface Sci., 2022, 612, 434–444 CrossRef CAS PubMed .
- Z. W. Xue, Y. S. Shen, L. Chu, Y. Wang, Y. Zhang, Z. F. Sun, J. H. Wang, Y. W. Zeng, P. W. Li and S. M. Zhu, J. Mater. Chem. A, 2019, 7, 1700–1710 RSC .
- Z. W. Xue, Y. S. Shen, P. W. Li, Y. Zhang, J. J. Li, B. Qin, J. Zhang, Y. W. Zeng and S. M. Zhu, Small, 2018, 14, 1800927 CrossRef PubMed .
- C. T. Zhang, X. L. Qin, Z. W. Xue, X. B. Wang, Y. S. Shen, J. W. Zhu, Y. N. Wu, B. Meng, X. X. Meng and N. T. Yang, Chem. Eng. J., 2022, 433, 134600 CrossRef CAS .
- Q. Guo, C. Y. Zhou, Z. B. Ma and X. M. Yang, Adv. Mater., 2019, 31, 1901997 CrossRef CAS PubMed .
- Y. G. Wang, Y. Yoon, V. A. Glezakou, J. Li and R. Rousseau, J. Am. Chem. Soc., 2013, 135, 10673–10683 Search PubMed .
- J. C. Liu, Y. G. Wang and J. Li, J. Am. Chem. Soc., 2017, 139, 6190–6199 CrossRef CAS PubMed .
- A. Wang, S. J. Wu, J. L. Dong, R. X. Wang, J. W. Wang, J. L. Zhang, S. X. Zhong and S. Bai, Chem. Eng. J., 2021, 404, 127145 CrossRef CAS .
- C. C. Ni, Y. F. Li, X. Z. Meng, S. L. Liu, S. Y. Luo, J. Guan and B. Jiang, Chem. Eng. J., 2021, 411, 128485 CrossRef CAS .
- Q. J. Jin, Y. S. Shen, L. Chu, M. M. Chen, Y. Cai and Y. W. Zeng, Composites, Part B, 2019, 178, 107483 CrossRef CAS .
- Q. J. Jin, A. D. Wang, B. X. Lu, X. Xu, Y. S. Shen and Y. W. Zeng, Catal. Sci. Technol., 2020, 10, 4436–4447 RSC .
- Q. J. Jin, M. M. Chen, X. J. Tao, B. X. Lu, J. Y. Shen, Y. S. Shen and Y. W. Zeng, Appl. Surf. Sci., 2020, 512, 145757 CrossRef CAS .
- L. Na, S. L. Ding, Y. M. Cui, N. H. Xue, L. M. Peng, X. F. Guo and W. P. Ding, Chem. Eng. Res. Des., 2013, 91, 573–580 CrossRef .
- D. C. Baertsch, T. K. Komala, Y. H. Chua and E. Iglesia, J. Catal., 2002, 205, 44–57 CrossRef .
- Y. S. Shen, Y. H. Zong, Y. F. Ma, S. M. Zhu and Q. J. Jin, Fuel, 2016, 180, 727–736 CrossRef CAS .
- S. Tada, T. Shimizu, H. Kameyama, T. Haneda and R. Kikuchi, Int. J. Hydrog. Energy, 2012, 37, 5527–5531 CrossRef CAS .
- A. S. Al-Fatesh, Y. Arafat, S. O. Kasim, A. A. Ibrahim, A. E. Abasaeed and A. H. Fakeeha, Appl. Catal., B, 2021, 280, 119445 CrossRef CAS .
- H. F. Chen, Y. Xia, R. Y. Fang, H. Huang, Y. P. Gan, C. Liang, J. Zhang, W. K. Zhang and X. S. Liu, Appl. Surf. Sci., 2018, 459, 639–646 CrossRef CAS .
- S. Besselmann, C. Freitag, O. Hinrichsen and M. Muhler, Phys. Chem. Chem. Phys., 2001, 3, 4633–4638 RSC .
- Z. L. Chen, Y. Jian, J. H. Yan, F. Dong and B. F. Yin, Chem. Eng. Sci., 2022, 262, 118006 CrossRef CAS .
- M. Kang, E. D. Park, J. M. Kim and J. E. Yie, Appl. Catal., A, 2007, 327, 261–269 CrossRef CAS .
- Q. L. Zhang, X. Liu, P. Ning, Z. X. Song, H. Li and J. J. Gu, Catal. Sci. Technol., 2015, 5, 2260–2269 RSC .
- Z. B. Wu, R. B. Jin, H. Q. Wang and Y. Liu, Catal. Commun., 2009, 10, 935–939 CrossRef CAS .
- Y. Liu, P. F. Fang, Y. L. Cheng, Y. P. Gao, F. T. Chen, Z. Liu and Y. Q. Dai, Chem. Eng. J., 2013, 219, 478–485 CrossRef CAS .
- Y. K. Zhang, Z. L. Jin, H. Yuan, G. R. Wang and B. Z. Ma, Appl. Surf. Sci., 2018, 462, 213–225 CrossRef CAS .
- M. Khzouz, J. Wood, B. Pollet and W. Bujalski, Int. J. Hydrog. Energy, 2013, 38, 1664–1675 CrossRef CAS .
- J. C. Lu, X. F. Li, S. F. He, C. Y. Han, G. P. Wan, Y. Q. Lei, R. Chen, P. Liu, K. Z. Chen, L. Zhang and Y. M. Luo, Int. J. Hydrog. Energy, 2017, 42, 3647–3657 CrossRef CAS .
- P. Tahay, Y. Khani, M. Jabari, F. Bahadoran and N. Safari, Appl. Catal., A, 2018, 554, 44–53 CrossRef CAS .
- S. Eaimsumang, P. Prataksanon, S. Pongstabodee and A. Luengnaruemitchai, Res. Chem. Intermed., 2020, 46, 1235–1254 CrossRef CAS .
- J. Chutirat, S. Eaimsumang and A. Luengnaruemitchai, Adv. Powder Technol., 2020, 31, 4731–4742 CrossRef CAS .
- R. Perez-Hernandez, A. D. Avendano, E. Rubio and V. Rodriguez-Lugo, Top. Catal., 2011, 54, 572–578 CrossRef CAS .
- M. L. Ang, J. T. Miller, Y. Cui, L. Mo and S. Kawi, Catal. Sci. Technol., 2016, 6, 3394–3409 RSC .
- C. Herrera, M. Cortés-Reyes, M. Á. Larrubia, M. V. Domínguez-Barroso, M. R. Díaz-Rey and L. J. Alemany, Appl. Catal., A, 2019, 582, 117088 CrossRef CAS .
- X. Y. Li, L. Li, J. Lin, B. T. Qiao, X. F. Yang, A. Q. Wang and X. D. Wang, J. Phys. Chem. C, 2018, 122, 12395–12403 CrossRef CAS .
- S. Y. Huang, X. F. Zhu, B. Cheng, J. G. Yu and C. J. Jiang, Environ. Sci.: Nano, 2017, 4, 2215–2224 RSC .
- Y. Y. Wang, C. J. Jiang, Y. Le, B. Cheng and J. G. Yu, Chem. Eng. J., 2019, 365, 378–388 CrossRef CAS .
- C. Choong, Z. Y. Zhong, L. Huang, A. Borgna, L. Hong, L. W. Chen and J. Y. Lin, ACS Catal., 2014, 4, 2359–2363 CrossRef CAS .
|
| This journal is © The Royal Society of Chemistry 2023 |
Click here to see how this site uses Cookies. View our privacy policy here. 
 Open Access Article
 This Open Access Article is licensed under a Creative Commons Attribution-Non Commercial 3.0 Unported Licence
 *ad
*ad