 Open Access Article
Multifunctional optical thermometry using dual-mode green emission of CaZrO3:Er/Yb/Mo perovskite phosphors
Hoang Tuan Nama,
Phuong Dinh Tama,
Nguyen Van Haib and
Hoang Nhu Van *a
*a
aFaculty of Materials Science and Engineering, Phenikaa University, Yen Nghia, Ha-Dong District, Hanoi 12116, Vietnam. E-mail: van.hoangnhu@phenikaa-uni.edu.vn
bFaculty of Chemistry, Hanoi National University of Education, 136 Xuan Thuy Road, Cau Giay District, Hanoi, Vietnam
First published on 15th May 2023
Abstract
The weak emission intensity of rare-earth element-doped dual-mode materials leads to low-sensor sensitivity, which is a challenge in optical sensor applications. The present work achieved high-sensor sensitivity and high green color purity based on the intense green dual-mode emission of Er/Yb/Mo-doped CaZrO3 perovskite phosphors. Their structure, morphology, luminescent properties, and optical temperature sensing properties have been investigated in detail. Phosphor shows a uniform cubic morphology with an average size of approximately 1 μm. Rietveld refinement confirms the formation of single-phase orthorhombic CaZrO3. Under the excitation of 975 and 379 nm, the phosphor emits pure green up and down-conversion (UC and DC) emission at 525/546 nm corresponding to 2H11/2/4S3/2–4I15/2 transitions of Er3+ ions, respectively. Intense green UC emissions were achieved because of energy transfer (ET) from the high-energy excited state of Yb3+–MoO42− dimer to the 4F7/2 level of Er3+ ion. Furthermore, the decay kinetics of all obtained phosphors confirmed ET efficiency from Yb3+–MoO42− dimer to Er3+ ions, leading to strong green DC emission. Moreover, the DC of the obtained phosphor shows that a sensor sensitivity value of 0.697% K−1 at 303 K is higher than the UC (0.667% K−1 at 313 K) because the thermal effect generated by the DC excitation source light is ignored compared with UC luminescence. CaZrO3:Er–Yb–Mo phosphor shows intense green dual-mode emission with high green color purity, 96.50% of DC and 98% of UC emissions, and high sensitivity, making it suitable for optoelectronic devices and thermal sensor applications.
1. Introduction
Temperature is an essential physical parameter in science and daily life; thus, the accurate measurement of temperature is critical.1,2 However, conventional contact temperature measurement using liquid-filled glass thermometers and thermocouples has many disadvantages, such as low sensitivity, limitation in response time, and inability to measure under harsh conditions (such as high temperature, strong acids, and strong magnetic fields).3,4 Thus, the temperature sensor application of this method is hindered.3 At present, non-contact temperature measurement methods via optical temperature sensors based on temperature-dependent up and down-conversion (UC and DC) emission intensity are widely used because they could overcome the limitations of conventional contact temperature measurement.5,6 Accordingly, several parameters of rare-earth (RE) element-doped phosphors, such as emission intensity, lifetime, and peak shift, depend on temperature,7 which is used for determining temperature sensing sensitivity.7,8 Notably, the fluorescence intensity ratio (FIR) based on the emission spectra of the phosphor is widely used to estimate the sensor characteristics of phosphors. This technique is performed by observing the changing intensity emission of two thermally coupled levels of RE ions with an energy gap from 200 to 2000 cm−1.8 The FIR is independent of an activator, spectrum losses, and fluctuation in excitation intensity.9 Therefore, this method has good measurement accuracy, high resolution, and broad range, and it requires low excitation power, leading to high reliability.9,10 However, previous literature reports only explore the sensor sensitivity of a single UC or DC material instead of both. In addition, DC emission shows that a thermal effect generated by the excitation light could be ignored, resulting in high sensor sensitivity.6 Therefore, investigating the sensor sensitivity based on UC and DC emissions is necessary to extend the application of phosphors.Er3+ ion is a widely used activator for UC/DC luminescent materials. It has an energy gap between 2H11/2 and 4S3/2 levels of approximately 800 cm−1,11 indicating that it is suitable as a luminescent center for phosphor-temperature sensor using the FIR.11,12 However, due to small absorption cross-section in the near-infrared band led to its low emission intensity.13 Previous works showed that weak UC emission intensity of phosphors results in low sensor sensitivity, which could not be suitable for temperature sensor applications.13,14 Recently, researchers have achieved good temperature sensing properties based on a selective enhancement of green UC emission using a sensitizer pair as Yb3+-transition metal (TM) to activate Er3+.15,16 Energy transfer at a high-energy excitation state of the Yb3+-TM ion pairs to the 4F7/2 level of Er3+ could reduce non-radiative transition and improve UC efficiency and sensor sensitivity. B. Dong et al. have reported that high-temperature sensor sensitivity was achieved by using Yb3+–MoO42− dimer sensitizer to activate Er3+ on Yb3Al5O12 (ref. 17) and Al2O3 (ref. 16) host lattices. Meanwhile, X. Yang et al.18 have observed an intense green UC emission of Er–Yb-doped NaY(MoO4)2 phosphor with good temperature sensing properties, thereby causing ET from Yb3+–MoO42− dimer to Er3+. Besides, the MoO42− groups (obtained by Mo6+ doped host) have a high absorption cross-section at the UV region; thus, they can strongly absorb radiation in this region and transfer energy to the RE doping ion, resulting in an improvement in the RE ion's emission efficiency.19 Furthermore, the presence of the Mo6+ ion in the host lattice leads to a decrease in the lattice symmetry and enhances stark energy splitting in the crystal field because they have a short radius and large electric charge, enabling a powerful polarization effect.19,20 Most recently, our previous works explored the super enhancement of green UC emission by using the Yb3+–MoO42− dimer sensitizer for Er3+ ion on HA/TCP (650 times)21 and HA (70 times),22 thereby achieving good temperature sensing properties in BCP host.23 Based on previous works, the strong green UC emission of phosphors can be achieved by using Er–Yb–Mo tri-doped systems, leading to the enhancement of sensing sensitivity.15,23 Furthermore, several works1,3,23,24 have observed that temperature sensitivity depends on the host lattice.
Oxides are widely used for luminescent hosts because of their excellent properties, such as low phonon energy, high thermal stability, and wide-range transparency.7 The perovskite-type oxide CaZrO3 has an orthorhombic structure with space group Pbnm, and it has received considerable attention as a host material because of its excellent physical–chemical properties.25,26 It has relatively low phonon energy, resulting in reduced non-radiative transition, thereby enhancing UC and DC efficiency. A. Khan et al.27 successfully prepared Dy3+/Eu3+/Mo6+-doped CaZrO3 for white light emission through a solid-state reaction at 1200 °C for 6 h. V. Singh et al.28 reported the intense green and red UC emission of Er–Yb-doped CaZrO3 by solution combustion. A. Maurya et al.29 investigated the effect of alkali ions on optical properties, and the temperature sensing efficiency of Er–Yb-doped CaZrO3 was prepared by a solid-state reaction. They found that the enhancement of UC emission of the systems by adding alkali ions was caused by a change in the local crystal field and an increase the crystallinity of the obtained phosphors. The RE-doped CaZrO3 host lattice was successfully prepared in previous works.30,31 However, to our knowledge, the intense green UC and DC emission of CaZrO3:Er/Yb/Mo phosphor with good optical temperature sensing properties has yet to be well documented.
Herein, CaZrO3:Er/Yb/Mo microstructure phosphors with good sensor sensitivity are synthesized via a solid-state reaction. Their structure, morphology, and optical property were investigated in detail. The optical temperature sensing was characterized using the FIR. Their characteristics were analyzed using X-ray diffraction (XRD), high-resolution scanning electron microscopy (FE-SEM), photoluminescence (PL), and FIR.
2. Experimental
1% Er, 10% Yb, and x% Mo (x = 0, 1, 3, 5, and 8% mol) co-doped CaZrO3 phosphors were prepared through a solid-state reaction. Er(NO3)3·5H2O (99.99%), Yb(NO3)3·5H2O (99.99%), (NH4)6Mo7O24 (99.9%), ZrO2 (99.9%), and CaCO3 (99.9%) were utilized as precursors. The precursors were ground using an agate mortar for 1 h and then treated at 500 °C for 5 h. Next, the powder mixture was ground again for 1 h and incubated at 900 °C for 5 h. Finally, the homogeneous powders were further calcined at 1300 °C for 5 h. All investigated samples were labeled (Table 1).| Materials | Mo6+ content (mol%) | Label |
|---|---|---|
| 1Er–10Yb doped CaZrO3 | 0 | S0 |
| 1Mo–1Er–10Yb doped CaZrO3 | 1 | S1 |
| 3Mo–1Er–10Yb doped CaZrO3 | 3 | S3 |
| 5Mo–1Er–10Yb doped CaZrO3 | 5 | S5 |
| 8Mo–1Er–10Yb doped CaZrO3 | 8 | S8 |
Their structural property was characterized using an X-ray diffractometer (Bruker D8 Advance). Their morphological property was analyzed using high-resolution scanning electron microscopy (JEM 1010, JEOL Technique, Japan). Diffuse reflectance spectra were recorded using a Varian Cary 5000 UV-vis-NIR spectrophotometer. The luminescence properties of UC and DC were recorded using a NANO LOG spectrometer (Horiba, USA) equipped with a 975 nm laser radiation source and heat controller. The Rietveld refinement structure of phosphors was obtained using FullProf software.
3. Results and discussion
3.1. XRD analysis
Fig. 1a shows the XRD pattern of all investigated samples CaZrO3:Er–Yb without and with Mo-doped. Diffraction peaks of all patterns match well with the standard card (PDF # 00-061-0228) of orthorhombic single-phase CaZrO3 with a Pbnm space group. Their intensity is sharp and strong, which indicates the high crystallinity of phosphors. Moreover, diffraction peaks intensity tends to increase with rise of Mo6+ doping content up to 3% mol, then slight decrease with higher Mo6+ content. These results confirm the presence of Mo6+ ion influency on structure and crystallinity of the host lattice. The structure of orthorhombic CaZrO3 includes CaO8 polyhedra and ZrO6 octahedra, with the following lattice parameters (Fig. 1b): a = 5.60 Å, b = 5.75 Å, and c = 8.01 Å. On the other hand, according to A. Khan et al.,27 the difference in ionic radii between doped and substituted ions with an acceptable percentage was lower than 30%. In this case, the radius percentage (Dr) between the doped ions (Er3+, Yb3+, and Mo6+) and the substituted ions (Ca2+ and Zr4+) in Ca1−x−yZr1−zO3:xEr3+, yYb3+, zMo6+ was determined using eqn (1):27,32
 | (1) |
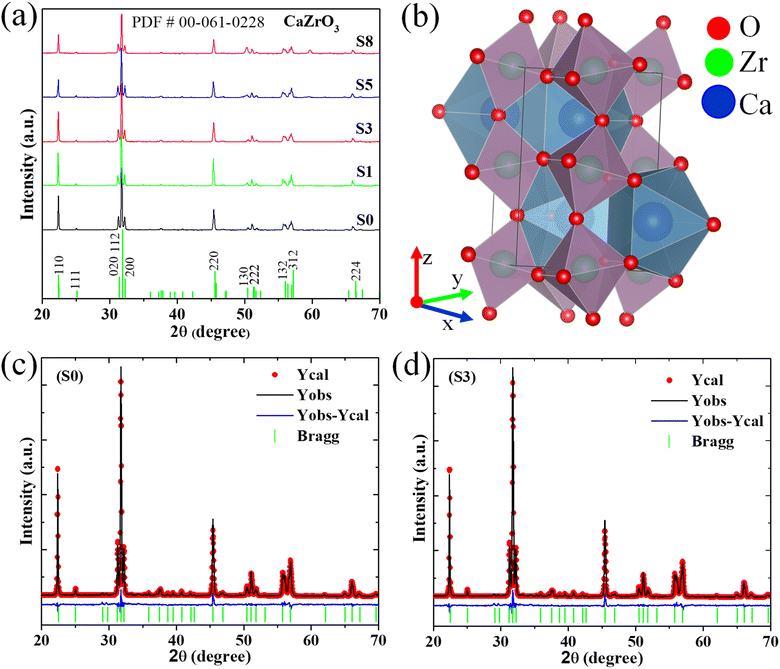 | ||
| Fig. 1 (a) XRD pattern of all investigated samples; (b) crystal structure of CaZrO3 from Rietveld refinement; (c) and (d) Rietveld refinement structure of the typical samples S0 and S3. | ||
| Parameter | CaZrO3:Er–Yb | CaZrO3:Er–Yb–Mo |
|---|---|---|
| a GOF = (Rwp/Rexp)2. | ||
| Space group | Pbnm | Pbnm |
| Symmetry | Orthorhombic | Orthorhombic |
| a, Å | 5.5948 | 5.5938 |
| b, Å | 5.7554 | 5.7556 |
| c, Å | 8.0190 | 8.0170 |
| V, Å3 | 258.2139 | 258.1129 |
| Rexp (%) | 4.65 | 4.65 |
| Rp (%) | 6.20 | 6.08 |
| Rwp (%) | 7.58 | 7.06 |
| GOF | 2.65 | 2.30 |
Furthermore, to confirm the influence of Mo6+ doped in the crystal structure of the material, the Rietveld refinement of the typical two samples (S0 and S3) was performed using the standard card PDF # 00-061-0228 as references (Fig. 1c and d). As shown in Fig. 1c and d, the experimental result is consistent with the calculated results, indicating the reliability of the refinement technique, and all refinement parameters (as atom coordinates, fraction factors, and thermal vibration) are consistent with the reflection condition.33 As shown in Table 2, the change in lattice parameters (a, c, and V) of sample S3 compared with sample S0 confirms the successful replacement of Mo6+ for Zr4+ sites into the host lattice. In addition, impurity phases were not observed in all samples, indicating the successful synthesis of the resulting phosphors.
3.2. SEM and EDS analysis
Fig. 2a and b show FE-SEM images of samples S0 and S3. All samples show a cubic grain morphology with a uniform distribution and clear grain boundary. The sample S0 exhibits a grain size of approximately 1.2 μm (Fig. 2a), whereas the doped sample (S3) is approximately 1 μm (Fig. 2b), which is due to the substitution of small ionic radius (Mo6+, 0.6 Å) for larger ionic radius (Zr4+, 0.72 Å).27 Meanwhile, Fig. 2c shows resulting peaks corresponding to Ca, O, Zr, Er, Yb, and Mo with element percentage (Fig. 2d) from elemental analysis of the EDS spectrum, indicating the presence of Er, Yb, and Mo doped in CaZrO3 host lattice. In addition, as shown in Fig. 2c and d, other impure chemical elements were not observed, indicating the high purity of the investigated phosphors in this work. These results indicate the high crystallinity degree of resulting phosphor, which is consistent with the XRD results shown in Fig. 1a, leading to the improvement of UC efficiency of the phosphor.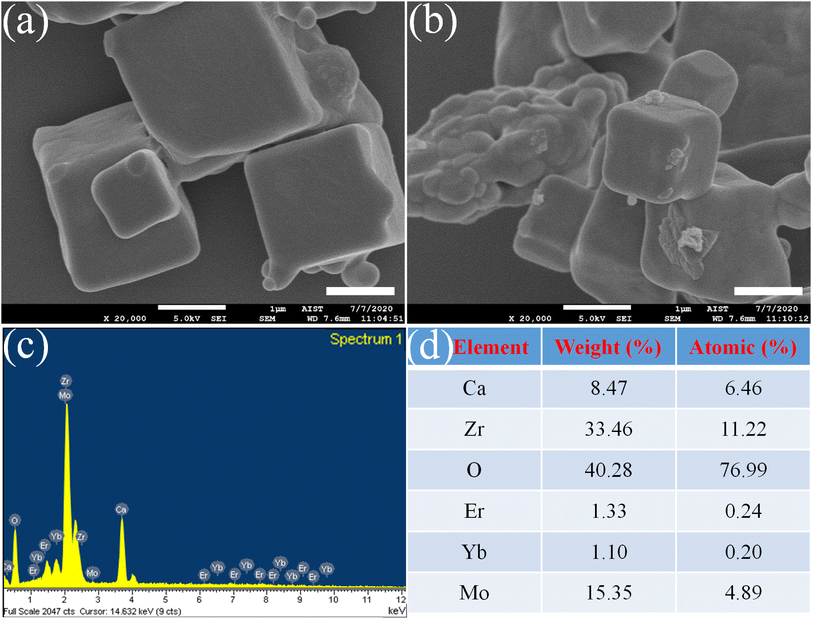 | ||
| Fig. 2 FE-SEM images of (a) S0 and (b) S3 (scale bar of 1 μm), (c) EDS spectra, and (d) element percentage of the investigated sample S3. | ||
3.3. Optical characteristics
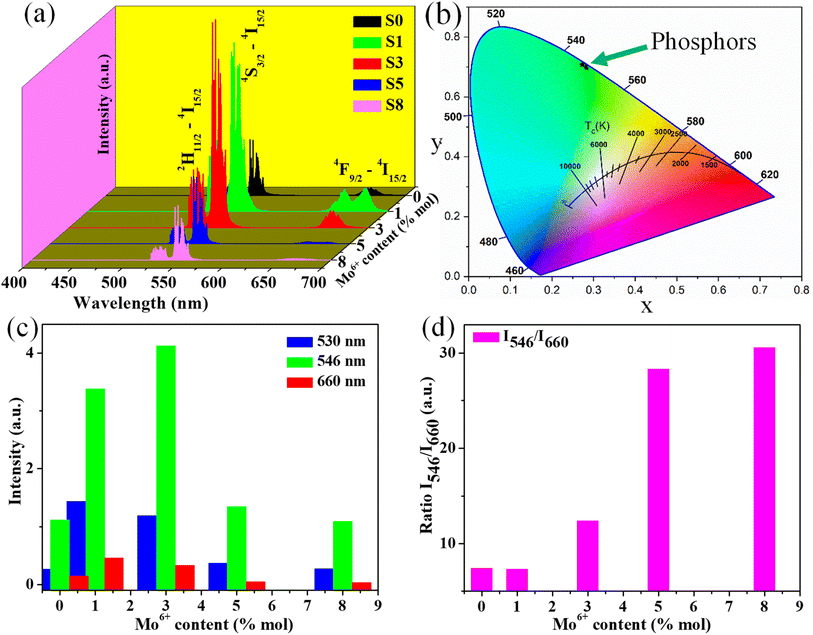
Additionally, Commission International de l'Eclairage (CIE) chromaticity coordinates of investigated samples were calculated from their emission spectra presented in Fig. 4b. In this case, the obtained values of all samples are displayed in Table 3. As shown in Table 3, the chromaticity coordinates value of the S3 sample (0.2743, 0.7084) is close to the standard green chromaticity coordinated for the National Television Standard Committee (NTSC) system.39 Significantly, the color purity of the green light emission phosphors in this work was calculated using eqn (2):40
 | (2) |
| Samples | Chromaticity coordinates (x, y) | Color purity (%) |
|---|---|---|
| S0 | (0.2835, 0.6964) | 93.11 |
| S1 | (0.2809, 0.7012) | 94.41 |
| S3 | (0.2743, 0.7084) | 96.50 |
| S5 | (0.2722, 0.7076) | 96.35 |
| S8 | (0.2721, 0.7070) | 96.21 |
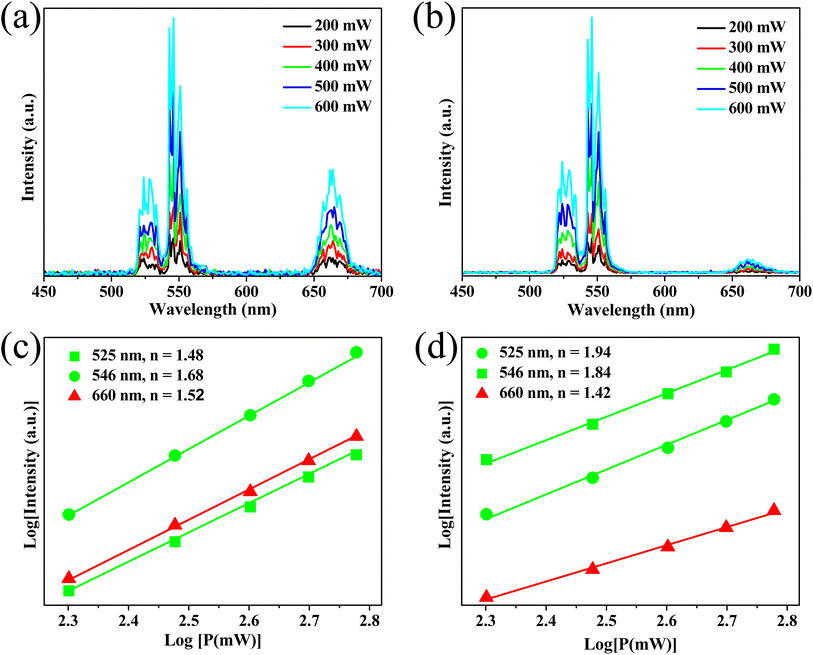 | ||
| Fig. 5 Emission intensity-dependent excitation power of the samples S0 (a) and S3 (b) and the log–log plots of green/red emission as a function of the power of the samples S0 (c) and S3 (d). | ||
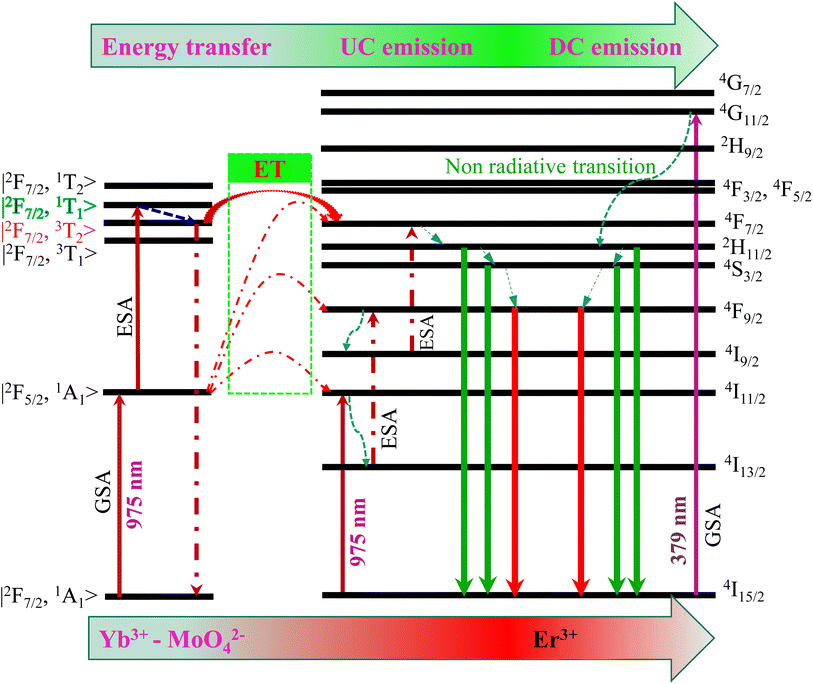
➢ Step 1: the energy level of the Yb3+–MoO42− dimer, such as |2F7/2, 1A1〉 (ground state), |2F5/2, 1A1〉 (excited state), and |2F7/2, 3T1〉, |2F7/2, 3T2〉, |2F7/2, 1T1〉, |2F7/2, 1T2〉 (at highly excited state), was obtained by mixing the electron wavefunctions of Yb3+ and MoO42−.43
➢ Step 2: the electron at the initial state |2F7/2, 1A1〉 of the Yb3+–MoO42− dimer absorbs one photon, and it is excited to the |2F5/2, 1A1〉 level via GSA.
➢ Step 3: the electron at the |2F5/2, 1A1〉 level absorbs a second photon, and then they are elevated to the |2F7/2, 1T1〉 level (high-energy excited state) by ESA. Given the unstable |2F7/2, 1T1〉 state, leading to the non-radiative relaxation of the electron to the |2F7/2, 3T2〉 state.
➢ Step 4: the electron at |2F7/2, 3T2〉 state ET to 4F7/2 level of Er3+ and then relax NR down to two meta-stable levels, 2H11/2/4S3/2. Next, most of the electrons in 2H11/2 and 4S3/2 levels return to the ground-state 4I15/2, producing intense green emission (530/546 nm).
Meanwhile, the red emission is originally from the 4F7/2 NR to the 4S3/2 level. However, the 4S3/2 energy level is higher than the 4F9/2 level, leading to a few electrons from the 4S3/2 NR to the 4F9/2 level,37 causing red emission that is weaker (several orders of magnitude) than green emission. These results are used to explain the experimental evidence shown in Fig. 4a. Thus, the proposed mechanism for the intense green UC emission is suitable.
3.4. Optical temperature sensing characterization based on UC emission
The potential application in temperature sensors of the phosphor was evaluated by determining the temperature-dependent green UC emission of the S3 sample. The Er3+ ion has two thermal coupled levels, 2H11/2/4S3/2, with an energy gap of approximately ∼800 cm−1.44 Thus, the thermal equilibrium between these two levels can be achieved through thermal excitation. Fig. 7a shows the UC emission of the S3 sample under different temperatures ranging from 303 K to 523 K. The emission intensities of samples decrease with the increase of temperature. Notably, the emission intensity of the 4S3/2–4I15/2 transition rapidly decreases. Meanwhile, the 2H11/2–4I15/2 and 4F7/2–4I15/2 transitions slightly change, indicating the excellent thermal stability of the phosphor.Based on the FIR technique, the emission intensity ratio corresponding to 2H11/2–4I15/2/4S3/2–4I15/2 transitions was used to estimate the optical temperature sensor characteristics of the phosphor using eqn (3):45
 | (3) |
 | (4) |
The correlation between the calculated temperature (using the FIR) and the actual experimental temperature (read directly from the thermal coupe) has been determined using eqn (5),13 which evaluates the reliability of the measurement, and results are shown in Fig. 7f. Fig. 7f reveals that the calculated temperature (green sphere) is consistent with the experimental temperature (red line) because of the high correlation coefficient R2 = 0.999, indicating the reliability and accuracy of the FIR.
 | (5) |
Furthermore, the key parameters such as relative sensitivity (Sr) and absolute sensitivity (Sa) values can be estimated using eqn (6) and (7), respectively, to evaluate the temperature sensing performance of the resulting phosphor:46,47
 | (6) |
 | (7) |
Fig. 7e shows the maximum Sr of 0.445% K−1 at 303 K, whereas Sa was 0.667% K−1 at 343 K. Moreover, the phosphor shows high-intensity emission at high temperatures (523 K), indicating its temperature stability and applicability at high temperatures.
The sensor sensitivity of the material is compared with other RE-doped phosphors to check its applicability (Table 4). As shown in Table 4, the phosphor obtained in this work has presented competitive results compared with other host lattices such as phosphate,11,50 fluoride,48,51 and oxide.4,5,16,49,52 Furthermore, CaZrO3:Er–Yb–Mo phosphor shows a high sensitivity temperature (0.667% K−1) based on the operating temperature range (303–523 K) that is prospective for temperature sensor applications.
| Sample | Sr max (% K−1) | Sa max (% K−1) | Temperature (K) | References |
|---|---|---|---|---|
| SrWO4:Er, Yb | — | 1.498 | 300–518 | 4 |
| Ba5Y8Zn4O21:Er, Yb | 0.39 | 1.36 | 293–563 | 5 |
| NaBiF4:Er, Yb, Fe | — | 0.53 | 300–550 | 48 |
| Li2Ti2O7:Er, Yb | 0.63 | 0.63 | 333–553 | 11 |
| Oxyfluorotellurite glasses:Er, Yb | 0.46 | 0.645 | 295–675 | 49 |
| Sr3(PO4)2:Er, Yb | 0.70 | 0.88 | 303–623 | 50 |
| Al2O3:Er, Yb, Mo | — | 0.51 | 294–973 | 16 |
| NaGdF4:Er, Yb, Fe | 0.27 | 0.78 | 303–523 | 51 |
| Er1−xYbxO3 | — | 0.45 | 298–473 | 52 |
| CaZrO3:Er, Yb, Mo | 0.445 | 0.667 | 303–523 | This work |
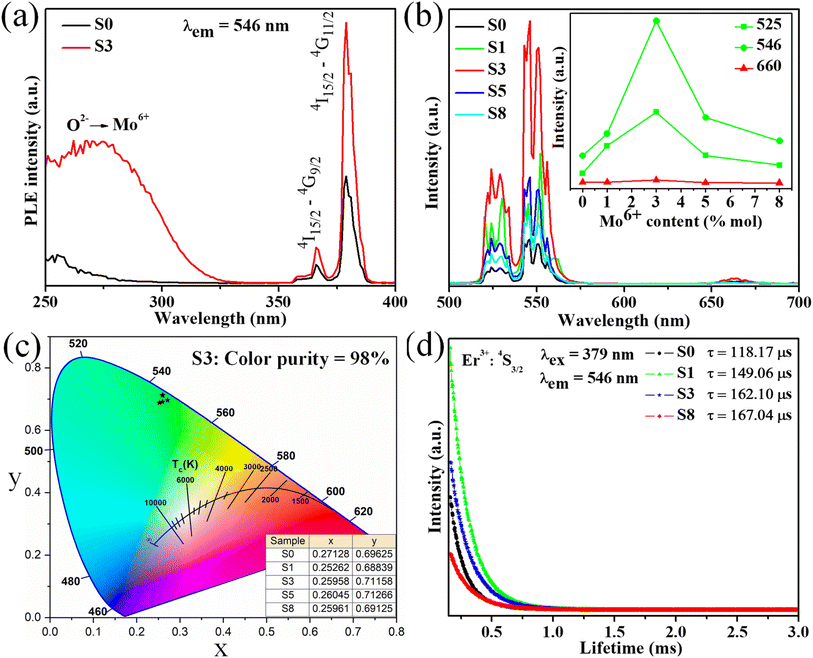
3.5. Downconversion luminescence properties
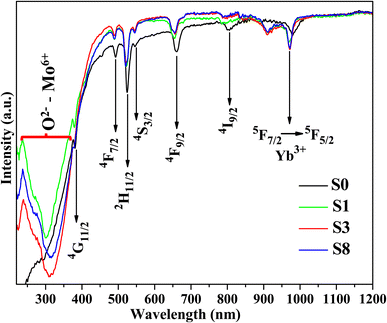
Fig. 8a displays the PL excitation spectra of typical samples S0 and S3. For two samples show the sharp absorption bands at 360 and 379 nm are assigned to the 4I15/2–4G9/2 and 4I15/2–4G11/2 transitions of Er3+ ions. Meanwhile, the doped sample (S3) shows a broad absorption band ranging from 250 to 300 nm (peak at 280 nm) corresponding to the 1A1–3T2 transition of MoO42− group involving the charge transfer state transition from O2− to Mo6+,53 which disappears in the undoped sample (S0). This result confirms the presence of Mo6+ ions in the host lattice. Notably, the absorption band intensity of sample S3 is higher than the S0 sample, which could enhance the DC emission intensity of studied phosphors. Under the excitation of 379 nm, the phosphors show strong green DC emission, as shown in Fig. 8b. All samples exhibited a strong green emission at 530/546 nm and weak red emission at 660 nm, corresponding to the 2H11/2–4I15/2/4S3/2–4I15/2 and 4F7/2–4I15/2 transitions of Er3+ ions, respectively. The emission intensity of all samples increases with the enhancement of Mo6+ doping, reaches a maximum value with 3% mol Mo6+, and then decreases with further Mo6+ doping content (inset of Fig. 8b). Significantly, the green emission intensity of sample S3 was six times higher than that of sample S0. The intense green UC emission of phosphor can be due to the ET from Yb3+–MoO42− dimer to Er3+ ions, which is similar to the enhancement mechanism of the UC emission.23,54 By contrast, the weak red emission may correspond to the relatively small population in the 4F9/2 level of Er3+ (Fig. 6). The quenching luminescence by further doping Mo6+ is due to cross-relaxation and ET in the Yb3+–MoO42− dimer.Furthermore, the intensely green DC emission and weak red DC emission can be explained as follows (Fig. 6):
➢ First, the 4I15/2 ground state of Er3+ ions absorb a 379 nm light excitation from the xenon lamp source and moves to the 4G11/2 level (Fig. 6).
➢ Next, most electrons of the 4G11/2 level NR to the 2H11/2/4S3/2 level and then return to the 4I15/2 ground state to produce two green emission bands. The intense green emission was achieved because the NR process has the fastest multi-phonon relaxation rate. Meanwhile, a few electrons are excited to the 4I11/2 state (intermediate state of red emission), resulting in an impoverished electron population in the 4F9/2 level, indicating fragile red emission intensity.
These results indicated that the behavior of UC and DC green emission of the CaZrO3:Er–Yb–Mo phosphor was explained based on the suitably proposed mechanism because of the point of view of the electronic structure scale.
In addition, the decay curve of phosphor materials was determined to explain the DC emission mechanism of the system (including the luminescence process, type of occupancy of the dopant ion in the host lattice sites, and characterization of the luminescence center). Decay measurements of all investigated samples (S0, S1, S3, and S8) were performed using the 379 nm excitation and 546 nm emission, as shown in Fig. 8d. The curve fitting technique can determine the lifetime of an excited state from the decay curve, which can be written as follows:55
| y(t) = y0 + Ae−t/τ | (8) |
Additionally, the CIE chromaticity coordinates of DC emission samples with different Mo6+ doping contents were calculated, as shown in Fig. 8c. Notably, chromaticity coordinates (x, y) of the DC phosphors are most close to pure green emission. By accepting these values into eqn (2), the color purity of all samples was estimated and reached a maximum value of 98% (S3 sample), indicating the high pure green light emission of the obtained phosphor. Overall, the high color purity and long lifetime of the UC and DC phosphor suggest that it is suitable as a candidate material for optoelectronic devices.
3.6. Optical temperature sensing based on DC emission
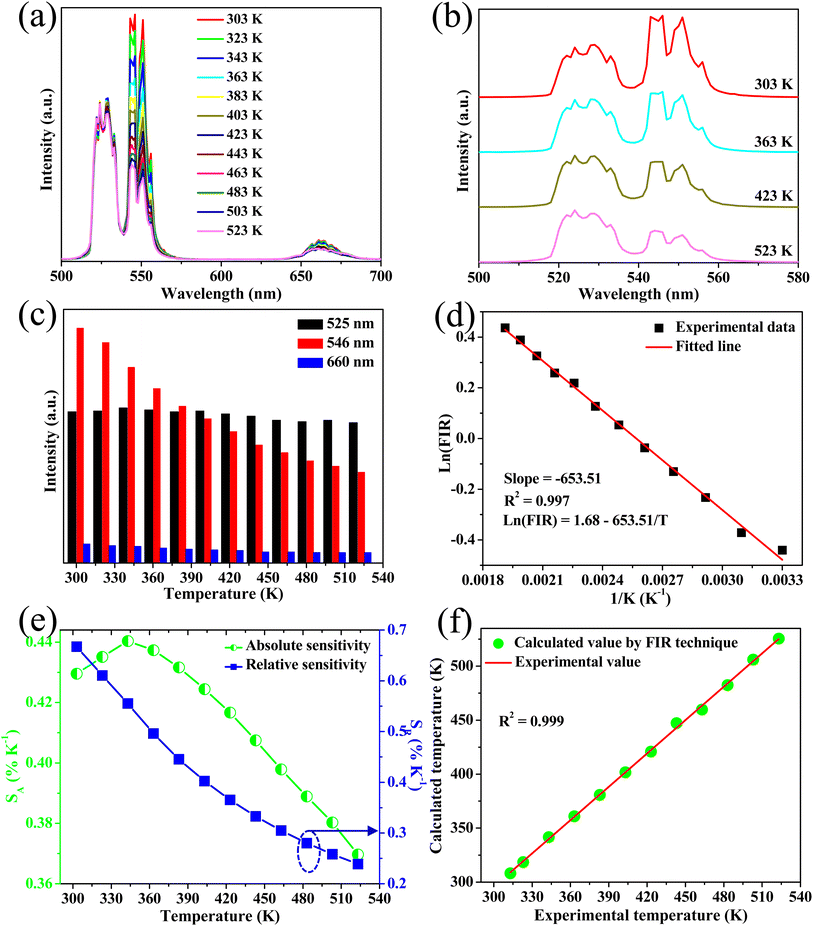
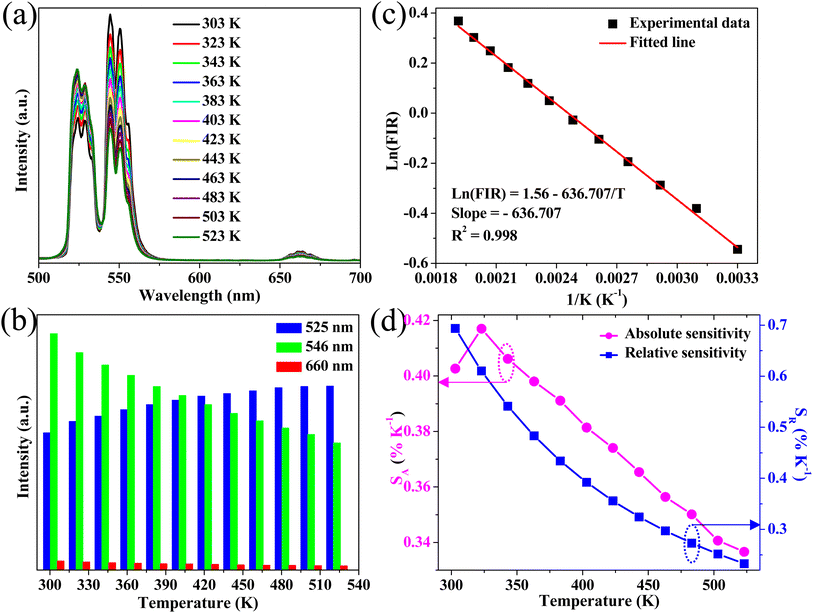
Down-conversion emission intensities of sample S3 depending on the temperature were also investigated to estimate the temperature sensing characteristics of the phosphor, as shown in Fig. 9a. Notably, the 2H11/2–4I15/2 transition intensity slightly increases with the increase of temperature. By contrast, the 4S3/2–4I15/2 transition intensity significantly decreases from 303 K to 525 K (Fig. 9b). The emission intensity of the phosphor decreases with the increase of temperatures because of the thermal quenching effect.3 Moreover, the emission intensity of the phosphor at 523 K was 54% compared with 303 K, indicating the good thermal stability of the phosphor.Furthermore, using eqn (4) and (5), the relationship of ln(FIR) versus 1/T was determined (Fig. 9c). The fitting results shown in Fig. 9c indicate that the slope value is −636.707, corresponding to the ΔE/k value. In addition, the absolute and relative sensitivity was calculated using eqn (6) and (7) (Fig. 9d). The absolute (Sa) and relative sensitivity (Sr) maximum were 0.417% K−1 at 323 K and 0.697% K−1 at 303 K. Table 5 shows the comparison of temperature sensitivity in this work and other phosphor reported in the literature.57–60 As shown in Table 4, the CaZrO3:Er–Yb–Mo phosphor in this work has presented a competitive result. In particular, the Sr maximum value of the DC emission is higher than the UC emission because the thermal effect generated by the DC excitation source light was ignored. Therefore, the high sensing sensitivity of DC phosphor was achieved, thereby extending material's application.
4. Conclusion
The structure, morphology, and luminescent behavior of the CaZrO3:Er–Yb–Mo phosphor were investigated in detail to explore their temperature sensor properties. The XRD and Rietveld refinement confirmed the formation of the orthorhombic single-phase CaZrO3 with a high crystallinity degree. SEM images show a uniform cubic morphology with an average size of approximately 1 μm. The strong green UC and DC emission of the phosphor was achieved under excitation of 975 and 379 nm. Consequently, the green UC and DC emission intensities of the doped sample were increased four and sixfold, respectively, compared with the undoped sample. The ET from the high-energy excited state of the Yb3+–MoO42− dimer to the 4F7/2 level of Er3+ is responsible for the enhancement of green UC and DC emissions, which is further confirmed by decay kinetics based on the DC emission of the phosphors. Additionally, the phosphor showed high green color purity, 96.50% of UC emission, and 98% of DC emission. Furthermore, the sensor sensitivity value based on DC emission was more than that of UC emission because the thermal effect generated by the DC excitation source light was ignored, thereby extending the application potential of the material. These results indicate that the CaZrO3:Er–Yb–Mo phosphor is an efficient down and up-conversion luminescent material suitable for optoelectronic integrated devices and thermal sensor applications.Author contributions
Hoang Tuan Nam: data curation, format analysis, experiment, writing – original draft. Phuong Dinh Tam: investigation, data curation. Nguyen Van Hai: methodology, format analysis. Hoang Nhu Van: conceptualization, format analysis, methodology, resources, supervision, writing – review & editing.Conflicts of interest
The authors declare that they have no conflict of interest.Acknowledgements
This work is funded by the Ministry of Education and Training of Vietnam, under the project B2023-SPH-06.References
- Y. Zhang, B. Wang, Y. Liu, G. Bai, Z. Fu and H. Liu, Upconversion luminescence and temperature sensing characteristics of Yb3+/Tm3+:KLa(MoO4)2 phosphors, Dalton Trans., 2021, 50, 1239–1245 RSC.
- Y. Zhao, X. Wang, Y. Zhang, Y. Li and X. Yao, Optical temperature sensing of up-conversion luminescent materials: fundamentals and progress, J. Alloys Compd., 2020, 817, 152691 CrossRef CAS.
- Y. Wang, L. Lei, R. Ye, G. Jia, Y. Hua, D. Deng and S. Xu, Integrating Positive and Negative Thermal Quenching Effect for Ultrasensitive Ratiometric Temperature Sensing and Anti-counterfeiting, ACS Appl. Mater. Interfaces, 2021, 13, 23951–23959 CrossRef CAS PubMed.
- A. Pandey, V. K. Rai, V. Kumar, V. Kumar and H. C. Swart, Upconversion based temperature sensing ability of Er3+-Yb3+ codoped SrWO4: an optical heating phosphor, Sens. Actuators, B, 2015, 209, 352–358 CrossRef CAS.
- J. Chen, W. Zhang, S. Cui, X. Peng, F. Hu, R. Wei, H. Guo and D. Huang, Up-conversion luminescence properties and temperature sensing performances of Ba5Y8Zn4O21:Yb3+, Er3+ phosphors, J. Alloys Compd., 2021, 875, 159922 CrossRef CAS.
- N. M. Bhiri, M. Dammak, M. Aguiló, F. Díaz, J. J. Carvajal and M. C. Pujol, Stokes and anti-Stokes operating conditions dependent luminescence thermometric performance of Er3+-doped and Er3+, Yb3+ co-doped GdVO4 microparticles in the non-saturation regime, J. Alloys Compd., 2020, 814, 152197 CrossRef CAS.
- Ľ. Bača, H. Steiner and N. Stelzer, Upconversion luminescence and optical thermometry in Er3+/Yb3+ co-doped CeO2 for space application, J. Alloys Compd., 2019, 774, 418–424 CrossRef.
- F. Huang, Y. Gao, J. Zhou, J. Xu and Y. Wang, Yb3+/Er3+ co-doped CaMoO4: a promising green upconversion phosphor for optical temperature sensing, J. Alloys Compd., 2015, 639, 325–329 CrossRef CAS.
- S. A. Wade, S. F. Collins and G. W. Baxter, Fluorescence intensity ratio technique for optical fiber point temperature sensing, J. Appl. Phys., 2003, 94, 4743–4756 CrossRef CAS.
- P. Singh, R. S. Yadav, P. Singh and S. B. Rai, Upconversion and downshifting emissions of Ho3+-Yb3+ co-doped ATiO3 perovskite phosphors with temperature sensing properties in Ho3+-Yb3+ co-doped BaTiO3 phosphor, J. Alloys Compd., 2021, 855, 157452 CrossRef CAS.
- Y. Liu, G. X. Bai, E. Pan, Y. J. Hua, L. Chen and S. Q. Xu, Upconversion fluo-rescence property of Er3+/Yb3+ co-doped lanthanum titanate micro- crystals for optical thermometry, J. Alloy. Compd., 2020, 822, 153449 CrossRef CAS.
- O. Kıbrıslı, E. Erol, N. Vahedigharehchopogh, E. S. Yousef, M. Ç. Ersundu and A. E. Ersundu, Noninvasive optical temperature sensing behavior of Ho3+ and Ho3+/Er3+ doped tellurite glasses through up and down-converted emissions, Sens. Actuators, A, 2020, 315, 112321 CrossRef.
- C. V. Thai, N. T. Dung, N. V. Hai, V. T. N. Minh, N. X. Truong, P. A. Tuan, P. V. Huan and H. N. Van, Intense green upconversion emission of rare-earth-doped Sr3(PO4)2/Sr2P2O7 powder: effect of annealing temperature and temperature-sensor properties, Optik, 2022, 264, 169446 CrossRef.
- W. Ge, M. Xu, J. Shi, J. Zhu and Y. Li, Highly temperature-sensitive and blue upconversion luminescence properties of Bi2Ti2O7:Tm3+/Yb3+ nanofibers by electrospinning, Chem. Eng. J., 2020, 391, 123546 CrossRef CAS.
- B. S. Cao, Y. Y. He, Z. Q. Feng, Y. S. Li and B. Dong, Optical temperature sensing behavior of enhanced green upconversion emissions from Er-Mo:Yb2Ti2O7 nanophosphor, Sens. Actuators, B, 2011, 159, 8–11 CrossRef CAS.
- B. Dong, B. S. Cao, Z. Q. Feng, X. J. Wang and Y. Y. He, Optical temperature sensing through extraordinary enhancement of green up-conversion emissions for Er-Yb-Mo:Al2O3, Sens. Actuators, B, 2012, 165, 34–37 CrossRef CAS.
- B. Dong, B. Cao, Y. He, Z. Liu, Z. Li and Z. Feng, Temperature sensing and in vivo imaging by molybdenum sensitized visible upconversion luminescence of rare-earth oxides, Adv. Mater., 2012, 24, 1987–1993 CrossRef CAS PubMed.
- X. Yang, Z. Fu, Y. Yang, C. Zhang, Z. Wu and T. Sheng, Optical Temperature Sensing Behavior of High-Efficiency Upconversion: Er3+-Yb3+ Co-Doped NaY(MoO4)2 Phosphor, J. Am. Ceram. Soc., 2015, 98, 2595–2600 CrossRef CAS.
- A. A. Ansari, A. K. Parchur, M. Alam and A. Azzeer, Structural and photoluminescence properties of Tb-doped CaMoO4 nanoparticles with sequential surface coatings, Mater. Chem. Phys., 2014, 147, 715–721 CrossRef CAS.
- H. N. Van, M. T. Y. Thanh, P. H. Vuong, P. V. Huan, V. T. N. Minh, P. A. Tuan and T. D. Hien, Experimental and theoretical studies of red emission enhancing mechanism in Al-doped CaMoO4:Eu phosphor, Opt. Mater., 2022, 132, 112831 CrossRef CAS.
- H. N. Van, V. N. Hung, P. H. Vuong, P. V. Huan, B. T. Hoan, N. D. Hung and L. M. Tu, A novel upconversion emission material based on Er3+ - Yb3+ - Mo6+ tridoped hydroxyapatite/tricalcium phosphate (HA/β-TCP), J. Alloys Compd., 2020, 827, 154288 CrossRef CAS.
- H. N. Van, L. M. Tu, D. T. T. Dung, P. H. Vuong, N. D. Hung, P. T. H. Diep and H. V. Hung, On enhancement and control of green emission of rare earth co-doped hydroxyapatite nanoparticles: synthesis and upconversion luminescence properties, New J. Chem., 2021, 45, 751–760 RSC.
- D. T. T. Dung, V. T. N. Minh, N. X. Truong, P. V. Huan, P. H. Vuong, N. D. Hung, B. T. Hoan, L. M. Tu and H. N. Van, Dual-mode green emission and temperature sensing properties of rare-earth-element-doped biphasic calcium phosphate composites, J. Alloys Compd., 2021, 871, 159483 CrossRef.
- J. L. Wu, B. S. Cao, F. Lin, B. J. Chen, J. S. Sun and B. Dong, A new molybdate host material: synthesis, upconversion, temperature quenching and sensing properties, Ceram. Int., 2016, 42, 18666–18673 CrossRef CAS.
- K. Shan, F. Zhai, Z. Z. Yi, X. T. Yin, D. Dastan, F. Tajabadi, A. Jafari and S. Abbasi, Mixed conductivity and the conduction mechanism of the orthorhombic CaZrO3 based materials, Surf. Interfaces, 2021, 23, 100905 CrossRef CAS.
- A. Maurya, A. Dwivedi, A. Bahadur and S. B. Rai, Enhanced upconversion and downshifting emissions from Tm3+, Yb3+ co-doped CaZrO3 phosphor in the presence of alkali ions (Li+, Na+ and K+), J. Alloys Compd., 2019, 786, 457–467 CrossRef CAS.
- A. Khan, F. Song, X. Gao, Z. Chen, X. Sang, M. Feng and L. Liu, Introduction of Molybdenum into the lattice of single-host CaZrO3: Dy3+/Eu3+ to enhance luminescence intensity of the phosphor for white light emission, J. Alloys Compd., 2021, 881, 160652 CrossRef CAS.
- V. Singh, V. Kumar Rai and M. Haase, Intense green and red upconversion emission of Er3+,Yb3+ co-doped CaZrO3 obtained by a solution combustion reaction, J. Appl. Phys., 2012, 112, 1–6 Search PubMed.
- A. Maurya, A. Bahadur and S. B. Rai, Enhanced red emission from Eu3+, A+ (Li+, Na+, K+) co-doped CaZrO3 phosphor, J. Lumin., 2018, 203, 714–722 CrossRef CAS.
- D. Navamia, G. P. Darshan, D. R. Lavanya, H. B. Premkumar, S. C. Sharma, H. Adarsha, H. C. Prameela and H. Nagabhushan, Design of green emitting CaZrO3:Tb3+ nanophosphor: luminescence based platform for real-time ultrasensitive detection of latent fingerprints and anti-counterfeiting applications, Opt. Mater., 2021, 122, 111474 CrossRef.
- A. Khan, F. Song, A. Zhou, X. Gao, M. Feng, M. Ikram, H. Hu, X. Sang and L. Liu, Tuning white light upconversion emission from Yb3+/Er3+/Tm3+ triply doped CaZrO3 by altering Tm3+ concentration and excitation power, J. Alloys Compd., 2020, 835, 155286 CrossRef CAS.
- Y. Hua and J. S. Yu, Strong Green Emission of Erbium(III)-Activated La2MgTiO6 Phosphors for Solid-State Lighting and Optical Temperature Sensors, ACS Sustainable Chem. Eng., 2021, 9, 5105–5115 CrossRef CAS.
- H. N. Van, P. D. Tam, P. H. Vuong, N. D. Hung, C. X. Thang and L. Q. Minh, Control of red upconversion emission in Er3+–Yb3+– Fe3+ tri–doped biphasic calcium phosphate, Inorg. Chem. Commun., 2023, 150, 110538 CrossRef CAS.
- K. Singh, M. Rajendran, R. Devi and S. Vaidyanathan, Narrow-band red-emitting phosphor with negligible concentration quenching for hybrid white LEDs and plant growth applications, Dalton Trans., 2021, 50, 4986 RSC.
- L. Li, W. Chang, J. He, Y. Yan, M. Cui, S. Jiang, G. Xiang and X. Zhou, Molybdenum substitution simultaneously induced band structure modulation and luminescence enhancement in LiLaMg(W, Mo)O6:Eu3+ red-emitting phosphor for near ultraviolet excited white light diodes, J. Alloys Compd., 2018, 763, 278–288 CrossRef CAS.
- M. Pal, U. Pal, J. M. G. Y. Jiménez and F. Pérez-Rodríguez, Effects of crystallization and dopant concentration on the emission behavior of TiO2: Eu nanophosphors, Nanoscale Res. Lett., 2012, 7, 1–12 CrossRef PubMed.
- Y. Y. He, X. L. Liu, B. S. Cao, Z. Q. Feng and B. Dong, A general approach for selective enhancement of green upconversion emissions in Er3+ doped oxides by Yb3+-MoO42- dimer sensitizing, J. Sol-Gel Sci. Technol., 2013, 66, 312–316 CrossRef CAS.
- X. Bao, S. Zhou, J. Wang, L. Zhang, S. Huang and Y. Pan, Color tunable phosphor CaMoO4:Eu3+, Li+ via energy transfer of MoO42–Eu3+ dependent on morphology and doping concentration, Mater. Res. Bull., 2013, 48, 1034–1039 CrossRef CAS.
- J. Sun, F. Lai, L. Ke, J. Chen, X. Shi, Y. Qiang and W. You, Upconversion luminescence of La4Ti9O24: Er–Yb phosphor with high green color purity, Opt. Mater., 2023, 138, 113656 CrossRef CAS.
- B. Su, H. Xie, Y. Tan, Y. Zhao, Q. Yang and S. Zhang, Luminescent properties, energy transfer, and thermal stability of double perovskites La2MgTiO6:Sm3+, Eu3+, J. Lumin., 2018, 204(1028), 457–463 CrossRef CAS.
- W. Zheng, B. Sun, Y. Li, T. Lei, R. Wang and J. Wu, Low Power High Purity Red Upconversion Emission and Multiple Temperature Sensing Behaviors in Yb3+,Er3+ Codoped Gd2O3 Porous Nanorods, ACS Sustainable Chem. Eng., 2020, 8, 9578–9588 CrossRef CAS.
- J. Chen, W. Zhang, S. Cui, X. S. Peng, F. F. Hu, R. F. Wei, H. Guo and D. X. Huang, Up-conversion luminescence properties and temperature sensing performances of Ba5Y8Zn4O21:Yb3+, Er3+ phosphors, J. Alloys Compd., 2021, 875, 159922 CrossRef CAS.
- Y. Cong, B. Dong, N. Yu, Y. He, Y. Zhao and Y. Yang, Enhanced upconversion emission in ZrO2-Al2O3 composite oxide, Dalton Trans., 2016, 45, 6627–6633 RSC.
- D. K. Singh and J. Manam, Efficient dual emission mode of green emitting perovskite BaTiO3: Er3+ phosphors for display and temperature sensing applications, Ceram. Int., 2018, 44, 10912–10920 CrossRef CAS.
- B. Hou, M. Jia, P. Li, G. Liu, Z. Sun and Z. Fu, Multifunctional Optical Thermometry Based on the Rare-Earth-Ions-Doped Up-/Down-Conversion Ba2TiGe2O8:Ln (Ln = Eu3+/Er3+/Ho3+/Yb3+) Phosphors, Inorg. Chem., 2019, 58, 7939–7946 CrossRef CAS PubMed.
- K. M. Krishna, S. P. Tiwari, A. Kumar and K. Kumar, Up- and downconversion emission studies in Er3+/Yb3+: Ca3(PO4)2 phosphor for thermometry, Sens. Actuators, A, 2020, 315, 112302 CrossRef CAS.
- W. Zhang, X. Huang, W. Liu, Z. Gao, L. Zhong, Y. Qin, B. Li and J. Li, Semiconductor Plasmon Enhanced Upconversion toward a Flexible Temperature Sensor, ACS Appl. Mater. Interfaces, 2023, 15, 4469–4476 CrossRef CAS PubMed.
- P. Du, Q. Zhang, X. Wang, L. Luo and W. Li, Upconversion luminescence, temperature sensing and internal heating behaviors of Er3+/Yb3+/Fe3+-tridoped NaBiF4 nanoparticles, J. Alloys Compd., 2019, 805, 171–179 CrossRef CAS.
- R. Lisiecki, M. Lukaszewicz, B. Klimesz and W. R. Romanowski, Er3+,Yb3+-doped oxyfluorotellurite glasses—Impact of temperature on spectroscopic properties and optical sensor qualities, J. Non-Cryst. Solids, 2020, 535, 119965 CrossRef CAS.
- T. Zheng, L. Zhou, X. Qiu, D. Yang, M. Runowski, S. Lis, P. Du and L. Luo, Er3+/Yb3+ co-doped Sr3(PO4)2 phosphors: a ratiometric luminescence thermometer based on Stark levels with tunable sensitivity, J. Lumin., 2020, 227, 117517 CrossRef CAS.
- J. Tang, P. Du, W. Li and L. Luo, Boosted thermometric performance in NaGdF4:Er3+/Yb3+ upconverting nanorods by Fe3+ ions doping for contactless nanothermometer based on thermally and non-thermally coupled levels, J. Lumin., 2020, 224, 117296 CrossRef CAS.
- K. Feng, B. Lu and L. Hu, Down/Upconversion Luminescence Behaviors and Temperature-Sensing Properties of Highly Transparent (Er1–xYbx)2O3 Ceramics, ACS Appl. Electron. Mater., 2022, 4(2), 761–767 CrossRef CAS.
- F. Kang, M. Peng, S. Xu, Z. Ma, G. Dong and J. Qiu, Broadly Tunable Emission from CaMoO4:Bi Phosphor Based on Locally Modifying the Microenvironment Around Bi3+ Ions, Eur. J. Inorg. Chem., 2014, 8, 1373–1380 CrossRef.
- S. Fan, S. Wang, H. Sun, S. Sun, G. Gao and L. Hu, Efficient dual-mode up-conversion and down-shifting emission in β-NaYF4:Yb3+,Er3+ microcrystals via ion exchange, J. Am. Ceram. Soc., 2017, 100, 3061–3069 CrossRef CAS.
- J. Mu, W. Sun, F. Li, Y. Guan, X. Zhou, J. Li and L. Chen, Upconversion luminescent perovskite CaTiO3:Yb3+/Er3+ nanocubes, J. Alloys Compd., 2019, 797, 1002–1006 CrossRef CAS.
- A. Kumar and J. Manam, Optical thermometry using up and down conversion photoluminescence mechanism in Y2Zr2O7:Er3+ phosphors with excellent sensing sensitivity, J. Alloys Compd., 2020, 829, 154610 CrossRef CAS.
- G. Z. Sui, X. P. Li, L. H. Cheng, J. S. Zhang, J. S. Sun, H. Y. Zhong, Y. Tian, S. B. Fu and B. J. Chen, Laser cooling with optical temperature sensing in Er3+-doped tellurite-germanate glasses, Appl. Phys. B: Lasers Opt., 2013, 110, 471–476 CrossRef CAS.
- X. Ming, Q. Meng, S. Lü and W. Sun, The hydrothermal synthesis and morphology-dependent optical temperature sensing properties of Er3+ doped NaGd(WO4)2 phosphor, J. Lumin., 2017, 192, 196–202 CrossRef CAS.
- S. Wang, S. Zheng, H. Zhou, A. Pan, G. Wu and J. M. Liu, Down-conversion luminescence and its temperature-sensing properties from Er3+-doped sodium bismuth titanate ferroelectric thin films, Appl. Phys. A: Mater. Sci. Process., 2015, 121, 773–777 CrossRef CAS.
- H. X. Sun, N. Yuan, D. Y. Liu, Z. B. Zhang, Y. Wang, W. H. Wong, D. Y. Yu, E. Y. B. Pun and D. L. Zhang, A simple, low-cost, highly efficient optical thermometry based on down-conversion green fluorescence of Er3+:SrGdGa3O7 crystal, Mater. Res. Bull., 2017, 94, 408–414 CrossRef CAS.
| This journal is © The Royal Society of Chemistry 2023 |

