 Open Access Article
Creative Commons Attribution 3.0 Unported Licence
A new Schiff base-fabricated pencil lead electrode for the efficient detection of copper, lead, and cadmium ions in aqueous media
Abdelrahman S. Ahmeda,
Mahmoud Basseem I. Mohamed *a,
Mahmoud A. Bedair
 *b,
Adham A. El-Zomrawya and
Moustafa F. Bakra
aChemistry Department, Faculty of Science, Al-Azhar University, 11884, Nasr City, Cairo, Egypt. E-mail: mahmoudbasseem@azhar.edu.eg
bDepartment of Chemistry, College of Science and Arts, University of Bisha, P. O. Box 101, Al-Namas 61977, Saudi Arabia. E-mail: m_bedier@ub.edu.sa; m_bedier@yahoo.com
First published on 23rd May 2023
Abstract
Cu2+, Pb2+, and Cd2+ were individually and simultaneously determined using a novel and effective electroanalytical approach that has been devised and improved. Cyclic voltammetry was used to examine the electrochemical properties of the selected metals, and their individual and combined concentrations were determined by square wave voltammetry (SWV) using a modified pencil lead (PL) working electrode functionalized with a freshly synthesized Schiff base, 4-((2-hydroxy-5-((4-nitrophenyl)diazenyl)benzylidene)amino)benzoic acid (HDBA). In a buffer solution of 0.1 M tris–HCl, heavy metal concentrations were determined. To improve the experimental circumstances for determination, scan rate, pH, and their interactions with current were studied. At some concentration levels, the calibration graphs for the chosen metals were linear. The concentration of each metal was altered while the others remained unchanged for both the individual and simultaneous determination of these metals, and the devised approach was proven to be accurate, selective, and rapid.
1 Introduction
Toxic heavy metals are released into the environment in ever-increasing quantities, endangering humanity as they build up in the soil and in human bodies due to their inability to disintegrate. They also pose a serious issue as pollutants in waste that is dumped into outflows. The cumulative properties and prolonged biological half-lives of these heavy metals make them potentially harmful to human health when exposed to them. Reactive oxygen species (ROS), in particular polyunsaturated lipids and proteins, can disrupt cell macromolecules as a result of metal toxicity.1 It is therefore important to detect and quantify heavy metals in soil and streams for health reasons.2 Spectroscopy,3 optical colorimetry,4 inductively coupled plasma5 mass spectrometry (ICP-MS),6 atomic absorption spectrometry (AAS),7 and fluorescence spectrometry8 are some of the analytical methods used today for heavy metal detection. However, they are expensive (they usually need expert operators and sophisticated equipment), therefore, electrochemical approaches have been researched as alternatives9 due to the ease of sample preparation and simpler procedures. In addition, electrochemical techniques for heavy metals analysis have certain advantages owing to their high sensitivity, precision, simplicity, and low cost.10 Schiff bases are chemical compounds formed when a primary amine reacts with an aldehyde or a ketone to form an imine.11 Schiff bases can be easily altered by selecting the right amine and substituting a carbonyl molecule, resulting in a wide range of structural diversity. Schiff bases are widely used in electrochemical applications owing to their characteristic structure and their ability to bind to electrode surfaces.12–14 The search for an optimum pencil graphite electrode (PGE) for the detection of trace heavy metals has exploded recently. Working electrodes made of carbon-based materials are often employed in electrochemical analysis15 owing to the ease with which they can be used to pre-treat surfaces. Given their convenience, time-saving nature, and compliance with green chemistry standards, disposable pencil-graphite electrodes (PGEs) are considered an excellent choice as working electrodes for both laboratory and on-site screening experiments. Pencil-graphite electrodes that have undergone electrochemical treatment also offer benefits for being small, affordable, easy to create, and simple to use. The graphite-based working electrodes are widely used in electrochemical analysis owing to its abundant porosity, high electrical conductivity, and large specific surface area.16,17 They also support rapid mass transport and fast electron transfer in electrochemical applications. It is crucial to be able to change the graphite in PGEs in just one step6 and this depends on the supramolecular interaction of the ions with a functional group on the electrode surface, which can allow Schiff base-modified electrodes to be able to acquire the target metal ions, and which has thus piqued research interest in recent years.18 In this study, we tried to achieve sensitive metal sensing by modifying a very cheap pencil lead (PL) electrode with the electrochemically modified Schiff base 4-((2-hydroxy-5-((4-nitrophenyl)diazenyl)benzylidene)amino)benzoic acid (HDBA), and termed this the HDBA/PL electrode. For this reason, we applied HDBA film to the PL electrode and performed numerous measurements. We investigated the PL electrode's surface area, the effects of pH, the voltammetry scan rate, and calculated the diffusion coefficient using cyclic voltammetry (CV). Additionally, individual metal detection by square wave voltammetry (SWV) was performed based on changes in the current from varying the concentration of specific metals, as well as the simultaneous determination of multiple metal ions, also by (SWV).192. Experimental
2.1. Chemicals and apparatus
The chemicals used in this study included 4-amino benzoic acid, tris–HCl buffer, methanol, dichloromethane, glacial acetic acid, CuSO4·5H2O, Pb(NO3)2, and Cd(NO3)2·4H2O. A Gamry REF 3000 potentiostat/galvanostat/Zra and Echem Analyst 7.8.2 program for data processing, fitting, and graphing were used for all electrochemical studies. The cell configuration used was a typical three-electrode configuration, with the HDBA-modified PL electrode utilized as the working electrode, and platinum wire and saturated Ag/AgCl utilized as the counter and reference electrodes, respectively.20,21. Bruker DMX-400 spectrometers running at 400 and 101 MHz were used to measure the 1H and 13C NMR spectra. An Agilent Cary 630 spectrometer was utilized to measure the FT-IR spectra. A 3520 pH meter was utilized to measure the pH levels (Jenway, UK). A Stuart melting point SMP30 instrument was used to measure the melting points.2.2. Synthesis of HDBA
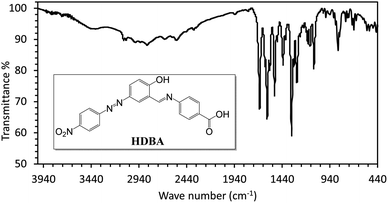
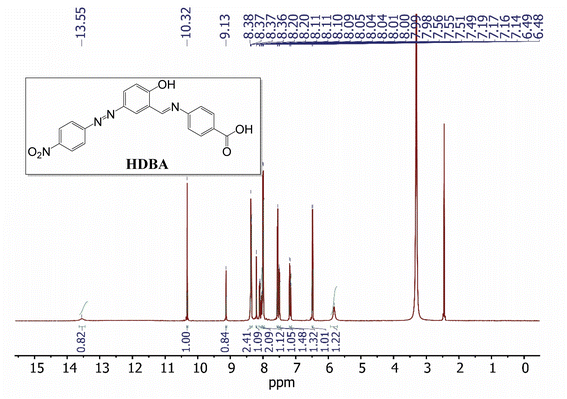
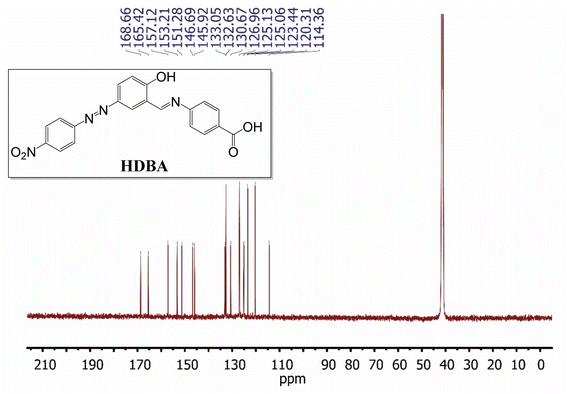
First, 2-hydroxy-5-((4-nitrophenyl)diazenyl)benzaldehyde (200 mmol)22 and 4-amino benzoic acid (200 mmol) were refluxed in ethanol for 3 h to afford a new Schiff base (HDBA), which was washed, dried, and recrystallized from ethanol to obtain a high-quality product in a 60–65% yield with a melting point of 250 °C (Fig. 1). IR, 1H-NMR, and 13C-NMR spectroscopy were used to determine the chemical structure of the synthesized Schiff base, as illustrated in Fig. 2, 3, and 4, respectively.20The IR spectrum of HDBA displayed absorption bands at Vmax = 3455 (O–H phenolic group), 3103 (C–H aromatic), 2853 (O–H, carboxylic group), 1676 (>C![[double bond, length as m-dash]](https://www.rsc.org/images/entities/char_e001.gif) O), 1620 (C
O), 1620 (C![[double bond, length as m-dash]](https://www.rsc.org/images/entities/char_e001.gif) C), 1597 (C
C), 1597 (C![[double bond, length as m-dash]](https://www.rsc.org/images/entities/char_e001.gif) N), and 1520, 1341 cm−1 (NO2 group).
N), and 1520, 1341 cm−1 (NO2 group).
1H-NMR (400 MHz, DMSO-d6, δ ppm): 5.82 (s, 1H), 6.49 (d, J = 8.7 Hz, 1H), 7.17 (dd, J = 12.4, 8.9 Hz, 1H), 7.50 (d, J = 8.2 Hz, 1H), 7.56 (d, J = 8.6 Hz, 1H), 8.00 (dd, J = 8.9, 2.4 Hz, 1H), 8.07 (ddd, J = 28.0, 8.8, 2.3 Hz, 2H), 8.20 (d, J = 2.6 Hz, 1H), 8.37 (dd, J = 8.7, 5.2 Hz, 2H), 9.13 (s, 1H), 10.32 (s, 1H), 13.55 (s, 1H).
13C-NMR (126 MHz, DMSO-d6, δ, ppm): 114.36, 120.31, 123.44, 125.06, 125.13, 126.96, 130.67, 132.63, 133.05, 145.92, 146.69, 151.28, 153.21, 157.12, 165.42, 168.66.
2.3. Construction of the HDBA/PL electrode
PL with a diameter of 0.9 mm and a length of 6 cm was used to create the working electrode. The surface wax was first removed using white print paper, and 1 cm of the PL was then dipped into a solution containing DCM and 1![[thin space (1/6-em)]](https://www.rsc.org/images/entities/char_2009.gif) :
:![[thin space (1/6-em)]](https://www.rsc.org/images/entities/char_2009.gif) 1 HDBA + PVC to electrochemically synthesize HDBA film on the PL. To remove any potential impurities, the as-fabricated HDBA/PL electrode was soaked in 0.1 M tris–HCl solution for 15 min before being placed in a desiccator at room temperature for further testing.19
1 HDBA + PVC to electrochemically synthesize HDBA film on the PL. To remove any potential impurities, the as-fabricated HDBA/PL electrode was soaked in 0.1 M tris–HCl solution for 15 min before being placed in a desiccator at room temperature for further testing.19
2.4. Electrochemical measurements
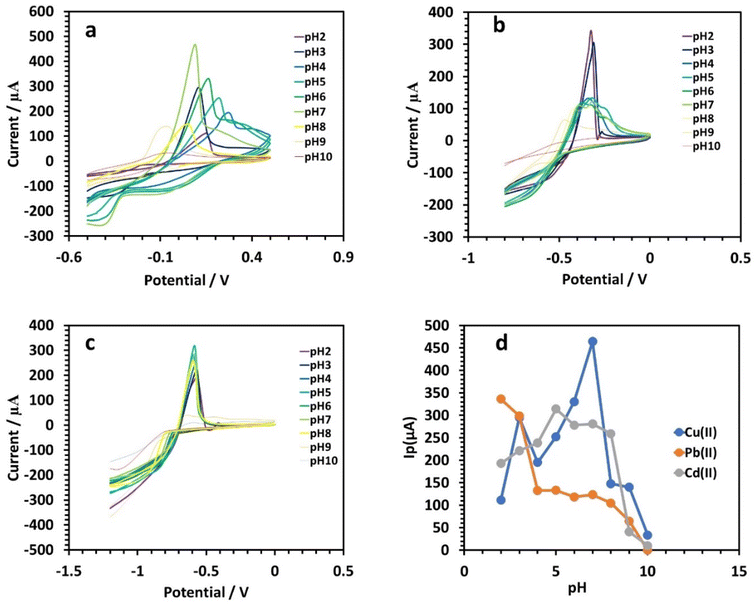
Utilizing cyclic voltammetry (CV) and square wave voltammetry (SWV), electrochemical tests were conducted. In 0.1 M tris–HCl, the potential was examined by CV analysis. The SWV parameters were: frequency of 12.5 Hz, 50 ms pulse width, 2 mV scan increment, and 50 mV pulse height. First, 200 ppm metal ions in solutions were generated at pH 2–10. Then, the relation between the potential and current was established and the pH was selected with the largest current that would impact the scan rate at a concentration of 50 ppm (CV). The relation among the current and various concentrations was established utilizing SWV as well.3. Results and discussion
3.1. Characterization of HDBA
The IR spectrum of HDBA (Fig. 2) revealed multiple absorption peaks with distinctive characteristics. Absorption peaks were specifically identified at Vmax = 3455 cm−1, corresponding to the O–H stretching of the phenolic group. Additional peaks at 3103 and 2853 cm−1 were noted corresponding to C–H stretching in aromatic and carboxylic groups, respectively. The peak at 1676 cm−1 revealed the presence of a carbonyl (>C![[double bond, length as m-dash]](https://www.rsc.org/images/entities/char_e001.gif) O) group, while the peaks at 1620 and 1597 cm−1 were attributed to the stretching vibrations of C
O) group, while the peaks at 1620 and 1597 cm−1 were attributed to the stretching vibrations of C![[double bond, length as m-dash]](https://www.rsc.org/images/entities/char_e001.gif) C and C
C and C![[double bond, length as m-dash]](https://www.rsc.org/images/entities/char_e001.gif) N bonds, respectively. The existence of the NO2 group was shown by the peaks at 1520 and 1341 cm−1.
N bonds, respectively. The existence of the NO2 group was shown by the peaks at 1520 and 1341 cm−1.
The 1H-NMR spectrum of HDBA (Fig. 3) exhibited a number of proton-related signals. The proton signals between 5.82 and 8.73 ppm could be attributed to protons on the benzene ring. The 9.13 ppm singlet corresponded to the proton on the imine group, while the 10.32 ppm singlet was attributed to the proton on the phenolic group. Finally, the proton on the carboxylic acid group was indicated by the signal at 13.55 ppm.
The 13C-NMR spectrum of HDBA (Fig. 4) displayed several signals that were attributed to carbon atoms, notably the carbon atoms in the benzene ring, with signals between 120 and 140 ppm, in the azo group at 165.42 ppm, the C![[double bond, length as m-dash]](https://www.rsc.org/images/entities/char_e001.gif) N group at 157.12 ppm, and the carboxylic group at 186.66 ppm. These results were consistent with the expected chemical structure of the synthesized Schiff base.
N group at 157.12 ppm, and the carboxylic group at 186.66 ppm. These results were consistent with the expected chemical structure of the synthesized Schiff base.
3.2. Electrochemical measurements
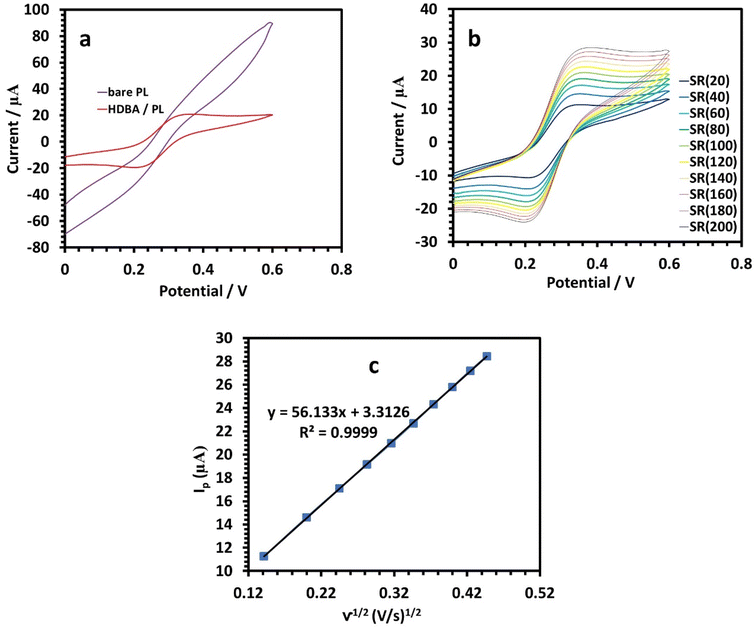
| ip = (2.69 × 10⁵)n3/2AC(Dv)1/2 | (1) |
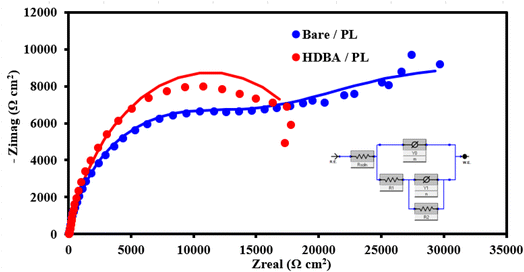
Next, electrochemical impedance spectroscopy (EIS) tests were done for the bare and HDBA electrodes in 10 mM ferricyanide redox probe dissolved in 0.1 M KCl in the frequency range of 0.1 Hz to 105 Hz. The Nyquist spectra of the bare and HDBA/PL electrode are shown in Fig. 6. The electron transfer resistance RCT was calculated from the Nyquist plot semicircles by fitting to the suitable equivalent circuit.27,28 The modified electrode had a smaller diameter, lower RCT, and higher conductivity than the bare electrode, whereby the value of RCT for the bare electrode was 12.440 kΩ and the value of RCT for the HDBA/PL electrode was 0.698 kΩ. Also, the bigger semicircle of the bare electrode demonstrated its greater interface impedance.29,30 The spectra were in good agreement with the outcomes of the CV experiments shown in Fig. 5a, demonstrating the modified electrode's increased conductivity.31,32
| ip = (n2F2νAΓ)/4RT | (2) |
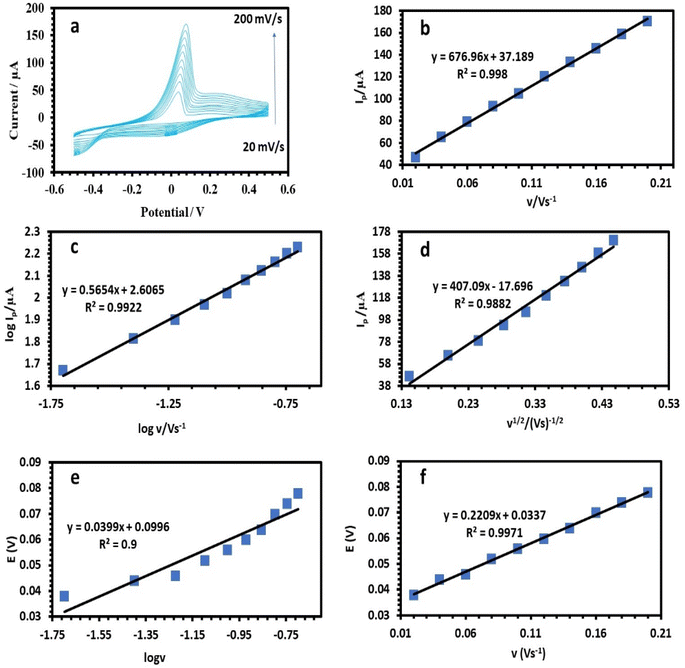
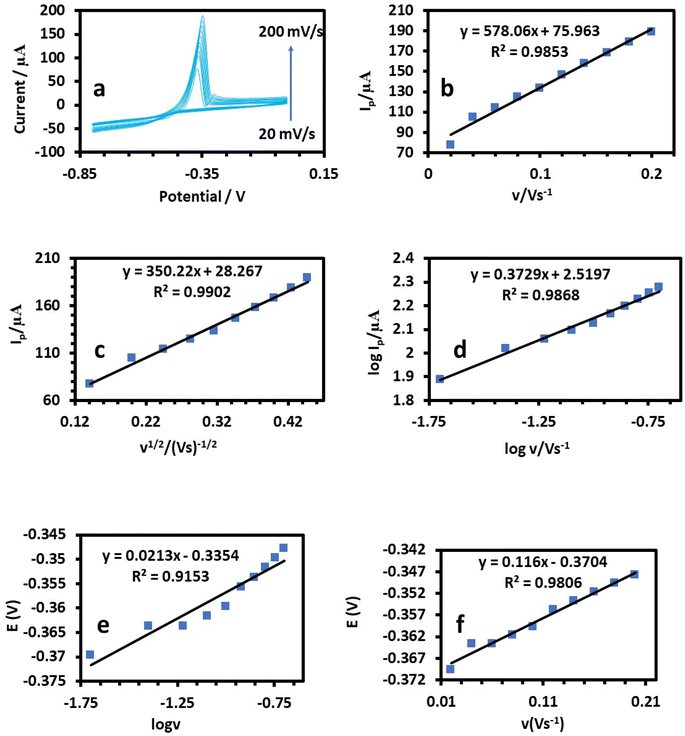
A linear relationship between log![[thin space (1/6-em)]](https://www.rsc.org/images/entities/char_2009.gif) Ip and log
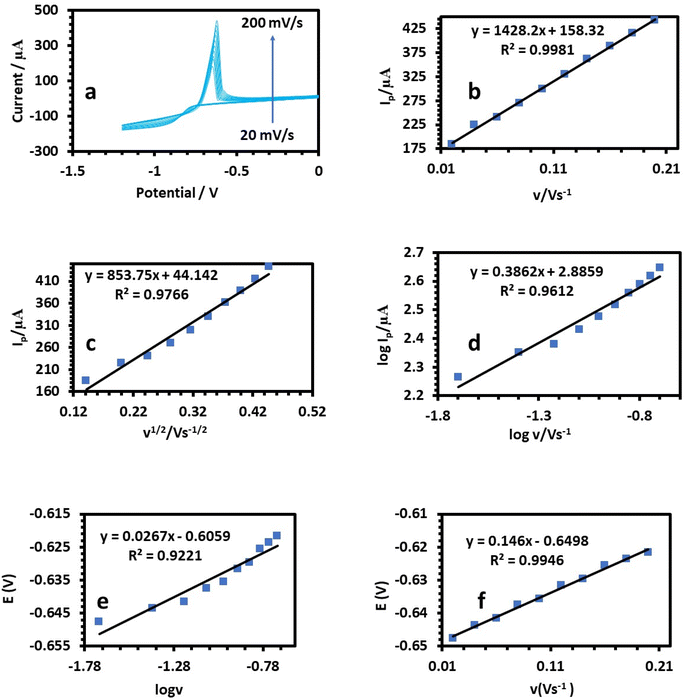
Ip and log![[thin space (1/6-em)]](https://www.rsc.org/images/entities/char_2009.gif) v was found (Fig. 8c, 9c, and 10c). For the current regulated only by diffusion, the slopes of 0.5654, 0.3729, and 0.3862 V s−1 in the figures were close to the value of 0.5 V s−1. Consequently, the I versus v1/2 curve was linear, most likely as a result of diffusion-controlled oxidation (Fig. 8d, 9d, and 10d). According to Laviron, the following equation defines Ep as an irreversible electrode process:
v was found (Fig. 8c, 9c, and 10c). For the current regulated only by diffusion, the slopes of 0.5654, 0.3729, and 0.3862 V s−1 in the figures were close to the value of 0.5 V s−1. Consequently, the I versus v1/2 curve was linear, most likely as a result of diffusion-controlled oxidation (Fig. 8d, 9d, and 10d). According to Laviron, the following equation defines Ep as an irreversible electrode process:
 | (3) |
![[thin space (1/6-em)]](https://www.rsc.org/images/entities/char_2009.gif) 480 C mol−1 were 2596, 2450, and 3760, respectively (Table 1).38 The plots of E of the analytes versus log
480 C mol−1 were 2596, 2450, and 3760, respectively (Table 1).38 The plots of E of the analytes versus log![[thin space (1/6-em)]](https://www.rsc.org/images/entities/char_2009.gif) v are shown in Fig. 8e, 9e, and 10e. The Bard and Faulkner equation39 was used to get the value of α:
v are shown in Fig. 8e, 9e, and 10e. The Bard and Faulkner equation39 was used to get the value of α:
 | (4) |
| Metal ion | α | n | K° |
|---|---|---|---|
| Cu(II) | 0.75 | 1.76–2 | 2596 |
| Pb(II) | 0.81 | 1.78–2 | 2450 |
| Cd(II) | 0.90 | 1.92–2 | 3760 |
| Metal ion | Scan rate (mV s−1) | Anodic peak potential, Epa (V) | Anodic peak current, Ipa (μA) | Square root of scan rate (υ1/2 s−1/2) | Diffusion coefficient (cm2 s−1) |
|---|---|---|---|---|---|
| Copper | 20 | 0.037 | 46.74 | 0.141 | 13.10 |
| 40 | 0.043 | 65.30 | 0.200 | 12.78 | |
| 60 | 0.045 | 79.07 | 0.244 | 12.50 | |
| 80 | 0.051 | 92.94 | 0.282 | 12.95 | |
| 100 | 0.053 | 104.9 | 0.316 | 13.20 | |
| 120 | 0.059 | 120 | 0.346 | 14.39 | |
| 140 | 0.063 | 133 | 0.374 | 15.15 | |
| 160 | 0.069 | 145.6 | 0.400 | 15.89 | |
| 180 | 0.073 | 158.6 | 0.424 | 16.76 | |
| 200 | 0.077 | 170.4 | 0.447 | 17.41 | |
| Lead | 20 | −0.369 | 77.39 | 0.141 | 63.21 |
| 40 | −0.363 | 104.6 | 0.200 | 57.74 | |
| 60 | −0.363 | 114.3 | 0.244 | 45.96 | |
| 80 | −0.361 | 124.9 | 0.282 | 41.16 | |
| 100 | −0.359 | 133.4 | 0.316 | 37.56 | |
| 120 | −0.355 | 146.8 | 0.346 | 37.91 | |
| 140 | −0.353 | 157.8 | 0.374 | 37.54 | |
| 160 | −0.351 | 168.3 | 0.400 | 37.37 | |
| 180 | −0.349 | 178.9 | 0.424 | 37.53 | |
| 200 | −0.347 | 189.1 | 0.447 | 37.74 | |
| Cadmium | 20 | −0.647 | 183.9 | 0.141 | 309.6 |
| 40 | −0.643 | 224.2 | 0.200 | 230.1 | |
| 60 | −0.641 | 240 | 0.244 | 175.77 | |
| 80 | −0.637 | 270 | 0.282 | 166.84 | |
| 100 | −0.635 | 299 | 0.316 | 163.7 | |
| 120 | −0.631 | 329.5 | 0.346 | 165.65 | |
| 140 | −0.629 | 361.2 | 0.374 | 170.62 | |
| 160 | −0.625 | 388.3 | 0.400 | 172.54 | |
| 180 | −0.623 | 415.5 | 0.424 | 175.6 | |
| 200 | −0.621 | 442.6 | 0.447 | 179.34 |
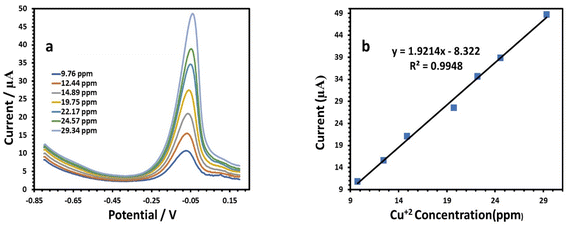
| I (μA), Cu = 1.9214C (ppm) − 8.322, (r = 0.9948) | (5) |
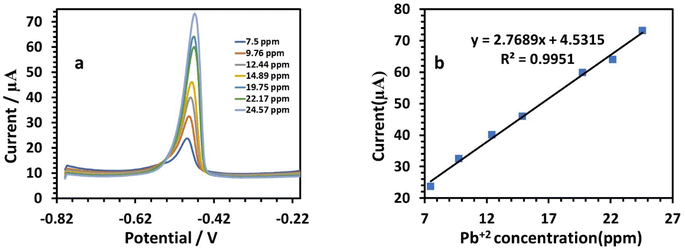
At a potential of approximately −0.09 V, the anodic behavior of Cu was visible, with a sensitivity of 1.9214 (Table 3). Fig. 12a illustrates the results for the determination of Pb(II) at the modified electrode. According to the amount of Pb, the peak current increased gradually when the potential was about −0.49 V, where the anodic peaks could be observed.39 The SWV responses of the modified HDBA/PL electrode to Pb(II) in the concentration range of 7.5 to 24.57 ppm (Table 3) are shown in Fig. 12b. The peak currents and concentrations were related by the following linear equation:
| I (μA), Pb = 2.7689C (ppm) + 4.5315, (r = 0.9951) | (6) |
| Metal ion | Cu(II) | Pb(II) | Cd(II) |
|---|---|---|---|
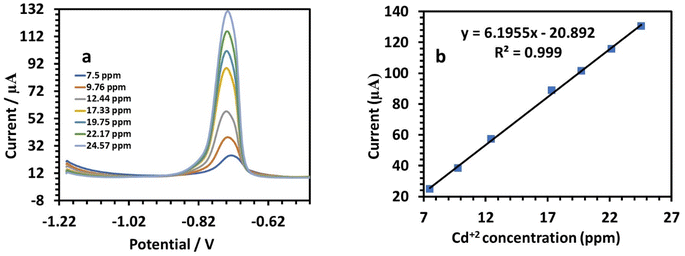
| Linearity range (ppm) | 9.76–29.34 | 7.5–24.57 | 7.5–24.57 |
| Slope of the calibration plot | 1.9214 | 2.7689 | 6.1955 |
| Intercept | −8.322 | 4.5315 | −20.892 |
| Correlation coefficient (r) | 0.9948 | 0.9951 | 0.999 |
The sensitivity was 2.7689. Fig. 13a shows the SWV responses of the modified electrode to Cd(II). The following is the linear equation for Cd(II) at a concentration of 7.5 to 24.57 ppm (Fig. 12b):
| I (μA), Cd = 6.1955C (ppm) − 20.892 (r = 0.999) | (7) |
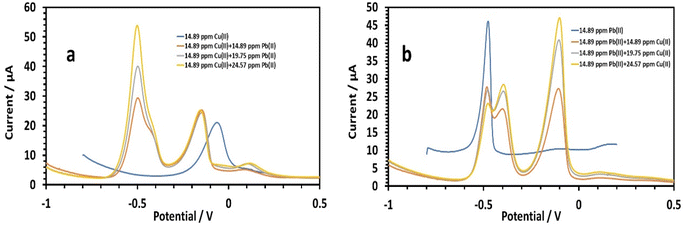
3.2.5.1 Simultaneous determination of copper and lead. To determine whether the presence of multiple cations has an effect, we tested the simultaneous detection of Cu2+ and Pb2+ in the same solution. First, the Cu2+ concentrations were set with varying the Pb2+ concentration, and vice versa44 (Fig. 14a and b). Lead's effect on 14.89 ppm copper in 0.1 M tris–HCl buffer was studied (Fig. 14a). The peak currents of Cu(II) were slightly enhanced by the increasing lead concentration (14.89,19.75, and 24.57 ppm). The following is the linear equation for Pb(II) with regard to concentrations of 14.89 to 24.57 ppm:26
| I (μA), Pb = 2.5212C (ppm) − 8.66, (r = 0.9941) | (8) |
The HDBA/PL electrode had a lower sensitivity to Pb(II) when copper was present as 2.5212, and a higher sensitivity without copper of 2.77. The oxidation of Pb–Cu intermetallic compounds could be noted by the shoulder peaks near Pb. Furthermore, the peak currents of copper marginally decreased from −0.8 to −0.17 V. The impact of copper on 14.89 ppm lead in 0.1 M tris–HCl buffer was next studied (Fig. 14b). The peak currents of Pb(II) were somewhat reduced with increasing the copper concentration (14.89, 19.75, and 24.57 ppm), while the two peaks at −0.41 and −0.48 V signified lead's two-step oxidation. The linear equation for Cu(II) in the concentration range of 14.89 to 24.57 ppm was as follows:
| I (μA), Cu = 2.0413C (ppm) − 1.8927, (r = 0.955) | (9) |
The HDBA/PL electrode had a higher sensitivity to Cu(II) when lead was present (2.0413) than for copper without lead (1.9214), because Cu depressed the Pb wave and caused the formation of Cu–Pb intermetallic complexes, and so the sensitivity for copper increased while the sensitivity for lead decreased. Cu's sensitivity was increased by the oxidation of the Cu–Pb intermetallic complexes, which took place close to Cu's square potential (II).
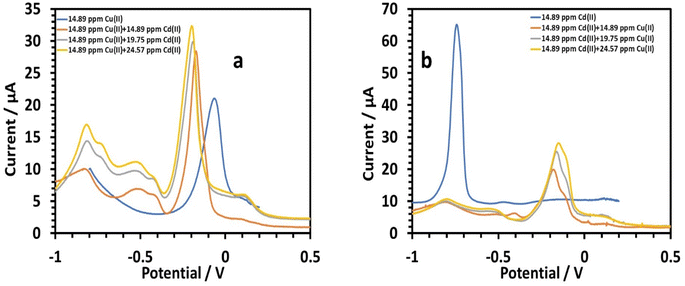
3.2.5.2 Simultaneous determination of copper and cadmium. Cadmium's effect on 14.89 ppm copper in 0.1 M tris–HCl buffer was investigated.45 The peak currents for Cu(II) were slightly increased as the cadmium concentration increased (14.89, 19.75, and 24.57 ppm). The linear equation for Cd(II) with regard to concentrations of 14.89 to 24.57 ppm was as follows:26
| I (μA), Cd = 0.6365C (ppm) + 1.5144, (r = 0.991) | (10) |
When copper was present, the HDBA/PL electrode had a lower sensitivity to Cd(II). The sensitivity to cadmium without copper was 6.1955. The emergence of a wide peak in between the two main peaks (Fig. 15a) might be caused by hydrogen evolution brought on by the catalytic action; on copper electrodes, it has been demonstrated that this can happen at potentials as high as 0.40 V. The shoulder peaks around Cd could be attributed to the oxidation of Cd–Cu intermetallic complexes. Also the change in the copper peaks to more negative values was also notable. Such a peak shift is a type change of the deposited phase's signature and a marker of evolution in the Cd–Cu phase diagram. Next, the impact of copper on 14.89 ppm of cadmium in 0.1 M tris–HCl buffer was investigated. Almost no Cd(II) stripping peaks were visible. This should be attributed to the formation of a Cd film on the surface of the modified electrode during the deposition process, since the electrode surface has a large affinity for Cd(II), which raises Cu's sensitivity. The following is the linear equation for Cu(II) with regard to concentrations of 14.89 to 24.57 ppm:26
| I (μA), Cu = 0.8568C (ppm) + 7.6392 (r = 0.9599) | (11) |
When cadmium was present, the HDBA/PL electrode showed lower a sensitivity to Cu(II) of 0.8568, whereas copper's sensitivity in a cadmium-free environment was 1.9214. The oxidation of Cu–Cd intermetallic complexes was responsible for the shoulder peaks close to Cu, while the emergence of a wide peak (Fig. 15b) in between the two main peaks might be caused by hydrogen evolution brought on by copper's catalytic activity.
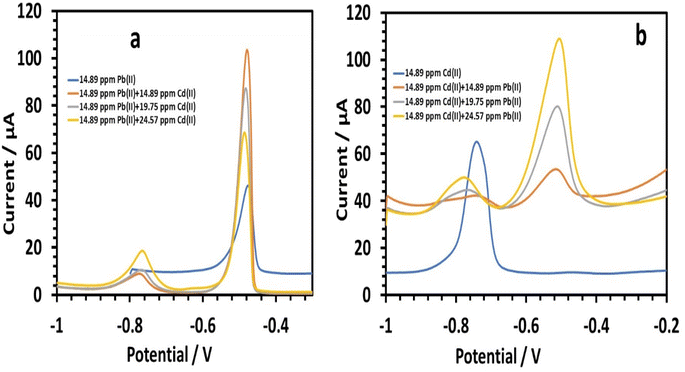
3.2.5.3 Simultaneous determination of lead and cadmium. Next, we investigated the impact of cadmium on 14.89 ppm lead in 0.1 M tris–HCl buffer. Varying the amounts of cadmium (14.89, 19.75, and 24.57 ppm) marginally increased the peak currents of Pb(II) (Fig. 16a). The following is the linear equation for Cd(II) with regard to concentrations of 14.89 to 24.57 ppm:26
| I (μA), Cd = 0.9738C (ppm) − 6.507, (r = 0.8601) | (12) |
When there was lead present, the HDBA/PL electrode showed a lower sensitivity to Cd(II). The sensitivity of cadmium without lead was 6.1955 versus 0.9738 with lead present. We investigated the impact of lead on 0.1 M tris–HCl buffer containing 14.89 ppm cadmium, with lead concentrations of 14.89, 19.75, and 24.57 ppm (Fig. 16b), and found the Cd(II) peak currents were only slightly diminished. The following is the linear equation with regard to concentrations of 14.89 to 24.57 ppm for Pb(II):26
| I (μA), Pb = 5.7362C (ppm) − 32.328, (r = 0.9994) | (13) |
The HDBA/PL electrode had a greater Pb(II) sensitivity when cadmium was present (5.7362), compared to without cadmium (2.7689). The cadmium peak was tilted more in the direction of negative values. Peak shifting is a type of change in the deposited phase's hallmark that denotes a progression in the Cd–Cu phase diagram. The effect of Cd on Pb(II) sensitivity was essentially nonexistent. Since there were no shoulder peaks, it could be concluded that the peak suppression of Cd by Pb was not caused by the intermetallic interference between Cd and Pb.46 Rather, the increased diffusivity and higher standard reduction potential of Pb(II) may be the cause.
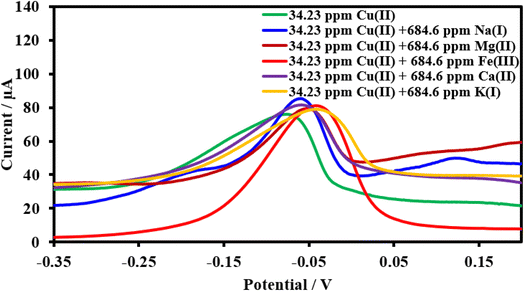 | ||
| Fig. 17 Square wave voltammograms of the HDBA/PL electrode with 34.23 ppm Cu(II), pH 6 in the absence and presence of the interfering metal ions Na1+, Mg2+, Fe2+, Ca2+, and K1+. | ||
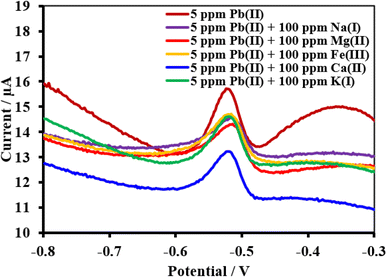 | ||
| Fig. 18 Square wave voltammograms of the HDBA/PL electrode with 34.23 ppm Pb(II), pH 3 in the absence and presence of the interfering metal ions Na1+, Mg2+, Fe2+, Ca2+, and K1+. | ||
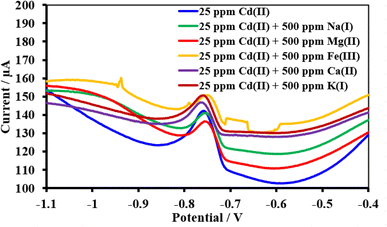 | ||
| Fig. 19 Square wave voltammograms of the HDBA/PL electrode with 34.23 ppm Cd(II), pH 5 in the absence and presence of the interfering metal ions Na1+, Mg2+, Fe2+, Ca2+, and K1+. | ||
| Interferences | Peak current change of Cu(II) (%) | Peak current change of Pb(II) (%) | Peak current change of Cd(II) (%) |
|---|---|---|---|
| Na1+ | +12.2 | −7.3 | −0.9 |
| Mg2+ | +4.5 | −9.0 | −4.0 |
| Fe+3 | +7.0 | −6.4 | +5.9 |
| Ca2+ | +7.3 | −15.9 | +3.0 |
| K1+ | +4.1 | −6.9 | +5.9 |
4. Conclusion
This article looked into the specific electrochemical behavior of Cu, Pb, and Cd using a simple HDBA/PL electrode. The described modified electrode greatly enhanced the electrochemistry of the metals and amply illustrated the remarkable HDBA/PL electrode's activity in terms of the anodic response to heavy metals. The electrochemical properties were computed for the apparent charge transfer rate constant, transfer coefficient, diffusion coefficient, and surface concentration of the electroactive species. Satisfactory analytical performance was obtained under the optimized experimental circumstances, including an adequate precision. The technique was efficient enough to analyze heavy metal contents at lower levels. Additionally, the suggested approach does not call for pricey equipment or essential analytical reagents.Conflicts of interest
The authors declare that they have no known competing financial interests or personal relationships that could have appeared to influence the work reported in this paper.Acknowledgements
The authors are thankful to the Deanship of Scientific Research at University of Bisha for supporting this work through the Fast-Track Research Support Program.References
- S. Palisoc, E. T. Lee, M. Natividad and L. Racines, Silver nanoparticle modified graphene paste electrode for the electrochemical detection of lead, cadmium and copper, Int. J. Electrochem. Sci., 2018, 13, 8854–8866, DOI:10.20964/2018.09.03.
- G. March, T. D. Nguyen and B. Piro, Modified electrodes used for electrochemical detection of metal ions in environmental analysis, Biosensors, 2015, 5, 241–275, DOI:10.3390/bios5020241.
- W. H. Elobeid and A. A. Elbashir, Development of chemically modified pencil graphite electrode based on benzo-18-crown-6 and multi-walled CNTs for determination of lead in water samples, 2019. http://www.pcbiochemres.com Search PubMed.
- G. Aragay and A. Merkoçi, Nanomaterials application in electrochemical detection of heavy metals, Electrochim. Acta, 2012, 84, 49–61, DOI:10.1016/j.electacta.2012.04.044.
- A. Waheed, M. Mansha and N. Ullah, Nanomaterials-based electrochemical detection of heavy metals in water: Current status, challenges and future direction, TrAC, Trends Anal. Chem., 2018, 105, 37–51, DOI:10.1016/j.trac.2018.04.012.
- K. B. Dönmez, E. Çetinkaya, S. Deveci, S. Karadağ, Y. Şahin and M. Doğu, Preparation of electrochemically treated nanoporous pencil-graphite electrodes for the simultaneous determination of Pb and Cd in water samples, Anal. Bioanal. Chem., 2017, 409, 4827–4837, DOI:10.1007/s00216-017-0426-3.
- W. Kang, X. Pei, C. A. Rusinek, A. Bange, E. N. Haynes, W. R. Heineman and I. Papautsky, Determination of Lead with a Copper-Based Electrochemical Sensor, Anal. Chem., 2017, 89, 3345–3352, DOI:10.1021/acs.analchem.6b03894.
- Y. Pu, Y. Wu, Z. Yu, L. Lu and X. Wang, Simultaneous determination of Cd2+ and Pb2+ by an electrochemical sensor based on Fe3O4/Bi2O3/C3N4 nanocomposites, Talanta Open, 2021, 3 DOI:10.1016/j.talo.2020.100024.
- I. B. Silva, D. M. de Araújo, M. Vocciante, S. Ferro, C. A. Martínez-Huitle and E. v. dos Santos, Electrochemical determination of lead using a composite sensor obtained from low-cost green materials: Graphite/cork, Appl. Sci., 2021, 11, 1–13, DOI:10.3390/app11052355.
- D. L. Vu, B. Ertek, Y. Dilgin and L. Červenka, Voltammetric determination of tannic acid in beverages using pencil graphite electrode, Czech J. Food Sci., 2015, 33, 72–76, DOI:10.17221/221/2014-CJFS.
- M. J. Shaw and J. Mertz, Electrocatalytic Reactions of a Manganese−Pyrylium Complex, Organometallics, 2002, 21, 3434–3442, DOI:10.1021/om020405n.
- S. Melhi, M. A. Bedair, E. H. Alosaimi, A. A. O. Younes, W. H. El-Shwiniy and A. M. Abuelela, Effective corrosion inhibition of mild steel in hydrochloric acid by newly synthesized Schiff base nano Co (II) and Cr (III) complexes: spectral, thermal, electrochemical and DFT (FMO, NBO) studies, RSC Adv., 2022, 12, 32488–32507, 10.1039/D2RA06571A.
- Z. I. Elbialy, M. M. Abdelsalam, A. M. Hassan, B. H. Heakal, M. A. Bedair and G. A. El Naeem, Green Synthesis, Spectral, Thermal Characterization and Biological Activity of Schiff base Ligand Derived from 3-amino-1,2,4-triazol and its Metal Complexes, Org. Med. Chem. Int. J., 2019, 8(3), 49–58, DOI:10.19080/OMCIJ.2019.08.555736.
- A. Hassan, B. Heakal, A. Younis, M. A. Bedair, Z. El - Billy and M. Mohamed, Synthesis of some triazole Schiff base derivatives and their metal complexes under Microwave irradiation and evaluation of their corrosion inhibition and biological activity, Egypt. J. Chem., 2019, 62(9), 1603–1624, DOI:10.21608/ejchem.2019.10834.1699.
- S. Palisoc, A. J. Gonzales, A. Pardilla, L. Racines and M. Natividad, Electrochemical detection of lead and cadmium in UHT-processed milk using bismuth nanoparticles/Nafion®-modified pencil graphite electrode, Sens. Bio-Sens. Res., 2019, 23, 100268, DOI:10.1016/j.sbsr.2019.100268.
- S. Kiranmai, C. Kuchi, B. Sravani, T. Ƚuczak, M. J. Kim, G. Madhavi and Y. Veera Manohara Reddy, Construction of ultrasensitive electrochemical sensor using TiO2-reduced graphene oxide nanofibers nanocomposite for epinephrine detection, Surf. Interfaces, 2022, 35, 102455, DOI:10.1016/J.SURFIN.2022.102455.
- B. Rajeswari, B. Sravani, M. Cheffena, R. Janraj Naik, Y. Veera Manohara Reddy, G. Madhavi, K. V. N. Suresh Reddy and M. Jong Kim, Ethylene glycol-assisted synthesis of reduced graphene oxide-supported bimetallic Pt-Co nanoparticles for the ultra-sensitive detection of tert-butyl hydroquinone, Inorg. Chem. Commun., 2023, 151, 110627, DOI:10.1016/J.INOCHE.2023.110627.
- F. Nourifard, M. Payehghadr, M. Kalhor and A. Nejadali, An Electrochemical Sensor for Determination of Ultratrace Cd, Cu and Hg in Water Samples by Modified Carbon Paste Electrode Base on a New Schiff Base Ligand, Electroanalysis, 2015, 27, 2479–2485, DOI:10.1002/elan.201500333.
- J. Y. Lu, Y. S. Yu, T. B. Chen, C. F. Chang, S. Tamulevičius, D. Erts, K. C. W. Wu and Y. Gu, Fabrication of an extremely cheap poly(3,4-ethylenedioxythiophene) modified pencil lead electrode for effective hydroquinone sensing, Polymers, 2021, 13, 1–14, DOI:10.3390/polym13030343.
- M. A. Bedair, S. A. Soliman, M. A. Hegazy, I. B. Obot and A. S. Ahmed, Empirical and theoretical investigations on the corrosion inhibition characteristics of mild steel by three new Schiff base derivatives, J. Adhes. Sci. Technol., 2019, 33, 1139–1168, DOI:10.1080/01694243.2019.1582889.
- T. M. Elmorsi, T. S. Aysha, M. B. Sheier and A. H. Bedair, Synthesis, Kinetics, and Equilibrium Study of Highly Sensitive Colorimetric Chemosensor for Monitoring of Copper Ions based on Benzo[f]fluorescein Dye Derivatives, Z. Anorg. Allg. Chem., 2017, 643, 811–818, DOI:10.1002/zaac.201700112.
- M. S. Bashandy, F. A. Mohamed, M. M. El-Molla, M. B. Sheier and A. H. Bedair, Synthesis of Novel Acid Dyes with Coumarin Moiety and Their Utilization for Dyeing Wool and Silk Fabrics, Open J. Med. Chem., 2016, 06, 18–35, DOI:10.4236/ojmc.2016.61002.
- P. J. Mafa, A. O. Idris, N. Mabuba and O. A. Arotiba, Electrochemical co-detection of As(III), Hg(II) and Pb(II) on a bismuth modified exfoliated graphite electrode, Talanta, 2016, 153, 99–106, DOI:10.1016/j.talanta.2016.03.003.
- P. Y. Khashaba, H. R. H. Ali and M. M. El-Wekil, Highly sensitive and selective complexation based voltammetric methods for the analysis of rabeprazole sodium in real samples, RSC Adv., 2017, 7, 3043–3050, 10.1039/c6ra25565e.
- M. A. Mohamed, A. M. Yehia, C. E. Banks and N. K. Allam, Novel MWCNTs/graphene oxide/pyrogallol composite with enhanced sensitivity for biosensing applications, Biosens. Bioelectron., 2017, 89, 1034–1041, DOI:10.1016/j.bios.2016.10.025.
- Q.-X. Zhang, H. Wen, D. Peng, Q. Fu and X.-J. Huang, Interesting interference evidences of electrochemical detection of Zn(II), Cd(II) and Pb(II) on three different morphologies of MnO2 nanocrystals, J. Electroanal. Chem., 2015, 739, 89–96, DOI:10.1016/j.jelechem.2014.12.023.
- M. A. Abbas, E. I. Arafa, M. A. Bedair, A. S. Ismail, O. E. El-Azabawy, S. A. Baker and H. I. Al-Shafey, Synthesis, Characterization, Thermodynamic Analysis and Quantum Chemical Approach of Branched N, N′-bis(p-hydroxybenzoyl)-Based Propanediamine and Triethylenetetramine for Carbon Steel Corrosion Inhibition in Hydrochloric Acid Medium, Arabian J. Sci. Eng., 2022 DOI:10.1007/s13369-022-07520-y.
- M. A. Bedair, A. M. Abuelela, M. Alshareef, M. Owda and E. M. Eliwa, Ethyl ester/acyl hydrazide-based aromatic sulfonamides: facile synthesis, structural characterization, electrochemical measurements and theoretical studies as effective corrosion inhibitors for mild steel in 1.0 M HCl, RSC Adv., 2023, 13, 186–211, 10.1039/D2RA05939H.
- M. A. Bedair, H. M. Elaryian, E. S. Gad, M. Alshareef, A. H. Bedair, R. M. Aboushahba and A. E.-A. S. Fouda, Insights into the adsorption and corrosion inhibition properties of newly synthesized diazinyl derivatives for mild steel in hydrochloric acid: synthesis, electrochemical, SRB biological resistivity and quantum chemical calculations, RSC Adv., 2023, 13, 478–498, 10.1039/D2RA06574F.
- M. A. Bedair, H. M. Elaryian, A. H. Bedair, R. M. Aboushahba, A. El-Aziz and S. Fouda, Novel coumarin-buta-1,3-diene conjugated donor–acceptor systems as corrosion inhibitors for mild steel in 1.0 M HCl: Synthesis, electrochemical, computational and SRB biological resistivity, Inorg. Chem. Commun., 2023, 148, 110304, DOI:10.1016/j.inoche.2022.110304.
- M. K. Goshisht, G. K. Patra and N. Tripathi, Fluorescent Schiff base sensors as a versatile tool for metal ion detection: strategies, mechanistic insights, and applications, Mater. Adv., 2022, 3, 2612–2669, 10.1039/d1ma01175h.
- J. Wang, B. Qian, T. Wang, Y. Ma, H. Lin, Y. Zhang, H. Lv, X. Zhang, Y. Hu, S. Xu, F. Liu, H. Li and Z. Jiang, Nontoxic Tb3+-induced hyaluronic nano-poached egg aggregates for colorimetric and luminescent detection of Fe3+ ions, RSC Adv., 2022, 12, 22285–22294, 10.1039/d2ra03871d.
- M. Ibrahim, H. Ibrahim, N. Almandil and A.-N. Kawde, Gold nanoparticles/f-MWCNT nanocomposites modified glassy carbon paste electrode as a novel voltammetric sensor for the determination of cyproterone acetate in pharmaceutical and human body fluids, Sens. Actuators, B, 2018, 274, 123–132, DOI:10.1016/j.snb.2018.07.105.
- W. Wei Zhu, N. Bing Li and H. Qun Luo, Anodic Stripping Voltammetry Determination of Pb(II) and Cd(II) at a Bismuth/Poly(aniline) Film Electrode, Anal. Lett., 2006, 39, 2273–2284, DOI:10.1080/00032710600755538.
- L. Mei Niu, H. Qun Luo and N. Bing Li, Electrochemical Behavior of Epinephrine at a Meso-2,3-Dimercaptosuccinic Acid Self-Assembled Gold Electrode and Its Analytical Application, Anal. Lett., 2006, 39, 145–159, DOI:10.1080/00032710500423468.
- N. M. Thanh, N. van Hop, N. D. Luyen, N. H. Phong, T. T. T. Toan and H. D. Mai, Simultaneous Determination of Zn(II), Cd(II), Pb(II), and Cu(II) Using Differential Pulse Anodic Stripping Voltammetry at a Bismuth Film-Modified Electrode, Adv. Mater. Sci. Eng., 2019, 2019, 1826148, DOI:10.1155/2019/1826148.
- J. I. Gowda and S. T. Nandibewoor, Electrochemical Behavior of 4-Aminophenazone Drug at a Graphite Pencil Electrode and Its Application in Real Samples, Ind. Eng. Chem. Res., 2012, 51, 15936–15941, DOI:10.1021/ie302501f.
- J. I. Gowda and S. T. Nandibewoor, Simultaneous electrochemical determination of 4-aminophenazone and caffeine at electrochemically pre-treated graphite pencil electrode, Anal. Methods, 2014, 6, 5147–5154, 10.1039/c4ay00467a.
- N. P. Shetti, S. J. Malode and S. T. Nandibewoor, Electro-oxidation of captopril at a gold electrode and its determination in pharmaceuticals and human fluids, Anal. Methods, 2015, 7, 8673–8682, 10.1039/C5AY01619C.
- L. Fotouhi, A. B. Hashkavayi and M. M. Heravi, Electrochemical behaviour and voltammetric determination of sulphadiazine using a multi-walled carbon nanotube composite film-glassy carbon electrode, J. Exp. Nanosci., 2013, 8, 947–956, DOI:10.1080/17458080.2011.624554.
- Z. Husain, A. R. Shakeelur Raheman, K. B. Ansari, A. B. Pandit, M. S. Khan, M. A. Qyyum and S. S. Lam, Nano-sized mesoporous biochar derived from biomass pyrolysis as electrochemical energy storage supercapacitor, Mater. Sci. Energy Technol., 2022, 5, 99–109, DOI:10.1016/j.mset.2021.12.003.
- Y. K. Weng, A. R. M. Rosli and F. Yusoff, Magnetite graphene for electrochemical determination of uric acid, Malaysian Journal of Analytical Sciences, 2019, 23, 407, DOI:10.17576/mjas-2019-2303-05.
- F. Bai, X. Zhang, X. Hou, H. Liu, J. Chen and T. Yang, Individual and Simultaneous Voltammetric Determination of Cd(II), Cu(II) and Pb(II) Applying Amino Functionalized Fe3O4 Carbon Microspheres Modified Electrode, Electroanalysis, 2019, 31, 1465–1474, DOI:10.1002/elan.201900234.
- S. M. Seck, S. Charvet, M. Fall, E. Baudrin, M. Lejeune and M. Benlahsen, Detection of Cadmium and Copper Cations Using Amorphous Nitrogenated Carbon Thin Film Electrodes, Electroanalysis, 2012, 24, 1839–1846, DOI:10.1002/elan.201200219.
- C. Babyak and R. B. Smart, Electrochemical detection of trace concentrations of cadmium and lead with a boron-doped diamond electrode: Effect of KCl and KNO3 electrolytes, interferences and measurement in river water, Electroanalysis, 2004, 16, 175–182, DOI:10.1002/elan.200302794.
- A. Afkhami, M. Soltani-Shahrivar, H. Ghaedi and T. Madrakian, Construction of Modified Carbon Paste Electrode for Highly Sensitive Simultaneous Electrochemical Determination of Trace Amounts of Copper (II) and Cadmium (II), Electroanalysis, 2016, 28, 296–303, DOI:10.1002/elan.201500308.
- P. Kumari, V. Lather, S. Khatri, P. Ahlawat, H. Sehrawat, S. P. Khatkar, V. B. Taxak and R. Kumar, Computational analysis, Urbach energy and Judd-Ofelt parameter of warm Sm3+ complexes having applications in photovoltaic and display devices, RSC Adv., 2022, 12, 35827–35848, 10.1039/d2ra05796d.
- A. Höing, R. Struth, C. Beuck, N. Rafieiolhosseini, D. Hoffmann, R. H. Stauber, P. Bayer, J. Niemeyer and S. K. Knauer, Dual activity inhibition of threonine aspartase 1 by a single bisphosphate ligand, RSC Adv., 2022, 12, 34176–34184, 10.1039/d2ra06019a.
| This journal is © The Royal Society of Chemistry 2023 |


