 Open Access Article
N-Phenyl acrylamide-incorporated porous silica-bound graphene oxide sheets with excellent removal capacity for Cr(III) and Cr(VI) from wastewater
Musa Khana,
Faiz Ali *a,
Saba Ramzanb and
Zeid A. AlOthman
 c
c
aDepartment of Chemistry, University of Malakand, Chakdara Dir(L), KPK, Pakistan. E-mail: faizy186@gmail.com
bFaculty of Basic and Applied Sciences, Department of Chemistry, University of the Poonch, Rawalakot, AJK, Pakistan
cDepartment of Chemistry, College of Science, King Saud University, Riyadh 11451, Saudi Arabia
First published on 30th May 2023
Abstract
The sophisticatedly altered Hummer's and sol–gel procedures were applied for the synthesis of graphene oxides and porous silica monolith particles respectively. The Fischer esterification protocol was used for coupling silica monoliths with graphene oxides. A N-phenyl acrylamide-incorporated porous polymer was synthesized at the surface of composites via reversible addition fragmentation chain transfer polymerization. The composition was confirmed by Fourier transform infra-red spectroscopy, FE-SEM, X-ray diffraction, zeta potential (zeta pH), Brunauer–Emmett–Teller (BET/BJH) analysis, and EDAX analysis. The resulting polymer-bound composite efficiently removed Cr(VI) and Cr(III) from waste water. Adsorption parameters such as contact time, pH effect, temperature, and adsorbent and adsorbate concentration were optimized for the optimal output of the composite. The kinetic and equilibrium models were applied to the adsorption of Cr(VI) and Cr(III) at the adsorbent surface. The maximum adsorption capacity (qe) of Cr(VI) and Cr(III) was found to be 298.507 mg g−1 and 401.874 mg g−1, respectively, using the same initial concentration of Cr(VI) and Cr(III) [10–60 ppm]. The adsorption data of both states of the Cr-metal followed the pseudo 2nd-order kinetic model with regression values of 0.996 ∼ Cr(VI) and 0.999 ∼ Cr(III) at ambient temperature. Similarly, the adsorption data of Cr(VI) best fit into the Langmuir adsorption isotherm (R2 = 0.972) while that of Cr(III) followed the Freundlich model (R2 = 0.983).
Introduction
Air and water are necessary for the sustainability of life. The presence of toxic metals in different water bodies is life-threatening and their elimination is tremendously important.1 In view of the guidelines of the Environmental Protection Agency (EPA), the two oxidation states of chromium metal, namely, VI and III present in the aquatic environment are very toxic.2 To date, the reported sources of chromium are industries such as textiles, mining, papers, aluminium casting, inks, electroplating, cement, inorganic chemicals, steel fabrication, paints, metal cleaning, and fertilizers.3 Various health issues are caused by water contamination with toxic metals, for which the permissible limit is only few nanograms or picograms.4 The minimal standard reported/set by the Ministry of Environment and Forests (Government of India) for the safe effluent discharge of Cr(VI) from industries is less than 0.1 mg L−1.5 The increase in the amount of Cr(VI) in different water bodies, which might cause diseases such as skin irritation, carcinomas, liver damage, and pulmonary blocking, is a major concern across the globe.6 Its salts are highly water soluble at all pH values.Cr(VI) exist as hydrogen chromate HCrO42− at pH 1 and 6 in solutions and as chromate CrO42− at a pH higher than 7. Similarly, it exists in the form of chromate, hydrogen chromate, and dichromate (Cr2O72−) at normal pH.7 Various techniques are available for the removal of Cr(III) and Cr(VI) from wastewater including membrane filtration,8 electro-deposition,9 ion-exchange,10 biological treatment processes,11 and adsorption.12 However, all these techniques are not widely used due to their respective disadvantages such as involvement of expensive equipment, incomplete removal of metals, and generation of toxic impurities and their monitoring.13 Adsorption is a reliable, inexpensive, easy, and effective technique for the removal of heavy metals from industrial effluents.14 The comparison of various wastewater treatment techniques along with their relative advantages and disadvantages is given in Table 1.14–25 Metal organic frameworks (MOFs) are a class of recently available adsorbent materials, but they have limited practicability in the treatment of water because of their intrinsically fragile nature and poor processing.26 Cr(III) is stable in a reducing environment, where it is present in cationic form Cr(OH)2+ at pH 4 to 8. Cr(III) was removed from waste water by a chemical precipitation method, which can reduce the Cr(III) concentration down to 20 mg L−1 from 300 mg L−1 or an even higher concentration. The adsorption capability of carbon-based materials toward heavy metals is low due to the presence of limited functional groups.27 Zinc oxide (ZnO) with high energy nanosheets of different surface sizes was used as an efficient photocatalyst for the simultaneous adsorption of Cr(III) and reduction of Cr(IV). The application of ZnO was limited due to the availability of already low-energy materials.28
| Water treatment technology | Examples | Advantages | Disadvantages |
|---|---|---|---|
| Precipitation/coagulation | Mg/Al/Si/Fe pre-polymerized coagulants (Tolkou et al., 2019)14 | • Mostly used and established techniques | • pH of the water must be imperative |
| • Highly efficient | • High maintenance and expensive | ||
| • More effective techniques for large scale water treatment | • Formation of by products and sludge | ||
| Electrochemical | Ti4O7 membrane anode (Le et al., 2019)15 | • Highly efficient | • The electrode can break down over time |
| SnO2/RuO2 nanofibers (Kim et al., 2019)16 | • Highly selective | • Requires high maintenance | |
| • Reduced risk of secondary pollutant | Wastewater must be highly conductive | ||
| Biological treatment | Membrane bioreactor17 (Luo et al., 2014)18 | • Low operational cost | • Sludge production |
| Aerobic granules (Zhang et al., 2016)19 | • Efficient degradation | Emission of greenhouse gases | |
| • Handling of large volumes of water | |||
| Ion exchange | Polyaniline Zr(IV) iodate nanocomposite | • Easy operation | • Due to cost of resins it is expensive |
| (Khan, 2020) Cu2+-MOF | • Highly selective | • Operational only | |
| (Shao et al., 2019 (ref. 20) | • Highly efficient | • The presence of other ions hindered the efficiency | |
| Microwave catalysis | CuO/CeO2 catalyst (Xu et al., 2014)21 | • With reduced time of reaction | • It requires high power input |
| Carbon sphere templated Ce/LaCo0.5Cu0.5O3 catalyst (Wang et al., 2020)22 | • With efficient degradation | • It requires a catalyst of microwave absorbing | |
| Membrane filtration | Amyloid–carbon hybrid membrane (Bolisetty and Mezzenga, 2016)23 | • Efficient degradation | • Have reduced flow rates |
| (CuFe2O4)@CNT membrane (Luan et al., 2019)24 | • Automated operation | • Closing the pores easily | |
| • At low temperature operational | • Requires enough maintenance | ||
| Adsorption | MIEX resin (Yang et al., 2020b)25 | • Low energy demands | • It required pH adjustment |
| Composite and polymers (current study) | • An efficient and highly reliable techniques | • Sludge and by-product formation | |
| • Recyclable and effective | • Declines progressively by recyclization | ||
| • Having wide choice of adsorbents |
Quite enough literature is available on the adsorption of Cr(III) and Cr(VI).29–31 Graphene oxide (GO)-based composite derivatives are effective adsorbent materials due to the high negative charge density, large surface area, and the presence of hydroxyl, epoxy, and carboxylic functional groups.32 Despite these properties, the direct use of GO as an adsorbent material will not be a wise approach owing to the presence of oxygen-containing functional groups. The oxygen-containing functional groups act as the hard ligand.33 The hard ligands have very limited ability to adsorb the metals/pollutants from industrial effluents in the absence of other groups.34 Further, when the GO is used alone as an adsorbent material, its separation from the effluents during the centrifugation process is difficult.35 Thus, several GO-based composite adsorbent materials have been synthesized for the separation of different pollutants/metals from waste water.36–39 The GO-derived materials can easily be synthesized owing to the modification capability of the GO. The functional groups of GO react with the functional groups (–NH2, –SH, –COOH, and –OH) of other materials such as silica and the resulting materials can be used for the enhanced adsorption of the target pollutants/metals present in effluents.40
Silica-based composites are stable and aqua-friendly materials and can be used as efficient adsorbents for the removal of heavy metals.41 Broad dimensions (large surface area and wide pore size) of the silica-based adsorbents are effective for the improved adsorption of heavy metals.42 The presence of silanol groups at the silica surface makes it susceptible for the composite and polymer formation when coupled with other materials.43,44
Various raw materials were used to prepare more efficient multifunctional adsorbents for the effective removal of pollutants from industrial effluents. Various functional groups present at the surface of GO (COC, OH, and COOH) enable it to bind chemically with other materials. The unfunctionalized GO is unstable which makes its recovery difficult after application. The unmodified GO may cause issue in centrifugation and block pores of filter papers during filtration. The binding of monolithic silica into the sheets of GO increases its stability and can easily be handled.45,46 The adsorption capability of silica composite materials toward heavy metals is quite higher due to large surface/volume ratio and large pore size.
In the current study, silica monolith-bound GO was synthesized by the modified Fischer esterification protocol using silica monoliths and GOs. The composite was subjected to reversible addition fragmentation chain transfer (RAFT) polymerization using N-phenyl acrylamide as the monomer. The resulting organic–inorganic hybrid material was used as an effective adsorbent for the removal of Cr(VI) and Cr(III) due to the large surface area (264.899 m2 g−1), wide pore size, and presence of multiple functional groups. The adsorption capacity in terms of KF values for Cr(III) and Cr(VI) is 138.653 mg g−1 and 401.874 mg g−1 respectively. The GO not only provides different functional groups but also reduces Cr(VI) into Cr(III). The philosophy behind the development of the composite in the current project is the preparation of an adsorbent material with multifactor characteristics contributing towards very efficient adsorption of heavy metals such as Cr(VI) and Cr(III) and the application of such a robust adsorbent material in real water samples collected from different sources. The resulting polymer-bound composite sheets came out to be very efficient adsorbent materials for the removal of Cr(III) and Cr(VI) from industrial effluents.
Materials and methods
Chemicals and materials
Analytical grade chemicals were used. K2CrO4 (Mol wt 194.17 g mol−1) and CrCl3 (Mol wt 158.49 g mol−1) obtained from Sigma Aldrich were used as the precursors/sources of Cr(VI) and Cr(III) respectively. Urea, glacial acetic acid, and polyethylene glycol (PEG) standard were purchased from Sigma Aldrich, which were used for the synthesis of silica monoliths without further purification. N-Phenyl acrylamide, NaOH, HCl (37%), NaNO3, H2O2, and KMnO4 were purchased from Sigma Aldrich. The reagents of Briton Robinson buffer, H3BO3 (China), H3PO4, and CH3COOH (Sigma Aldrich) were used for the desired pH adjustment of different solutions.Instrumentation
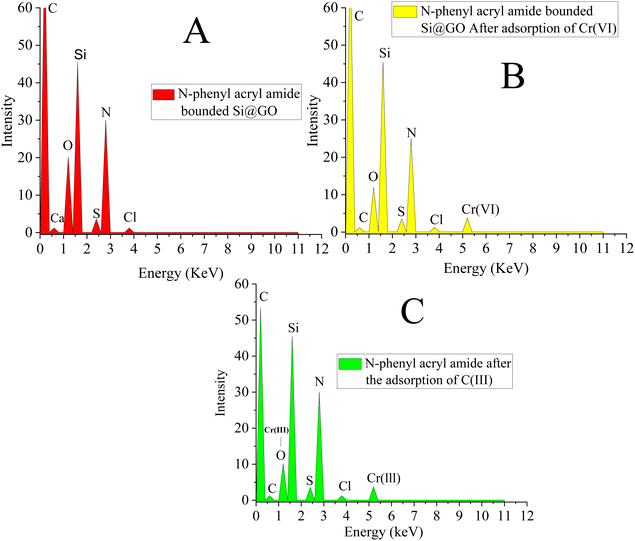
Atomic absorption spectrophotometry (model-1601 from Shimadzu Japan) was performed for the detection and measurement of Cr(VI) and Cr(III). A hot plate/magnetic stirrer (Irmico, Germany), 0–2000 rpm, 285–600 °C, was used for stirring and heating. A muffle furnace (Germany, Nabertherm) at 550 °C was used for the calcination of monolithic silica to remove the impurities before reacting with GO. A centrifuge (Witeg, Germany) was used for the centrifugation of adsorbents. A pH meter (Hanna, USA) was used for pH measurement, and a sonicator (South Korean, Power sonic-405) was also employed in the current study. The shaking processes were carried out using an Orbital shaker (Taiwan).The successful synthesis of N-phenyl acrylamide-incorporated porous silica-bound graphene oxide sheets was confirmed by field emission scanning electron microscopy (FE-SEM), Fourier transform infrared (FTIR) spectroscopy, Brunauer–Emmett–Teller (BET) analysis, zeta potential (zeta pH), energy-dispersive X-ray (EDX) spectroscopy and X-ray diffraction (XRD) analysis. The adsorption of Cr(VI) and Cr(III) was confirmed by BET analysis, EDX spectroscopy, and Ultra violet (UV)-visible spectrophotometry.
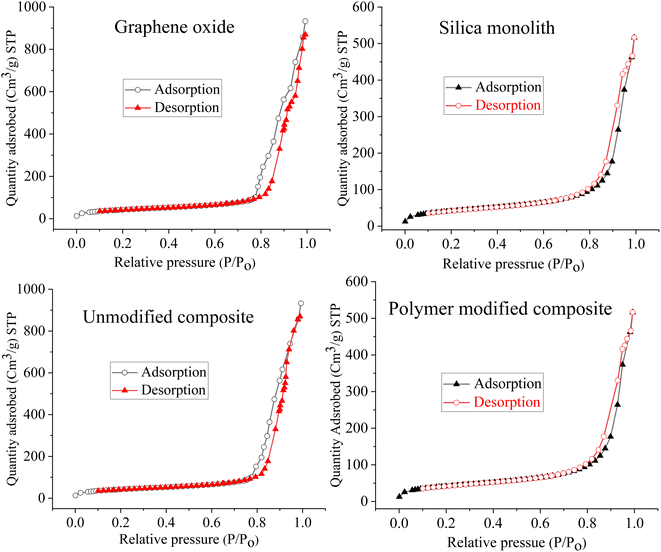
The BET isotherm linear plots were constructed by the techniques making use of the nitrogen adsorption–desorption on the surface of the polymer materials. The specific surface area and BET pore size distribution of the materials using the Mesh No. 16 American standard and testing materials [ASTM E:11] were carried out using a volumetric gas adsorption instrument (e series, 2000, Quanta chrome NOVA, USA) with nitrogen as the adsorption gas. The adsorption was carried out at a relative pressure of P/P0 = 0.96 at 75.4 K using nitrogen gas. For the accurate measurement of pore size, pore volume, and surface area, the resulting polymer materials were vacuum heated at 100 °C for 8 h to remove the moisture adsorbed at the composite surface.47 Excalibur spectrometer fitted with a standard detector was used for the FTIR study. KBr pellets were applied for the analysis of different functional groups located at the surface of GO, silica monoliths, silica-bound GO, and polymer-bound composites. The subsequent spectra with 5 cm−1 resolution in the frequency region from 4000 to 400 cm−1 were recorded in accordance with ref. 48. A Nano tract II Zeta analyser was used for the zeta potential measurement of the polymer-bound composite, silica monolith, and GO suspended in water. The suspension of the sample was filled in the zeta cell after cleaning the cell with paper. The zeta cell was taken in a zeta analyzer (nano trac II zeta analyzer, U zeta cell USA). The analysis of all the samples was performed at equilibration for 3 min with a manual 100 nV applied voltage at a temperature of 0.4 °C.49,50
Synthesis of silica particles and graphene oxide sheets
The sophisticatedly altered sol–gel protocol reported by Ali et al.51 was used for the synthesis of silica particles having a monolithic architecture. First, 1650 mg PEG and 1620 mg urea were taken in a Teflon vial containing 15 mL (0.01 molar) acetic acid solution. The mixture was kept under stirring conditions for 15 min preferably below 4 °C. Then, 5 mL of the silica precursor trimethoxy silane (TMOS) was added to the mixture and stirred for 50 min. The resulting mixture was heat treated at 40 °C for 40 h in a Lc oven followed by heating in an autoclave using a GC oven at 125 °C for 30. The excess water produced during sol–gel process was decanted off. The resulting silica monolith was vacuumed dried at 60 °C for 25 h. The silica was grounded using a mortar and pestle for 12 min and finally calcined in a muffle furnace at 400 °C.The altered Hummer's protocol was used for the synthesis of GO sheets, whereby a mixture of sodium nitrate (2.00 mg) and graphite powder (3.00 mg) were taken in 70 mL H2SO4 (98%). The reaction mixture was taken in a 500 mL two-necked round-bottomed flask and its temperature was kept below 20 °C.52 The powdered KMnO4 (10 mg) was added to the reaction mixture and stirred for 3 h. The reaction mixture was kept under stirring for 3 h in an oil bath at 40 °C. Distilled water (40 mL) was added dropwise to the solution through dropping funnels. The solution colour was changed from dark to yellow. H2O2 was added to the reaction mixture and stirred for 3 h. The GO sheets were obtained after cooling and filtration, and washed with HCl/2-propanol/water (1![[thin space (1/6-em)]](https://www.rsc.org/images/entities/char_2009.gif) :
:![[thin space (1/6-em)]](https://www.rsc.org/images/entities/char_2009.gif) 1
1![[thin space (1/6-em)]](https://www.rsc.org/images/entities/char_2009.gif) :
:![[thin space (1/6-em)]](https://www.rsc.org/images/entities/char_2009.gif) 10 v/v%).53
10 v/v%).53
Silica-bound graphene oxide sheets
The silica and graphene oxide were used as the raw materials in a 3![[thin space (1/6-em)]](https://www.rsc.org/images/entities/char_2009.gif) :
:![[thin space (1/6-em)]](https://www.rsc.org/images/entities/char_2009.gif) 1 proportion in the synthesis of silica-anchored GO by the Fisher esterification protocol. The silica monolith (0.32 g) was dispersed in distilled water (50 mL) and graphene oxide (0.11 g) was dispersed in distilled water (100 mL) followed by sonication for 40 minutes. The two suspensions were mixed in a round-bottomed flask (500 mL) with the addition of 1.0 mL H2SO4 (98%). The whole mixture was heated at 100 °C for 24 h under reflux conditions.54 The reaction mechanisms are illustrated in Fig. 1.
1 proportion in the synthesis of silica-anchored GO by the Fisher esterification protocol. The silica monolith (0.32 g) was dispersed in distilled water (50 mL) and graphene oxide (0.11 g) was dispersed in distilled water (100 mL) followed by sonication for 40 minutes. The two suspensions were mixed in a round-bottomed flask (500 mL) with the addition of 1.0 mL H2SO4 (98%). The whole mixture was heated at 100 °C for 24 h under reflux conditions.54 The reaction mechanisms are illustrated in Fig. 1.
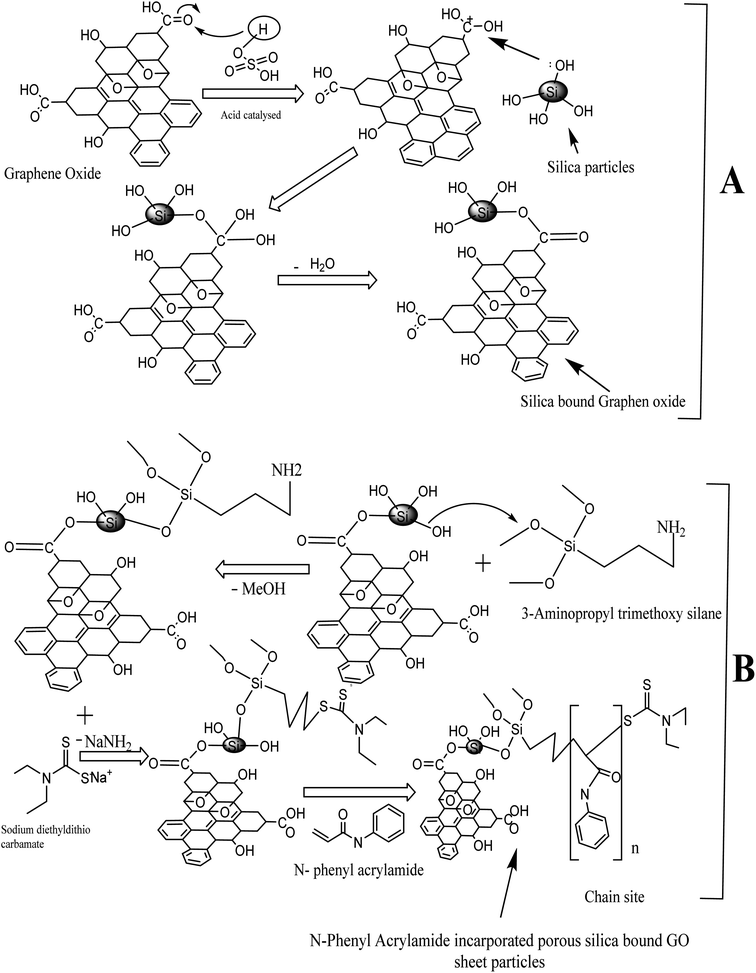 | ||
| Fig. 1 Scheme of synthesis: (A) silica-bound graphene oxides and (B) N-phenyl acrylamide-modified silica-bound graphene oxides. | ||
Synthesis of polymer-bound composites
An initiator-bound silica-anchored GO was synthesized by refluxing the silica-anchored GO materials taken in 25 mL toluene and a solution of 3-amino propyl trimethoxy silane (3 mL) in 5 mL toluene (anhydrous). The reaction mixture was refluxed at 110 °C for 48 h in a N2-purging environment. The product was repeatedly washed with toluene and acetone, filtered, and dried at ambient temperature overnight.The ligand-loaded silica@GO particles were suspended in dimethyl formamide and subjected to the reflux condensation at 54 °C for 20 h. Meanwhile, a solution containing sodium diethyldithiocarbamate (900 mg) in 10 mL dimethyl formamide was slowly added to the reaction mixture under reflux conditions. The resulting product was washed with DMF followed by the mixture containing methanol/water (60![[thin space (1/6-em)]](https://www.rsc.org/images/entities/char_2009.gif) :
:![[thin space (1/6-em)]](https://www.rsc.org/images/entities/char_2009.gif) 40 v/v%) and finally with acetone. The product was filtered and dried overnight in a vacuum desecrator.
40 v/v%) and finally with acetone. The product was filtered and dried overnight in a vacuum desecrator.
Finally, 5 mL N-phenyl acrylamide dissolved in 10 mL toluene was added slowly to the reaction mixture containing the initiator-loaded silica@GO (600 mg) dispersed in 40 mL toluene in a round-bottomed flask. RAFT polymerization was carried out at 110 °C under reflux conditions for 15 h in a nitrogen purging environment.55–58 The resulting N-phenyl acrylamide-modified silica@GO was washed with acetone and dried at 65 °C overnight. The scheme of polymer synthesis is illustrated in Fig. 1.
Batch adsorption, isotherm, and kinetic studies
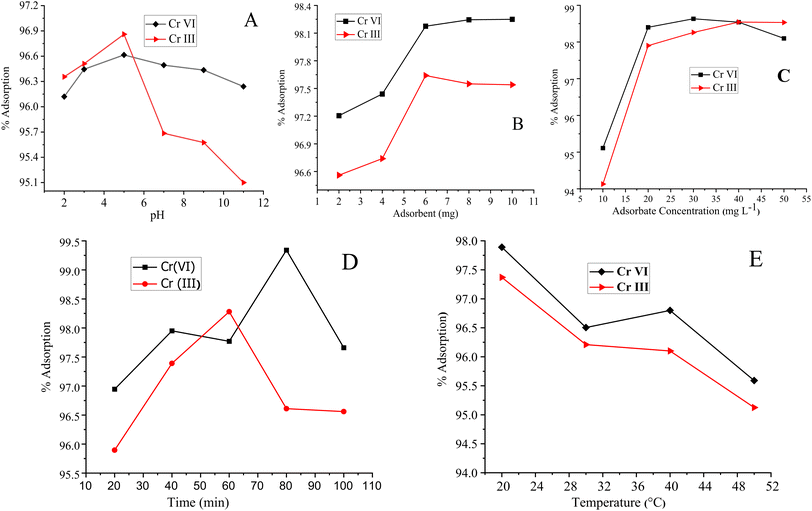
The adsorption efficiency of N-phenyl acrylamide-modified silica@GO was evaluated for the removal of Cr(III) and Cr(VI) from various effluents. The optimization studies on pH effect, temperature effect, adsorbate/adsorbent dose, and contact time were demonstrated for the maximum output of the polymer-modified composite for the removal of Cr(VI) and Cr(III).59 Then, 8 mg of the composite, 30 mg L−1 for (VI), and pH 2 were found as the optimized indicators for the maximum adsorption of Cr(VI). Similarly, 6.0 mg of the composite, 40 mg L−1 of Cr(III), and pH 5 were found optimized for the maximum output of the adsorbent for the removal of Cr(III). All the solutions of Cr(VI) and Cr(III) were shacked using an orbital shaker for the contact time optimization while an atomic absorption spectrometer was used for the detection and measurement of the metal ions. The adsorption capacities and percentage of adsorptions for Cr(VI) and Cr(III) were computed using the following equations.
 | (1) |
 | (2) |
The isothermal studies were carried out by adding the polymer modified composite (8 g L−1) ∼ Cr(VI) and 2 g L−1 ∼ Cr(III) to many flasks having different concentrations (10–50 mg L−1) of the metal ions at the optimized pH (Cr(VI) ∼ 2 and Cr(III) ∼ 5). The mixture of composite and metal ions was vigorously shacked at 200 rpm at ambient temperature one by one. The amount of the metal ions in aliquots were determined. During kinetic studies, the metal adsorption at the composite surface was evaluated using the optimized conditions at different time intervals (0–250 min).
Results and discussion
Characterization
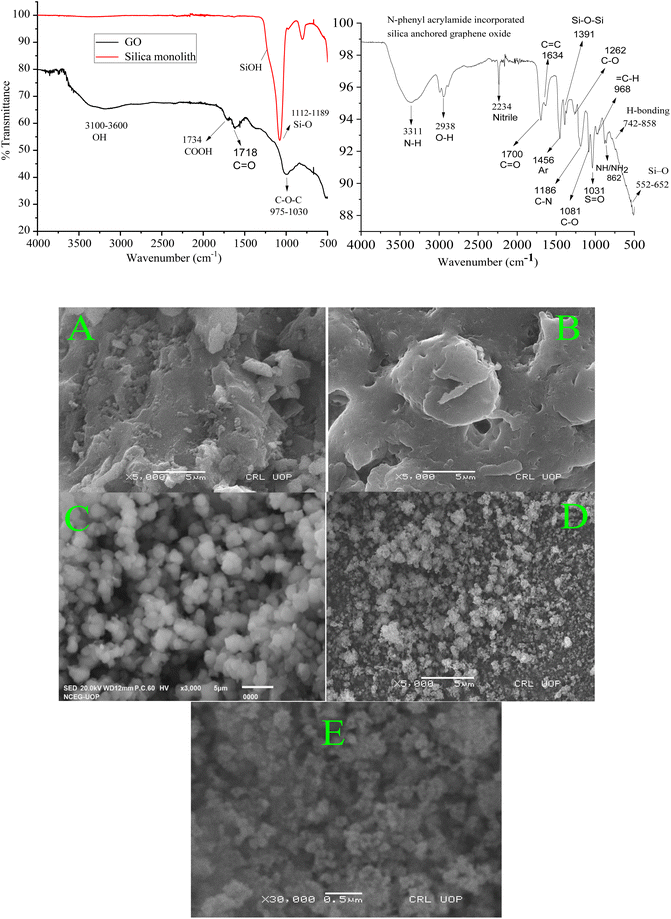
The peaks at 1616 cm−1, 3400 cm−1, and a broad peak in the range of 3100 to 3500 cm−1 in the FTIR spectrum of GO represent various modes of OH functional groups. Similarly, the peak at 1734 cm−1 represents the carboxyl group, while the observed peak at 2990 cm−1 represents the stretching frequency of the CH2 functional group at the surface of GO. The peak findings of the GO spectrum agree with the reported literature.60,61 The peak at 1718 cm−1 shows the presence of C![[double bond, length as m-dash]](https://www.rsc.org/images/entities/char_e001.gif) O functional groups62 while the peaks at 975–1030 cm−1 are affirmative of the presence of C–O–C,63 at the surface of GO. In the FTIR spectra of monolithic silica, the observed peaks at 1112 to 1189 cm−1 represent the Si–O stretching frequency.64
O functional groups62 while the peaks at 975–1030 cm−1 are affirmative of the presence of C–O–C,63 at the surface of GO. In the FTIR spectra of monolithic silica, the observed peaks at 1112 to 1189 cm−1 represent the Si–O stretching frequency.64
The FTIR spectra of the resulting composite material (N-phenyl acrylamide-bound silica-anchored GO) is a clear clue for the successful synthesis of the composite, where the sharp peaks at 1081 cm−1 represent the stretching frequency related to the C–O functional group.65 The vanishing of the peak for carboxyl group at 1734 cm−1 at the GO surface and the formation of a peak at 1380 cm−1 corresponding to the vibrational frequency of the carbonyl group bound to the siloxane (Si–O–Si) networking66 strongly suggest the synthesis of the N-phenyl acrylamide-bound composite. The formation of Si–O–C![[double bond, length as m-dash]](https://www.rsc.org/images/entities/char_e001.gif) O occurs due to the reaction of the silica–OH group with the COOH group of GO, which lead to the formation of silica-bound GO particles. The peaks observed at 552 and 652 cm−1 in the resulting composite represent the stretching frequency of Si–O.67 The peaks at 742 and 858 cm−1 represent the hydrogen bonding. The broad peak at 3311 cm−1 represents the NH functional group, and the overlap sharp peak at 2938 cm−1 is due to the OH functional group. The peak at 1700 cm−1 is due to the presence of C
O occurs due to the reaction of the silica–OH group with the COOH group of GO, which lead to the formation of silica-bound GO particles. The peaks observed at 552 and 652 cm−1 in the resulting composite represent the stretching frequency of Si–O.67 The peaks at 742 and 858 cm−1 represent the hydrogen bonding. The broad peak at 3311 cm−1 represents the NH functional group, and the overlap sharp peak at 2938 cm−1 is due to the OH functional group. The peak at 1700 cm−1 is due to the presence of C![[double bond, length as m-dash]](https://www.rsc.org/images/entities/char_e001.gif) O, and the peak at 1456 represents the presence of aromatic benzene. All the changes associated with the formation of composites from silica and GO in the form of IR spectroscopy confirm the successful synthesis of the ultimate composite material.68
O, and the peak at 1456 represents the presence of aromatic benzene. All the changes associated with the formation of composites from silica and GO in the form of IR spectroscopy confirm the successful synthesis of the ultimate composite material.68
To check the architecture and surface morphology of the GO, monolithic silica, silica-anchored GO, and N-phenyl acrylamide-modified composite, FE-SEM images were taken (Fig. 2). The surface morphological plan of the monolithic silica, GO with relative variations after the deposition of monolithic silica onto the GO and the deposition of N-phenyl acrylamide monomers suggests the successful synthesis of the resulting composite material. The SEM images of monolithic silica indicate the particle size in the range of 1–2 μm with roughly spherical and porous nature.69 The SEM images of the GO show sheet-like nature.70 The SEM image of silica-incorporated graphene oxides clearly demonstrated that the small silica particles are attached to the surface of GO sheets. The silica particles overcrowd the surface of GO, which is clearer from the lumpy nature of the SEM image. The silica particles can be seen as white patches on the dark background of the GO. The SEM image of N-phenyl acrylamide-modified composite shows a somewhat synchronized image where the entire surface is modified with the polymer layer.
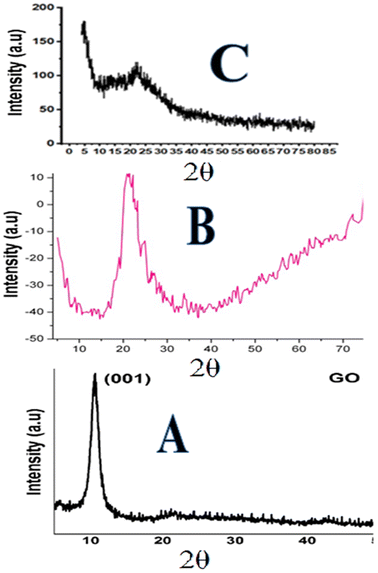 | ||
| Fig. 3 XRD pattern: (A) graphene oxide, (B) silica particles and (C) phenyl acrylamide-incorporated porous silica-bound graphene oxide sheets. | ||
The XRD image of the composite confirms the presence of both monolithic silica and GO. The intense peaks observed at diffraction 2θ = 0.4–2.4° up to 100–200 represent the well-ordered two-dimensional hexagonal structure of GO sheets in the composite,76 while the broad silica peak was seen at 20°–23° and those of the GO were observed at 11 and 26°. A slight shift in the (0.002) maximum peaks from 26.05° to 26.20° was observed in the XRD image of composites, which might be attributed to the reduction of GO.77 The XRD results agree with the successful formation of the composite.
| Reaction conditions/descriptions | Results | |
|---|---|---|
| Surface area (m2 g−1) | Single point surface area at P/P0 = 0.199472855 | 264.899 (m2 g−1) |
| BET surface area | 259.799 (m2 g−1) | |
| t-Plot micropore Area | 15.589 (m2 g−1) | |
| t-Plot external surface Area | 261.687 (m2 g−1) | |
| BJH adsorption cumulative surface area of pores between 17.000 Å and 3000.000 Å diameter | 259.389 (m2 g−1) | |
| BJH desorption cumulative surface area of pores between 17.000 Å and 3000.000 Å diameter | 291.243 (m2 g−1) | |
| Pore volume (Cm3/g) | Single point adsorption total pore volume of pores less than 2566.419 Å diameter at P/P0 = 0.992420088 | 0.51009 (cm3 g−1) |
| t-Plot micropore volume | 0.00238 (cm3 g−1) | |
| BJH adsorption cumulative volume of pores between 17.000 Å and 3000.000 Å diameter | 0.49226 (cm3 g−1) | |
| BJH desorption cumulative volume of pores between 17.000 Å and 3000.000 Å diameter | 0.51009 (cm3 g−1) | |
| Pore size (Å) | Adsorption average pore width (4 V/A by BET) | 227.920 (Å) |
| BJH adsorption average pore diameter (4 V/A) | 244.927 (Å) | |
| BJH desorption average pore diameter (4 V/A) | 221.391 (Å) |
The pore radius of the GO is 28.5 nm, silica monolith is 18 nm, silica bound GO is 16.5 nm, and that of the polymer-bound composite is 13.5 nm. A decrease in the pore radius of silica bound GO is due to the deposition/growth of silica particles over the GO sheets. Similarly, a further decrease in the pore radius to 13.5 nm for the polymer-bound composite is due to the immobilization of the polymer film over the composite surface. The RAFT polymerization results in polymer formation, leading to decreased pore size. The pore size distribution analysis is a clue towards the successful synthesis of the resulting composite material. The porosity indicates the ratio of the open pore volume to that of the total volume of the composite.78 The high surface area and porosity are very significant for the enhanced adsorption of adsorbent materials.79 The higher total pore volume of 21–25 nm materials confirms its mesoporous nature.80 The numerical values of the BET/BJH analysis for the N-phenyl acrylamide-modified composite are summarized in Table 2.
The monolithic silica shows zeta potentials of −38.4 mV and −9.9 mV, which are related to the silanol functional groups.
The overall zeta potential of −48.3 mV of the silica monolith suggests a higher silanol density at the surface and increased stability of the silica particles. The nutshell zeta potential on the surface of the composite is −21.18 mV. The peak at −30.9 mV in the zeta potential plot of the polymeric materials is typically due to the esterification reaction between COOH and Si–OH groups, while the peaks at 2.4 mV and 13.4 mV might be due to the epoxy and hydroxyl functional groups. The numerical values of zeta potential are summarized in Table 3. The zeta potential analysis suggests the improved removal efficiency of Cr(VI)and Cr(III) at the optimized pH owing to the highly negative surface of the resulting composite. In addition, the zeta potential is a clue for the successful synthesis of the N-phenyl acrylamide-modified silica@GO. Besides the electrostatic interaction, the presence of the hydroxyl group at the surface of silica and epoxy, carboxyl, and phenolic OH at the GO surface results in hydrogen bonding and van der Waals forces during the adsorption process.83 Moreover, the incorporation of the N-phenyl acrylamide in the resultant composite might result in the enhanced interaction between Cr and the composite, leading to highly efficient adsorption of the former.
| S. No. | Samples | Zeta potential (mV) |
|---|---|---|
| 1 | GO | −12.52 |
| 2 | Silica monolith | −48.3 |
| 3 | Silica anchored GO composite | −21.18 |
Adsorption mechanism between the composite and the analyte.
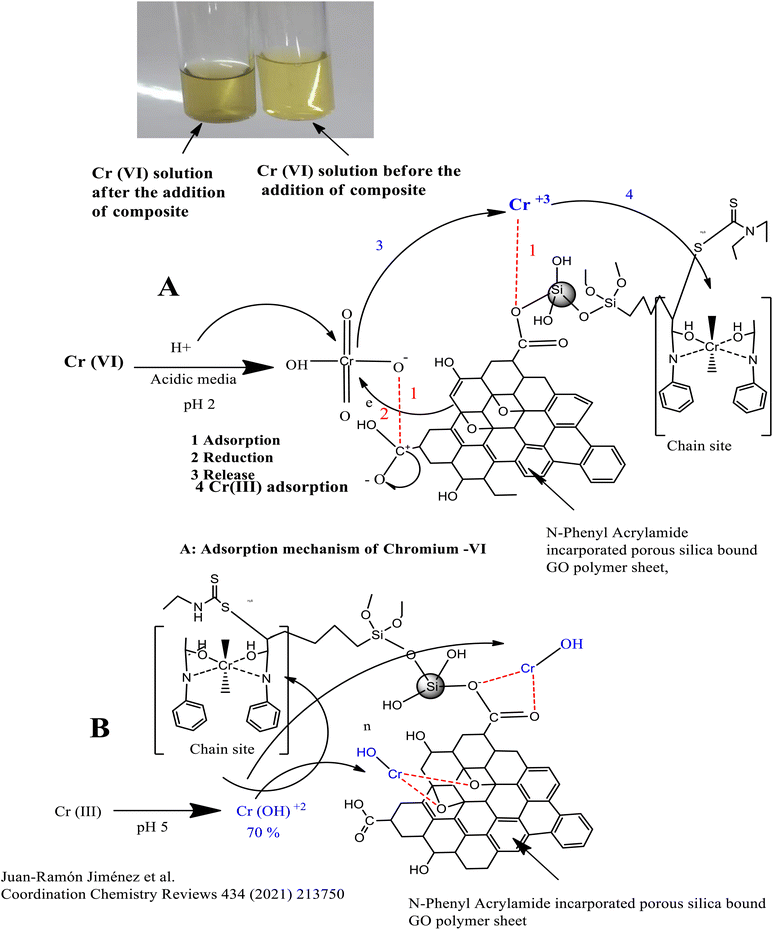
The Cr(VI) which exists in the form of HCrO42− in acidic media (pH 2) is reduced by the OH group of GO into the Cr(III) ion, which is adsorbed at the chain propagation sites of the polymers or by the electrostatic interaction with oxygen, as shown in Fig. 6(A). Similarly, Cr(III) which exists in the form of Cr(OH)2+ at pH 5 is adsorbed either directly at the chain propagation sites of the polymers or by the electrostatic interaction with the oxygen of the GO sheets, as shown in Fig. 6(B).
![[double bond, length as m-dash]](https://www.rsc.org/images/entities/char_e001.gif) O functional groups of the GO. Cr(VI) might also reduce to Cr(III), resulting in the colour change from yellow to green. Cr(III) might be attracted by the oxygen containing functional group of the adsorbent by electrostatic interaction or take part in complex formation with the donor groups (N, C
O functional groups of the GO. Cr(VI) might also reduce to Cr(III), resulting in the colour change from yellow to green. Cr(III) might be attracted by the oxygen containing functional group of the adsorbent by electrostatic interaction or take part in complex formation with the donor groups (N, C![[double bond, length as m-dash]](https://www.rsc.org/images/entities/char_e001.gif) O) of the polymers, as depicted in Fig. 6(A) and it might enhance the adsorption.
O) of the polymers, as depicted in Fig. 6(A) and it might enhance the adsorption.In the basic media, there exists a competition for the adsorption of OH− and HCrO42− ions on the adsorbent surface, which lowers the percentage of adsorption of the Cr-metal. Furthermore, a decrease in percentage of adsorption of Cr(VI) in basic media might be attributed to the repulsion between OH− and HCO42−.86
Similarly, the adsorption of Cr(III) is maximum at pH 5, where 70% of Cr(III) exist in the form of Cr(OH)2+, which form a complex with oxygen- and nitrogen-containing functional groups of the polymer-bound composite or hydrogen bond,87 as shown in Fig. 6(B). The decrease in the percentage of adsorption at lower pH values may either be attributed to the excess of hydrogen ions or the precipitation of Cr-III in the form of Cr(OH)3, which usually occurs at pH 4.88,89 A slightly less increase was observed in the percentage of adsorption in a basic medium due to the dissociation of (Si–OH) groups into the Si–O–, and adsorbate–adsorbent hydrogen bonding interactions.90 The pH effect is given in Fig. 7.
Cr(VI) demonstrated the maximum adsorption (98.63%) at an adsorbate concentration of 30 mg L−1. Initially, the percentage of adsorption of Cr(VI) was 95.11%, which then linearly increased to 98.63%, as shown in Fig. 7(C). Similarly, the Cr(III) adsorption was linearly increased to 98.832% and then became constant. The observed linear increase in the percentage of adsorption of the metal ions with metal concentration is because of the more active sites available at the adsorbent surface. The adsorbate–adsorbent interactions are higher at elevated adsorbate concentrations owing to the improved mass transfer effects, which ultimately increase the driving force.97
The Cr(VI) adsorption increases linearly from 10 to 80 min and then a decrease was observed. Similarly, the Cr(III) adsorption was increased with extra shaking time. Maximum adsorption for Cr(III) was found to be 98.28% at 60 min. The higher shaking time suggests low mass transfer kinetics of the process since this is the time required for exposing the entire active sites of the adsorbent to the metal ions. Finally, the active sites are all done with the adsorption of the metal ions in solutions and the percentage of adsorption adopts the pattern given in Fig. 7(D).98 The time at which maximum adsorption is achieved is the time required for the attainment of equilibrium between metal ions and the adsorbent material in each solution.99
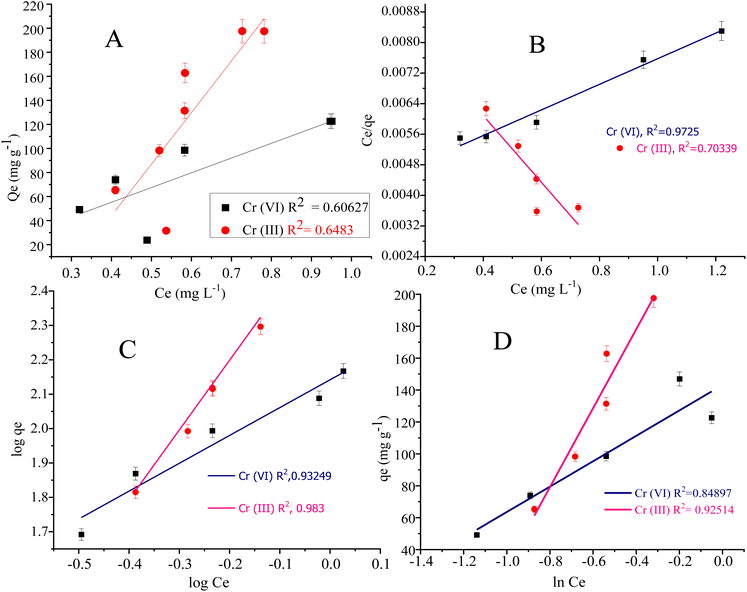
Langmuir adsorption isotherm model illustrated the monolayer/uniform adsorption at the adsorbent surface having an inadequate number of active sites. The qe value in the Langmuir adsorption isotherm model represents the monolayer adsorption. The qe value for Cr(III) and Cr(VI) are 298.507 mg g−1 and 114.810 mg g−1 respectively. The adsorption constant (KL in L mg−1) in the Langmuir model represents the adsorption affinity of the adsorbate in a bulk solution to the active sites. The KL value for Cr(VI) and Cr(III) was found to be 0.7923 L mg−1 and 0.9101 L mg−1 respectively.103
Freundlich adsorption isotherm model is usually applied to signify the analyte adsorption at the non-uniform and heterogeneous surface of the adsorbent.104 The KF (mg g−1) is the Freundlich adsorption constant representing the adsorption capacity. The KF values for Cr(III) and Cr(VI) were found to be 138.653 mg g−1 and 401.874 mg g−1 respectively. The Freundlich parameter “1/n” is the sorption and heterogeneous factor, where (n > 1 or 1/n < 1) represent the favourability of metal adsorption at the composite surface. The 1/n value was computed as 0.809 for Cr(VI) and 2.027 for Cr(III).105
The R2 (0.972) computed from the Langmuir adsorption isotherm for Cr(VI) best fits to its adsorption at the composite surface, as shown in Fig. 8. The R2 (0.983) value for Cr(III) given in Table 4 is computed from the Freundlich adsorption isotherm, suggesting best fitting of the adsorption data to the Freundlich model.
| Isotherm model | Langmuir model | Fruindlich model | Temkin model | |||||||
|---|---|---|---|---|---|---|---|---|---|---|
| Linear equation | Ce/qe = 1/KLQm + Ce/Qm | Qe = B![[thin space (1/6-em)]](https://www.rsc.org/images/entities/char_2009.gif) ln ln![[thin space (1/6-em)]](https://www.rsc.org/images/entities/char_2009.gif) A + B A + B![[thin space (1/6-em)]](https://www.rsc.org/images/entities/char_2009.gif) ln ln![[thin space (1/6-em)]](https://www.rsc.org/images/entities/char_2009.gif) Ce Ce |
||||||||
| Parameters | KL (L g−1) | qe (mg g−1) | R2 | KF (mg g−1) | N | 1/n | R2 | A | B (J mol−1) | R2 |
| Chromium(VI) | 0.7923 | 298.507 | 0.972 | 138.653 | 1.235 | 0.809 | 0.9324 | 1.2339 | 79.523 | 0.848 |
| Chromium(III) | 0.9101 | 114.810 | 0.946 | 401.874 | 0.4933 | 2.027 | 0.983 | 8.0352 | 247.1717 | 0.925 |
The Langmuir adsorption isotherm for Cr(VI) indicated that the adsorption of Cr(VI) (which exists in the form of HCrO42−) at the surface of the N-phenyl acrylamide-bound composite is monolayer and chemisorption. During this process, Cr(VI) is reduced to Cr(III) by the OH group of GO sheets, which further bind electrostatically with an oxygen atom or may form a complex with a polymer chain at the propagation sites, as shown in Fig. 6(A). The adsorption data of Cr(III) follow the Freundlich adsorption isotherm because Cr(III) at pH 5 exists in the form of Cr(OH)2 + 2. The Cr(OH)22+ show physisorption at the composite surface and is more prominently the electrostatic interaction. The binding is mainly due to the formation of hydrogen bonds with nitrogen or oxygen functional groups of the adsorbent, as shown in Fig. 6(B). The Temkin isotherm model was also applied to the adsorption data of Cr(VI) and Cr(III). The Temkin constant (B) represent the adsorption heat in the unit of J mol−1 while “R” is the gas constant (8.314 J mol−1 K−1), “A” is the Temkin constant and “T” is the temperature in Kelvin.106 The constant values B and A were calculated from the slope and intercept of the plot of qe vs. ln![[thin space (1/6-em)]](https://www.rsc.org/images/entities/char_2009.gif) Ce, as shown in Fig. 8(D).
Ce, as shown in Fig. 8(D).
| Metal ions | Pseudo 1st order kinetic | Pseudo 2nd order kinetic | Intra particle diffusion | ||||||||
|---|---|---|---|---|---|---|---|---|---|---|---|
| K1 (min−1) | Qe (mg g−1) (calcu.) | qe (mg g−1) (exp.) | R2 | K2 (min−1) | Qe (mg g−1) (calcu.) | qe (mg g−1) (exp.) | R2 | kid (min−1/2) | C (mg g−1) | R2 | |
| Cr-VI | 0.00091 | 94.045 | 146.95 | 0.848 | 3.120 | 47.98 | 146.95 | 0.996 | 0.18904 | 46.989 | 0.048 |
| Cr-III | 0.00022 | 130.436 | 197.57 | 0.560 | 3.958 | 64.391 | 197.57 | 0.999 | 0.2681 | 62.895 | 0.344 |
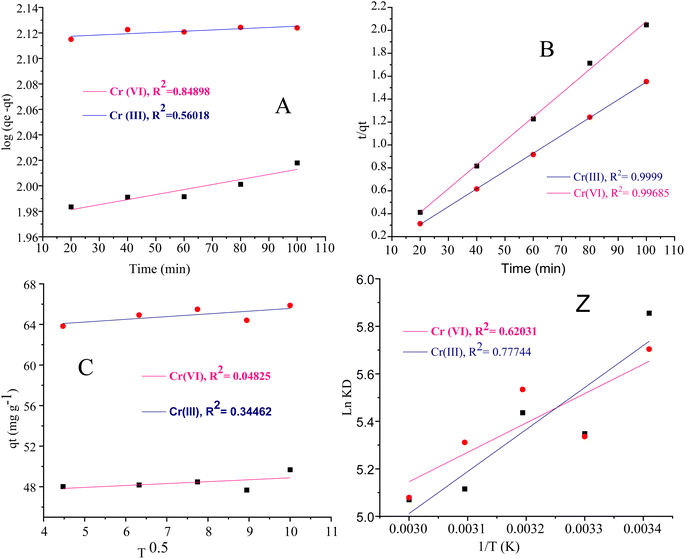
The linear form of the kinetic models (pseudo first-order eqn (3), pseudo second-order eqn (4), and intraparticle diffusion eqn (5)) was applied to the adsorption data of Cr(III) and Cr(VI):
 | (3) |
 | (4) |
| qt = kidt1/2 + C | (5) |
The intra particle diffusion explains the different stages of kinetics during the adsorption process, where a curve of qt against T0.5 was plotted, as shown in Fig. 9(C). In the first stage, the adsorbate diffusion is fast which becomes slow in the second stage and decreases further in the third stage.108 The regression values for Cr(VI) ∼ 0.996 and Cr(III) ∼ 0.999 computed from the pseudo 2nd-order model suggested more applicability of the pseudo second-order model in comparison to the pseudo 1st-order model, where the R2 values are 0.848 for Cr(VI) and 0.560 for Cr(III). The regression values computed from the intra particle diffusion model are 0.048 for Cr(VI) and 0.344 for Cr(III). The higher R2 value suggested that the adsorption of Cr(III) and Cr(VI) at the composite surface follows pseudo 2nd order and the process is physisorption.109
ΔG = −RT![[thin space (1/6-em)]](https://www.rsc.org/images/entities/char_2009.gif) ln ln![[thin space (1/6-em)]](https://www.rsc.org/images/entities/char_2009.gif) KD KD
| (6) |
| KD = qe/Ce |
 | (7) |
| Qe = QmaxCeKL/CeKL + 1 | (8) |
| Ka = ∂a/((1 − ∂e)ae | (9) |
| ae = γeCe/Cs | (10) |
ae is the activity of adsorbate in the solution at equilibrium and ∂e is the fraction of the covered surface.
γe is the activity co-efficient at equilibrium and Cs is the molar concentration of adsorbate present in the reference standard solution, which is equal to 1 mol L−1.
Then, eqn (11) becomes
| Ka = ∂a/((1 − ∂e)γeCe | (11) |
| ∂e = Qe/Qmax |
Putting this value in eqn (8), we get eqn (12) as follows:
| KL = θe/(1 − θe)Ce | (12) |
By comparing eqn (11) and (12), we get
| Ka = Kl/γe 1 mol L−1 | (13) |
γe represents the function of ionic strength of the solute.
For a very dilute solution or weak charges adsorbate Ka = KL. Eqn (6) will become
| ΔG = −RT ln KL | (14) |
For the dilute solution of Cr(VI) and Cr(III), we applied the Langmuir constant KL instead of KD.
The van't Hoff plot ln![[thin space (1/6-em)]](https://www.rsc.org/images/entities/char_2009.gif) KL vs. 1/T given in Fig. 9(Z) was constructed for Cr(VI) and Cr(III).
KL vs. 1/T given in Fig. 9(Z) was constructed for Cr(VI) and Cr(III).
According to Milonjic et al., ΔG° can be calculated using the value of KL if adsorption takes place in an aqueous solution. Under such conditions, KL should be converted into a dimensionless constant by multiplying with 55.5 mol L−1. The 55.5 value can be calculated by dividing 1000 g by the molar weight of water, and the ΔG° value can be calculated according to eqn (15):
| ΔG° = RT ln(55.5 KL) | (15) |
According to this equation, the substance activity is the ratio of the substance's concentration to that of the reference (1 mol L−1); therefore, the concentration units in the ratio cancelled each other out where the activity is dimensionless. Therefore, the equation is against the chemical activity concept.110
The negative values of ΔH (−12.193 kJ mol−1) for Cr(VI) show that the adsorption of Cr(VI) on the composite surface is exothermic. The positive value of ΔH 152.0046 kJ mol−1 for Cr(III) recommends the exothermic nature for the adsorption of metal ions. The ΔS values are 0.0119 J K−1 mol−1 and 0.0024 J K−1 mol−1 for Cr(III) and Cr(VI) respectively. The positive values of ΔS for the adsorption of Cr(III) and Cr(VI) indicated the strong adsorption affinity of both states of the metal ions towards the composite and high degree of randomness at the adsorbent surface. The positive values of ΔG for Cr(VI) and Cr(III) at different temperatures showed the nonspontaneous adsorption nature which suggested the physisorption mode. The numerical values of the thermodynamic parameters (ΔS, ΔH and ΔG)111 are summarized in Table 6 and the van't Hoff plot is given in Fig. 9(Z).
| T (K) | 1/T (K) | Chromium(VI) | Chromium(III) | ||||
|---|---|---|---|---|---|---|---|
| k (L mol−1) | ln![[thin space (1/6-em)]](https://www.rsc.org/images/entities/char_2009.gif) KL KL |
−ΔG![[thin space (1/6-em)]](https://www.rsc.org/images/entities/char_2009.gif) kJ mol−1 kJ mol−1 |
KL (L mol−1) | ln![[thin space (1/6-em)]](https://www.rsc.org/images/entities/char_2009.gif) KL KL |
−ΔG kJ mol−1 | ||
| a The values of ΔH (kJ mol−1) and ΔS (J K−1 mol−1) are −12.193 and −0.01329 for Cr-VI while those of the Cr-III are 152–004 and 0.489 respectively. | |||||||
| 293 | 0.00341 | 25.5041 | 3.234 | 7.959 | 1.100 | 0.095 | 0.232 |
| 303 | 0.00330 | 25.563 | 3.373 | 8.497 | 1.305 | 0.672 | 2.264 |
| 313 | 0.00319 | 26.8202 | 3.278 | 8.553 | 2.545 | 0.9341 | 2.430 |
| 323 | 0.00309 | 18.065 | 2.851 | 7.656 | 13.02 | 2.53 | 6.794 |
| 333 | 0.00300 | 18.564 | 2.727 | 7.549 | 31.92 | 3.44 | 9.522 |
| Samples | Chromium-VI | Chromium-III | ||
|---|---|---|---|---|
| Spiking amount (ppm) | % adsorption | Spiking amount (ppm) | % adsorption | |
| Distilled water | 100 | 99.862 | 100 | 99.654 |
| Aitmaad steel mill | 100 | 99.058 | 100 | 99.218 |
| Deen leather industry | 100 | 98.787 | 100 | 98.62 |
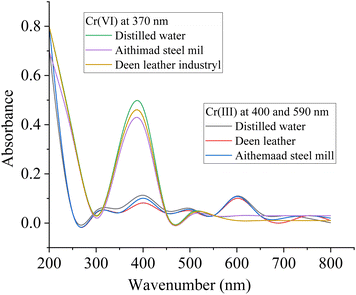 | ||
| Fig. 10 UV-visible spectra for evaluating the removal efficiency of the composite towards Cr(VI) and Cr(III). | ||
| Adsorbent | Adsorbate | Adsorption capacity (mg g−1) | Ref. |
|---|---|---|---|
| Modified oak saw dust | Chromium(VI) | 1.70 | 115 |
| Cow hooves | Chromium(VI) | 5.71 | 116 |
| Neem sawdust | Chromium(VI) | 58.82 | 117 |
| Lakhra | Chromium(III) | 2.61 | 118 |
| Carbon nanotube | Chromium(VI) | 85.83 | 119 |
| Nitrogen doped | Chromium(VI) | 227.27 | 120 |
| Polymeric materials | Chromium(VI) | 1185 | 121 |
| Mixture by blast furnace slag (BFS) | Chromium(III) | 43.16 | 122 |
| N-Phenyl acrylamide modified Silica@GO | Chromium(VI) | 298.507 | Current study |
| Chromium(III) | 401.874 | Current study |
Conclusion
The sophisticatedly altered Fischer esterification protocol was applied for the synthesis of a silica monolith-anchored graphene oxide composite. The composite was modified with a polymer using N-phenyl acrylamide via RAFT polymerization. The composite synthesis was confirmed by FE-SEM, FTIR spectroscopy, XRD, zeta potential, EDX and BET/BJH analysis. The results of atomic absorption, UV-visible spectroscopy, and EDX confirmed the successful adsorption of Cr(VI) and Cr(III) at the composite surface. The synthesized polymer-bound composite exhibited many advantageous features such as the organic–inorganic hybrid nature, increased surface area, large pore size, monolithic architecture, mechanical strength, increased mass transfer kinetics for the adsorption process, high-throughput analysis, and the high regenerative ability after repeated uses for the adsorption of Cr(VI) and Cr(III). The adsorbent resulted in 99.762% adsorption of Cr(VI) and 99.654% adsorption of Cr(III) from the industrial effluents. The batch optimization studies helped in finding out the optimized values of different parameters pH ∼ 2, adsorbate con. ∼ 20 mg L−1, contact time ∼ 80 min, adsorbent amount ∼ 8 mg for Cr(VI) and pH ∼ 5, adsorbate con. ∼ 20 mg L−1, contact time ∼ 1 h, adsorbent amount ∼ 6 mg for Cr(III). The adsorption data best fitted to the pseudo 2nd-order kinetic model for Cr(VI) with R2 of 0.996 and Cr(III) with R2 of 0.999. Similarly, the data best fitted to the Langmuir adsorption isotherm having R2 of 0.972 for Cr(VI), while Cr(III) follows the Freundlich adsorption isotherm model with R2 of 0.983. The negative values of ΔH −12.193 kJ mol−1 ∼ Cr(VI) suggested the endothermic adsorption process, while the positive value (152.004 kJ mol−1) ∼ Cr(III) suggested the exothermic adsorption nature of the process. The change in Gibbs free energy also goes in favour of the exothermic and spontaneous nature of the adsorption process, while the negative values of ΔS (−0.01329 kJ mol−1) ∼ Cr(VI) suggest the higher affinity for Cr(VI) adsorption towards the adsorbent with no randomness, while the ΔS value of 0.00244 kJ mol−1 ∼ Cr(III) suggests a higher affinity of Cr(III) adsorption towards adsorbent with a higher degree of the randomness.Conflicts of interest
There are no conflicts to declare.Acknowledgements
This research was supported by the University of Malakand through Higher Education Commission (HEC) of Pakistan Project no: 20-14499/NRPU/R&D/HEC/2021 2021. The authors are grateful to the Researchers supporting Project No. (RSP-2023/R1), King Saud University, Riyadh, Saudi Arabia.References
- I. Osasona, K. Aiyedatiwa, K. Johnson, J. Faboya and O. L. Indonesian, Journal Of Chemistry, 2018, 18(1), 145–152 CAS.
- S. Chen, Q. Yue, B. Gao and X. Xu, J. Colloid Interface Sci., 2010, 349(1), 256–264 CrossRef CAS PubMed.
- P. K. Gautam, R. K. Gautam, S. Banerjee, M. C. Chattopadhyaya and J. D. Pandey, J. Innovative Sci., 2016, 60, 101–130 Search PubMed.
- V. H. T. Pham, J. Kim, S. Chang and W. Chung, Microorganisms, 2022, 10(3), 610 CrossRef CAS PubMed.
- A. Kumar, D. Suman, B. Chiranjib and D. Siddhartha, Chem. Eng. J., 2011, 173, 135–143 CrossRef.
- S. K. Kahlon, G. Sharma, J. M. Julka, A. S. Kumar, F. Sharma and F. J. Stadler, J. Environ. Chem., 2018, 16(3), 919–946 CAS.
- C. Suhong, Y. Qinyan, G. Baoyu and X. Xing, J. Colloid Interface Sci., 2010, 349, 256–264 CrossRef PubMed.
- C. A. Kozlowski and W. Walkowiak, J. Water Resour., 2002, 36, 4870–4876 CAS.
- N. Kongsricharoern and C. Polprasert, Water Sci. Technol., 1996, 34, 109–116 CrossRef CAS.
- S. Rengaraj, K. H. Yeon and S. H. Moon, J. Hazard. Mater., 2001, 87, 273–287 CrossRef CAS PubMed.
- V. K. Gupta, A. K. Shrivastava and N. Jain, J. Water Resour., 2001, 35, 4079–4085 CAS.
- D. Mohan, K. P. Singh and V. K. Singh, J. Ind. Eng. Chem., 2005, 44(4), 1027–1042 CrossRef CAS.
- A. Baran, E. Bıc and S. Hamarat-Baysal, Bioresour. Technol., 2006, 98, 661–665 CrossRef PubMed.
- A. K. Tolkou, M. Mitrakas, I. A. Katsoyiannis, M. Ernst and A. I. Zouboulis, Journal of Chemosphere, 2019, 231, 528–537 CrossRef CAS PubMed.
- H. Li, Y. Yin, L. Zhu, Y. Xiong, X. Li, T. Guo, W. Xing and Q. Xue, J. Hazard. Mater., 2019, 373, 725–732 CrossRef CAS PubMed.
- J. C. Kim, S. I. Oh, W. Kang, H. Y. Yoo, J. Lee and D. W. Kim, J. Catal., 2019, 374, 118–126 CrossRef CAS.
- W. Luo, F. I. Hai, W. E. Price, W. Guo, H. H. Ngo, K. Yamamoto and L. D. Nghiem, Bioresour. Technol., 2014, 167, 539–546 CrossRef CAS.
- J. Zhang, G. B. White, M. D. Ryan, A. J. Hunt and M. J. Katz, ACS Sustain. Chem. Eng., 2014, 4, 7186–7192 CrossRef.
- M. A. Khan, et al., Groundw. Sustain. Dev., 2020, 11, 100427 CrossRef.
- Z. Shao, C. Huang, Q. Wu, Y. Zhao, W. Xu, Y. Liu, J. Dang and H. Hou, J. Hazard. Mater., 2019, 378, 120719 CrossRef CAS PubMed.
- D. Xu, F. Cheng, Q. Lu and P. Dai, Ind. Eng. Chem. Res., 2014, 53, 2625–2632 CrossRef CAS.
- Y. Wang, L. Yu, R. Wang, Y. Wang and X. Zhang, J. Colloid Interface Sci., 2020, 574, 74–86 CrossRef CAS.
- S. Bolisetty and R. Mezzenga, Nat. Nanotechnol., 2016, 11, 365–371 CrossRef CAS PubMed.
- H. Luan, J. Xu, Z. Tan, A. Zheng and H. Huang, J. Chem. Technol. Biotechnol., 2019, 94, 2816–2825 CrossRef CAS.
- Y. Yang, Z. Zheng, W. Ji, J. Xu and X. Zhang, J. Hazard. Mater., 2020, 122686 CrossRef CAS PubMed.
- R. M. Richelle, K. Gangalakshmi, K. D. Mahaveer and K. Madhuprasad, J. Hazard. Mater., 2021, 403, 123605 CrossRef PubMed.
- M. Ji and C. Kezheng, Sep. Purif. Technol., 2020, 241, 116705 CrossRef.
- A. Einstein, B. Podolsky and N. Rosen, Phys. Rev., 1935, 47, 777–780 CrossRef CAS.
- X. Li, J. Liu, J. Feng, T. Wei, Z. Zhou, J. Ma, Y. Ren and Y. Shen, J. Hazard. Mater., 2023, 445, 130400 CrossRef CAS PubMed.
- L. Linqing, W. Jiahong and Z. Yanxin, Microporous Mesoporous Mater., 2023, 347, 112344 CrossRef.
- R. M. Richelle, S. Ganesan, A. V. Kanalli, J. H. Young, K. D. Mahaveer and K. Madhuprasad, J. Hazard. Mater., 2021, 416, 125941 CrossRef PubMed.
- P. Loris, F. Iolanda, P. Antonella, S. Maria, S. Ilaria and V. Marco, Appl. Sci., 2020, 10, 1925 CrossRef.
- I. Duru, D. Ege and A. R. Kamali, J. Mater. Sci., 2016, 51, 6097–6116 CrossRef CAS.
- A. Ali, M. Aamir, K. H. Thebo and J. Akhtar, Chem. Rec., 2020, 20(4), 344–354 CrossRef CAS PubMed.
- R. Sitko, M. Musielak, M. Serda, E. Talik, B. Zawisza, A. Gagor and M. Malecka, Sep. Purif. Technol., 2021, 254, 11760 CrossRef.
- J. Shi, J. Sun, T. Wang, L. Zeng and G. Jiang, Chem. Eng., 2011, 50, 5913–5917 Search PubMed.
- A. I. A. Sherlala, A. A. A. Raman, M. M. Bello and A. Asghar, Chemosphere, 2018, 193, 1004–1017 CrossRef CAS PubMed.
- X. Zhao, X. Xu, J. Teng, N. Zhou, Z. Zhou, X. Jiang, F. Jiao and J. Yu, Ecotoxicology and Environmental Safety, 2019, 176, 11–19 CrossRef CAS PubMed.
- S. Yang, D. Zhang, H. Cheng, Y. Wang and J. Liu, Anal. Chim. Acta, 2009, 1074, 54–61 CrossRef PubMed.
- H. Barrak, R. Ahmedi, P. Chevallier, A. M'Nif, G. Laroche and A. H. Hamzaoui, Sep. Purif. Technol., 2019, 222, 145–151 CrossRef CAS.
- S. Dey, S. Podder, A. Roychowdhury, D. Das and C. Ghosh, J. Environ. Manage., 2018, 211, 356–366 CrossRef CAS PubMed.
- M. Li, S. Tang, Z. Zhao, X. Meng, F. Gao, S. Jiang and C. Feng, Chem. Eng. J., 2020, 386, 123947 CrossRef CAS.
- Z. Meixing, Y. Jiahui, G. Xinxiang, Y. Li, L. Zhenxing, C. Shihai and Y. Jing, J. Chromatogr. A, 2019, 1598, 20–29 CrossRef PubMed.
- M. Khan, M. Muhammad, Z. A. AlOthman, w. J. Cheong and F. Ali, Sci. Rep., 2022, 12, 21027 CrossRef CAS PubMed.
- K. Xiang-Ping, Z. Bao-Hua and W. Juan, J. Agric. Food Chem., 2021, 69, 6735–6754 CrossRef PubMed.
- M. Ma, H. Li, Y. Xiong and F. Dong, A review, Mater. Des., 2021, 198, 109367 CrossRef CAS.
- A. A. Iqbal, N. Sakib, A. P. Iqbal and D. M. Nuruzzaman, Materialia, 2020, 12, 100815 CrossRef CAS.
- M. Hayati-Ashtiani, et al., Part. Part. Syst. Charact., 2011, 28, 71–76 CrossRef.
- C. Paluszkiewicz, M. Holtzer and A. Bobrowski, J. Mol. Struct., 2008, 880, 109–114 CrossRef CAS.
- J. D. Clogston and A. K. Patri, Methods in Molecular Biology, 2011, p. 697 Search PubMed.
- F. Ali and W. J. Cheong, J. Sep. Sci., 2014, 37, 3426–3434 CrossRef CAS PubMed.
- N. I. Zaaba, K. L. Foo, U. Hashim, S. J. Tan, W. W. Liu and C. H. Voon, Procedia Eng., 2017, 184, 469–477 CrossRef CAS.
- J. Chen, Y. Li, L. Huang, C. Li and G. Shi, Carbon, 2015, 81, 826–834 CrossRef CAS.
- R. Kumar, M. Kumar, A. Kumar, R. Singh, R. Kashyap, S. Rani and D. Kumar, Materials Today, 2019, 18, 1556–1561 CAS.
- S. Agarwal, N. Sadeghi, I. Tyagi, V. K. Gupta and A. Fakhri, J. Colloid Interface Sci., 2016, 478, 430–438 CrossRef CAS PubMed.
- A. Ali, F. Ali and W. J. Cheong, J. Chromatogr. A, 2017, 1525, 79–86 CrossRef CAS PubMed.
- M. Beija, J. D. Marty and M. Destarac, Polym. Sci., 2011, 36(7), 845–886 CAS.
- G. Moad, M. Chen, M. Häussler, A. Postma, E. Rizzardo and S. H. Thang, Polym. Chem., 2011, 2(3), 492–519 RSC.
- A. Favier and M. T. Charreyre, Macromol. Rapid Commun., 2006, 27(9), 653–692 CrossRef CAS.
- S. Perrier and P. Takolpuckdee, J. Polym. Sci., Part A: Polym. Chem., 2005, 43(22), 5347–5393 CrossRef CAS.
- J. Jiao, P. Liu, L. Wang and Y. Cai, J. Polym. Res., 2013, 20(8), 1–8 CAS.
- M. P. Desimone, G. Grundmeier, G. Gordillo and S. N. Simison, Electrochim. Acta, 2011, 56(8), 2990–2998 CrossRef CAS.
- P. Ragavendran, D. Sophia, C. Arul Raj and V. K. Gopalakrishnan, Pharmacologyonline, 2011, 1, 358–364 Search PubMed.
- S. B. Daffalla, H. Mukhtar and M. S. Shaharun, PloS One, 2020, 15(12), 0243540 CrossRef PubMed.
- V. Hospodarova, E. Singovszka and N. Stevulova, Am. J. Anal. Chem., 2018, 9(6), 303–310 CrossRef CAS.
- J. Zhang, Y. Duan, H. Sato, H. Tsuji, I. Noda, S. Yan and Y. Ozaki, Macromolecules, 2005, 38(19), 8012–8021 CrossRef CAS.
- J. J. Moyano, J. Loizillon, D. Pérez-Coll, M. Belmonte, P. Miranzo, D. Grosso and M. I. Osendi, J. Eur. Ceram. Soc., 2021, 41(4), 2908–2917 CrossRef CAS.
- B. Ramezanzadeh, Z. Haeri and M. Ramezanzadeh, Chem. Eng. J., 2016, 303, 511–528 CrossRef CAS.
- K. I. Panayotov, D. A. Mihaylov, M. Y. Ivanova, E. Z. Chakarova, K. K. Andonova and N. L. Drenchev, Chem. Rev., 2020, 121, 1286–1424 Search PubMed.
- W. C. Li, A. H. Lu and F. Schüth, Chem. Mater., 2005, 17(14), 3620–3626 CrossRef CAS.
- R. M. N. M. Rathnayake, H. W. M. A. C. Wijayasinghe, H. M. T. G. A. Pitawala, M. Yoshimura and H. H. Huang, Appl. Surf. Sci., 2017, 393, 309–315 CrossRef CAS.
- K. X. Sheng, Y. X. Xu, L. I. Chun and G. Q. Shi, New Carbon Mater., 2011, 26(1), 9–15 CrossRef CAS.
- S. Agarwal, N. Sadeghi, I. Tyagi, V. K. Gupta and A. Fakhri, J. Colloid Interface Sci., 2016, 478, 430–438 CrossRef CAS PubMed.
- K. Krishnamoorthy, M. Veerapandian, R. Mohan and S. J. Kim, Appl. Phys. A: Mater. Sci. Process., 2011, 106(3), 501–506 CrossRef.
- K. I. Hadjiivanov, D. A. Panayotov, M. Y. Mihaylov, E. Z. Ivanova, K. K. Chakarova, S. M. Andonova and N. L. Drenchev, Chem. Rev., 2020, 121, 1286–1424 CrossRef PubMed.
- J. Q. Dalagan and E. P. Enriquez, Mater. Sci. Appl., 2014, 37, 589–595 CAS.
- V. Agarwal and P. B. Zetterlund, Chem. Eng. J., 2021, 405, 127018 CrossRef CAS.
- P. K. Deshmukh, S. H. Lakade, U. R. Jaiswal, M. T. Harde and M. P. More, Mater. Technol., 2021, 1–14 Search PubMed.
- I. Izquierdo-Barba, M. Vallet-Regí, N. Kupferschmidt, O. Terasaki, A. Schmidtchen and M. Malmsten, Biomaterials, 2009, 30, 5729–5736 CrossRef CAS PubMed.
- X. Wang, Z. Li, Q. Ma, J. Li and M. Zhu, Chem. Eng. J., 2015, 273, 630–637 CrossRef.
- E. Asadi, S. A. Deilami, M. Abdouss, D. Kordestani, A. Rahimi and S. Asadi, Korean J. Chem. Eng., 2014, 31, 1028–1035 CrossRef CAS.
- R. Song, X. Hu, P. Guan, J. Li, L. Qian, C. Wang and Q. Wang, Appl. Surf. Sci., 2015, 332, 159–166 CrossRef CAS.
- B. Ren, Q. Zhang, X. Zhang, L. Zhao and H. Li, RSC Adv., 2018, 8, 38157–38165 RSC.
- H. Essebaai, H. Lgaz, A. A. Alrashdi, A. Habsaoui, A. Lebkiri, S. Marzak and E. H. Rifi, Int. J. Environ. Sci. Technol., 2022, 19, 2443–2454 CrossRef CAS.
- K. Krishnamoorthy, M. Veerapandian, K. Yun and S. J. Kim, Carbon, 2013, 53, 38–49 CrossRef CAS.
- H. Tang, Y. Zhao, S. Shan, X. Yang, D. Liu, F. Cui and B. Xing, Environ. Sci., 2018, 5, 2357–2367 CAS.
- Y. Chen, S. An, J. Sun, J. Gao and L. Qian, Materials, 2018, 11(269), 2–12 Search PubMed.
- D. Mohan, K. P. Singh and V. K. Singh, J. Hazard. Mater., 2006, 135(1–3), 280–295 CrossRef CAS PubMed.
- A. A. Moosa, A. M. Ridha and I. N. Abdullah, Int. J. Innov. Res. Technol., 2015, 4(2), 275–282 Search PubMed.
- E. Asadi, S. A. Deilami, M. Abdouss, D. Kordestani, A. Rahimi and S. Asadi, Korean J. Chem. Eng., 2014, 31, 1028–1035 CrossRef CAS.
- Y. Yang, X. Ma, C. Yang, Y. Wang, J. hao and Q. Zhang, Chem. Eng. J., 2021, 430, 132999 CrossRef.
- Y. An, H. Zheng, Z. Yu, Y. Sun, Y. Wang, C. Zhao and W. Ding, J. Hazard. Mater., 2020, 381, 120971 CrossRef CAS PubMed.
- Q. U. Ain, U. Rasheed, M. Yaseen, H. Zhang, R. He and Z. Tong, Appl. Surf. Sci., 2020, 514, 145929 CrossRef CAS.
- S. Debnath, A. Maity and K. Pillay, J. Environ. Chem. Eng., 2014, 2(2), 963–973 CrossRef CAS.
- H. Lin, S. Han, Y. Dong and Y. He, Appl. Surf. Sci., 2017, 412, 152–159 CrossRef CAS.
- R. M. Ali, H. A. Hamad, M. M. Hussein and G. F. Malash, Ecol. Eng., 2016, 91, 317–332 CrossRef.
- L. Zhang, W. Xia, X. Liu and W. Zhang, J. Mater. Chem. A, 2015, 3(1), 331–340 RSC.
- D. Božić, V. Stanković, M. Gorgievski, G. Bogdanović and R. Kovačević, J. Hazard. Mater., 2009, 171(1–3), 684–692 CrossRef PubMed.
- P. A. G. Cormack and A. Z. Elorza, J. Chromatogr. A, 2004, 804, 173–182 CAS.
- R. Saadi, Z. Saadi, R. Fazaeli and N. E. Fard, Korean J. Chem. Eng., 2015, 32, 787–799 CrossRef CAS.
- P. Ammendola, F. Raganati and R. Chirone, Chem. Eng. J., 2017, 322, 302–313 CrossRef CAS.
- M. K. Zahra and M. Nahid, Inorg. Nano-Met. Chem., 2019, 49, 231–239 CrossRef.
- R. J. Umpleby, S. C. Baxter, M. Bode, J. K. Berch, R. N. Shah and K. D. Shimizu, Anal. Chim. Acta, 2001, 435, 35–42 CrossRef CAS.
- S. Banerjee and M. C. Chattopadhyaya, Arabian J. Chem., 2017, 10, S1629–S1638 CrossRef CAS.
- C. Wu, S. Zhang, G. Nie, Z. Zhang and J. Wang, J. Environ. Sci., 2011, 23, 1524–1532 CrossRef CAS PubMed.
- P. S. Kumar and K. Kirthika, J. Eng. Sci. Technol., 2009, 4, 351–363 Search PubMed.
- W. Astuti, M. A. Mahardhika, D. A. Putri, M. Rohman, M. F. Sihab, T. Sulistyaningsih and E. F. Irchamsyah, Mater. Sci. Eng., 2019, 625, 012025 CAS.
- D. Grekov, P. Pré and B. J. Alappat, Renewable Sustainable Energy Rev., 2020, 124, 109743 CrossRef.
- S. Karaca, A. Gürses, M. Ejder and M. Açıkyıldız, J. Colloid Interface Sci., 2004, 277, 257–263 CrossRef CAS PubMed.
- Y. Liu, et al., J. Chem. Eng. Data, 2009, 54(7), 1981–1985 CrossRef CAS.
- L. Xia, E. Akiyama, G. Frankel and R. McCreery, J. Electrochem. Soc., 2000, 147, 2556–2562 CrossRef CAS.
- C. K. B. Lauren and M. Bruce, Crystals, 2021, 11, 443 CrossRef.
- M. A. Salam, S. A. Kosa and A. A. Al-Beladi, J. Mol. Liq., 2017, 241, 469–477 CrossRef.
- M. E. Argun, S. Dursun, C. Ozdemir and M. Karatas, J. Hazard. Mater., 2007, 141, 77–85 CrossRef CAS PubMed.
- J. Qu, W. Zhang, F. Bi, S. Yan, X. Miao, B. Zhang and Y. Zhang, Environ. Pollut., 2022, 306, 119398 CrossRef CAS PubMed.
- V. Vinodhini and N. Das, J. Sci. Res., 2009, 4(4), 324–329 CAS.
- A. Jamil, U. Shafiquea, M. Salmana, U. Z. Waheed, A. Shafique and M. A. Jesús, J. Hazard. Mater., 2009, 171, 797–801 CrossRef PubMed.
- N. F. Fahim, B. N. Barsoum, A. E. Eid and M. S. Khalil, J. Hazard. Mater., 2006, 136(2), 303–309 CrossRef CAS PubMed.
- A. S. K. Kumar, S. J. Jiang and W. L. Tseng, J. Mater. Chem. A, 2015, 3(13), 7044–7057 RSC.
- J. Chen, Y. Li, L. Wang, Z. Zhang, D. Lu, M. Lu and M. Chopp, Stroke, 2001, 32(4), 1005–1011 CrossRef CAS PubMed.
- X. Yuan, J. Li, L. Luo, Z. Zhong and X. Xie, Polymers, 2023, 15(2), 388 CrossRef CAS PubMed.
- C. Toufik, K. Ouahida, C. Sana and B. Aatmane, Anal. Bioanal. Chem. Res., 2023, 10(3), 251–268 Search PubMed.
| This journal is © The Royal Society of Chemistry 2023 |

