 Open Access Article
Two Schiff base iodide compounds as iodide ion conductors showing high conductivity†
H. B. Duan *,
X. Pan,
S. S. Yu and
H. Zhang
School of Environmental Science, Nanjing Xiaozhuang University, Nanjing 211171, P. R. China
First published on 20th June 2023
Abstract
Here, we reported the crystal structures, dielectric and conducting properties of two Schiff base iodide compounds [m-BrBz-1-APy]I3 (1) and [o-FBz-1-APy]I3 (2). The Schiff base cations build irregular channel frameworks, and the polyiodide anions are located in the channel. The impedance spectra demonstrated that the two compounds show intrinsic iodide ion conductance with higher conductivity of 1.03(4) × 10−4 S cm−1 at 343 K for 1 and 4.94(3) × 10−3 S cm−1 at 353 K for 2. The dielectric modulus analysis further confirmed that the conductance contributed to the migration of iodide ions.
Liquid electrolytes exhibit good ion-transport characteristics and high power conversion efficiency. For example, the power conversion efficiency is 11.3% in I−/I3− electrolytes1 and 12.3% in cobalt-based electrolytes.2 However, liquid electrolytes have some disadvantages compared to solid electrolytes. It is difficult to achieve hermetic sealing and build flexible devices, which limits their commercialization.3 From a dye-sensitized solar cell (DSSC) standpoint, high ionic conductivity, which allows fast charge transport from anode to cathode and low cost of the solid-state electrolytes, is required.4–6 Solid-state electrolytes show a wide range of practical applications in batteries and fuel cells.7 The ionic polymers, such as Nafion, are typical solid-state electrolytes, and ion conduction decreased as the temperature increased, which can be attributed to the small volatile molecule evaporating out of the electrolyte matris.8,9 In contrast, a series of solid-state electrolytes based on ionic conductors have shown high ionic conductivity without some of the disadvantages of polymer electrolyte conductors.10–12
One of the classical conduction mechanisms within ionic conductors is “ion hopping”, whereby the open vacancies with the crystalline lattice can promote ion hopping. Thus, some compounds composed of bigger size cations and smaller size anions and vice versa were reported, where enough space and channels were formed for the “ion hopping” of the smaller size counterions.13,14 A typical class of electrolytes is organic ionic plastic crystals, which exhibit long-range crystalline order and short-range crystalline disorder.15,16 The disorder involved is typically associated with rotation or orientational changes in molecules or ions. As a consequence of this disorder, not only the fast-ion transport, such as Li+,17 H+,18 or I−/I3−,19 but also plastic mechanical properties are conferred. Both of these properties are highly favorable for solid-state electrolytes. Among those solid-state electrolytes, imidazolium iodides are usually reported as promising candidates for application in solid-state DSSCs.20–23 However, their conductivity is low without any additives. A useful method for improving conductivity and photovoltaic performance is the doping of iodine or iodine ion compounds into ionic conductors.24 Unfortunately, the doping of iodine leads to some disadvantages, such as charge recombination and incident light filtering.25 Furthermore, multi-components may influence long-term stability because of phase separation. It is very important to synthesize single-component solid-state electrolytes with high conductivity using solid-state DSSCs.26
In our previous study, a series of 1-aminopyridinium base derivative ionic liquids was reported, where cations were larger in size compared to imidazolium. Herein, we explored a type of single-component solid-state electrolyte, [m-BrBz-1-APy]I3 (1) and [o-FBz-1-APy]I3 (2) (Scheme 1), for DSSCs. The two compounds show a higher conductivity of 1.03(4) × 10−4 S cm−1 at 343 K for 1 and 4.94(3) × 10−3 S cm−1 at 353 K for 2.
Compound 1 was prepared using 2-fluorobenzaldehyde with 1-aminopyridinium iodide and iodine in ethanol. The solution was slowly evaporated, and red block crystals of 1 were obtained after 7 days (see ESI†). The synthesis method is similar to our previously reported study.27 A similar procedure was used for the preparation of compound 2.
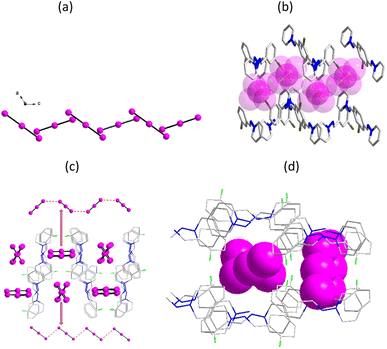
1 crystallizes in a triclinic system with space group P![[1 with combining macron]](https://www.rsc.org/images/entities/char_0031_0304.gif) . An asymmetric unit contains two I3− anions and two [m-BrBz-1-APy]+ cations. The single structure has been reported in ref. 27. In one I3− anion containing I6 atom, the I–I lengths of the triiodide anion are 2.917 and 2.939 Å. In another crystallographically independent I3− anion, the I–I lengths are 2.930 and 2.912 Å. Between the adjacent I3− anions, there exist short I–I lengths with I4⋯I1 distances of 4.376 and I3⋯I6A distances of 4.572 Å (symmetric code: A = 0.5 + x, 0.5 − y, 1 − z). The linear I3− ions are stacked into a W-shaped polyiodide chain along the b-axis direction (Fig. 1a). Parallel to the (1 0 0) plane, a irregular channel framework was constructed from anti-parallel arrangement Schiff base cations with a size of about 5.3 × 6.2 Å2 by considering the van der Walles radii, where the polyiodide anions are located in the channel (Fig. 1b).
. An asymmetric unit contains two I3− anions and two [m-BrBz-1-APy]+ cations. The single structure has been reported in ref. 27. In one I3− anion containing I6 atom, the I–I lengths of the triiodide anion are 2.917 and 2.939 Å. In another crystallographically independent I3− anion, the I–I lengths are 2.930 and 2.912 Å. Between the adjacent I3− anions, there exist short I–I lengths with I4⋯I1 distances of 4.376 and I3⋯I6A distances of 4.572 Å (symmetric code: A = 0.5 + x, 0.5 − y, 1 − z). The linear I3− ions are stacked into a W-shaped polyiodide chain along the b-axis direction (Fig. 1a). Parallel to the (1 0 0) plane, a irregular channel framework was constructed from anti-parallel arrangement Schiff base cations with a size of about 5.3 × 6.2 Å2 by considering the van der Walles radii, where the polyiodide anions are located in the channel (Fig. 1b).
2 crystallizes in a monoclinic space group C2/c. Its asymmetric unit contains two halfs of the I3− anion together with one [o-FBz-1-APy]+ cation. Parallel to the (0 0 1) plane, two irregular channel frameworks were constructed from anti-parallel arrangement Schiff base cations with sizes of about 5.6 × 7.2 Å2 and 7.5 × 9.8 Å2, where the crystallographically different I3− anion are filled inside the supramolecular channels (Fig. 1c and d). In the supramolecular channels, two crystallographically different I3− anions adopt two different packing models. The linear I3− ions containing I1 atom form dimers adopting a parallel end-overlapped model with I3−⋯I3− distances of 5.436 Å, as well as wavy line I3− ions containing I3 atom with I3−⋯I3− distances of 4.087 Å (Fig. 1c).
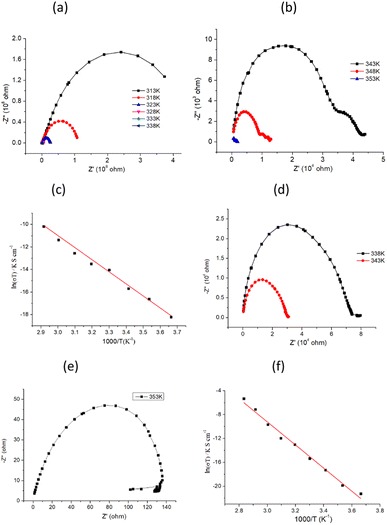
The conductivity of 1 was measured by alternating current impedance spectroscopy from 273 to 353 K under dry N2, and the Nyquist plots are shown in Fig. 2a, b, and S1.† In the temperature range of 273–293 K, no typical semicircle was observed for 1 in the Z′ − Z′′ plot (Fig. S1†), indicating that the conductivity of 1 is low. Above this temperature, conductivity tends to increase, revealing the existence of a thermally activated conduction mechanism. The fitting model for 1 at the selected temperature response comprised a series of two RC circuits, in which the capacitances were replaced by constant phase elements (CPE). This allowed us to tentatively evaluate the conductivity of the sample as calculated from the value of Z′ in the low-frequency end of the semicircle, where Z′′ supposedly reaches the abscissa axis. As shown in Fig. 2a and b, the radius of the semicircle decreases, corresponding to an increase in conductivity value as the temperature increases. The best fit gave a conductivity of 1.53(5) × 10−7 S cm−1 at 293 K and reached 1.03(4) × 10−4 S cm−1 at 343 K (Fig. S2†), which is higher than that of the iodide ion conductor [Mn(en)3]I2 (σ = 1.37 × 10⁻⁶ S cm−1 at 423 K).13 For a typical iodide ionic conductivity CuPbI3, the conductivity is in the order of magnitude 10−8 S cm−1 at 298 K.28 The conductivity of 1 is about three orders of magnitude compared to CuPbI3. The temperature-dependent conductivity is plotted in the form of ln versus 1000/T, as shown in Fig. 2c, which shows a linear relationship in the temperature range of 273–343 K, and the activation energy (Ea) was fitted by the Arrhenius equation (eqn (1)):
 | (1) |
The Z′ − Z′′ plots of 2 are similar to those of 1, as shown in Fig. 2d, e, S3 and S4.† From 253 to 353 K, the graphs turn from pitch to semicircles, and the radius of the semicircle decreases as the temperature increases. This is due to the decrease in bulk resistance as the temperature increases, revealing that 2 is also an activated thermal conduction mechanism. The conductivity can be simulated using an equivalent circuit (EC), and the values are 3.11(5) × 10−8 S cm−1 at 293 K, 8.90(5) × 10−4 S cm−1 at 343 K, and 4.94(3) × 10−3 S cm−1 at 353 K (Fig. S5†). The conductivity of 2 is slightly higher than that of 1 at high temperatures. The temperature-dependent conductivity is plotted, as illustrated in Fig. 2f, and the fitted activation energy is equal to 0.23(2) eV, which is slightly less than that of 1.
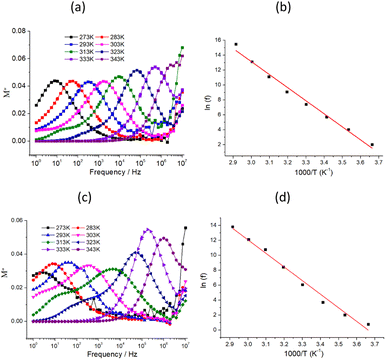
The variation of the dielectric loss (tan(δ)) with the temperatures at various frequencies is shown in Fig. S6.† Relaxation peaks were observed at 343 K and 10 kHz. Dielectric relaxation is the result of the reorientation process of dipoles or ion migration, which is the extrinsic nature of the materials. However, electrode polarization and the space charge injection effect can also induce dielectric relaxation. In the low-frequency region, tan(δ) gradually increases as the temperature increases owing to electrode polarization in compound 1 (Fig. S7†). To reduce the electrode polarization and space charge injection effect at low frequency, dielectric modulus analysis was used. The electric modulus (M*) is calculated using the following equation:
 | (2) |
 | (3) |
 | ||
Fig. 3 (a) and (c) Frequency dependencies of the M′′ in the 273–343 K temperature range for 1 and 2, respectively; (b) and (d) plots of ln![[thin space (1/6-em)]](https://www.rsc.org/images/entities/char_2009.gif) f versus 1/T for the dielectric relaxation of 1 and 2 (f is ac field frequency), respectively, where the solid squares and the red line represent the experimental data and fitted line using eqn (3). f versus 1/T for the dielectric relaxation of 1 and 2 (f is ac field frequency), respectively, where the solid squares and the red line represent the experimental data and fitted line using eqn (3). | ||
In summary, we presented two Schiff base iodide compounds and explored their dielectric properties and conduction behavior. The linear I3− ions are stacked into different shaped polyiodide chains, and the irregular channel frameworks were constructed from Schiff base cations in two compounds, where the polyiodide anions are located in the channel. The analysis of dielectric relaxation and impedance spectra disclosed that the two compounds showed intrinsic iodide ion conductance with a higher conductivity of 1.03(4) × 10−4 S cm−1 at 343 K for 1 and 4.94(3) × 10−3 S cm−1 at 353 K for 2. The conductivity mechanism can be attributed to the migration of iodide ions. This study opens a way to synthesize single-component solid-state electrolytes with high conductivity using solid-state DSSCs.
Conflicts of interest
There are no conflicts to declare.Acknowledgements
The authors thanks Natural Science Foundation and ‘333’ projet of Jiangsu Province for financial support (grant no: BK20171125, BRA2017017).References
- E. H. Brian, J. S. Henry and D. M. Michal, Nat. Photonics, 2012, 6, 162 CrossRef.
- Y. Aswani, H. W. Lee, H. N. Tsao, C. Y. Yi and A. K Chandiran, Science, 2011, 334, 629 CrossRef PubMed.
- W. Peng, S. M. Zakeeruddin, P. Comte, I. Exnar and M. Grätzel, J. Am. Chem. Soc., 2003, 125, 1166 CrossRef.
- N. Kamaya, K. Homma, Y. Yamakawa, M. Hirayama, R. Kanno, M. Yonemura, T. Kamiyama, Y. Kato, S. Hama, K. Kawamoto and A. Mitsui, Nat. Mater., 2011, 10, 682 CrossRef CAS PubMed.
- X. Y. Dong, R. Wang, J. B. Li, S. Q. Zang, H. W. Hou and T. C. W. Mak, Chem. Commun., 2013, 49, 10590 RSC.
- R. Wang, X.-Y. Dong, H. Xu, R.-B. Pei, M.-L. Ma, S.-Q. Zang, H.-W. Hou and T. C. W. Mak, Chem. Commun., 2014, 50, 9153 RSC.
- K. A. Mauritz and R. B. Moore, Chem. Rev., 2004, 104, 4535 CrossRef CAS PubMed.
- J. Li, K. G. Wilmsmeyer, J. Hou and L. A. Madsen, Soft Matter, 2009, 5, 2596 CAS.
- B. E. Kidd, M. D. Lingwood, M. Lee, H. W. Gibson and L. A. Madsen, J. Phys. Chem. B, 2014, 118, 2176 CrossRef CAS PubMed.
- X. Y. Dong, R. Wang, J. B. Li, S. Q. Zang, H. W. Hou and T. C. W. Mak, Chem. Commun., 2013, 49, 10590 RSC.
- R. Wang, X.-Y. Dong, H. Xu, R.-B. Pei, M.-L. Ma, S.-Q. Zang, H.-W. Hou and T. C. W. Mak, Chem. Commun., 2014, 50, 9153 RSC.
- X. P. Li, H. Yang, Z. F. Tian, J. L. Liu and X. M. Ren, Dalton Trans., 2015, 44, 4665 RSC.
- X. Chen, C. Xue, S. X. Liu, J. L. Liu, Z. Y. Yao and X. M. Ren, Dalton Trans., 2017, 46, 12916 RSC.
- H. Stephen, Rep. Prog. Phys., 2007, 67, 1233 Search PubMed.
- J. M. Pringle, P. C. Howlett, D. R. MacFarlane and M. J. Forsyth, Mater. Chem., 2010, 20, 2056 RSC.
- J. M. Pringle, Phys. Chem. Chem. Phys., 2013, 15, 1339 RSC.
- D. R. MacFarlane, J. Huang and M. Forsyth, Nature, 1999, 402, 792 CrossRef CAS.
- S. Long, P. Howlett, D. MacFarlane and M. Forsyth, Solid State Ionics, 2006, 177, 647 CrossRef CAS.
- Q. Dai, D. R. MacFarlane, P. C. Howlett and M. Forsyth, Angew. Chem., Int. Ed., 2005, 44, 313 CrossRef CAS PubMed.
- P. Wang, S. M. Zakeeruddin, J. E. Moser, R. Humphry-Baker and M. Grätzel, J. Am. Chem. Soc., 2004, 126, 7164 CrossRef CAS PubMed.
- N. Mohmeyer, D. B. Kuang, P. Wang, H. W. Schmidt, S. M. Zakeeruddin and M. Grätzel, J. Mater. Chem., 2006, 16, 2978 RSC.
- Z. G. Chen, F. Y. Li, H. Yang, T. Yi and C. H. Huang, ChemPhysChem, 2007, 8, 1293 CrossRef CAS PubMed.
- Y. Zhao, J. Zhai, J. L He, X. Chen, L. Chen, L. B. Zhang, Y. X. Tian, L. Jiang and D. B. Zhu, Chem. Mater., 2008, 20, 6022 CrossRef CAS.
- H. Wang, X. Zhang, F. Gong, G. Zhou and Z.-S. Wang, Adv. Mater., 2012, 24, 121 CrossRef CAS PubMed.
- A. B. F. Martinson, T. W. Hamann, M. J. Pellin and J. H. Hupp, Chem.–Eur. J., 2008, 14, 4458 CrossRef CAS PubMed.
- (a) H. Wang, J. Li, F. Gong, G. Zhou and Z. S. Wang, J. Am. Chem. Soc., 2013, 135, 12627 CrossRef CAS PubMed; (b) J. V. Vaghasiya, K. K. Sonigara, S. S. Soni and S. C. Tan, J. Mater. Chem. A, 2018, 6, 4868 RSC.
- S. S. Yu, H. R. Zhao, J. H. Shi, H. Zhang and H. B. Duan, CrystEngComm, 2021, 23, 8150 RSC.
- T. A. Kuku, Thin Solid Films, 1998, 325, 246 CrossRef CAS.
Footnote |
| † Electronic supplementary information (ESI) available: Dielectric permittivity and impedance spectra. See DOI: https://doi.org/10.1039/d3ra02416d |
| This journal is © The Royal Society of Chemistry 2023 |


