
 Open Access Article
 This Open Access Article is licensed under a Creative Commons Attribution-Non Commercial 3.0 Unported Licence
Design of screen-printed potentiometric platform for sensitive determination of mirabegron in spiked human plasma; molecular docking and transducer optimization†
Aya A. Mouhamed a,
Basma M. Eltananya,
Nadia M. Mostafaa,
Tamer A. Elwaiebc and
Ahmed H. Nadim*a
a,
Basma M. Eltananya,
Nadia M. Mostafaa,
Tamer A. Elwaiebc and
Ahmed H. Nadim*a
aDepartment of Analytical Chemistry, Faculty of Pharmacy, Cairo University, Kasr El-Aini St., Cairo 11562, Egypt. E-mail: ahmed.nagib@pharma.cu.edu.eg
bDepartment of Pharmaceutical Chemistry, Faculty of Pharmacy, Cairo University, Kasr El-Aini St., Cairo 11562, Egypt
cDepartment of Pharmaceutical Sciences, Irma Lerma Rangel College of Pharmacy, Texas A&M Health Science Centre School of Pharmacy, Texas 78363, USA
First published on 1st August 2023
Abstract
The integration of molecular modelling simulation and electrochemical sensors is of high interest. Herein, for the first time, a portable solid-contact potentiometric electrode was designed for the sensitive determination of mirabegron (MIR) in human plasma and pharmaceutical formulation. A two-step optimization protocol was investigated for the fabrication of an ion on sensing polymeric membrane. First, molecular docking was used for optimum ionophore selection. Calix[6]arene showed the highest affinity towards MIR with a better docking score (−4.35) and potential energy (−65.23) compared to other calixarene derivatives. Second, carbon nanotubes and gold nanoparticles were investigated as ion-electron transducers using a drop-casting procedure. Gold nanoparticle-based sensors showed better slope, potential stability, and rapid response compared to carbon nanotubes. The proposed solid contact sensors (V–VII) showed comparable sensitivity and ease of handling compared to liquid contact sensors (I–IV). The optimized gold nanoparticles sensor VII produced a Nernstian response over the range of 9.77 × 10⁻⁷ to 1 × 10⁻³ M with LOD of 2.4 × 10⁻⁷ M. It has also been used to determine MIR in its pharmaceutical formulation in the presence of a co-formulated antioxidant butylated hydroxytoluene and spiked human plasma. This would offer a feasible and economic platform for monitoring MIR in pharmaceutical preparation and biological fluids.
1. Introduction
Overactive bladder (OAB) is a disorder characterized by urine urgency, with or without urinary incontinence, and nocturia. MIR is a beta-3 adrenergic receptor agonist that provides a better safety profile for OAB patients with advanced age and cognitive deficits.1 Recently, MIR has been approved for the treatment of neurogenic detrusor over-activity in children.2 It is chemically known as 2-(2-amino-1,3-thiazol-4-yl)-N-[4-[2[[(2R)-2-hydroxy-2-phenyl-ethyl]amino]ethyl]phenyl]acetamide3 (Fig. S1†). Few analytical methods were developed for the analysis of MIR such as chromatographic,4,5 spectrophotometric,6,7 and voltammetric8 methods. To the best of our knowledge, no potentiometric sensor has been reported for the determination of MIR.Ion-selective electrodes (ISEs) have been widely used in pharmaceutical, biological fluids, and environmental analysis.9,10 The ionophore is a key ingredient in membrane fabrication. It is responsible for the desirable selectivity in ISEs. Host–guest chemistry, represented by the ionophore–analyte interaction, accounts for better ionophore selection. It results in low limits of detection (LOD) and enhancement of sensitivities of the fabricated sensors.11 Calixarene derivatives are macrocyclic compounds with endless potential. They have large cavities which allow efficient binding with large ions. They are used as ionophores in sensors that detect nitrogen-containing ions like protonated amines and amino acid esters.11 Due to the lack of a potentiometric technique suitable for the assay of MIR in the examined matrices (formulation, and spiked human plasma), the selection of the optimum ionophore is of interest. Molecular modelling is a powerful alternative to predict and evaluate the binding between the host ionophores and the studied guest molecule. The binding energy could be assessed through docking score functions. Such calculations would help in selecting the optimum target molecule with minimum experimental runs and thus save time and effort.12
Great challenges were exerted to eliminate the inner filling solution to get a stable and reproducible response with long-term storage resulting in the development of solid-contact ISEs. Later, the application of screen-printed electrodes (SPEs)13–15 is considered a breakthrough. SPEs have extra advantages over other conventional solid-contact electrodes (coated wire electrodes and glassy carbon electrodes), as being cheap, disposable, easily handled, and stored with reproducible and reliable response in addition to their versatility and commercial availability. However, SPEs are susceptible to instability as other classical solid contact electrodes because of internal water layer formation and ion-to-electron transduction hindrance.16 Hence, to reduce the formation of the water layer, a hydrophobic conducting polymer layer was added on the surface of the solid contact and acted as an ion-to-electron transducer. Even though these conducting polymers decreased detection limits and signal drifts.17
Another alternative to reduce water layer and increase signal stability is the use of nanoparticles. Although nanoparticles are not part of the direct electrode's sensing mechanism, they have been incorporated into the SPEs to offer higher signal, increase electrode stability, and eradicate the undesired water layer. Single-walled carbon nanotubes,18 multiwall carbon nanotubes (MWCNT),19 graphene,20 and most recently gold nanoparticles (GNP)17 are the most commonly used candidates. In the production of electrochemical sensors, GNP are known to be a suitable modifier for electrode surfaces. Due to their great quality such as tunable physiochemical properties, outstanding electrical conductivity, oxidation resistance, high stability, simple production, limited size distribution, excellent biocompatibility, capacity for surface modification, vast surface area, and excellent catalytic activities.21 Also, MWCNT have one of the simplest chemical compositions and atomic bonding configurations among nanomaterials. Their distinct structural, electrical, and mechanical characteristics make them a particularly appealing material for a wide range of applications.22
The aim of the work was to optimize a sensitive potentiometric screen-printed electrode for MIR assay in its formulation matrix and spiked human plasma. A computer-aided molecular design platform was performed to study the binding characteristics of each ionophore with the drug. Then, the electrochemical performance of gold nanoparticles and carbon nanotubes as transducers was compared for better potentiometric stability, selectivity, and sensitivity.
2. Experimental
2.1 Chemicals and reagents
A pure sample of MIR was supplied by the Egyptian Drug Authority (EDA), Egypt. Its purity was found to be 99.99 ± 0.612. A pure sample of butylated hydroxytoluene (BHT) was supplied by Oxiris Chemicals SA, Spain. Bladogra® tablets, batch number (AT02880322), were manufactured by APEX Pharma, Egypt, and labelled to contain 50 mg of MIR per tablet. High molecular weight polyvinyl chloride (PVC), 2-nitrophenyl octyl ether (o-NPOE), potassium tetrakis(4-chlorophenyl)borate (K-TCPB), calix[4]arene (CX-4), calix[6]arene (CX-6), calix[8]arene (CX-8). Carbon screen-printed electrodes (SPE) 3 mm diameter were purchased from CH Instruments, Inc. (USA). Gold nanoparticles (5 nm diameter), multi-wall carbon nanotube powder (MWCNT), tetra-butyl ammonium bromide, sodium hydroxide, xylene, orthophosphoric acid solution, and potassium dihydrogen orthophosphate were purchased from Sigma Aldrich (USA). Tetrahydrofuran (THF) was obtained from BDH (England). Sodium chloride, magnesium sulfate, ammonium chloride, potassium chloride, and calcium chloride were obtained from El-Nasr Pharmaceutical Chemicals Co. (Egypt). Human plasma was obtained from Holding Company for Biological Products and Vaccines, VACSERA (Egypt). Phosphate buffer (pH 7.4 ± 0.1) was prepared by adding 2.8 g of potassium dihydrogen orthophosphate in 700 mL of distilled water then pH was adjusted to 7.4 using 0.1 M sodium hydroxide solution. Volume was completed to 1000 mL with water.2.2 Instrument and software
Jenway digital ion analyzer model 3330 (UK) with Ag/AgCl double-junction as reference electrode (Aldrich Chemical Co., Germany) was used to measure the potential difference. pH glass electrode (Jenway, UK) was used for pH adjustment. The Molecular Operating Environment software (MOE) version 2014 was used to study docking.2.3 Standard solutions
MIR stock standard solution (1 × 10⁻² M) was prepared in phosphate buffer pH 7.4. Working solutions of varying concentrations (1 × 10⁻⁷ to 1 × 10⁻³ M) were freshly prepared by serial dilutions from the stock solution using phosphate buffer pH 7.4 as a solvent.2.4 Procedure
For the liquid contact membrane (LC) sensor I. 33.17 wt% PVC, 66.60 wt% NPOE, and 0.23 wt% K-TCPB (total 600 mg) were dissolved in about 6.00 mL THF. The solution was then poured into a Petri dish (5 cm diameter), the dish was covered with filter paper, and the solvent was allowed to evaporate overnight at room temperature, resulting in a master membrane with a thickness of ≈0.1 mm.
For ionophore-doped membranes. The CX-4 membrane sensor II contained 32.79 wt% PVC, 66.60 wt% NPOE, 0.25 wt% K-TCPB, and 0.36 wt% CX-4. The CX-6 membrane sensor III contained 32.54 wt% PVC, 66.60 wt% NPOE, 0.25 wt% K-TCPB, and 0.64 wt% CX-6. The CX-8 membrane sensor IV contained 32.21 wt% PVC, 66.60 wt% NPOE, 0.25 wt% K-TCPB, and 0.94 wt% CX-8. The ion exchanger and the ionophore were doped in a molar ratio of 1
![[thin space (1/6-em)]](https://www.rsc.org/images/entities/char_2009.gif) :2 in all membranes.
:2 in all membranes.
For solid contact membranes. Preparation of multiwall carbon nanotubes: the solution dispersion method was used16 to prepare carbon nanotubes. 10.0 mg of carbon nanotubes powder were dispersed in 1 mL xylene by ultra-sonication for 5 min. 95.0 mg PVC was dissolved into 3.00 mL of THF using 0.2 mL NPOE as a plasticizer. The THF solution was mixed with carbon nanotubes dispersion and sonicated at least for 20 min to obtain a uniform suspension.
For screen-printed sensor V (without transducer): 10.0 μL of the CX-6 membrane before dryness was applied on a carbon SPE and allowed to evaporate overnight at room temperature.
For multi-wall carbon nanotubes screen printed (MWCNT SP) sensor VI: MWCNT solid layers were prepared by drop-casting 10.00 μL of MWCNT dispersion on a carbon SPE and allowed to evaporate overnight at room temperature. Then, 10.0 μL of the CX-6 membrane before drying was applied to a carbon SPE and allowed to evaporate overnight at room temperature.
For gold nanoparticles screen printed, (GNP SP) sensor VII: GNP solid layers were prepared by drop casting 10.00 μL of GNP dispersion on a carbon SPE and allowed to evaporate overnight at room temperature. Then, 10.0 μL of the CX-6 membrane before drying was applied to a carbon SPE and allowed to evaporate overnight at room temperature.
SPEs sensors V, VI, VII were kept in MIR 1 × 10⁻⁴ M stock standard solution for 24 hours and stored in the same solution when not in use.
2.5 Docking study
The docking study was performed using the Molecular Operating Environment software (MOE) version 2014. The hosting ionophores (CX-8, CX-6, and CX-4) and the guest molecule (MIR) were prepared for docking using 3D protonation of the structure at pH 7.4. The conformational analysis using a systematic search was scanned then the lowest energetic conformer was chosen.2.6 Sensors potential stability and water layer test
The water layer test,20 was performed by measuring the response of the screen-printed electrodes (SP sensors V, VI, VII) for three hours. First hour in 1 × 10⁻³ M MIR. Second hour in 1 × 10⁻² M tert-butyl ammonium bromide and again in 1 × 10⁻³ M MIR for the third hour. The signal drift was monitored by recording the emf values every 2 min during the first hour.2.7 Sensors calibration
Each sensor was separately conjugated with a double-junction Ag/AgCl reference electrode, calibrated by being immersed in MIR drug solutions (1 × 10⁻⁷ to 1 × 10⁻³ M). Solutions were allowed to equilibrate while stirring by a magnetic stirrer until achieving a constant reading of the potentiometer. The electromotive forces (emf) were recorded to within ±1 mV for LC sensor I, ±0.5 mV for SP sensor II, ±0.3 mV for MWCNT SP sensor III, and ±0.3 mV for GNP SP sensor IV. Calibration graphs were plotted that related the recorded emf from the seven proposed sensors versus the −log molar concentrations of MIR. Regression equations were calculated for the seven proposed sensors. The electrochemical performance of the proposed sensors was evaluated according to the IUPAC recommendations.232.8 Effect of pH on gold nanoparticles screen printed sensor VII
The influence of pH on the response of the most stable GNP SP sensor VII was studied over a pH range of 2–10 using the 1 × 10⁻⁴ M and 1 × 10⁻³ M MIR solutions. At each pH value, the potential was recorded.2.9 Selectivity of gold nanoparticles screen printed sensor VII
The degree of foreign substance interference with MIR using GNP SP sensor VII was studied using the separate solutions method (SSM).24 The potential response of the sensor was recorded in the presence of inorganic-related compounds and in the presence of the main excipient BHT and co-administered drug solifenacin. The potentiometric selectivity coefficient (KPot) was calculated.2.10 Direct potentiometric determination of mirabegron
3. Results and discussion
SPEs provide the choice to construct eco-sustainable, portable, and quick analytical procedures for detecting analytes in different matrices.25 The proper selection of the ionophore and the transducer have a synergic effect on the selective and sensitive determination of the analyte. As a result, the current study introduces a novel solid-contact sensor for measuring MIR in pharmaceutical formulations and spiked human plasma. The study investigated the impact of various ionophores on the designed sensors' response stability, sensitivity, and selectivity.3.1 Membrane fabrication
A polymeric PVC membrane was used to provide consistent support. NPOE was incorporated as a plasticizer to provide membrane malleability. The strongest basic pKa value of MIR is 9.62, thus it behaves as a cation in an acidic medium. Therefore, an LC-ISE was fabricated for MIR determination with a cation exchanger. It offered anionic sites inside the membrane matrix to increase conductivity and reduce the interference caused by lipophilic anions coextraction (Donnan's effect).26 A preliminary study was conducted using LC sensors to investigate the effect of the cation exchanger type on the potentiometric performance. Using sodium tetra phenyl borate (NaTPB) resulted in a weak Nernstian slope (43.202 ± 0.23). Upon replacing NaTPB with a more lipophilic and stable ion exchanger, potassium tetrakis(chlorophenyl)borate (K-TCPB), enhancement of the Nernstian slope was observed.3.2 Molecular docking
All ionophores have an easily well-defined cavity for molecular recognition. The structure of these ionophores is flexible allowing the binding sites to have an optimized binding conformation with minimal energy.26 The selectivity of ionophores depends on the cavity size and the conformation of the molecule binding strength of these receptors to the target ion via cation interactions.27 Our study studied calixarene derivatives, such as CX-4, CX-6, and CX-8, to recognize MIR selectively. They can develop separate interactions with guest molecules, such as hydrogen bonding, π–π, and cation–electrostatic interactions. The additional lipophilic moieties are compatible with the solvent mediator, and their polar functional groups generate a basket shape suitable for molecular recognition.28Molecular docking was conducted to study the stability of the inclusion complex of MIR with CX-4, CX-6, and CX-8. A docking study was performed using MOE (2014) software package, and the 3D-crystal structures of different calixarenes were obtained from their corresponding files on pdb. The hosting ionophores and the guest molecule (MIR) were prepared for docking using 3D protonation of the structure scanning the conformational search analysis to select the global minimum energy conformers. A molecular docking study illustrated a well-fitted MIR conformer within the cavity of CX-6 than CX-4 or CX-8. MIR demonstrated a hydrogen bonding along with π–π and π–alkyl interactions with CX-6, unlike CX-4 or CX-8 which forms only weak π–π interaction with MIR (Fig. 1). Additionally, the docking score (s) and potential energy of the molecular system (E) values confirmed that the CX-6 forms a more stable inclusion complex with mirabegron than CX-4 or CX-8. The (s, E) values were (−4.35, −65.23), (−4.19, −62.30), and (−4.15, −64.19) for CX-6, CX-4, and CX-8, respectively. The highest docking score value was recorded for CX-6 – MIR complex showing the best stability. Results from the computational model agreed with the experimental findings, where sensor III (CX-6) showed the best slope and sensitivity among the examined sensors (Table 1). Therefore, CX-6 was chosen for further experiments.
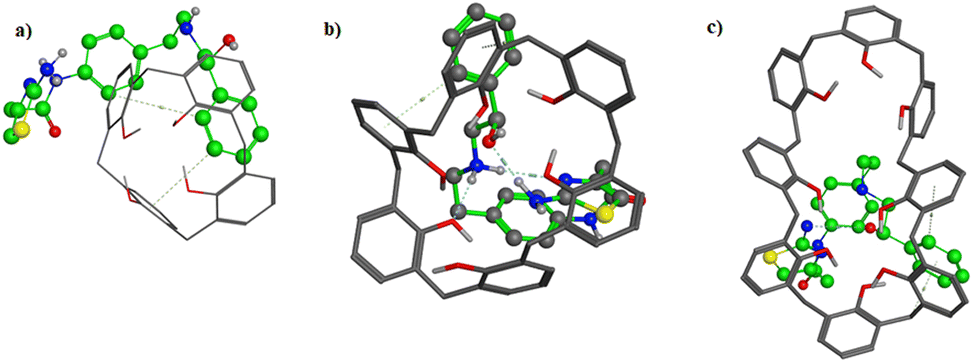 | ||
| Fig. 1 Three-dimensional docking of mirabegron in (a) calix[4]arene, (b) calix[6]arene, and (c) calix[8]arene. | ||
| Parameter | LC sensor I | LC sensor II | LC sensor III | LC sensor IV | SP sensor V | MWCNT SP sensor VI | GNP SP sensor VII |
|---|---|---|---|---|---|---|---|
| a Average of three determinations (n = 9).b Repeatability: the intraday precision (n = 9), average of three concentrations repeated three times within the day.c Intermediate precision: the inter-day precision (n = 9), average of three concentrations repeated three times on three consecutive days.d LOD (limit of detection) was measured by interception of the extrapolated arms of Fig. 5 and S2. | |||||||
| Slope (mV per decade) | 50.398 ± 306.15 | 55.761 ± 328.71 | 58.886 ± 367.55 | 56.235 ± 339.85 | 50.207 ± 1.49 | 52.233 ± 0.09 | 57.513 ± 0.06 |
| Intercept (mV) | 306.15 | 328.71 | 367.55 | 339.85 | 319.73 | 350.54 | 414.02 |
| Correlation coefficient (r) | 0.9997 | 0.9994 | 0.9999 | 0.9997 | 0.9996 | 0.9996 | 0.9998 |
| Concentration range (M) | 1.56 × 10⁻⁵ to 1 × 10⁻³ | 3.91 × 10⁻⁶ to 1 × 10⁻³ | 1.95 × 10⁻⁶ to 1 × 10⁻³ | 3.91 × 10⁻⁶ to 1 × 10⁻³ | 3.91 × 10⁻⁶ to 1 × 10⁻³ | 9.77 × 10⁻⁷ to 1 × 10⁻³ | 9.77 × 10⁻⁷ to 1 × 10⁻³ |
| Working pH range | 6–8 | 6–8 | 6–8 | 6–8 | 6–8 | 6–8 | 6–8 |
| Response time (s) | 25 | 25 | 25 | 25 | 7 | 5 | 2 |
| Stability (weeks) | 4 | 4 | 4 | 4 | 4 | 4 | 4 |
| Average accuracya ± S.D. | 100.11 ± 0.603 | 99.21 ± 0.782 | 100.25 ± 0.182 | 100.33 ± 0.381 | 100.09 ± 1.668 | 100.74 ± 1.164 | 101.96 ± 0.205 |
| Repeatabilityb (RSD%) | 0.217 | 0.251 | 0.625 | 0.812 | 0.533 | 0.532 | 0.274 |
| Intermediate precisionc (RSD%) | 0.752 | 0.812 | 0.823 | 0.798 | 1.014 | 1.159 | 0.804 |
| LODd (M) | 1 × 10⁻⁵ | 5.3 × 10⁻⁶ | 8.9 × 10⁻⁷ | 5.3 × 10⁻⁶ | 6.1 × 10⁻⁷ | 4.0 × 10⁻⁷ | 2.4 × 10⁻⁷ |
3.3 Screen printed electrodes using calix[6]arene membrane
Three disposable solid contact screen-printed ISEs were fabricated for on-spot monitoring (Fig. 2). They were used for determination of MIR utilizing the CX-6 doped membrane as the sensing membrane. SP sensor V contained only the CX-6 membrane. MWCNT SP sensor VI was first doped with a thin interlayer of carbon nanotube then CX-6 membrane was applied. SP GNP sensor VII was first doped with a thin interlayer of gold nanoparticles then CX-6 membrane was applied. The signal drifting experiment was carried out via chronopotentiometric measurements performed using open circuit potential. It was tested by taking emf data every 2 minutes for an hour for an average of three electrodes for each SP sensor. Both MWCNT SP sensor VI and GNP SP sensor VII showed improvement in stability and minimal signal drifting of approximately 0.7 mV h−1 and 0.5 mV h−1 only when compared to SP sensor V which showed signal drifting of about 8.3 mV h−1 (Fig. 3). These findings demonstrated that adding nanoparticles to an electrode improves both electrode stability and signal drifting significantly.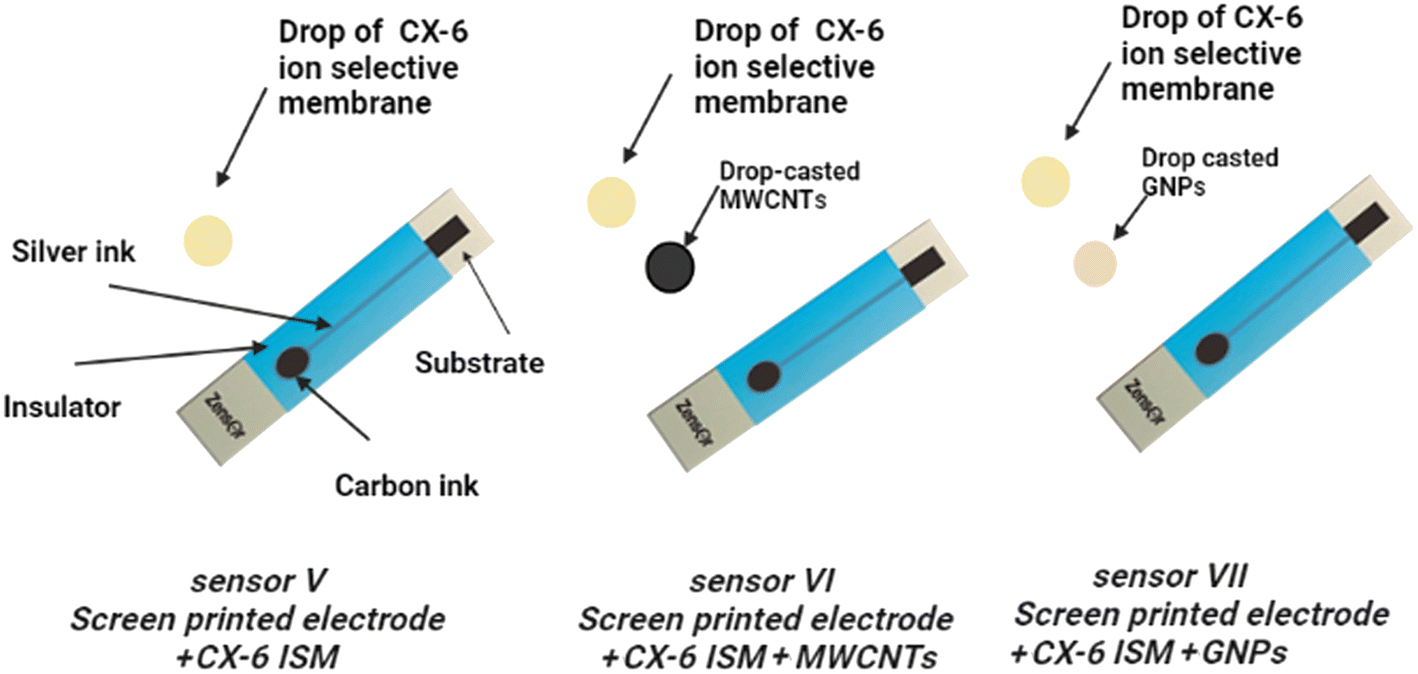 | ||
| Fig. 2 Schematic representation of screen printed electrodes (V–VII). | ||
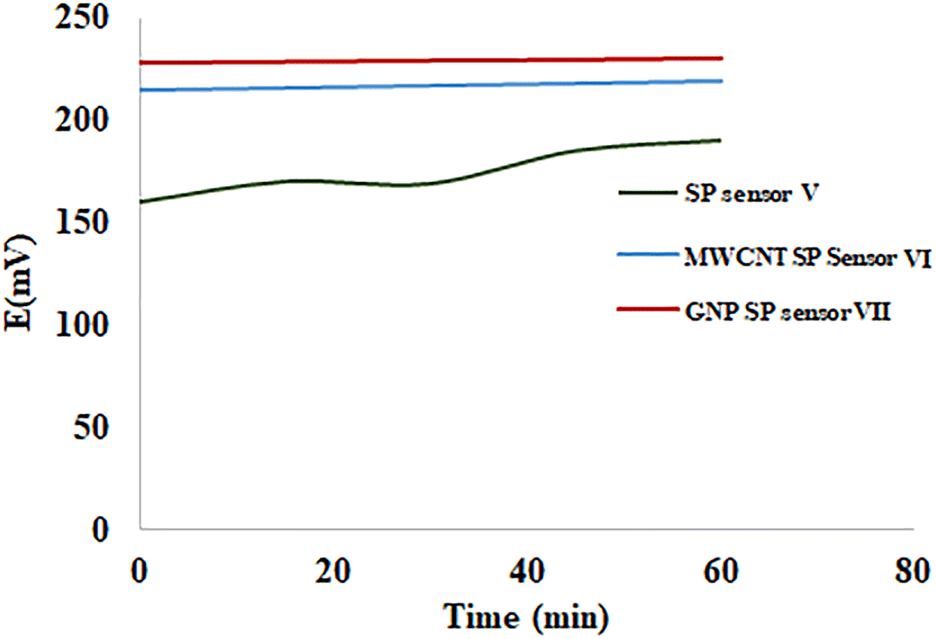 | ||
| Fig. 3 Signal drift for screen printed sensor V, multi-wall carbon nanotubes screen printed sensor VI, and gold nanoparticles screen printed sensor VII. Measurements were recorded in 1 × 10⁻³ M MIR. | ||
3.4 Sensors potential stability and water layer test
An increase in potential was observed upon carrying the measurements in a 1 × 10⁻² M solution of a cationic structurally relative compound (tetra butyl ammonium bromide). This increase is due to the substitution of MIR in the water film formed between the PVC sensing membrane and the carbon layer of the screen-printed substrate (SP sensor V), the MWCNT layer (MWCNT SP sensor VI), and the GNP layer (GNP SP sensor VII) by tetra butyl ammonium bromide. The final replacement of the test solution (1 × 10⁻² M tetra butyl ammonium bromide) by the original 1 × 10⁻³ M MIR solution exhibited an almost null potential drift GNP SP sensor VII compared to MWCNT SP sensor VI and SP sensor V. The data presented in Fig. 4 clearly demonstrated that GNP showed comparable results with MWCNT. Thus, it proved that GNP offered the required hydrophobicity for the water layer test. Accordingly, a gold nanoparticle screen-printed electrode (GNP SP sensor VII) was employed for all the measurements. Hence, it was used to determine the pure drug; MIR, in Bladogra® tablets and spiked human plasma.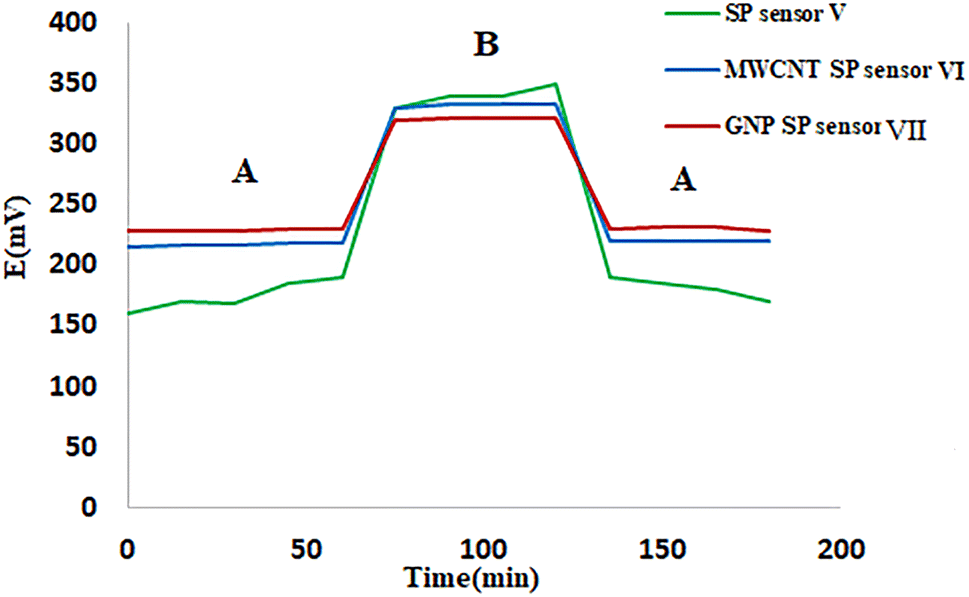 | ||
| Fig. 4 Water layer test for screen printed sensor V, multi-wall carbon nanotubes screen printed sensor VI, and gold nanoparticles screen printed sensor VII. Measurements were recorded in 1 × 10⁻³ M MIR (A) and 1 × 10⁻² M tetra butyl ammonium bromide (B). | ||
3.5 Sensors calibration and response time
The response properties of the proposed sensors were measured over a four-week time frame and the results are shown in Table 1. Calibration curves were plotted relating the recorded electrode potential from the proposed sensors versus the −log molar concentrations of MIR as shown in Fig. 5 and S2.† The slope of the curves using the calibration graph's linear portion was calculated as presented in Table 1. Over the course of four weeks, the sensors were tested and found to have reliable and accurate results. The quick response time of ISEs is still a key characteristic that helped the use of these electrodes for quality control since it reduces the amount of required analysis period. The recommended time for the sensors to obtain stable potential readings after raising the MIR level 10-fold was found to be 25 seconds for the LC sensors, 5 seconds for the SP sensor V, 4 seconds for the MWCNT SP sensor VI, and approximately 2 seconds for GNP SP sensor VII.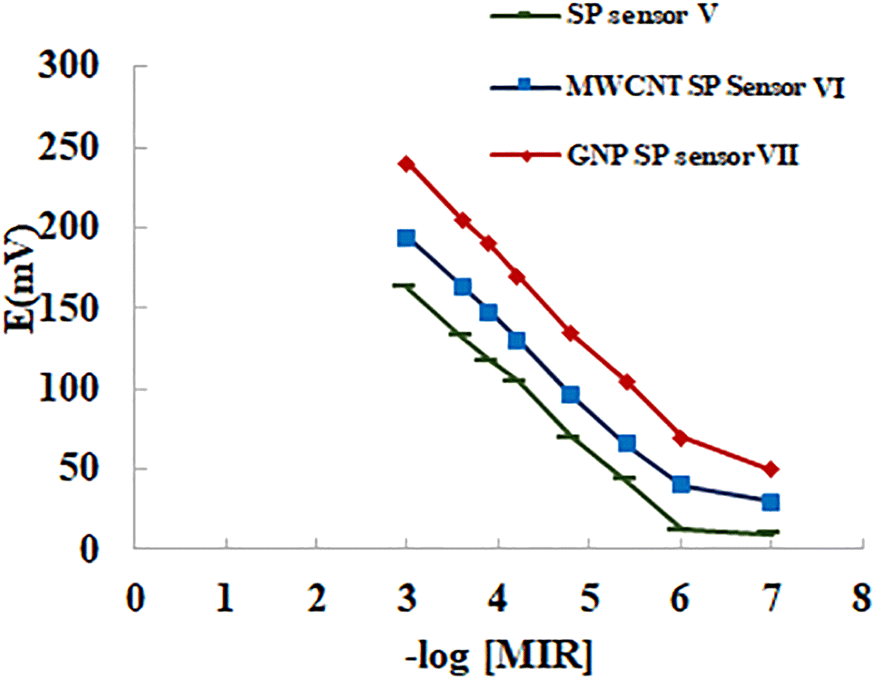 | ||
| Fig. 5 Profile of the potential in mV/−log MIR molar concentration using sensor V, multi-wall carbon nanotubes screen printed sensor VI, and gold nanoparticles screen printed sensor VII. | ||
3.6. Electrochemical impedance spectrometry (EIS) measurements
Electrochemical impedance spectroscopy (EIS) was conducted to characterize the GNPs transducer layer. The Nyquist plot (−Z′′ vs. Z′) for GNP SP sensor VII and SP sensor V was obtained using the frequency range (100 kHz to 0.1 Hz) as shown in Fig. 6. The EIS results were fitted to equivalent Randles circuit and the double layer capacitance (Cdl) in GNP SP sensor VII and SP sensor V was calculated and found to be 1.14 μF and 173 nF, respectively. While the charge transfer resistance measured for the GNP SP sensor VII electrode was 4.19 kΩ and for the SP sensor V electrode was 8.13 kΩ. These results confirmed that GNPs incorporation increased the electrode capacitance and reduced the transfer resistance which can explain the stability of the interfacial potential and improved charge transfer at the interface.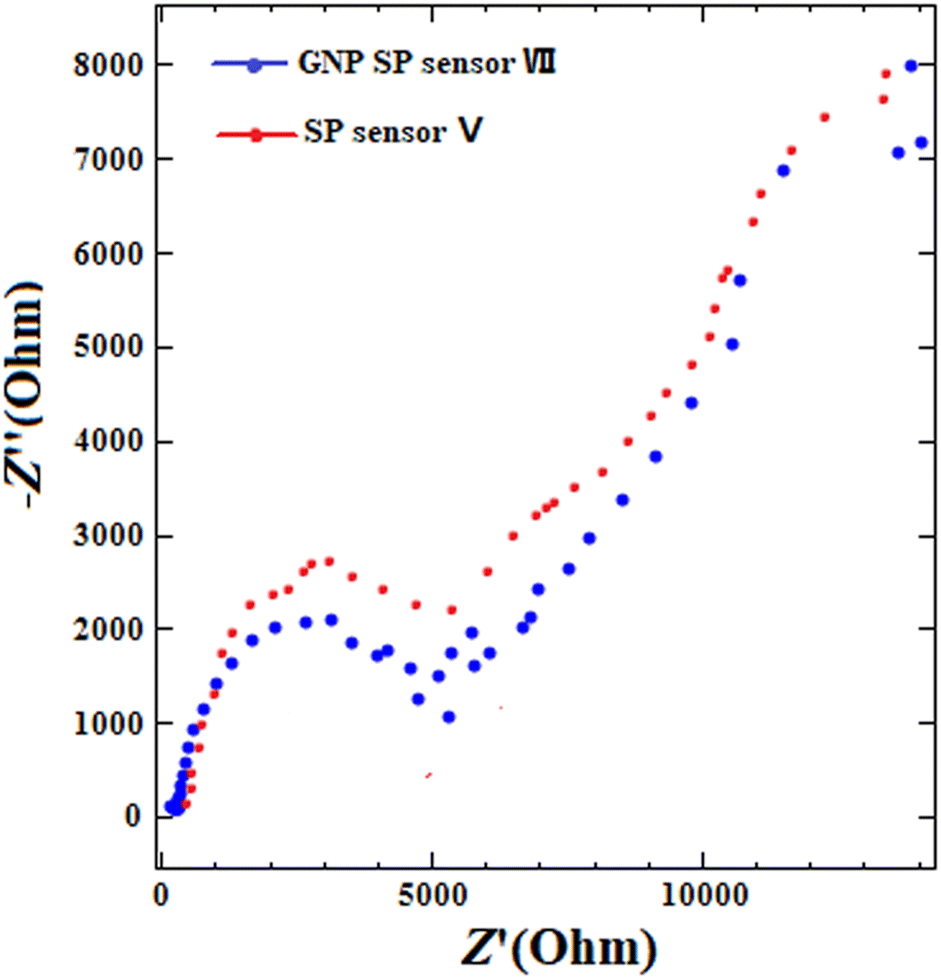 | ||
| Fig. 6 Nyquist plots of GNP SP sensor VII and SP sensor V. | ||
It should be noted the overall electrochemical performance of the GNP SP sensor was achieved through (i) the use of potassium tetrakis(chlorophenyl)borate as a lipophilic cationic exchanger which offered the required ion exchange sites for the cationic drug (MIR). (ii) The optimized selection of CX6 as an ionophore that enabled molecular recognition for optimal binding with minimal energy. (iii) The incorporation of GNP as a modifier for electrode's surface. Such efforts resulted in optimum sensor's selectivity and sensitivity as well as signal stability.
3.7 Effect of pH on gold nanoparticles screen printed sensor VII
The pH of the working solutions is a very critical factor to achieve complete drug ionization.29 Fig. 7 showed the effect of pH on the response of the most stable electrode (GNP SP sensor VII) over a pH range of 2–10 to achieve the optimum experimental conditions. In solutions with pH values of 6–8, where MIR was entirely ionized and detected, the sensor response was clearly stable. This finding, together with the fact that the MIR pKa value is 9.62, justifies our decision to employ phosphate buffer pH 7.4 for MIR determination.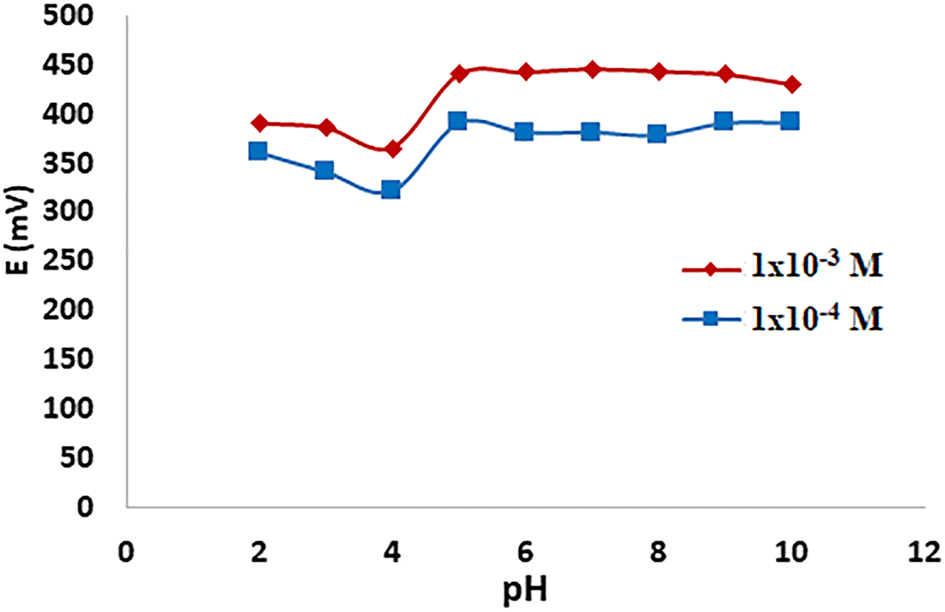 | ||
| Fig. 7 Effect of pH on the response of gold nanoparticles screen printed sensor VII using the 1 × 10⁻⁴ M and 1 × 10⁻³ M mirabegron solutions [working pH range: 6–8]. | ||
3.8 Gold nanoparticles screen printed sensor VII selectivity
The potentiometric selectivity coefficient was calculated using the following equation:| log(KPot) = (EMIR − EI/S) |
3.9 Potentiometric determination of MIR
| Nominal concentration (M) | Interday (n = 9) | Intraday (n = 9) | ||
|---|---|---|---|---|
| Accuracy | % RSD | Accuracy | % RSD | |
| QCL (3 × 10⁻⁶) | 97.79 | 0.79 | 97.66 | 0.38 |
| QCM (4 × 10⁻⁴) | 100.58 | 1.07 | 99.77 | 0.40 |
| QCH (8 × 10⁻⁴) | 101.24 | 1.02 | 101.39 | 1.02 |
3.10 Statistical data analysis
The results obtained by the GNP SP sensor VII were compared with those obtained by applying the reported method for the determination of MIR pure sample.4 The t and F test values were used to compare the mean and variance between the two compared methods where no significant difference in the results was found (Table 5).| Item | GNP SP sensor VII | Reported methoda |
|---|---|---|
| a HPLC method4 using C18 column (150 mm × 3.9 mm; 5 μm) and phosphate buffer pH 5: acetonitrile (50:50 v/v) as a mobile phase at flow rate 1 mL min−1 and UV detection at 249.0 nm.b Corresponding tabulated values for t and F (at p = 0.05). |
||
| Mean | 100.00 | 99.99 |
| S.D. | 0.633 | 0.612 |
| Variance | 0.401 | 0.375 |
| n | 7 | 5 |
| Student's t-testb | 0.027 (2.228) | |
| F testb | 1.069 (6.16) | |
3.11 Greenness assessment of the proposed method
The green index of the proposed method was assessed using two metrics: analytical eco-scale and analytical greenness metric procedures. Analytical eco-scale is a semi-qualitative tool based on giving penalty points to each element of analytical methodology subtracted from a base of 100. Penalty points were calculated for the proposed electrochemical method and the reported method for the determination of MIR.4 The proposed method showed a better score (eco-score = 88) than the reported method (eco-score = 76) due to the use of a large amount of acetonitrile organic solvent (Table 6). AGREE metric32 was also used to evaluate the method greenness. The full AGREE concept circulates around the twelve principles of green analytical chemistry (GAC) to allow thoroughness of input and clarity of output.32 Each input principle is converted into a score between 0 and 1. The final score is calculated from the assessment of all the principles. Our proposed method showed a greater score than the reported method4 as shown in Fig. 8.| Hazard | Penalty points | |
|---|---|---|
| Proposed method | Reported method4a | |
| a HPLC method using C18 column (150 mm × 3.9 mm; 5 μm) and buffer pH 5: acetonitrile (50:50 v/v) as a mobile phase at flow rate 1 mL min−1 and UV detection at 249.0 nm. |
||
| Reagents | ||
| Tetrahydrofuran | 6 | — |
| Acetonitrile | — | 15 |
| Potassium dihydrogen phosphate | 0 | 0 |
|
||
| Instruments | ||
| Energy | 0 | 1 |
| Occupational hazard | 0 | 0 |
| Waste | 6 | 8 |
| Total penalty points | 12 | 24 |
| Analytical eco-scale total score | 88 | 76 |
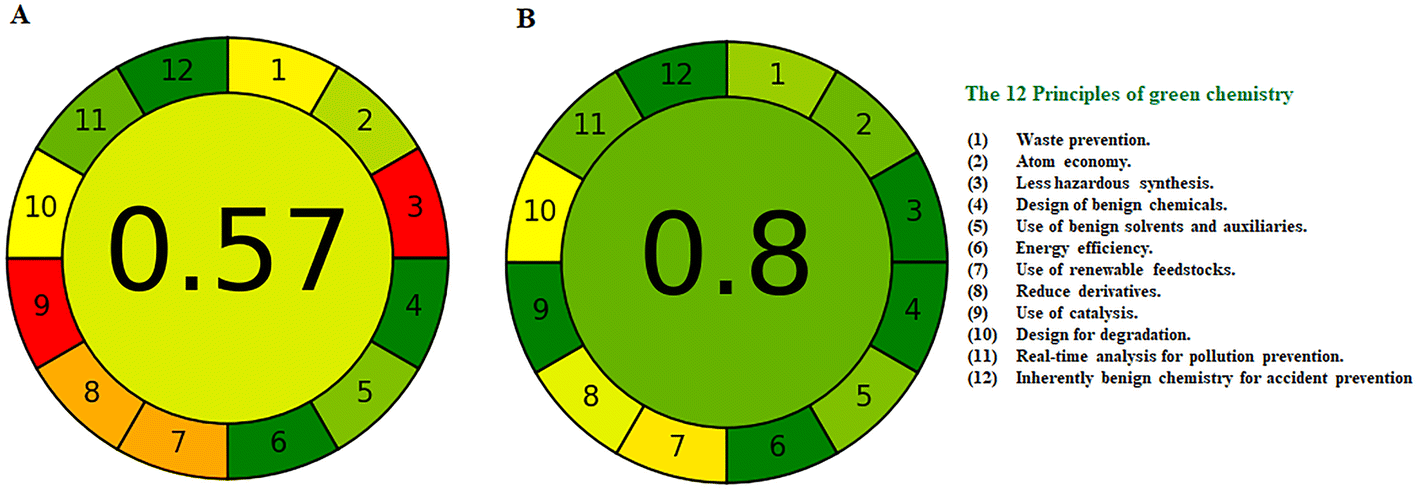 | ||
| Fig. 8 Agree green profile assessment of the reported method (A) [14] and (B) the developed potentiometric method for determination of mirabegron. | ||
4. Conclusion
The scope of this research was to develop an excellent green ion-selective electrode methodology, with good selectivity and low limit of detection, for the determination of MIR. Ionophore selection was the key measure of this work. Three calixarenes (4), (6), and (8) were consequently tested via molecular docking. Calixarene (6) formed the most stable complex with MIR compared to (4) or (8). Consequently, seven different sensors (four liquid contact and three solid contact SPEs electrodes) were designed. The plain solid contact SPE suffered from the formation of a water layer and then substantial drift. Hence, carbon nanotubes and gold nanoparticles were trialed as transducers. They showed negligible signal drifting and steady potential using the water layer test. The best detection limit (2.4 × 10⁻⁷ M) was obtained with the GNP SP sensor VII. Our proposed method using GNP SP sensor VII revealed to be an excellent green method for MIR detection in its formulation and in spiked human plasma without the need of using risky and hazardous solvents, sample pretreatment, or sophisticated equipment.Author contributions
Aya A. Mouhamed: methodology, investigation, formal analysis, visualization, writing – original draft. Basma M. Eltanany: supervision, validation, writing – review & editing. Nadia M. Mostafa: conceptualization, project administration, writing – review & editing, supervision. Tamer A. Elwaie: resources, data curation, formal analysis. Ahmed H. Nadim: methodology, data curation, formal analysis, validation, resources, writing – review & editing.Conflicts of interest
The authors state that they have no known competing financial interests or personal ties that could have influenced the research presented in this study. There is no conflict of interest to declare.Acknowledgements
The authors would like to thank Associate Prof. Dr Amr M. Mahmoud for his assistance and support during electrochemical impedance spectrometry measurements.References
- P. Tyagi, V. Tyagi and M. Chancellor, Expert Opin. Drug Saf., 2011, 10, 287–294, DOI:10.1159/000361079.
- O. Dawood and A. El-zawahry, Mirabegron, StatPearls Publishing LLC, 2023, https://www.ncbi.nlm.nih.gov/books/NBK538513/ Search PubMed.
- E. D. Deeks, Drugs, 2018, 78, 833–844, DOI:10.1007/s40265-018-0924-4.
- A. Ramanzani and M. Razaei, J. Med. Chem. Sci., 2018, 1, 36–40, DOI:10.26655/jmchemsci.2018.9.5.
- P. R. Sankar, K. P. Kishore, B. Babji and M. Shaheem Sulthana, Int. J. Pharma Sci. Res., 2020, 11, 2223–2228, DOI:10.13040/IJPSR.0975-8232.11(5).2223-28.
- R. Sankar and P. Srinivasa Babu, Validated UV spectrophotometric method for quantitative determination of mirabegron in bulk and pharmaceutical dosage form a review on step-by-step analytical method validation view project controlling hypertension: a brief review view project, 2016 Search PubMed.
- R. K. Papanna, J. B. K. Gowda and P. Nagaraja, J. Anal. Chem., 2018, 73, 884–893 CrossRef.
- M. M. Abou El-Alamin, D. A. Mohamed and S. S. Toubar, ChemistrySelect, 2022, 7(4), e202103852, DOI:10.1002/slct.202103852.
- E. Lindner, K. Tóth and E. Pungor, Dynamic characteristics of ion-selective electrodes, CRC press, 2018 Search PubMed.
- A. H. Nadim, M. A. Abd El-Aal, M. A. Al-Ghobashy and Y. S. El-Saharty, Microchem. J., 2021, 167 DOI:10.1016/j.microc.2021.106333.
- P. Bühlmann and L. D. Chen, Ion-Selective Electrodes with Ionophore-Doped Sensing Membranes, 2012 Search PubMed.
- A. M. Dar and S. Mir, J. Anal. Bioanal. Tech., 2017, 8, 1–7, DOI:10.4172/2155-9872.1000356.
- S. A. Wring, J. P. Hart, L. Bracey and B. J. Birch, Anal. Chim. Acta, 1990, 231, 203–212, 10.1039/AN9921701281.
- S. S. M. Hassan, A. H. Kamel and M. A. Fathy, Anal. Chim. Acta, 2022, 1227 DOI:10.1016/j.aca.2022.340239.
- S. S. M. Hassan, A. H. Kamel, A. E. G. E. Amr, H. M. Hashem and E. M. A. Bary, Nanomaterials, 2020, 10(3), 572, DOI:10.3390/nano10030572.
- A. M. Mahmoud, M. T. Ragab, N. K. Ramadan, N. A. El-Ragehy and B. A. El-Zeany, Electroanalysis, 2020, 32, 2803–2811, DOI:10.1002/elan.202060377.
- E. Jaworska, M. Wójcik, A. Kisiel, J. Mieczkowski and A. Michalska, Talanta, 2011, 85, 1986–1989, DOI:10.1016/j.talanta.2011.07.049.
- E. Jaworska, W. Lewandowski, J. Mieczkowski, K. Maksymiuk and A. Michalska, Analyst, 2013, 138, 2363–2371, 10.1039/C3AN36741J.
- A. M. Mahmoud, M. N. Saad, E. S. Elzanfaly, S. M. Amer and H. M. Essam, Anal. Methods, 2020, 12, 2903–2913, 10.1039/D0AY00882F.
- F. Li, J. Ye, M. Zhou, S. Gan, Q. Zhang, D. Han and L. Niu, Analyst, 2012, 137, 618–623, 10.1039/C1AN15705A.
- P. Nasr-Esfahani and A. A. Ensafi, Functionalized Nanomaterial-Based Electrochemical Sensors: Principles, Fabrication Methods, and Applications, 2022, pp. 115–140, DOI:10.1016/B978-0-12-823788-5.00023-5.
- G. A. Rivas, M. D. Rubianes, M. C. Rodríguez, N. F. Ferreyra, G. L. Luque, M. L. Pedano, S. A. Miscoria and C. Parrado, Talanta, 2007, 74, 291–307, DOI:10.1016/j.talanta.2007.10.013.
- Y. Umezawa, P. Buhlmann, K. Umezawa, K. Tohda and S. Amemiya, Pure Appl. Chem., 2000, 72, 1851–2082, DOI:10.1351/pac200072101851.
- T. S. Ma and S. S. M. Hassan, Organic analysis using ion-selective electrodes, Academic Press, 1982 Search PubMed.
- M. Koel and M. Kaljurand, Green Analytical Chemistry, Royal Society of Chemistry, Cambridge, 2012, DOI:10.1007/978-1-4939-2493-6_1017-1.
- E. Bakker, P. Bühlmann and E. Pretsch, Chem. Rev., 1997, 97, 3083–3132, DOI:10.1021/cr940394a.
- R. J. Forster, A. Cadogan, M. Telting Diaz, D. Diamond, S. J. Harris and M. A. McKervey, Sens. Actuators, B, 1991, 4, 325–331, DOI:10.1016/0925-4005(91)80131-3.
- L. Baldini, F. Sansone and A. Casnati, Cation Complexation by Calixarenes in Reference Module in Chemistry, Molecular Sciences and Chemical Engineering, Elsevier, 2013 Search PubMed.
- Y. M. Fayez, A. M. Mahmoud, M. Nebsen, Z. M. Goda and S. A. Boltia, J. Electrochem. Soc., 2021, 168, 057504, DOI:10.1149/1945-7111/abf8d4.
- R. van Teijlingen, J. Meijer, S. Takusagawa, M. van Gelderen, C. van den Beld and T. Usui, J. Chromatogr. B: Anal. Technol. Biomed. Life Sci., 2012, 887–888, 102–111, DOI:10.1016/j.jchromb.2012.01.018.
- J. Lee, S. Moy, J. Meijer, W. Krauwinkel, T. Sawamoto, V. Kerbusch, D. Kowalski, M. Roy, A. Marion, S. Takusagawa, M. van Gelderen and J. Keirns, Clin. Drug Invest., 2013, 33, 429–440, DOI:10.1007/s40261-013-0084-y.
- F. Pena-Pereira, W. Wojnowski and M. Tobiszewski, Anal. Chem., 2020, 92, 10076–10082, DOI:10.1021/acs.analchem.0c01887.
Footnote |
| † Electronic supplementary information (ESI) available. See DOI: https://doi.org/10.1039/d3ra02343e |
| This journal is © The Royal Society of Chemistry 2023 |