
 Open Access Article
 This Open Access Article is licensed under a Creative Commons Attribution-Non Commercial 3.0 Unported Licence
Comparison of bovine serum albumin and chitosan effects on calcium phosphate formation in the presence of silver nanoparticles†
Suzana Inkret a,
Ina Ercega,
Marija Ćurlinb,
Nikolina Kalčecc,
Nikolina Peranićc,
Ivana Vinković Vrčekc,
Darija Domazet Jurašina and
Maja Dutour Sikirić*a
a,
Ina Ercega,
Marija Ćurlinb,
Nikolina Kalčecc,
Nikolina Peranićc,
Ivana Vinković Vrčekc,
Darija Domazet Jurašina and
Maja Dutour Sikirić*a
aLaboratory for Biocolloids and Surface Chemistry, Division of Physical Chemistry, Ruđer Bošković Institute, Bijenička Cesta 54, 10000 Zagreb, Croatia. E-mail: sikiric@irb.hr; Tel: + 385 1 456 0941
bSchool of Medicine, Catholic University of Croatia, 10000 Zagreb, Croatia
cInstitute for Medical Research and Occupational Health, Ksaverska Cesta 2, Zagreb, 10000, Croatia
First published on 9th June 2023
Abstract
The precipitation of calcium phosphates (CaPs) in the presence of more than one type of additive is of interest both from a fundamental point of view and as a possible biomimetic route for the preparation of multicomponent composites in which the activity of the components is preserved. In this study, the effect of bovine serum albumin (BSA) and chitosan (Chi) on the precipitation of CaPs in the presence of silver nanoparticles (AgNPs) stabilized with sodium bis(2-ethylhexyl)sulfosuccinate (AOT-AgNPs), poly(vinylpyrrolidone) (PVP-AgNPs), and citrate (cit-AgNPs) was investigated. In the control system, the precipitation of CaPs occurred in two steps. Amorphous calcium phosphate (ACP) was the first precipitated solid, which transformed into a mixture of calcium-deficient hydroxyapatite (CaDHA) and a smaller amount of octacalcium phosphate (OCP) after 60 min of ageing. Both biomacromolecules inhibited ACP transformation, with Chi being a stronger inhibitor due to its flexible molecular structure. As the concentration of the biomacromolecules increased, the amount of OCP decreased both in the absence and presence of AgNPs. In the presence of cit-AgNPs and two highest BSA concentrations, a change in the composition of the crystalline phase was observed. Calcium hydrogen phosphate dihydrate was formed in the mixture with CaDHA. An effect on the morphology of both the amorphous and crystalline phases was observed. The effect depended on the specific combination of biomacromolecules and differently stabilized AgNP. The results obtained suggest a simple method for fine-tuning the properties of precipitates using different classes of additives. This could be of interest for the biomimetic preparation of multifunctional composites for bone tissue engineering.
1. Introduction
The ever-increasing number of hard tissue injuries and diseases, as a result of modern lifestyle and the aging population, motivates the research and development of novel bioimplant materials.1,2 From the increased understanding of bone formation and biology on the one hand, and the problems related to implantation procedures, especially implant associated infections (IAIs), on the other hand, it became clear that implants should perform multiple functions.2 They should be bioactive, allow good osseointegration, and have antimicrobial properties, to name just a few of the requirements.3,4 Since no single material can fulfill all these requirements, the solution is sought in composite materials.A number of different types of materials are available for developing orthopedic bioimplant materials.3,5 Calcium phosphates (CaPs) are most commonly used because of their similarity to the mineral component of bone, so called biological apatite. Different CaPs phases, i.e. hydroxyapatite (HAP, Ca10(PO4)6(OH)2), α and β-tricalcium phosphates (α-TCP and β-TCP, Ca3(PO4)2) octacalcium phosphate (OCP, Ca8(HPO4)2(PO4)4·5H2O), calcium hydrogenphosphate dihydrate (DCPD, CaHPO4·2H2O) and calcium deficient apatite (CaDHA, Ca10−x(HPO4)x(PO4)6−x(OH)2−x, 0 < x < 1), are used as bone implant materials as they are non-toxic, bioactive, and osteoconductive.6 However, they have some disadvantages, such as poor mechanical properties, difficulty to prepare desired shapes, poor adhesion to materials of different nature, and insufficient adsorption of certain compounds.7 One way of overcoming these disadvantages is the preparation of biocomposites or hybrid compounds.8 In this sense, (bio)macromolecules are the obvious choice, since bone itself is biological apatite composite with type I collagen fibrils.9 Composites of CaPs with (bio)macromolecules have both better mechanical properties and increased bioactivity.7 Inorganic nanomaterials are another class of materials that recently attracted attention for improving CaPs mechanical properties.10 Since both of these types of materials can have additional antibacterial or magnetic properties, combining them with CaPs offers the possibility of obtaining multifunctional materials.11
Indeed, a number of studies have been performed on the preparation and characterization of hybrid materials containing CaPs, (bio)macromolecules, and nanomaterials.11–15 A special care has been taken to use preparation methods under mild conditions in order to preserve the bioactivity of the biomacromolecules.7 However, to the best of our knowledge, precipitation has not been one of them, even though it is often highlighted as an economical and green synthesis route that also allows the coating of complex shapes.16,17 This is not surprising, as both (bio)macromolecules18 and nanomaterials19,20 can exert a complex influence on the precipitation of CaPs. Therefore, a detailed knowledge of the combined influence of these two types of additives is required for successful material preparation.
In continuation to our previous study on the influence of biomacromolecules on precipitation of CaPs on TiO2 NMs of different dimensionality,21 in this work we investigated the simultaneous influence of differently stabilized AgNPs and bovine serum albumin (BSA) or chitosan (Chi) on the precipitation of calcium phosphates. Among various nanomaterials, silver nanoparticles (AgNPs) are attracting particular attention as a potential therapeutic agent for fighting IAIs.22 AgNPs have a broad spectrum of antimicrobial activity23,24 and are more active than bulk silver, due to the sustained release of Ag+.25 However, it has been shown that AgNPs can easily agglomerate within the material, leading to high local Ag concentration and possible adverse biological effects.14 To avoid this problem, Xie et al.14 used electrochemical deposition of silver. Recently, we have shown that agglomeration can be avoided if CaPs are precipitated in the presence of AgNPs.26 Moreover, differently stabilized AgNPs, differing in antibacterial activity,27 can be used for precipitation, which may have a different effect on CaPs properties.26 Consequently, both the physico-chemical and biological properties of CaP/AgNPs can be tailored in a simple manner by using differently stabilized AgNPs as an additive in CaPs precipitation.
In this study AgNPs stabilized with citrate (cit-AgNPs), poly(vinylpyrrolidone) (PVP-AgNPs) and sodium bis(2-ethylhexyl) sulfosuccinate (AOT-AgNPs) were investigated. These three capping agents represent three different types of additives, namely small molecules, polyelectrolytes and surfactants, which are of particular interest for modifying CaPs precipitation.18,28 In addition, previous investigations have shown that these types of AgNPs are relatively stable in complex media.26,29
BSA is commonly used as a model compound for drug delivery systems and also as a way of enhancing the bioactivity of CaPs.7,30–32 It is an abundant protein, very similar to human serum albumin, and inexpensive.33 Chi is a biodegradable, bioactive, and non-toxic natural polysaccharide34,35 that also has antibacterial and antiviral properties.35 In bone tissue engineering, Chi is used as a hydrogel or as a component of scaffolds.7,35 Previous study has shown that Chi can even reduce toxicity of silver.14
For this study, the precipitation system was chosen in which calcium phosphates form in two steps, i.e. the amorphous phase, that precipitates first, transforms into the crystalline phase(s) in contact with the mother liquid. In this way, it was possible to determine the simultaneous influence of biomacromolecules and AgNPs on the rate of transformation of amorphous to crystalline CaP phases, as well as the properties of the amorphous and crystalline phases formed (Scheme 1).
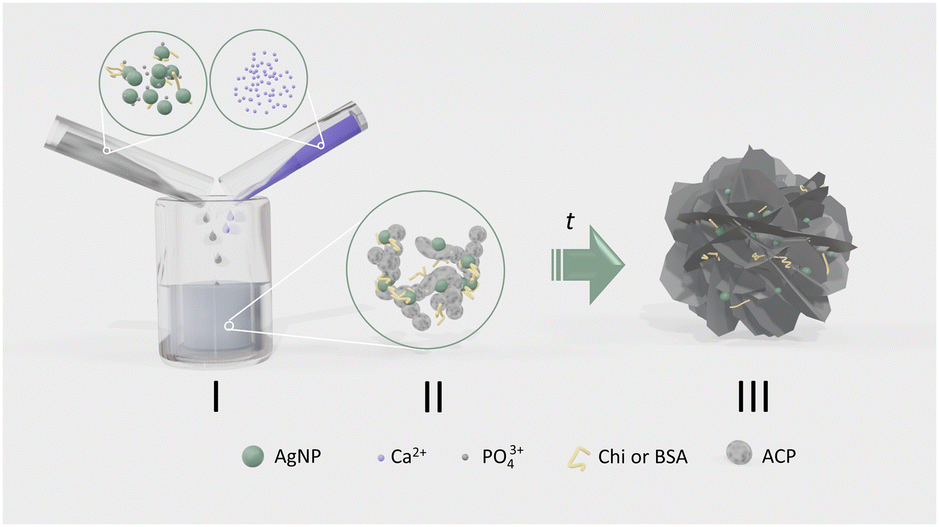 | ||
| Scheme 1 Schematic representation of the formation of calcium phosphates (CaPs) in the presence of two types of additives, biomacromolecules and differently stabilized silver nanoparticles (AgNPs). (i) The agglomeration behaviour of silver nanoparticles (AgNPs) in the presence of bovine serum albumin (BSA) and chitosan (Chi) in anionic reactant solution was determined. (ii) After mixing anionic and cationic reactant solution, amorphous calcium phosphate (ACP) formes in which AgNPs and biomacromolecules are distributed. (iii) After the induction time, which depends on the concentration and the specific combination of additives, the amorphous calcium phosphate transforms into crystalline CaPs, with AgNPs and biomacromolecules being incorporated into the precipitate or adsorbed on its surface. | ||
The results obtained confirm that precipitation can be used as a simple route for the synthesis of complex, multicomponent materials.
2. Materials and methods
2.1. Materials
The following analytical grade chemicals, purchased from Sigma-Aldrich, Darmstadt, Germany, were used in all experiments: silver nitrate (AgNO3), sodium citrate dihydrate (cit), poly(vinylpyrrolidone) (PVP), sodium bis(2-ethylhexyl) sulfosuccinate (AOT), glucose, ammonium (NH3), calcium chloride dihydrate (CaCl2·2H2O), sodium hydrogenphosphate (Na2HPO4), sodium hydroxide (NaOH), hydrochloric acid (HCl), bovine serum albumin and chitosan. Ultrapure water (UPW, conductivity 0.5 μS cm−1, Hydrolab HLP 10 UV, Straszyn, Poland) was used for all experiments.2.2. Synthesis of silver nanoparticles
AOT-AgNPs and PVP-AgNPs were prepared by reduction of AgNO3 with glucose using a modified method as described previously.29,36 Briefly, to the aqueous solutions of AOT (193 mL of 5 × 10⁻⁴ mol dm−3) and PVP (192.7 mL of 0.3%) 2.22 mL of a 90 × 10−3 mol dm−3 AgNO3 was added under constant stirring. Subsequently, 0.133 mL of a 35% NH3 solution was added, followed by the addition of 4 mL of a 0.5 mol dm−3 glucose solution at a rate of approximately 1 drop per s. Finally, 0.6 mL of 1 mol dm−3 NaOH was added and the reaction mixtures were kept for another 30 min under stirring at temperature of synthesis. Synthesis of AOT-AgNPs was performed at room temperature, while PVP-AgNPs were synthetised at 40 °C.For the synthesis of cit-AgNPs, a modified method was used, which has been described previously.37,38 Briefly, to a boiling AgNO3 solution (197.2 cm3 of 1 × 10⁻³ mol dm−3) 2.27 cm3 of a 1% (w/v) sodium citrate dihydrate solution was added under rapid stirring and reflux. The reaction mixture was stirred continuously at 90 °C for 3 h after the colour changed from colourless to yellow.
The freshly prepared suspensions of all AgNPs were washed twice with UPW by centrifugation at 15![[thin space (1/6-em)]](https://www.rsc.org/images/entities/char_2009.gif) 790×g for 20 min, resuspended in UPW, and stored at 4 °C in the dark until use.
790×g for 20 min, resuspended in UPW, and stored at 4 °C in the dark until use.
2.3. Precipitation system
The cationic and anionic reactant stock solutions were prepared by dissolving the required amount of CaCl2 and Na2HPO4. Before weighing, chemicals were dried overnight in a desiccator over silica gel. After dissolving Na2HPO4, the pH of the stock solution was adjusted to 7.4 with HCl. The BSA stock solution (γ = 30 g dm−3) was prepared by dissolving the required amount of BSA in UPW, while the Chi stock solution (γ = 250 mg dm−3) was prepared by dissolving the required amount of Chi in 1 mol dm−3 HCl using ultrasound for 4 h.To prepare the anionic and cationic reactant solutions, the stock solutions were diluted to the concentration c = 8 × 10⁻³ mol dm−3. The required amounts of the additives, i.e. AgNPs, BSA and/or Chi, were added to the anionic reactant solution during the dilution of the stock solution. When necessary, the pH of the anionic reactant solution was readjusted.
Precipitation systems were prepared by rapidly mixing 200 cm3 of anionic and cationic reactant solutions, resulting in initial reactant concentrations c(CaCl2) = c(Na2HPO4) = 4 × 10⁻³ mol dm−3, and γ (AgNPs) = 10 mg dm−3, γ (BSA) = 25–100 mg dm−3, γ (Chi) = 5–25 mg dm−3, at pH = 7.4. The concentrations of the biomacromolecules were chosen based on our previous research,21 which showed that inhibition of CaPs formation occurs at higher concentrations. Precipitation experiments were performed in a double-walled vessel at 25 ± 0.1 °C without additional stirring. The reaction vessel was kept in the dark.
The progress of the precipitation was followed by monitoring the changes in pH (913 pH meter, Metrohm, Herisau, Switzerland). From the pH vs. time curves, induction time for secondary precipitation of crystalline phase (ti) was determined at the intersection of the tangents drawn on the first two parts of the pH vs. time curves.39 Three independent measurements were performed for each precipitation system.
The precipitates formed were filtered at reaction times corresponding to the formation of amorphous and crystalline phases determined from the pH vs. time curves. In the case of ACP precipitates formed in the control system and in the presence of BSA were filtered after 15 minutes, while those obtained in the presence of Chi were filtered at the end of the stage I of pH vs. time curve. For characterization of crystalline phases, precipitates obtained in the control system were filtered after 60 minutes reaction time, those obtained in the presence of BSA and Chi after 80 minutes and 120 minutes, respectively. Only exception was precipitate obtained in the presence of the highest concentration of Chi and PVP-AgNPs, which was filtrated after 14 hours. The obtained precipitates were filtered through a 0.45 μm membrane filter, washed thoroughly with UPW and once with ethanol. Finally, they were dried in a nitrogen stream and stored in the dark in a desiccator until further analysis.
2.4. Characterization methods
The first- and second-order differentiated FTIR spectra in the 1200–450 cm−1 range were calculated following the procedure described by Uskoković40 and using a manual differentiation routine in Origin Pro 2021b.
Transmission electron microscopy images were acquired using a JEOL JEM 1010 transmission electron microscope (JEOL, Tokio, Japan) operated at 80 kV.
The size of AgNPs and spherical ACP particles was determined using Image J 1.48v image analysis software (freely available at http://imagej.nih.gov/ij/). The size of at least 30 particles was measured in each sample.
3. Results and discussion
3.1. Characterization of silver nanoparticles
TEM micrographs of the synthesised AgNPs (Fig. 1) revealed that both AOT-AgNPs (Fig. 1a) and PVP-AgNPs (Fig. 1 b) formed in the shape of polyhedral particles. In contrast, cit-AgNPs formed dominantly as quasi-spherical and triangular particles, although some rod-like particles were also observed (Fig. 1c). The observed morphologies were consistent with previous research.26,36,38 The average size, determined from TEM images, of AOT-AgNPs was 55.3 ± 10.5 nm, PVP-AgNPs 77.8 ± 22.9 nm, and cit-AgNPs 90.0 ± 22.8 nm.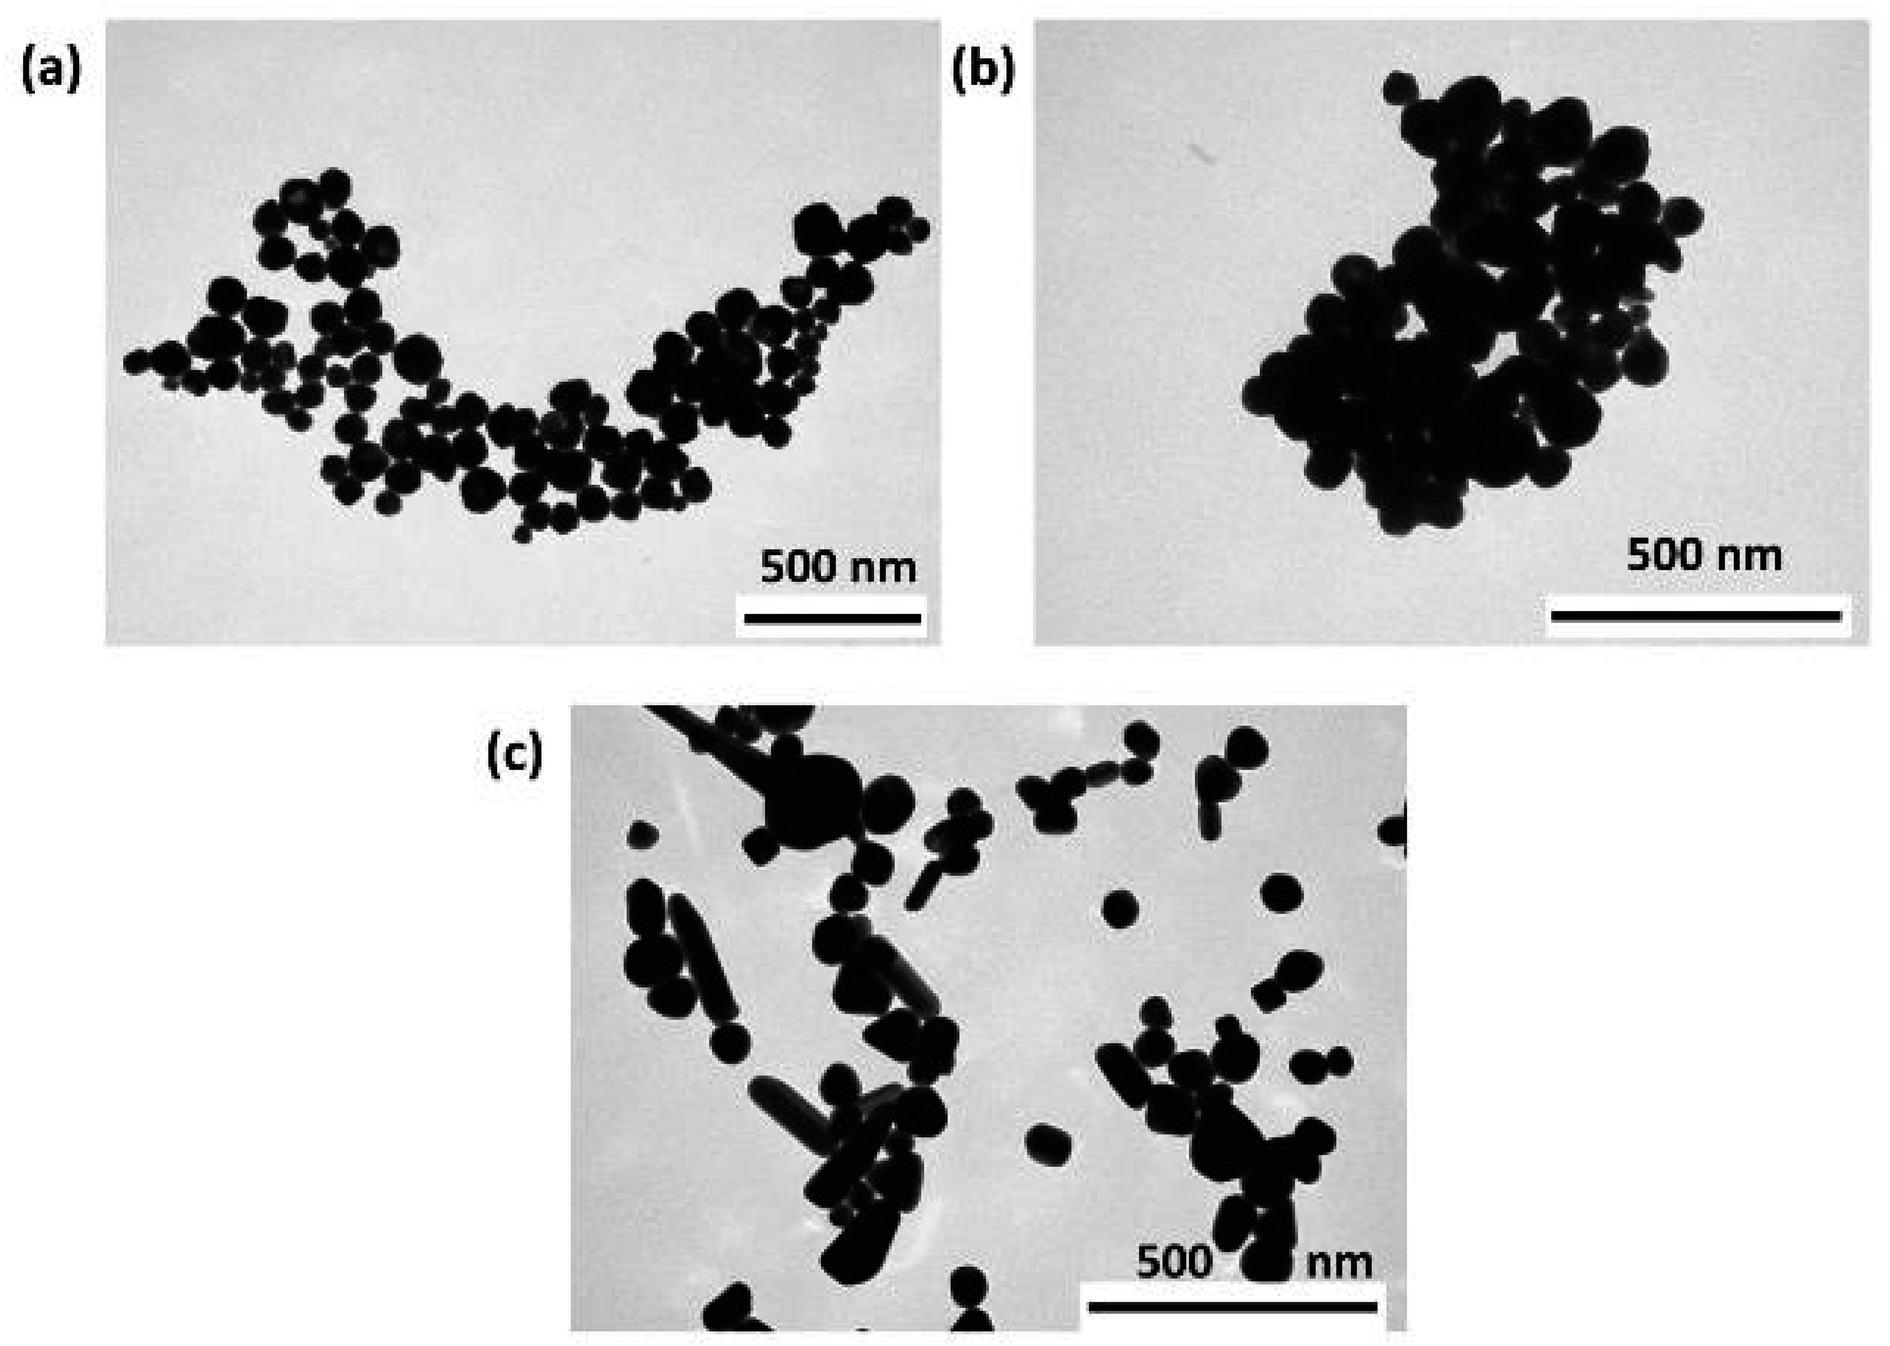 | ||
| Fig. 1 TEM micrographs of silver nanoparticles (AgNPs), stabilized with (a) sodium bis(2-ethylhexyl) sulfosuccinate (AOT-AgNPs), (b) poly(vinylpyrrolidone) (PVP-AgNPs), and (c) citrate (cit-AgNPs). | ||
It is known that the tendency of nanoparticles to agglomerate increases with increasing ionic strength due to the screening of electrostatic interactions.41,42 The presence of macromolecules can affect the agglomeration of NPs, as they can provide electrostatic and/or steric stabilization by adsorption on the surface of nanoparticles or increase instability by bridging particles.42 Chi can physically adsorb on the surface of the NPs and in this way electrostatically stabilize them and improve their bioactivity.43 BSA can also stabilize nanoparticles and reduce their dissolution.44
To determine the behaviour of the studied AgNPs in anionic reactant solution in the absence and presence of BSA and Chi, DLS and ELS measurements were performed (Table 1 and Fig. SI 1†).
| Sample | Peak I | Peak II | Peak III | ζ/mV | |||
|---|---|---|---|---|---|---|---|
| dh/nm | vol% | dh/nm | vol% | dh/nm | vol% | ||
| Anionic reactant solution | |||||||
| AOT-AgNPs | 88.1 ± 1.2 | 100 | −47.3 ± 1.7 | ||||
| PVP-AgNPs | 84.1 ± 1.9 | 100 | −18.2 ± 3.5 | ||||
| cit-AgNPs | 20.7 ± 6.1 | 73.3 ± 7.1 | 85.2 ± 4.2 | 26.8 ± 7.1 | −46.7 ± 2.6 | ||
| BSA | 6.6 ± 0.2 | 100 | −8.4 ± 2.9 | ||||
| Chi | 91.5 ± 14.2 | 100 | 4.1 ± 1.5 | ||||
|
|||||||
| Anionic reactant solution with BSA | |||||||
| AOT-AgNPs | 101.7 ± 1.1 | 100 | −25.1 ± 3.7 | ||||
| PVP-AgNPs | 100.6 ± 1.3 | 100 | −16.0 ± 7.4 | ||||
| cit-AgNPs | 103.3 ± 5.7 | 100 | −28.7 ± 1.7 | ||||
|
|||||||
| Anionic reactant solution with Chi | |||||||
| AOT-AgNPs | 154.5 ± 2.4 | 100 | 2.7 ± 2.7 | ||||
| PVP-AgNPs | 161.7 ± 12.0 | 26.0 ± 2.2 | 1120.8 ± 38.6 | 57.0 ± 3.5 | 4385.3 ± 161.1 | 17.1 ± 1.8 | 0.0 ± 2.1 |
| cit-AgNPs | 136.4 ± 2.5 | 100 | 2.0 ± 2.4 | ||||
Similar to our previous study,26 monomodal particle hydrodynamic diameter distribution was determined for PVP-AgNPs and AOT-AgNPs suspended in anionic reactant solution. In addition, the average dh values were similar, 84.1 nm and 88.1 nm for PVP-AgNPs and AOT-AgNPs, respectively. cit-AgNPs displayed bimodal size distribution with a dominant population having hydrodynamic diameter of 20.7 nm present in 73.3 vol% and a population of larger particles with hydrodynamic diameter 85.2 nm present in 26.8 vol%. The good stability of AgNPs in anionic reactant solution could be a consequence of their relatively large negative zeta-potential (Table 1).
A monomodal size distribution of BSA particles (Table 1, Fig. SI 1a†) with an average hydrodynamic diameter of 6 nm in anionic reactant solution was observed. The zeta potential of BSA particles was −8.4 mV. In the presence of BSA, a monomodal size distribution of all three types of AgNPs was observed (Fig. SI 1b–d†). Moreover, all three types of nanoparticles had similar hydrodynamic diameter, ranging from 100.6–103.3. nm. However, the difference in zeta potential was observed (Table 1), with PVP-AgNPs exhibiting the least negative zeta potential (−16.0 mV). The measured zeta potentials were less negative than those in the anionic reactant solution, indicating the adsorption of BSA on the AgNPs.
The size distribution of Chi particles in the anionic reactant solution was also monomodal (Table 1, Fig. SI 1a†), with an average hydrodynamic diameter of 91 nm. Chi particles had an average zeta potential of 4.1 mV. A monomodal size distribution of AOT-AgNPs and cit-AgNPs was observed in the presence of Chi, with an average dh of 154.5 nm and 136.4 nm, respectively (Table 1, Fig. SI 1b and d†). Contrary, a trimodal size distribution was observed for PVP-AgNPs (Fig. SI 1c†). A dominant population of particles with an average dh value of 1120.8 nm was detected in 57.0 vol%. In addition, smaller particles with an average dh of 161.7 nm and a population of larger particles with an average dh of 4385.3 nm, were detected. The higher degree of aggregation of PVP-AgNPs may be due to the fact that their average zeta potential was almost equal to zero. The average zeta potential of AOT-AgNPs and cit-AgNPs was slightly more positive. The observed change in zeta potential confirmed the interaction between Chi and AgNPs.
3.2. Influence on the rate of amorphous to crystalline phase transformation
During the precipitation of CaPs, a decrease in pH can be observed, the extent of which depends on the stage of the precipitation process.39,45,46 In the chosen precipitation system, the precipitation of calcium phosphates proceeded in three stages, as evidenced by the sigmoidal shape of the pH vs. time curves (Fig. SI 2†). Previous studies have shown that the first part of the curve, where the change in pH is small or negligible, corresponds to the formation of amorphous calcium phosphate (ACP). The subsequent sudden drop in pH corresponds to the secondary precipitation of the crystalline phase on the already formed ACP. In the final stage, again followed by a small or negligible change in pH, solution-mediated growth and transformation of crystalline phase occurs.39,46–49 Interestingly, in the pH vs. time curves of some precipitation systems another stage was observed as a region of gradual pH decrease between the initial small or negligible pH change and sudden pH decrease. This additional stage can be seen on pH vs. time curves for precipitation systems containing two highest concentrations of BSA, cit-AgNPs with two lower concentrations of BSA, AOT-AgNPs with the highest concentration of Chi, as well as PVP-AgNPs with all concentrations of Chi studied. The change in the shape of the pH vs. time curve was usually attributed to the change in the formation mechanisms of CaPs, i.e. formation of another amorphous phase termed ACP2, before the onset of transformation.46,50,51 Such behaviour was previously observed in the presence of surfactants,46 and in some studies of the influence of amino acids on CaP precipitation.52 However, in the presence of AgNPs alone, no additional regions in pH vs. time curves were observed.26 Therefore, it appeared, that only certain combinations of macromolecules and AgNPs can lead to a change in the CaPs formation pathway.At all concentrations studied, both biomacromolecules prolonged the rate of ACP transformation to the crystalline phase compared to the control system, as evidenced by increased induction time for secondary precipitation of crystalline phase on already formed ACP (ti, Table 2). This is consistent with the previously observed effect of polyelectrolytes and proteins on ACP transformation.39,53
| Biomacro-molecule | γ/mg dm−3 | ti/min | |||
|---|---|---|---|---|---|
| AgNPs | |||||
| no-AgNPs | AOT-AgNPs | PVP-AgNPs | cit-AgNPs | ||
| a Data from the ref. 26. | |||||
| None | 0 | 30.2 ± 0.3 | 33.0 ± 2.7a | 31.6 ± 1.8a | 28.8 ± 1.3a |
| 25 | 37.5 ± 1.5 | 35.4 ± 1.3 | 35.1 ± 0.6 | 35.3 ± 0.9 | |
| BSA | 50 | 41.0 ± 1.6 | 40.9 ± 0.8 | 43.6 ± 1.3 | 39.7 ± 0.1 |
| 100 | 45.2 ± 1.7 | 44.6 ± 2.2 | 43.6 ± 1.6 | 44.6 ± 1.8 | |
| 5 | 34.2 ± 1.7 | 42.9 ± 0.4 | 47.9 ± 1.0 | 38.6 ± 2.1 | |
| Chi | 10 | 46.0 ± 2.4 | 50.6 ± 0.4 | 52.4 ± 0.9 | 45.7 ± 1.3 |
| 25 | 52.4 ± 1.2 | 81.1 ± 6.1 | 675.3 ± 78.5 | 60.6 ± 0.3 | |
As has been shown before,21 Chi acted as a stronger inhibitor compared to BSA, as its inhibitory effect was observed at much lower concentrations (Table 2).
The difference in the behaviour of these two molecules could be ascribed to different molecular structures. The BSA molecule has a rigid, compact, heart-like form.54 Chi is a flexible, linear polysaccharide,55,56 which can therefore more easily arrange itself on the surface of ACP particles. Consequently, this inhibits the transport of constitutive ions to the surface of the ACP particles, but also the secondary nucleation, as was shown for flexible polyelectrolytes.39
We have previously shown that all three types of AgNPs have no significant influence on the rate of ACP transformation at applied AgNPs concentration (Table 2).26 This is confirmed by the present study, in which ti obtained in the systems containing both BSA and AgNPs were not significantly different from the ones obtained in the presence of only BSA, probably due to high BSA concentration. However, this was not the case for Chi. The ti values obtained in the presence of differently stabilized AgNPs were larger than those obtained in the systems containing only Chi. This difference was most pronounced at the highest Chi concentration studied. At all applied Chi concentrations, the ti values increased in the order cit-AgNPs < AOT-AgNPs < PVP-AgNPs, indicating that the overall effect on the rate of amorphous phase transformation depends on the type of AgNPs, unlike in the case of BSA. This could be a consequence of the observed different aggregation behaviour of AgNPs in the presence of biomacromolecules studied (Table 1).
To the best of our knowledge, the only literature data on the influence of BSA and Chi on the rate of ACP transformation come from our previous study,21 in which similar trends were observed. It is worth noting that in this study we used precipitation systems with the same calcium and phosphate ion concentrations as previously, but in 10 fold larger reaction volume.
However, several studies on the effect of BSA on CaP formation on different surfaces have confirmed the inhibitory effect of BSA.57–59 Additionally, Chi is known to delay calcium phosphate cement setting and the associated phase transformation. This was used by Rau et al.60 to study the phase transformation that takes place during cement hardening.
3.3. Influence on the properties of the amorphous phase
To confirm the formation of ACP, the precipitates were filtered after 15 minutes of reaction time in the presence of BSA and at the end of the first precipitation stage in the presence of Chi and characterized by PXRD (Fig. 2), FTIR (Fig. SI 3†) as well as TEM (Fig. 3, SI 4 and SI 5†).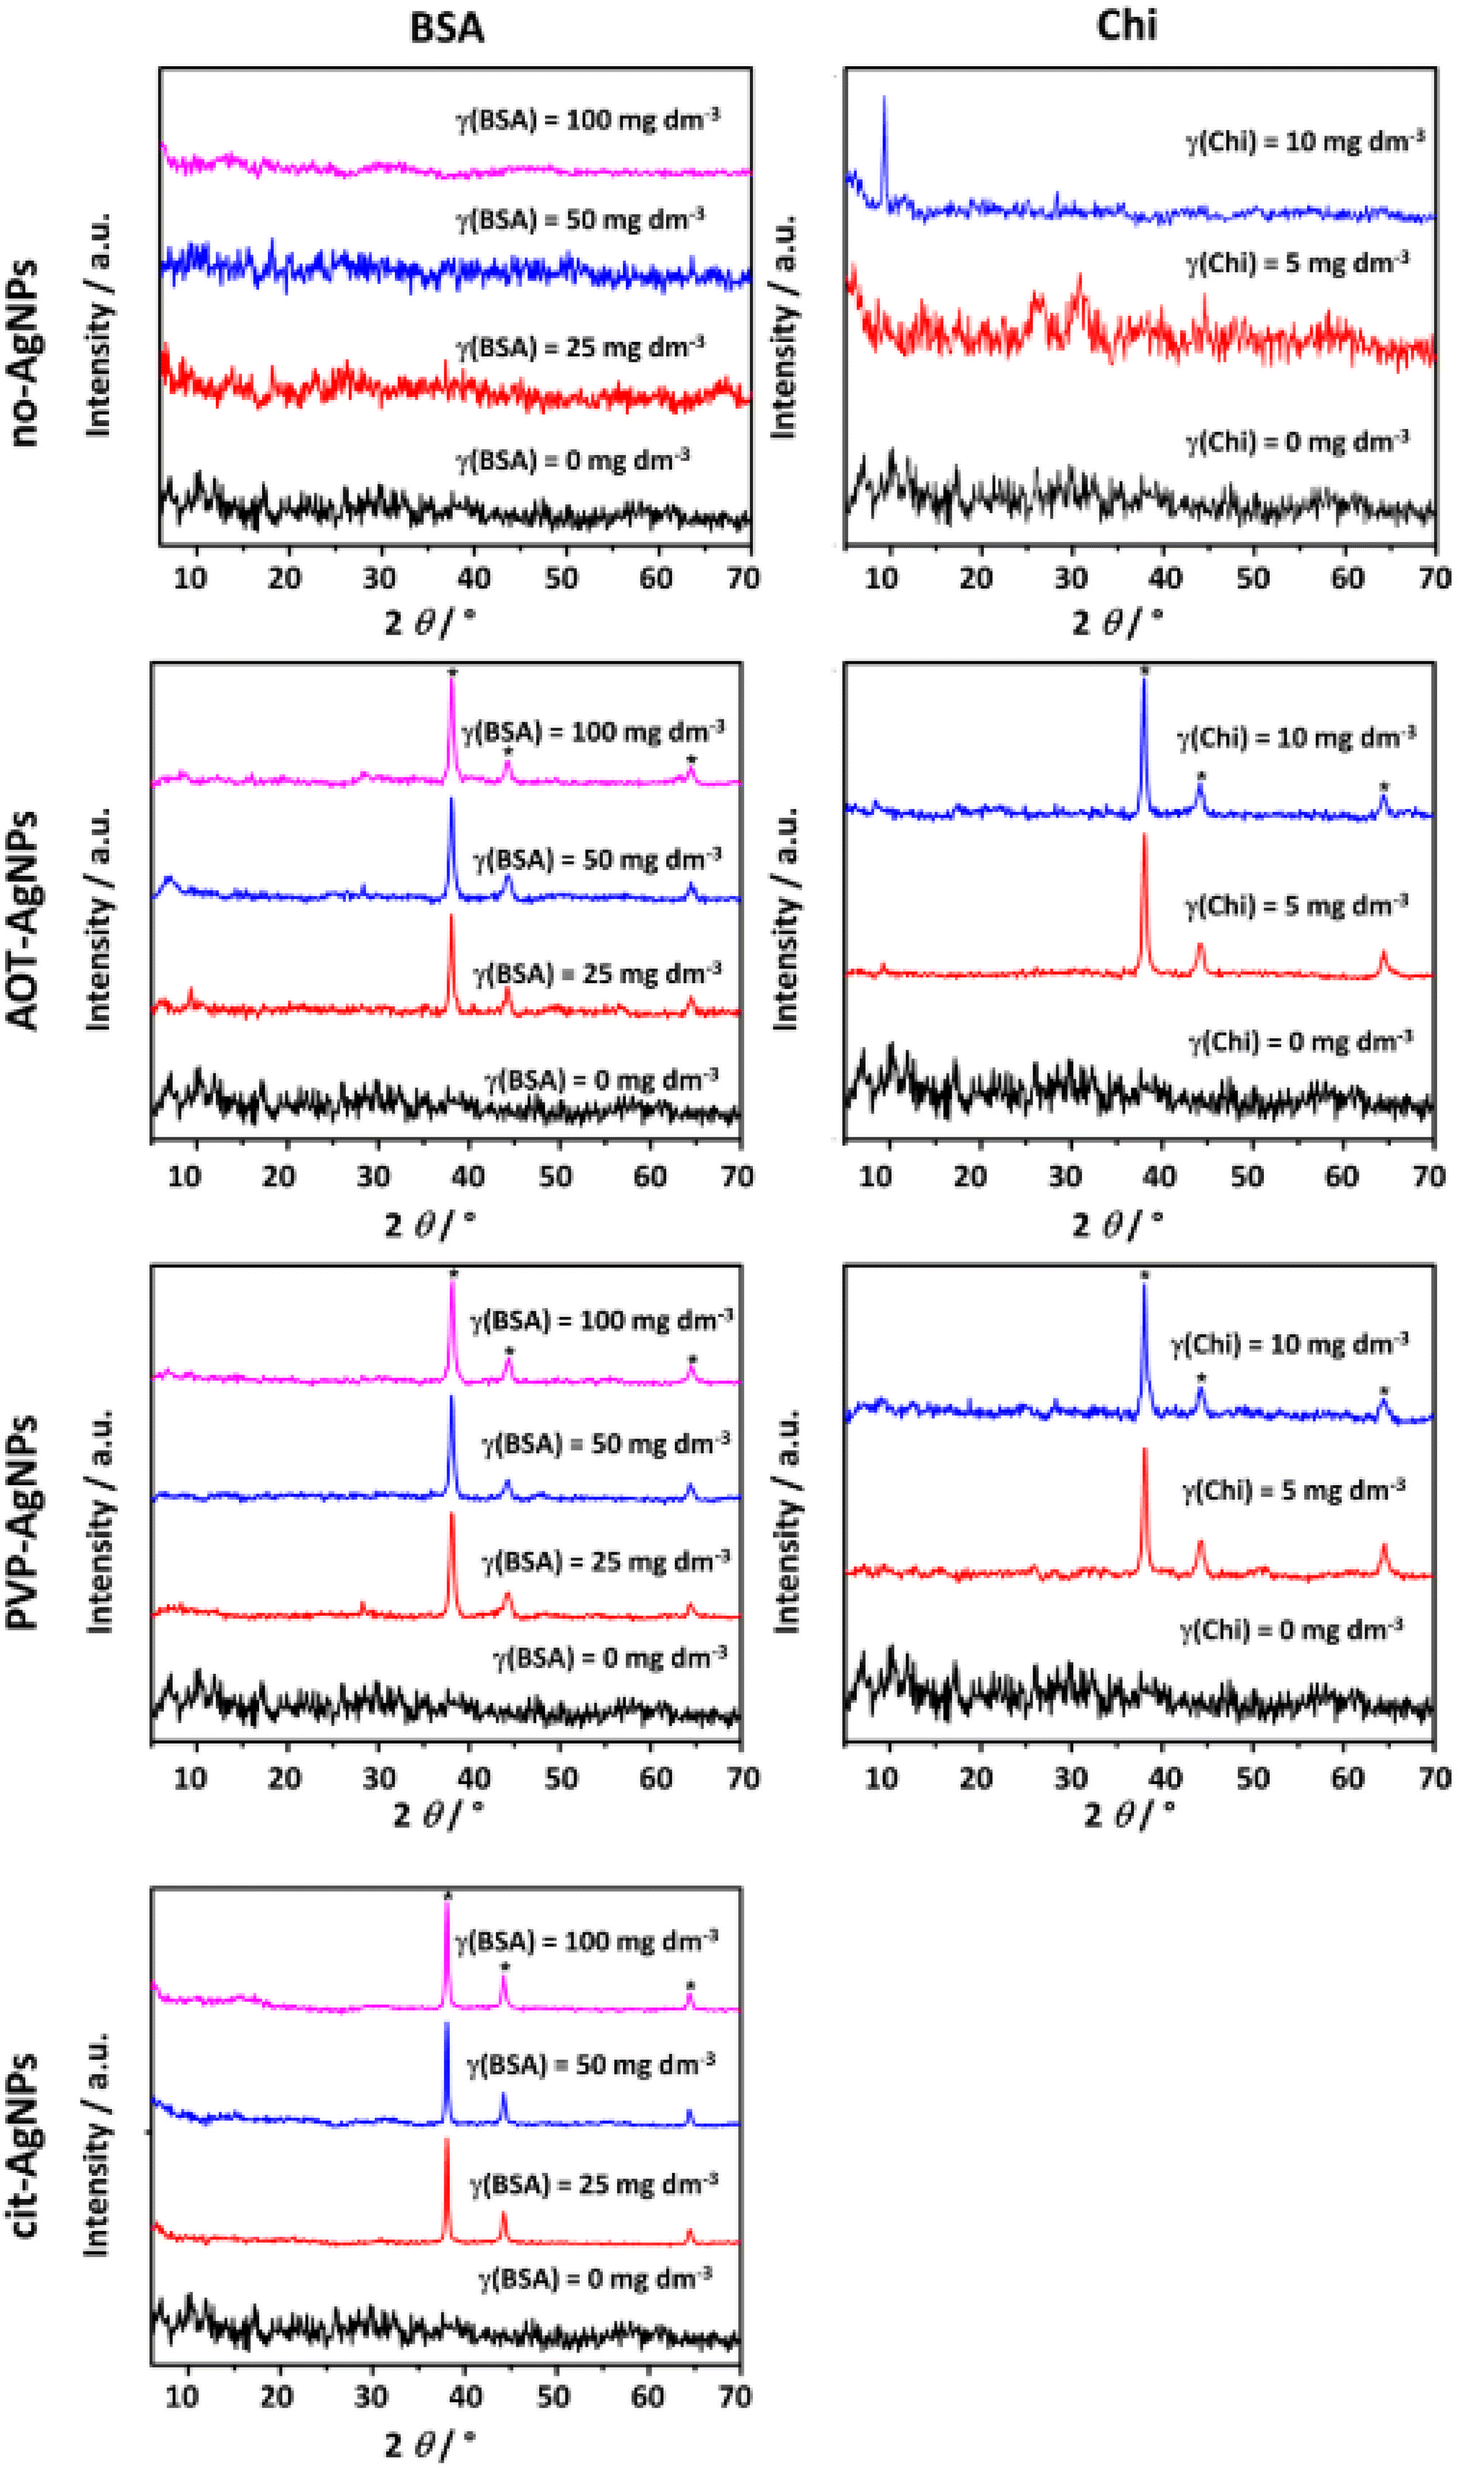 | ||
| Fig. 2 PXRD patterns of amorphous precipitates obtained in the control system and the presence of the different concentrations of bovine serum albumin (BSA) and chitosan (Chi) in the absence and presence of 10 mg dm−3 of silver nanoparticles (AgNPs) stabilized sodium bis(2-ethylhexyl) sulfosuccinate (AOT-AgNPs), poly(vinylpyrrolidone) (PVP-AgNPs), and citrate (cit-AgNPs). c(CaCl2) = c(Na2HPO4) = 4 × 10⁻³ mol dm−3, pH 7.4, 25 °C. * denotes AgNPs reflections. | ||
The PXRD pattern of the precipitate formed in the control system and the presence of different concentrations of BSA contained a broad amorphous maximum in the 2θ region 27°–35° characteristic of ACP (Fig. 2).61,62 The patterns of precipitates formed in the presence of BSA and AgNPs, in addition contained peaks at 2θ around 38.1°, 44.3° and 64.5° corresponding to the (111), (200) and (220) reflections of silver (ICCD File No. 04–0783), respectively. In our previous study on the influence of differently stabilized AgNPs on the precipitation of CaPs,26 it was shown that the PXRD patterns of amorphous precipitates contain characteristic AgNPs peaks, whereas the amorphous peak characteristic of ACP was observed only in the presence of the lowest concentration of cit-AgNPs, probably due to the high intensity of the AgNPs peaks.
The FTIR spectra confirmed the formation of ACP in all systems studied (Fig. SI 3†). Characteristic phosphate group vibration bands were observed at around 1035 cm−1, 870 cm−1 and 550 cm−1, corresponding to the ν3 asymmetric stretching mode of the PO43− group, the vibration of the HPO42− group and the ν4 bending mode of the PO43− group, respectively.63,64 The absence of splitting of the bands characteristic of the ν3 and ν4 vibration of PO43− group confirmed formation of ACP.40,63 Bands characteristic of the water vibration were observed at 3650–2750 cm−1 and 1650 cm−1. Characteristic BSA bands were observed at around 2980 cm−1 (amide B, N–H stretching of NH3+ free ion), 2906 cm−1, 1650 cm−1 (amide I, C![[double bond, length as m-dash]](https://www.rsc.org/images/entities/char_e001.gif) O stretching superimposed on the CaPs water band), 1540 cm−1 (amide II, C–N stretching and N–H bending vibrations), 1450 cm−1 (CH2 scissoring) 1400 cm−1 (CH2 bending groups) and/or 1270 cm−1 (amide III, related to C–N stretching and N–H bending).65,66 The intensity of the BSA bands increased with increasing BSA concentration in precipitation systems.
O stretching superimposed on the CaPs water band), 1540 cm−1 (amide II, C–N stretching and N–H bending vibrations), 1450 cm−1 (CH2 scissoring) 1400 cm−1 (CH2 bending groups) and/or 1270 cm−1 (amide III, related to C–N stretching and N–H bending).65,66 The intensity of the BSA bands increased with increasing BSA concentration in precipitation systems.
In addition to the prolonged ti, the amount of precipitate formed was much smaller in the presence of Chi than in the control system and in the presence of BSA. This indicated that Chi inhibits not only ACP transformation, but also its formation and confirmed the stronger influence of Chi on CaPs precipitation compared to BSA.
Therefore, the precipitates were isolated at the ageing time close to ti, to obtain a larger amount of precipitate. In the investigated precipitation systems with the highest Chi concentration, and with cit-AgNPs at all Chi concentrations, the amount of precipitate was too small for PXRD and FTIR analysis. Appearance of peak at 2θ around 9.4° corresponding (200) reflection of OCP at the highest concentration of Chi indicated that the transformation has already begun (Fig. 2). However, no splitting of the bands characteristic of the ν3 and ν4 vibration of PO43− group was observed, confirming formation of ACP (Fig. SI 3†).40,63 The characteristic Chi bands could not be unambiguously assigned, as they overlapped with the characteristic phosphate bands.67,68
Profound morphological changes in ACP were observed in the presence of BSA and Chi (Fig. 3, SI 4 and SI 5†). In the control system, chain-like aggregates of spherical particles, with a size of 79 ± 20 nm, typical of ACP, were observed.39,50,61,69 In the presence of BSA, a gel-like phase was observed at all concentrations. However, in the presence of 50 mg dm−3 BSA, spherical particles less developed and smaller (53 ± 10 nm) than in the control system were dominant (Fig. SI 4†). This could be a consequence of the adsorption of BSA on the surface of the forming ACP particles, which prevents the transport of constituent the ions and thus the growth of the particles. In the presence of Chi, a gradual transformation from spherical particles to a gel-like phase was observed with increasing Chi concentration (Fig. 3 and SI 5†). At two lower Chi concentrations, only spherical ACP particles were observed (Fig. SI 5†). With increasing concentration, they became less developed, smaller (64 ± 12 nm and 47 ± 11 nm in the presence of 5 mg dm−3 and 10 mg dm−3 of Chi, respectively) and contain more and longer fibrous structures on the surface, which seems to be the beginning of the formation of the gel-like phase formed at the highest Chi concentration studied (Fig. 3). The presence of differently stabilized AgNPs had different influence on morphology. In the presence of AOT-AgNPs, a gel-like phase formed at all BSA concentrations investigated (Fig. 3 and SI 4†). At two lower Chi concentrations (Fig. SI 5†), irregular, less developed ACP particles formed while at the highest concentration (Fig. 3), a gel-like phase formed. No significant difference was observed in the morphology of ACP precipitated in the presence different biomacromolecules and PVP-AgNPs. Spherical particles, with sizes similar to the control system, and a small amount of gel-like phase were observed in all precipitation systems (Fig. 3, SI 4 and SI 5†). In the presence of cit-AgNPs, spherical particles were detected at all BSA concentrations (Fig. 3 and SI 4†), while the largest amount of gel-like phase was observed at 50 mg dm−3 BSA (Fig. SI 4†). In contrast, in the presence of Chi, a gradual transition, from spherical particles smaller than in the control system (58 ± 140 nm) to a gel-like phase, can be observed with increasing Chi concentration (Fig. 3 and SI 5†).
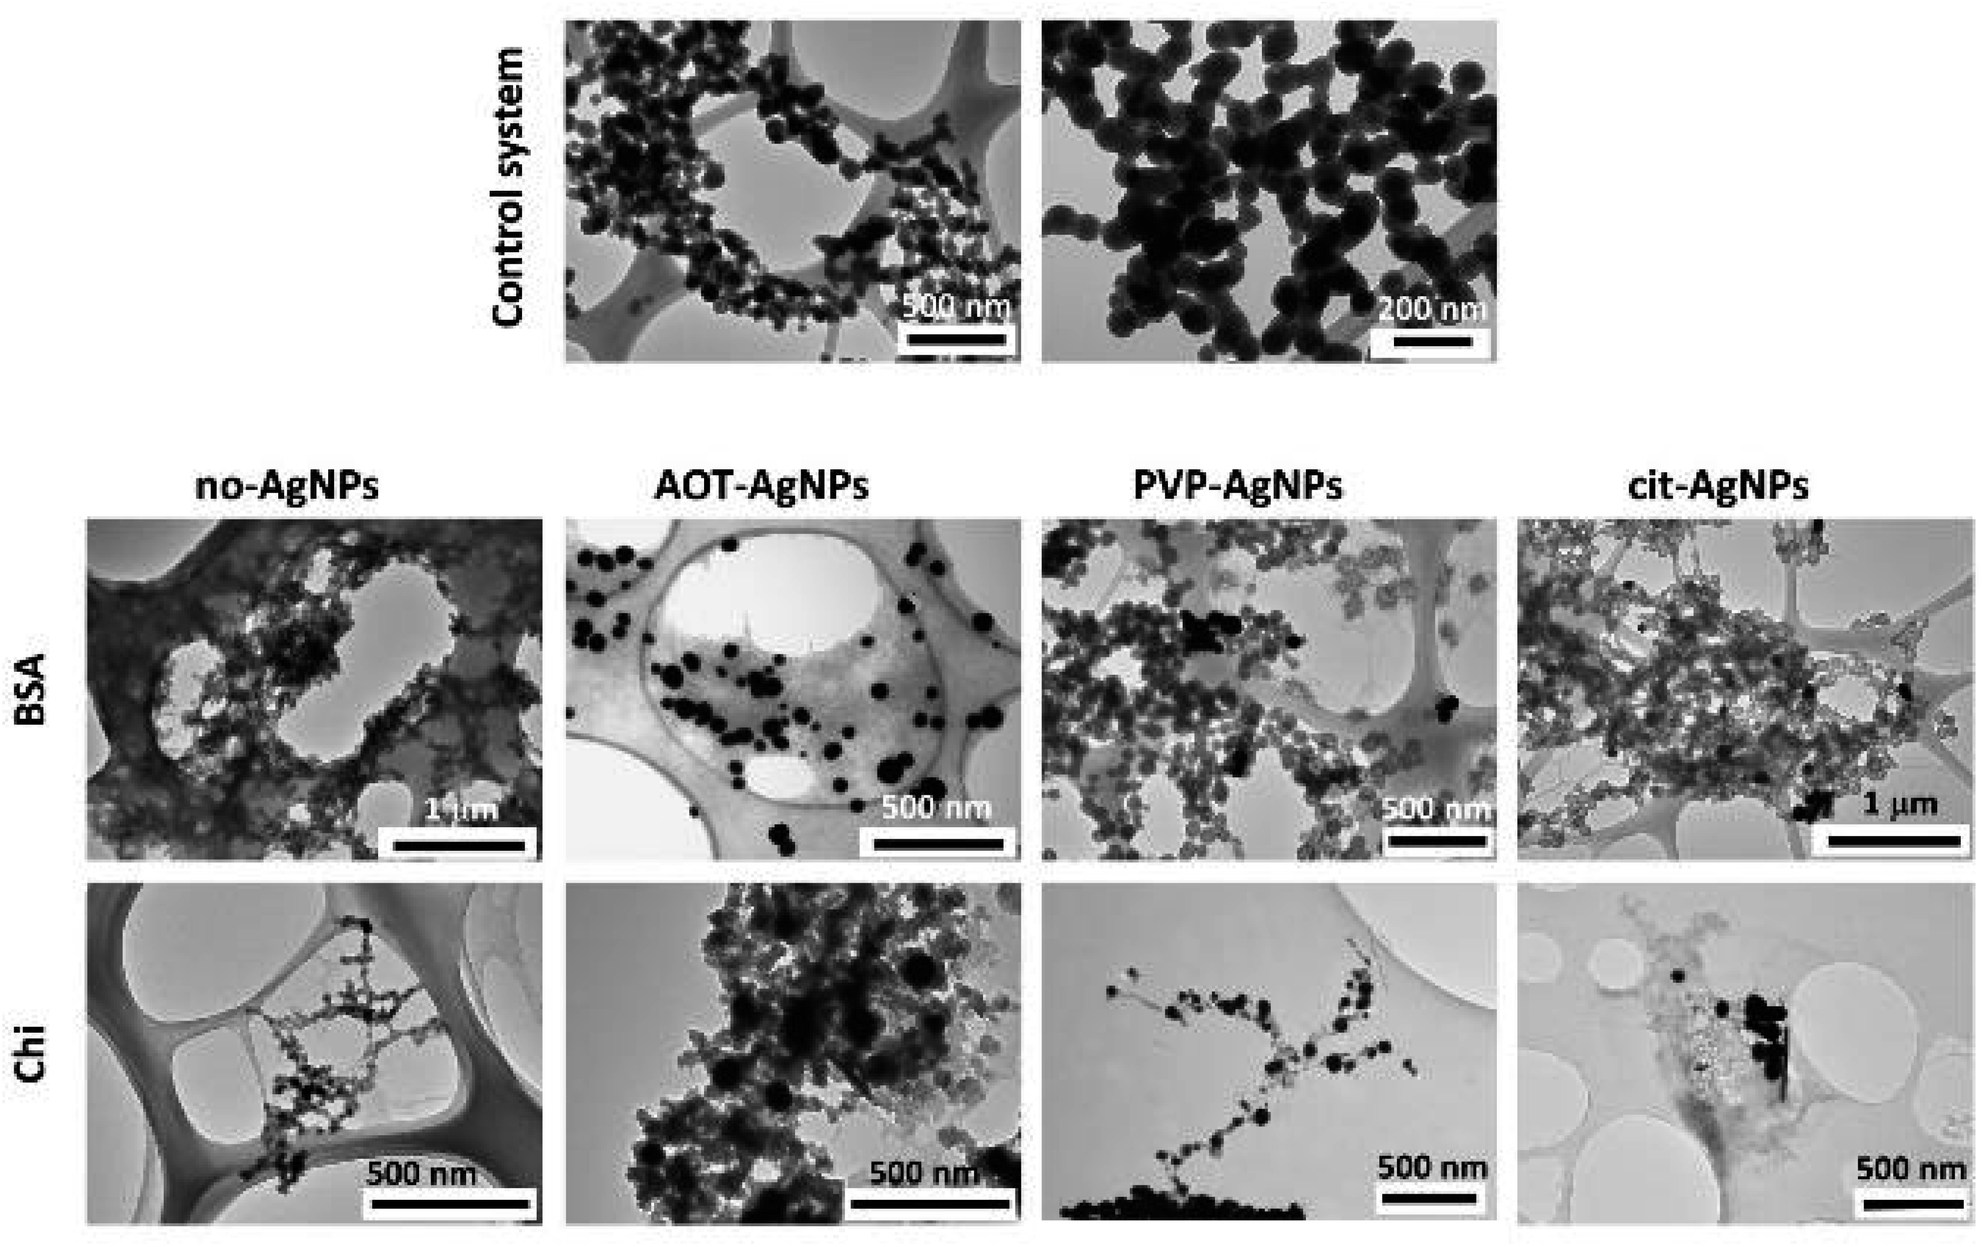 | ||
| Fig. 3 TEM micrographs of amorphous precipitates obtained in the control system and the presence of the 100 mg dm−3 of bovine serum albumin (BSA) or 25 mg dm−3 of chitosan (Chi) in the absence and presence of 10 mg dm−3 of silver nanoparticles (AgNPs) stabilized sodium bis(2-ethylhexyl) sulfosuccinate (AOT-AgNPs), poly(vinylpyrrolidone) (PVP-AgNPs), and citrate (cit-AgNPs). c(CaCl2) = c(Na2HPO4) = 4 × 10⁻³ mol dm−3, pH 7.4, 25 °C. | ||
Compared to our previous study on the influence of differently stabilized AgNPs on precipitation of CaPs,26 it seems that BSA promotes the formation of a gel-like phase, while Chi promotes the precipitation of spherical particles.
It is worth noting that in all cases the AgNPs are distributed throughout the amorphous precipitate mostly as single particles. The observed AgNPs agglomerates are composed of a small number of particles, even in the cases where significant agglomeration of AgNPs in anionic reactant solution was observed by DLS (Table 1). This result confirms that by precipitation the major drawback of existing CaP/AgNPs composites, non-homogeneous distribution and agglomeration of AgNPs in the composites,14 could be avoided.
3.4. Influence on the properties of the crystalline phase
A mixture of CaDHA and OCP formed in the control system, as evidenced by the PXRD pattern (Fig. 4) and FTIR spectra (Fig. SI 6†), are in agreement with our previous study.26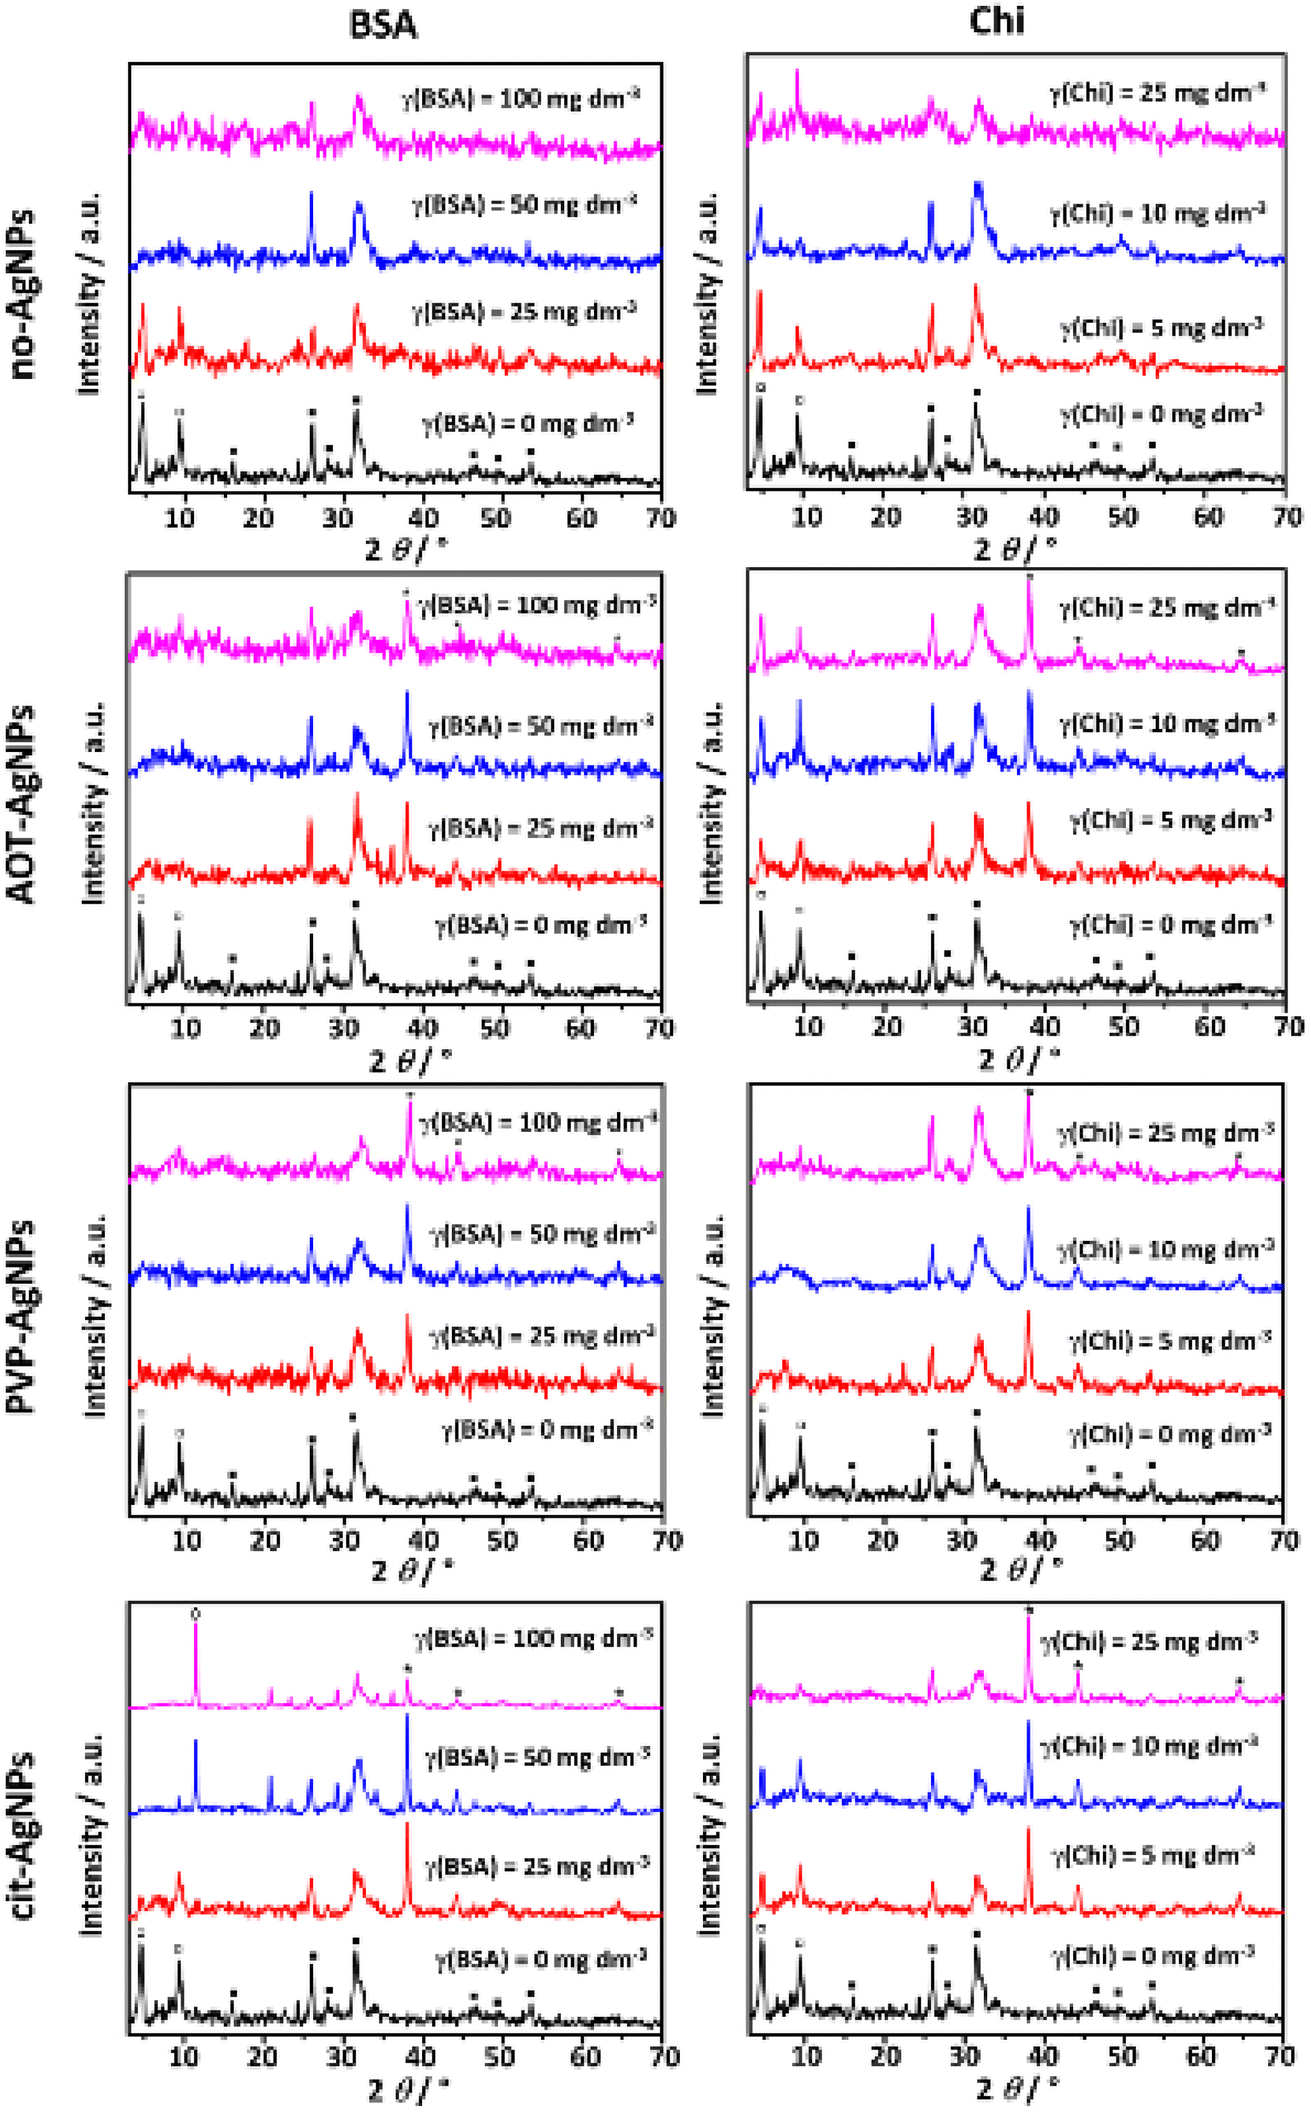 | ||
| Fig. 4 PXRD patterns of crystalline precipitates obtained in the control system and in the presence of the different concentrations of bovine serum albumin (BSA) or chitosan (Chi) in the absence and presence of 10 mg dm−3 of silver nanoparticles (AgNPs) stabilized with sodium bis(2-ethylhexyl) sulfosuccinate (AOT-AgNPs), poly(vinylpyrrolidone) (PVP-AgNPs), and citrate (cit-AgNPs). c(CaCl2) = c(Na2HPO4) = 4 × 10⁻³ mol dm−3, pH 7.4, 25 °C. □ – octacalcium phosphate, ■ – calcium deficient hydroxyapatite, ◊ – calcium hydrogenphosphate dihydrate, * – silver nanoparticles. | ||
In the PXRD pattern characteristic OCP peaks at 2θ 4.6° and 9.4° corresponding to (100) and (200) reflections (JCPDS Card No.: 074-1301) were observed.
In addition, prominent apatitic peaks at 2θ 26.0° and 31.8° along with low intensity peaks at 2θ 16.1, 28.1°, 31.7°, 39.3°, 46.4°, 49.6° and 53.3° were observed, indicating formation of poorly crystalline CaDHA.61,70 Phosphate and water bands, characteristic of calcium phosphates, were observed in the FTIR spectra. Bands characteristic of ν3a triply degenerated asymmetric stretching mode of PO43−, ν3c triply degenerated asymmetric stretching mode of PO43−, ν1 nondegenerated symmetric stretching mode of PO43−, HPO42− stretching, ν4a triply degenerated bending mode of PO43−, and ν4b triply degenerated bending mode of PO43− were observed at 1100 cm−1, 1076 cm−1, 1020 cm−1, 962 cm−1, 917 cm−1 and 869 cm−1, 601 cm−1, and 559 cm−1, respectively. Characteristic broad water bands were observed in the region 3630–2870 cm−1, as well as at 1643 cm−1.71–73 Because of their similarity, it is difficult to distinguish between OCP and apatites using FTIR spectra. However, it is thought that the bands at around 1195 cm−1, and 916 cm−1 corresponding to the vibrations of the HPO42− groups in the OCP lattice, can be used to distinguish between apatites and OCP.73 Only the band at 917 cm−1 was observed in the spectrum of the control system. Another spectral feature characteristic of OCP, the hyperfine structure of the phosphate bands in the 1200–1000 cm−1 region, was not observed.73,74 This indicates that the amount of OCP in the precipitate formed in the control system was small, and was detected based on PXRD analysis.
In the PXRD patterns of the precipitates formed in the presence of BSA and Chi, changes in the intensity of the OCP (100) and (200) reflections were observed (Fig. 4), indicating changes in the amount of formed OCP. In the case of both biomacromolecules, the intensity of these peaks decreased with increasing biomacromolecules concentration. This is consistent with a previous study in which it was shown that the composition of the CaPs coating co-precipitated with BSA on a Ti alloy gradually changed from OCP to a mixture of OCP and carbonate apatite with increasing BSA concentration.75
In addition, with increasing biomacromolecules concentration, the intensity of CaPs peaks decreased and the width increased indicating lower crystallinity. Previously, Aimoli et al.76 showed that the ratio of phases in calcium phosphate mixtures precipitated at different pH change in the presence of Chi. On the contrary, Fadeeva et al. did not find any changes in the composition of precipitate.77 In our previous work, no change in the precipitate composition, which consisted only of CaDHA, was observed in the presence of either biomacromolecules.21
Different effects were observed in the PXRD patterns when AgNPs were added to the precipitation system. In the presence of AOT-AgNPs and PVP-AgNPs, a decreased intensity of the most prominent OCP peaks was observed. However, in the presence of cit-AgNPs not only did the intensity of low-angle OCP peaks decrease with increasing BSA concentration, but at two higher BSA concentrations, a peak appeared at 2θ 11.5°, indicating the formation of DCPD. No reflections of the new phases were observed in the presence of Chi. However, the intensity of the OCP peaks was reduced in the presence of PVP-AgNPs and cit-AgNPs, with a stronger effect observed in the presence of PVP-AgNPs. No clear trend with increasing Chi concentration was observed in the presence of AOT-AgNPs. In our previous study, it was shown that at the applied AgNPs concentration OCP formation was inhibited in the presence of AOT-AgNPs and PVP-AgNPs.26 It can be concluded that the effects on a composition of the precipitates formed depend on the specific combination of AgNPs and biomacromolecules.
Smaller changes were observed in the FTIR spectra (Fig. SI 6†). As expected, the intensity of the characteristic BSA bands in the region 1650–1400 cm−1 increased with the BSA concentration. The characteristic Chi bands could not be unambiguously assigned, as they overlapped with the characteristic phosphate bands.67,68 The second-order differentiated FTIR spectra (Fig. SI 7 and SI 8†) were used for a more detailed analysis of the characteristic phosphate bands in the spectral region 1200–450 cm−1. It was observed that the position of the band at 1116 cm−1, corresponding to ν3a triply degenerated asymmetric stretching mode of PO43−, was shifted for ±7 cm−1. More interestingly, the band at 916 cm−1, corresponding to the vibrations of the HPO42− groups in the OCP lattice, was not detected at any of the concentrations of BSA in the presence of AgNPs nor at higher concentrations of Chi in the absence or presence of AgNPs. These changes confirmed the decrease of the amount of OCP in the precipitated mixture seen in PXRD patterns (Fig. 4).
SEM micrographs of the formed precipitates are shown on Fig. 5, SI 9 and SI 10.† In the control system, chain-like structures consisting of spherical aggregates of thin, poorly developed leaf-like crystals characteristic for CaDHA,70 were the dominant crystal form. Sporadically, single, thin, plate-like crystals, characteristic for OCP,39,78 were observed, confirming the PXRD and FTIR results (Fig. 4 and SI 6†). In the presence of BSA, the CaDHA crystals appeared less developed and formed denser aggregates which caused them to lose their spherical shape (Fig. 5 and SI 9†). In the presence of Chi, with increasing concentration, larger spherical aggregates of CaDHA crystals were obtained, which were less developed than in the control system. With increasing BSA and Chi concentration, a lower amount of plate-like OCP crystals was observed (Fig. 5 and SI 10†). This change in morphology is consistent with previous studies showing the influence of BSA21,75 and Chi21,76,77 on the morphology of different CaP phases.
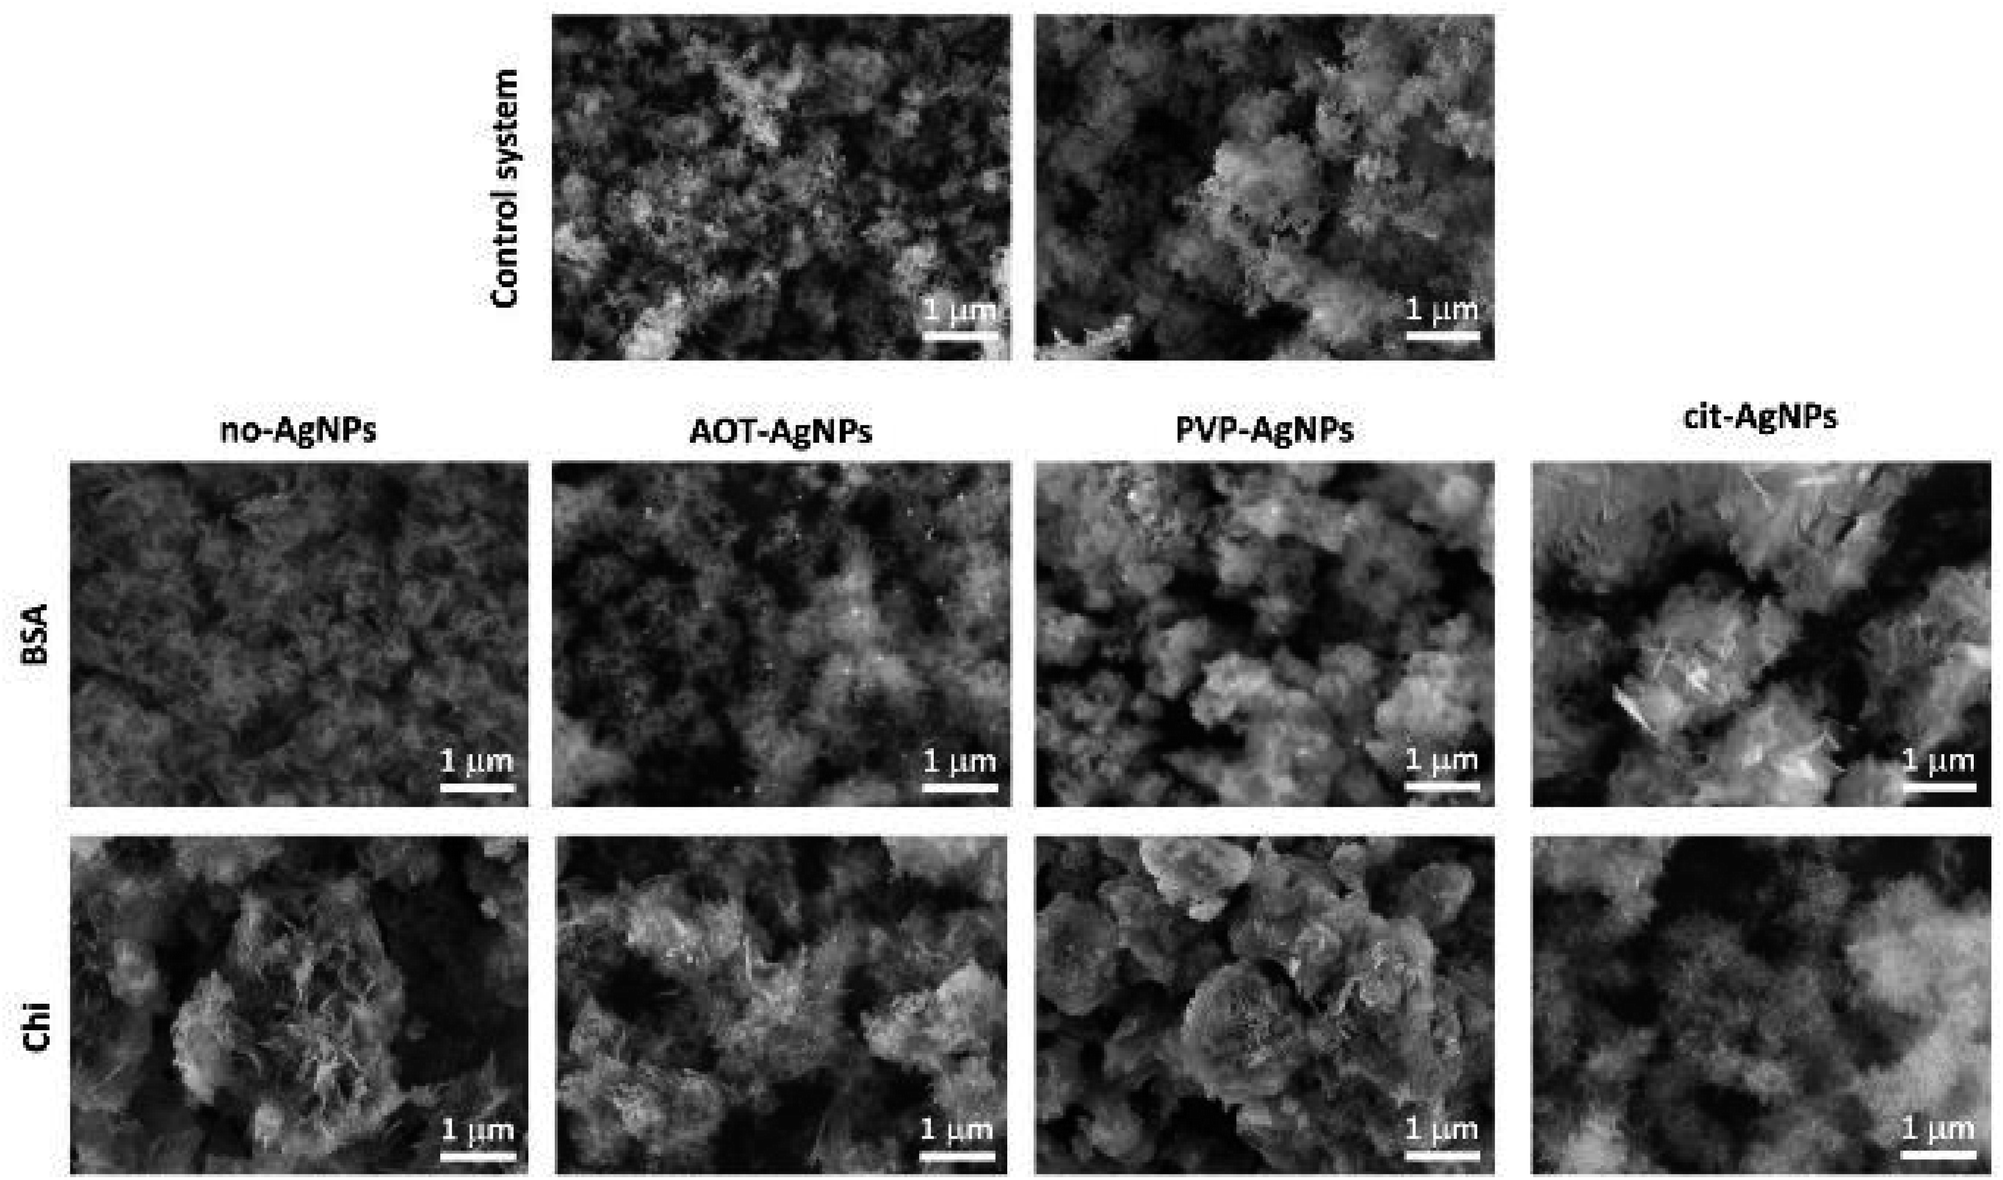 | ||
| Fig. 5 SEM micrographs of crystalline precipitates obtained in the control system and the presence 100 mg dm−3 of bovine serum albumin (BSA) or 25 mg dm−3 of chitosan (Chi) in the absence and presence of 10 mg dm−3 of silver nanoparticles (AgNPs) stabilized sodium bis(2-ethylhexyl) sulfosuccinate (AOT-AgNPs), poly(vinylpyrrolidone) (PVP-AgNPs), and citrate (cit-AgNPs). c(CaCl2) = c(Na2HPO4) = 4 × 10⁻³ mol dm−3, pH 7.4, 25 °C. | ||
In the presence of BSA and AgNPs (Fig. 5 and SI 9†), spherical aggregates of CaDHA crystals were observed in all systems, differing in size. The largest crystals and aggregates were obtained in the presence of cit-AgNPs. Plate-like OCP crystals were seen at the lowest AgNPs concentrations, except for cit-AgNPs. However, the PXRD patterns of precipitates formed in the presence of two higher cit-AgNPs (Fig. 4) showed that the larger plate-like crystals were DCPD.
In the presence of two lower concentrations of Chi with AOT-AgNPs or cit-AgNPs, OCP crystals, larger than in the control system, were observed as the dominant phase (Fig. 5 and SI 10†). However, at the highest investigated concentration, spherical aggregates of leaf-like CaDHA crystals, larger than in the control system, were obtained. In the case of PVP-AgNPs, plate-like OCP crystals were observed only at the lowest applied Chi concentration. The obtained results confirm our previous observation that the influence of BSA and Chi on CaDHA morphology was dependent on the type of TiO2 nanomaterials present in the precipitation system.21 Interestingly, it appears that as the concentration of biomacromolecules increased, fewer AgNPs were found on the surface of the crystals. This could be a consequence of the adsorption of the biomacromolecules on the surface of the AgNPs, as shown by the DLS and ELS measurements (Table 2), which could allow their better incorporation into the CaPs.
To confirm the incorporation of BSA and Chi in the formed composites, a TGA analysis was performed (Fig. 6).
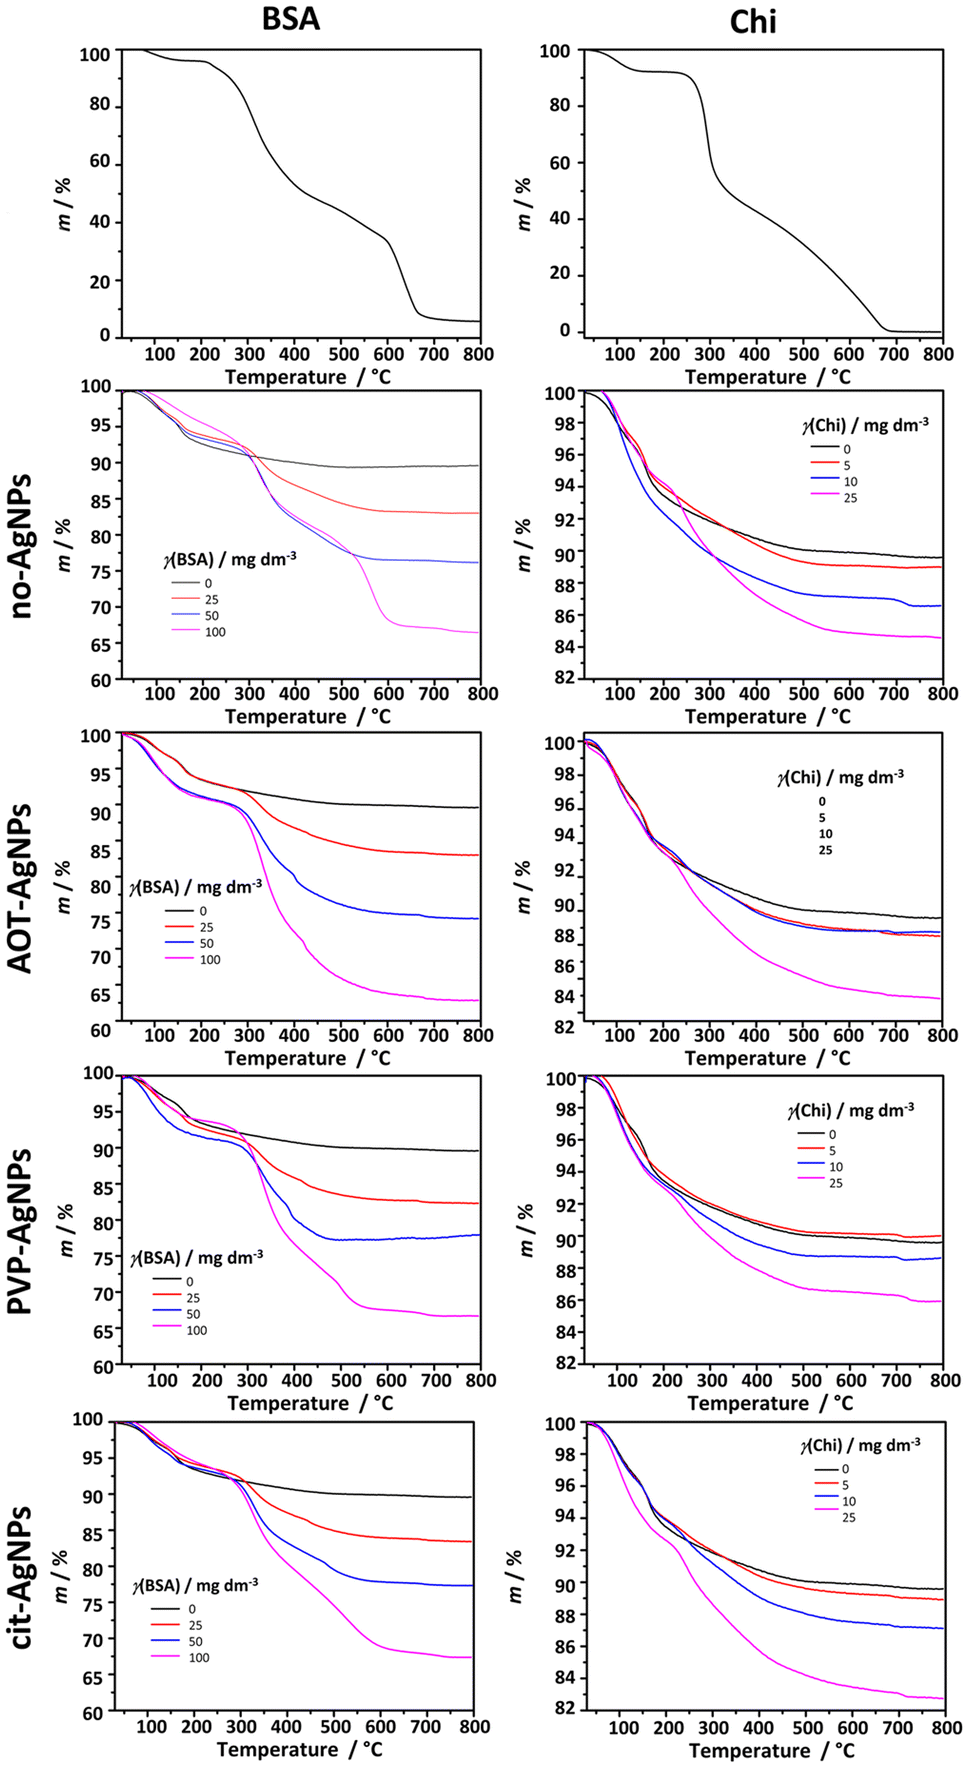 | ||
| Fig. 6 TGA curves of bovine serum albumin (BSA), chitosan (Chi) and crystalline precipitates obtained in the control system and in the presence of the different concentrations of bovine serum albumin (BSA) or chitosan (Chi) in the absence and presence of 10 mg dm−3 of silver nanoparticles (AgNPs) stabilized with sodium bis(2-ethylhexyl) sulfosuccinate (AOT-AgNPs), poly(vinylpyrrolidone) (PVP-AgNPs), and citrate (cit-AgNPs). c(CaCl2) = c(Na2HPO4) = 4 × 10⁻³ mol dm−3, pH 7.4, 25 °C. | ||
Two weight losses were observed in the curve of the precipitate formed in the control system. The weight loss of 6.4% in the temperature range 50–172 °C corresponds to the loss of adsorbed water. The second loss of 4.0% in the temperature range 172–495 °C corresponds to CaP decomposition.79,80 The thermal decomposition of BSA proceeds in 4 steps. In the temperature range 75–150 °C the weight loss of 3.5% could be ascribed to the evaporation of adsorbed water. The subsequent weight losses in the temperature ranges 210–430 °C, 430–600 °C, and 600–675 °C, which amount to 88.0%, correspond to the decomposition of BSA, similar to previously published results.81 The first weight loss of 6.7% in the TGA curve of Chi in the temperature range 54–135 °C could be attributed to the loss of adsorbed water. The main decomposition occurred in two steps, in the temperature ranges 235–331 °C and 331–684 °C, resulting in total weight loss of 91%. Previous studies have shown that the second slower, step corresponds to oxidation and subsequent decomposition of oxidized chitosan.82 The TGA curves of the precipitates formed in the presence of biomacromolecules and differently stabilized AgNPs confirm the presence of BSA and Chi in the precipitate. As expected, the total weight loss increased with increasing concentration of biomacromolecules in the precipitation system. Furthermore, the shape of the TGA curves at the highest concentration studied resembles the curves of pure biomacromolecules, suggesting that in these cases the major weight loss can be ascribed to BSA or Chi. Interestingly, the total weight loss was not dependent on the presence or absence of differently stabilized AgNPs, as no significant difference was observed in the total weight losses of the precipitates formed at the same biomacromolecule concentration and in the absence or presence of AgNPs.
4. Conclusions
In this study, the influence of BSA and Chi on the precipitation of CaP in the presence of differently stabilized AgNPs was determined. The results have shown that these two biomacromolecules have different effects on the rate of transformation from amorphous to crystalline phases, as well as on the properties of ACP and crystalline phases formed.Both biomacromolecules inhibited ACP transformation, with Chi being the more efficient inhibitor. However, no effect of the differently stabilized AgNPs on the rate of transformation was observed in the presence of BSA, probably due to the higher BSA concentrations, compared to the concentration of AgNPs. On the contrary, the extent of inhibition of Chi depended on the type of AgNPs and was the greatest in the presence of PVP-AgNPs. Both biomacromolecules affected the morphology of ACP. BSA promoted the formation of a gel-phase, while in the presence of Chi, spherical particles smaller than in the control system were obtained. The extent of the effect on morphology depended on the type of AgNPs. The observed differences in the effects could be attributed to the difference in the molecular structure of BSA and Chi. While the BSA molecule is a rigid molecule with a heart-like compact structure, Chi is a flexible, linear molecule, that can more easily cover the surface of ACP particles.
BSA and Chi influenced both the composition and morphology of the crystalline phases formed. In the control system, a mixture of CaDHA and a small amount of OCP was formed. As the concentration of the biomacromolecules increased, in the absence or presence of AgNPs, the amount of OCP decreased as shown by PXRD and FTIR characterization. The strongest effect was observed in the precipitation system containing, BSA and cit-AgNPs. A change in composition was observed as DCPD was formed and OCP was not detected.
The obtained results point that the type and extent of biomacromolecules influence on CaP precipitation depends on a specific combination of biomacromolecule and differently stabilized AgNPs. This simple procedure of tailoring the properties of CaPs could be of interest for the rational design of biomimetic, green, synthetic routes for multicomponent composites.
Data availability
The datasets supporting this article have been uploaded as part of the ESI material.†Author contributions
Suzana Inkret: formal analysis, investigation; Ina Erceg: formal analysis, investigation, visualization; Marija Ćurlin: formal analysis, investigation; Nikolina Kalčec: formal analysis, investigation; Nikolina Peranić: formal analysis, investigation; Ivana Vinković Vrček: methodology, writing – review and editing, resources; Darija Domazet Jurašin: formal analysis, investigation; Maja Dutour Sikirić: conceptualization, formal analysis, writing – original draft, writing – review and editing, funding acquisition.Conflicts of interest
There are no conflicts to declare.Acknowledgements
This work has been fully supported by Croatian Science Foundation under the project HRZZ-IP-2018-01-1493. We are in debt to Ljerka Zlovolić for her technical assistance with precipitation experiments and Vida Strasser for graphical illustrations.References
- L. Moroni, A. Nandakumar, F. B.- de Groot, C. A. van Blitterswijk and P. Habibovic, J. Tissue Eng. Regener. Med., 2015, 9, 745–759 CrossRef CAS PubMed.
- T. Mastnak, U. Maver and M. Finšgar, Int. J. Mol. Sci., 2022, 23, 2786 CrossRef CAS PubMed.
- B. D. Ratner, Biomaterials science: an introduction to materials in medicine, Academic Press, Place of publication not identified, 2013 Search PubMed.
- J. S. Lee and W. L. Murphy, Adv. Mater., 2013, 25, 1173–1179 CrossRef CAS PubMed.
- V. Strasser and M. Dutour Sikirić, in Encyclopedia of Materials: Technical Ceramics and Glasses, Elsevier, 2021, pp. 646–661 Search PubMed.
- S. Dorozhkin, Materials, 2009, 2, 399–498 CrossRef CAS.
- S. V. Dorozhkin, J. Mater. Chem. B, 2019, 7, 7471–7489 RSC.
- S. Dorozhkin, J. Funct. Biomater., 2015, 6, 708–832 CrossRef CAS PubMed.
- S. Weiner and H. D. Wagner, Annu. Rev. Mater. Sci., 1998, 28, 271–298 CrossRef CAS.
- C. Canal and M. P. Ginebra, J. Mech. Behav. Biomed. Mater., 2011, 4, 1658–1671 CrossRef CAS PubMed.
- F. D. Cojocaru, V. Balan, M. I. Popa, A. Lobiuc, A. Antoniac, I. V. Antoniac and L. Verestiuc, Int. J. Biol. Macromol., 2019, 125, 612–620 CrossRef CAS PubMed.
- R. Socrates, O. Prymak, K. Loza, N. Sakthivel, A. Rajaram, M. Epple and S. Narayana Kalkura, Mater. Sci. Eng. C, 2019, 99, 357–366 CrossRef CAS PubMed.
- L. Yan, Y. Xiang, J. Yu, Y. Wang and W. Cui, ACS Appl. Mater. Interfaces, 2017, 9, 5023–5030 CrossRef CAS PubMed.
- C.-M. Xie, X. Lu, K.-F. Wang, F.-Z. Meng, O. Jiang, H.-P. Zhang, W. Zhi and L.-M. Fang, ACS Appl. Mater. Interfaces, 2014, 6, 8580–8589 CrossRef CAS PubMed.
- J. A. Jennings, D. A. Velasquez Pulgarin, D. L. Kunwar, J. Babu, S. Mishra and J. Bumgardner, Thin Solid Films, 2015, 596, 83–86 CrossRef CAS.
- G. Falini and S. Fermani, Cryst. Res. Technol., 2013, 48, 864–876 CrossRef CAS.
- V. Sokolova and M. Epple, Chem. –Eur. J., 2021, 27, 7471–7488 CrossRef CAS PubMed.
- K. Bleek and A. Taubert, Acta Biomater., 2013, 9, 6283–6321 CrossRef CAS PubMed.
- I. Erceg, A. Selmani, A. Gajović, I. Panžić, D. Iveković, F. Faraguna, S. Šegota, M. Ćurlin, V. Strasser, J. Kontrec, D. Kralj, N. Maltar Strmečki and M. Dutour Sikirić, Colloids Surf., A, 2020, 593, 124615 CrossRef CAS.
- J. M. Ruso, V. Verdinelli, N. Hassan, O. Pieroni and P. V. Messina, Langmuir, 2013, 29, 2350–2358 CrossRef CAS PubMed.
- I. Erceg and M. Dutour Sikirić, Minerals, 2022, 12, 1557 CrossRef CAS.
- S. A. Brennan, C. Ní Fhoghlú, B. M. Devitt, F. J. O'Mahony, D. Brabazon and A. Walsh, Bone Joint J., 2015, 97-B, 582–589 CrossRef CAS PubMed.
- M. Ip, S. L. Lui, V. K. M. Poon, I. Lung and A. Burd, J. Med. Microbiol., 2006, 55, 59–63 CrossRef CAS PubMed.
- M. K. Rai, S. D. Deshmukh, A. P. Ingle and A. K. Gade, J. Appl. Microbiol., 2012, 112, 841–852 CrossRef CAS PubMed.
- S. Kittler, C. Greulich, J. Diendorf, M. Köller and M. Epple, Chem. Mater., 2010, 22, 4548–4554 CrossRef CAS.
- S. Inkret, M. Ćurlin, K. Smokrović, N. Kalčec, N. Peranić, N. Maltar-Strmečki, D. Domazet Jurašin and M. Dutour Sikirić, Materials, 2023, 16, 1764 CrossRef CAS PubMed.
- A. M. Ferreira, A. Vikulina, M. Loughlin and D. Volodkin, RSC Adv., 2023, 13, 10542–10555 RSC.
- M. D. Sikirić and H. Füredi-Milhofer, Adv. Colloid Interface Sci., 2006, 128–130, 135–158 CrossRef PubMed.
- I. Vinković Vrček, I. Pavičić, T. Crnković, D. Jurašin, M. Babič, D. Horák, M. Lovrić, L. Ferhatović, M. Ćurlin and S. Gajović, RSC Adv., 2015, 5, 70787–70807 RSC.
- K. Kato, S. Lee and F. Nagata, Molecules, 2020, 25, 2312 CrossRef CAS PubMed.
- V. Ozhukil Kollath, S. Mullens, J. Luyten, K. Traina and R. Cloots, RSC Adv., 2015, 5, 55625–55632 RSC.
- K. Tomoda, H. Ariizumi, T. Nakaji and K. Makino, Colloids Surf., B, 2010, 76, 226–235 CrossRef CAS PubMed.
- Z. Xu and V. H. Grassian, J. Phys. Chem. C, 2017, 121, 21763–21771 CrossRef CAS.
- M. N. V. R. Kumar, R. A. A. Muzzarelli, C. Muzzarelli, H. Sashiwa and A. J. Domb, Chem. Rev., 2004, 104, 6017–6084 CrossRef PubMed.
- F. Croisier and C. Jérôme, Eur. Polym. J., 2013, 49, 780–792 CrossRef CAS.
- D. D. Jurašin, M. Ćurlin, I. Capjak, T. Crnković, M. Lovrić, M. Babič, D. Horák, I. Vinković Vrček and S. Gajović, Beilstein J. Nanotechnol., 2016, 7, 246–262 CrossRef PubMed.
- C. H. Munro, W. E. Smith, M. Garner, J. Clarkson and P. C. White, Langmuir, 1995, 11, 3712–3720 CrossRef CAS.
- I. Capjak, M. Zebić Avdičević, M. D. Sikirić, D. Domazet Jurašin, A. Hozić, D. Pajić, S. Dobrović, W. Goessler and I. Vinković Vrček, Environ. Sci.: Water Res. Technol., 2018, 4, 2146–2159 RSC.
- P. Bar-Yosef Ofir, R. Govrin-Lippman, N. Garti and H. Füredi-Milhofer, Cryst. Growth Des., 2004, 4, 177–183 CrossRef.
- V. Uskoković, Vib. Spectrosc., 2020, 108, 103045 CrossRef PubMed.
- M. Elimelech, Particle deposition and aggregation: measurement, modelling, and simulation, Butterworth-Heinemann, Woburn, 1998 Search PubMed.
- N. Akaighe, S. W. Depner, S. Banerjee, V. K. Sharma and M. Sohn, Sci. Total Environ., 2012, 441, 277–289 CrossRef CAS PubMed.
- Md. A. Huq, Md. Ashrafudoulla, Md. A. K. Parvez, S. R. Balusamy, Md. M. Rahman, J. H. Kim and S. Akter, Polymers, 2022, 14, 5302 CrossRef CAS PubMed.
- M. Levak, P. Burić, M. Dutour Sikirić, D. Domazet Jurašin, N. Mikac, N. Bačić, R. Drexel, F. Meier, Ž. Jakšić and D. M. Lyons, Environ. Sci. Technol., 2017, 51, 1259–1266 CrossRef CAS PubMed.
- L. Wang and G. H. Nancollas, Dalton Trans., 2009, 2665 RSC.
- A. Selmani, I. Coha, K. Magdić, B. Čolović, V. Jokanović, S. Šegota, S. Gajović, A. Gajović, D. Jurašin and M. Dutour Sikirić, CrystEngComm, 2015, 17, 8529–8548 RSC.
- S. Li and L. Wang, CrystEngComm, 2012, 14, 8037 RSC.
- H. Ding, H. Pan, X. Xu and R. Tang, Cryst. Growth Des., 2014, 14, 763–769 CrossRef CAS.
- C.-G. Wang, J.-W. Liao, B.-D. Gou, J. Huang, R.-K. Tang, J.-H. Tao, T.-L. Zhang and K. Wang, Cryst. Growth Des., 2009, 9, 2620–2626 CrossRef CAS.
- J. Christoffersen, M. R. Christoffersen, W. Kibalczyc and F. A. Andersen, J. Cryst. Growth, 1989, 94, 767–777 CrossRef CAS.
- W. J. E. M. Habraken, J. Tao, L. J. Brylka, H. Friedrich, L. Bertinetti, A. S. Schenk, A. Verch, V. Dmitrovic, P. H. H. Bomans, P. M. Frederik, J. Laven, P. van der Schoot, B. Aichmayer, G. de With, J. J. DeYoreo and N. A. J. M. Sommerdijk, Nat. Commun., 2013, 4, 1507 CrossRef PubMed.
- I. Erceg, N. Maltar-Strmečki, D. D. Jurašin, V. Strasser, M. Ćurlin, D. M. Lyons, B. Radatović, N. M. Mlinarić, D. Kralj and M. D. Sikirić, Crystals, 2021, 11, 792 CrossRef CAS.
- H. Füredi-Milhofer and S. Sarig, Prog. Cryst. Growth Charact. Mater., 1996, 32, 45–74 CrossRef.
- A. Bujacz, Acta Crystallogr., Sect. D: Biol. Crystallogr., 2012, 68, 1278–1289 CrossRef CAS PubMed.
- I. Younes and M. Rinaudo, Mar. Drugs, 2015, 13, 1133–1174 CrossRef CAS PubMed.
- S. Islam, M. A. R. Bhuiyan and M. N. Islam, J. Polym. Environ., 2017, 25, 854–866 CrossRef CAS.
- A. P. Serro, M. Bastos, J. C. Pessoa and B. Saramago, J. Biomed. Mater. Res., 2004, 70A, 420–427 CrossRef CAS PubMed.
- J. Lima, S. R. Sousa, A. Ferreira and M. A. Barbosa, J. Biomed. Mater. Res., 2001, 55, 45–53 CrossRef CAS PubMed.
- B. J. M. Leite Ferreira, M. G. G. M. Duarte, M. H. Gil, M. H. V. Fernandes and R. N. Correia, J. Appl. Biomater. Funct. Mater., 2012, 10, 92–98 Search PubMed.
- J. V. Rau, A. Generosi, V. S. Komlev, M. Fosca, S. M. Barinov and V. R. Albertini, Dalton Trans., 2010, 39, 11412 RSC.
- I. Buljan Meić, J. Kontrec, D. Domazet Jurašin, A. Selmani, B. Njegić Džakula, N. Maltar-Strmečki, D. M. Lyons, M. Plodinec, M. Čeh, A. Gajović, M. D. Sikirić and D. Kralj, CrystEngComm, 2018, 20, 35–50 RSC.
- S. V. Dorozhkin, Biomater. Sci., 2021, 9, 7748–7798 RSC.
- S. V. Dorozhkin, Acta Biomater., 2010, 6, 4457–4475 CrossRef CAS PubMed.
- C. Combes and C. Rey, Acta Biomater., 2010, 6, 3362–3378 CrossRef CAS PubMed.
- E. Bronze-Uhle, B. C. Costa, V. F. Ximenes and P. N. Lisboa-Filho, Nanotechnol., Sci. Appl., 2016, 10, 11–21 CrossRef PubMed.
- S. S. Rohiwal, R. K. Satvekar, A. P. Tiwari, A. V. Raut, S. G. Kumbhar and S. H. Pawar, Appl. Surf. Sci., 2015, 334, 157–164 CrossRef CAS.
- C. E. Tanase, M. I. Popa and L. Verestiuc, J. Biomed. Mater. Res., 2012, 100B, 700–708 CrossRef CAS PubMed.
- S. Kumar, P. K. Dutta and J. Koh, Int. J. Biol. Macromol., 2011, 49, 356–361 CrossRef CAS PubMed.
- B. Xie, T. J. Halter, B. M. Borah and G. H. Nancollas, Cryst. Growth Des., 2014, 14, 1659–1665 CrossRef CAS PubMed.
- I. Buljan Meić, J. Kontrec, D. Domazet Jurašin, B. Njegić Džakula, L. Štajner, D. M. Lyons, M. Dutour Sikirić and D. Kralj, Cryst. Growth Des., 2017, 17, 1103–1117 CrossRef.
- S. Koutsopoulos, J. Biomed. Mater. Res., 2002, 62, 600–612 CrossRef CAS PubMed.
- C. Mochales, R. M. Wilson, S. E. P. Dowker and M.-P. Ginebra, J. Alloys Compd., 2011, 509, 7389–7394 CrossRef CAS.
- C. Drouet, BioMed Res. Int., 2013, 2013, 1–12 CrossRef PubMed.
- B. O. Fowler, M. Markovic and W. E. Brown, Chem. Mater., 1993, 5, 1417–1423 CrossRef CAS.
- Y. Liu, P. Layrolle, J. de Bruijn, C. van Blitterswijk and K. de Groot, J. Biomed. Mater. Res., 2001, 57, 327–335 CrossRef CAS PubMed.
- C. G. Aimoli, D. O. de Lima and M. M. Beppu, Mater. Sci. Eng. C, 2008, 28, 1565–1571 CrossRef CAS.
- I. V. Fadeeva, S. M. Barinov, A. Yu. Fedotov and V. S. Komlev, Dokl. Chem., 2011, 441, 387–390 CrossRef CAS.
- H. Furedi-Milhofer, J. Moradian-Oldak, S. Weiner, A. Veis, K. P. Mintz and L. Addadf, Connect. Tissue Res., 1994, 30, 251–264 CrossRef CAS PubMed.
- K. Tõnsuaadu, K. A. Gross, L. Plūduma and M. Veiderma, J. Therm. Anal. Calorim., 2012, 110, 647–659 CrossRef.
- H. Shi, X. Ye, J. Zhang, T. Wu, T. Yu, C. Zhou and J. Ye, Bioact. Mater., 2021, 6, 1267–1282 CrossRef CAS PubMed.
- A. Gebregeorgis, C. Bhan, O. Wilson and D. Raghavan, J. Colloid Interface Sci., 2013, 389, 31–41 CrossRef CAS PubMed.
- J. Zawadzki and H. Kaczmarek, Carbohydr. Polym., 2010, 80, 394–400 CrossRef CAS.
Footnote |
| † Electronic supplementary information (ESI) available. See DOI: https://doi.org/10.1039/d3ra02115g |
| This journal is © The Royal Society of Chemistry 2023 |