DOI:
10.1039/D3RA01969A
(Paper)
RSC Adv., 2023,
13, 17508-17515
Red emission of copper aluminate synthesized via chemical and bio-mediated routes
Received
25th March 2023
, Accepted 20th May 2023
First published on 9th June 2023
Abstract
For the first time, copper aluminate nanoparticles (NPs) are synthesized by a combustion method using urea as a fuel (CAOU) and Ocimum sanctum (tulsi) extract as a reducing agent (CAOT). The Bragg reflections of the as-formed product confirm the formation of a cubic phase with Fd![[3 with combining macron]](https://www.rsc.org/images/entities/char_0033_0304.gif) m space group. The crystallite size, crystallinity and other structural parameters are discussed. The surface morphology of CAOU is agglomerated in nature whereas that of CAOT is hexagonal in shape. The smaller crystallite size CAOT NPs show a higher energy band gap. The photoluminescence (PL) analysis excited at 302 nm shows that the CIE coordinates fall in the red region. The oxygen defects are mainly responsible for the PL emission. The CCT coordinates confirm that both CAOU and CAOT NPs can find an application in warm light emitting diodes.
m space group. The crystallite size, crystallinity and other structural parameters are discussed. The surface morphology of CAOU is agglomerated in nature whereas that of CAOT is hexagonal in shape. The smaller crystallite size CAOT NPs show a higher energy band gap. The photoluminescence (PL) analysis excited at 302 nm shows that the CIE coordinates fall in the red region. The oxygen defects are mainly responsible for the PL emission. The CCT coordinates confirm that both CAOU and CAOT NPs can find an application in warm light emitting diodes.
I. Introduction
Due to their excellent combination of key characteristics including high melting point, hardness, relatively low density, high mechanical strength, high resistance to chemical attack, wide energy band gap, and high electrical resistivity, aluminates have recently attracted significant attention from academia and the industrial sector.1 These properties make them useful in sensors,2 biomedical devices,3 displays4 etc. Numerous studies have been employed on different aluminates such as ZnAl2O4,5 CuAl2O4,6 CaAl2O4 (ref. 7) etc.
Among the aluminate spinels, the nanocrystalline copper aluminate (CuAl2O4) is known to be active in the degradation of some organic compounds8 and in the reduction of nitrogen monoxide with carbon monoxide.9 Similar to other aluminates, copper aluminate finds an application as a sensor material and as a ceramic pigment in ceramic coatings.10 In a cubic stoichiometry, Cu2+ ions occupy tetrahedral positions whereas Al3+ ions occupy octahedral positions. In addition to this, Al3+ ions are distributed equally between both the coordinates.11 In the copper aluminate Cu–Al–O system, chemical and structural relations are more complex. In the atmosphere, two copper oxides can form: CuO and Cu2O. Moreover, this system provides two stable copper aluminates. One with spinel structure (CuAl2O4) and other with delafossite structure (CuAlO2). Among these two, copper aluminate with cubic spinel crystal structure possesses high thermal stability and high mechanical resistance. Substitution of metal ions in tetrahedral or octahedral sites improves the optical, magnetic and catalytic properties of the nanomaterial.
In the last few decades, nanomaterials (NMs) have become a crucial component of advanced display technology.12 Materials that produce light are sensitive to light exposure. They emit light after absorbing light at a specific wavelength, usually UV light and emit the light at another wavelength in the visible region.13 A number of research works have been carried out on the PL property of aluminates. Gadolinium aluminate as a host gives green emission. This green emission can be enhanced after doping with terbium ions.14 Barium magnesium aluminate is a blue phosphor; after thermal degradation it gives green emission.15 Pure blue emission is observed for magnesium strontium aluminate.16 Even though a number of research works have been carried out on pure/doped aluminates, there is a little data on the optical properties of copper aluminate.17,18
For all these applications, synthesis of copper aluminate with high purity, small crystallite size and high surface area is required. This can be achieved through a suitable synthesis route. Copper aluminate has been synthesized using different routes such as sonochemical,19,20 sol gel,21,22 soft chemical route,10 etc. Among all these routes, combustion synthesis is a more convenient method for the synthesis of nanomaterials. Through this method, one can synthesise single phase NMs with homogeneous structure at low temperatures. In this method, generally, chemical fuels are used to get the single phase. Because of these outstanding properties, a combustion method has been chosen to synthesize the NPs. However, nowadays, the use of plant extracts as a reducing agent or capping agent to tune the properties of NMs has become a prominent area of research work in materials science. In this context, Ocimum sanctum (tulsi) extract is used as a reducing agent and compared with the same NMs synthesized using urea as a fuel. The effect of chemical fuel and tulsi extract as a reducing agent on the optical properties of copper aluminate are explored.
The plant Ocimum sanctum is a “Mother medicine of Nature” as well as “Queen of Herbs”. It has antioxidant and antidiarrhoeal properties. Eugenol is the primary active ingredient in tulsi. Chemicals including caryophyllene, terpinene-4-ol, eugenol methyl ester, 3-carene, vitamin C, gallic acid, vanillin, carvacrol, palmitic acid and vitamin A are other chemicals extracted from tulsi. Hence in the present study, copper aluminate is synthesized by using a chemical and tulsi extract as a reducing agent viz. CAOU and CAOT, for the purposes of comparison of the resulting structural and optical properties. The photoluminescence behavior was studied for applications in energy efficient display technology.
II. Materials and methods
A. Synthesis of CuAl2O4 using urea as a fuel (CAOU)
Initially, 5 g of Cu(NO3)2·6H2O, 0.58 g of urea as a fuel and 7.2 g of Al(NO3)3 were dissolved in a minimum amount of nitric acid under magnetic stirring at room temperature for 3 h. The oxidizer-to-fuel ratio is maintained as one. The above solution is placed in a preheated muffle furnace. Within a short interval of time, the mixture catches fire and undergoes an exothermic reaction, which results in the formation of the product. The as-formed product (2.98 g yield) is collected without any further calcination followed by grinding.| | |
7Cu(NO3)2·6H2O + 14Al(NO3)3 + 4CH4N2O = 7CuAl2O4 + 4CO2 + 50H2O + 64NO2
| (1) |
B. Synthesis of CuAl2O4 using tulsi extract as a reducing agent (CAOT)
Initially, 5 g of Cu(NO3)2·6H2O and 7.2 g of Al(NO3)3·9H2O is dissolved in minimum amount of nitric acid. Then 15 ml of Ocimum sanctum (tulsi) extract was subsequently added as a reducing agent to the above solution under magnetic stirring at room temperature for 3 h. The above solution is placed in a preheated muffle furnace. Within a short interval of time, the mixture catches the fire, undergoing exothermic reaction, which results in the formation of the product. The as-formed product with 3.12 g of yield is collected without any further calcination followed by grinding. The flowchart for the synthesis of CuAl2O4 using tulsi extract as a reducing agent and urea as a fuel is shown in Fig. 1.| | |
7Cu(NO3)2·6H2O + 14Al(NO3)3 + 15 ml tulsi extract = 7CuAl2O4 + 4CO2 + 50H2O + 64NO2
| (2) |
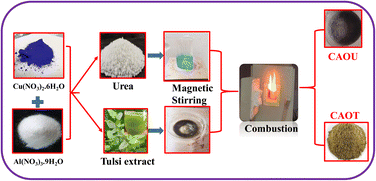 |
| | Fig. 1 Flowchart for the synthesis of CAOU and CAOT NPs. | |
C. Characterization
Powder X-ray diffraction (PXRD) analysis is carried out utilizing a PAN analytical X'Pert-PRO MPD with Cu Kα radiation. Scanning Electron Microscopy (SEM) analysis is carried out using a SEM, Hitachi, and S-4200. To record UV absorption spectra, a V-730 double-beam UV-Visible spectrometer is used. A PerkinElmer L1280134 is used to record Fourier Transform Infrared Spectroscopy. The photoluminescence excitation and emission spectra were recorded on a Horiba Fluorolog Spectrofluorometer at room temperature.
III. Results and discussion
A. PXRD analysis of CAOU and CAOT NPs
The crystalline structure and purity of the sample can be obtained by PXRD analysis. Fig. 2 shows the PXRD pattern of as-formed CAOU and CAOT NPs. The Bragg reflections at 32.44, 35.58, 38.72, 48.77, 53.72, 58.08, and 61.68° 2θ values correspond to (111), (220), (311), (331), (422), (400) and (511) respectively. These diffraction peaks can be indexed to the pure cubic phase with Fd![[3 with combining macron]](https://www.rsc.org/images/entities/char_0033_0304.gif) m space group (JCPDS no. 78-0556). No other impurity related peaks are detected. The PXRD intensity of CAOT was found to be higher compared to CAOU. The reducing agent/fuel plays an important role in the stoichiometry, intensity, defect centers and size of the NPs.23 The crystallite size was estimated by using Scherrer's and W–H plot methods.24 The crystallite size of CAOU and that of CAOT was found to be 25 and 20 nm respectively. The green extract helps to tune the crystallite size of the NPs. The crystallinity of the sample was found to be improved in CAOT. The other structural parameters such as strain, dislocation density, and structural factor are determined and tabulated in Table 1. Similar to chemical fuel, the green extract which is ecofriendly helped in retaining the single cubic phase.
m space group (JCPDS no. 78-0556). No other impurity related peaks are detected. The PXRD intensity of CAOT was found to be higher compared to CAOU. The reducing agent/fuel plays an important role in the stoichiometry, intensity, defect centers and size of the NPs.23 The crystallite size was estimated by using Scherrer's and W–H plot methods.24 The crystallite size of CAOU and that of CAOT was found to be 25 and 20 nm respectively. The green extract helps to tune the crystallite size of the NPs. The crystallinity of the sample was found to be improved in CAOT. The other structural parameters such as strain, dislocation density, and structural factor are determined and tabulated in Table 1. Similar to chemical fuel, the green extract which is ecofriendly helped in retaining the single cubic phase.
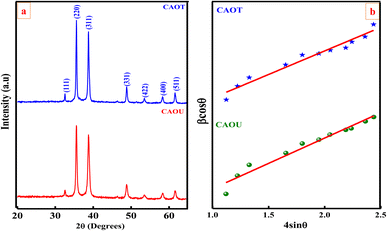 |
| | Fig. 2 (a) PXRD analysis and (b) W–H plot of CAOT and CAOU NPs. | |
Table 1 Crystallite size (Scherrer's and W–H plot method), crystallinity and other structural parameters of the CAOU and CAOT NPs
| Type |
Crystal size (nm) |
Crystallinity (%) |
Strain, ×10−3 |
Dislocation density, ×1015 lines per m2 |
SF |
| Scherrer |
W–H |
| Tulsi |
20.16 |
19.05 |
93.9 |
2.1 |
2.75 |
0.35 |
| Urea |
24.37 |
23.87 |
94.03 |
2.03 |
0.51 |
0.35 |
B. Rietveld analysis of copper aluminate NPs
Rietveld refinement analysis was performed by using the FULLPROOF suite program to get precise information about the crystal structure and lattice parameters. The refined parameters are summarized in Table 2. Good agreement is obtained between the experimental relative intensity and stimulated intensity Fig. 3. The goodness of fit (GOF) is used to estimate the quality of the refined data. In the present study, GOF was found to be 0.96, which confirms that the experimental and theoretical plots fit together well. Diamond software was used to create the packing diagram using the Rietveld refinement parameters (inset of Fig. 3).
Table 2 Rietveld parameters of copper aluminate NPs
| Parameters |
| Crystal system |
Cubic |
| Space group |
Fd![[3 with combining macron]](https://www.rsc.org/images/entities/char_0033_0304.gif) m m |
| Space group number |
227 |
![[thin space (1/6-em)]](https://www.rsc.org/images/entities/char_2009.gif) |
| Lattice parameters |
| a (Å) |
8.075 |
| b (Å) |
8.075 |
| c (Å) |
8.075 |
| Unit cell volume (Å)3 |
526.535 |
![[thin space (1/6-em)]](https://www.rsc.org/images/entities/char_2009.gif) |
| Atomic co-ordinates |
| x = y = z |
|
| Cu |
0 |
| Al |
0.625 |
| O |
0.375 |
![[thin space (1/6-em)]](https://www.rsc.org/images/entities/char_2009.gif) |
| R-Factors |
| Rp |
8.01 |
| Rwp |
10.5 |
| Rexp |
7.11 |
| X2 |
2.18 |
| RBragg |
5.78 |
| Rf |
3.1 |
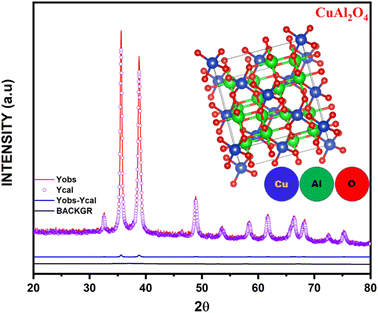 |
| | Fig. 3 Rietveld refinement (inset: packing diagram) of CuAl2O4 NPs. (Yobs - Observed Intensity, Ycal - Intensity obtained from the experiment, BACKGR- Background) | |
C. Surface morphology analysis of CAOU and CAOT NPs
The surface morphology images taken at different magnifications for CAOU and CAOT NPs are displayed in Fig. 4a–d respectively. The CAOU NPs are agglomerated in nature, such that no regularity is observed in the shape of the NPs. Particle aggregation arises due to the reduction in surface free energy of the particles by increasing their size and decreasing their surface area. The adherence of particles to one another by weak forces causes the aggregation of nanoparticles, resulting in submicron/micron sized entities.25 The agglomeration of NPs is the characteristic of the materials synthesized via combustion method. No such agglomeration is observed in CAOT NPs. The surface morphology consists hexagonal shaped NPs which are arranged one above the other. No voids or pores are observed. The Energy Dispersive Analysis X-ray (EDAX) spectra confirms the presence of only Cu, Al and O elements in CAOU and CAOT (Fig. 4e and f, respectively). The insets of Fig. 4e and f depict the atomic and weight percentages of these elements present in the synthesized samples. Weight and atomic percentage of oxygen was found to be more in CAOT than that of CAOU. Thus, green extracts supports and enriches the oxygen content in the synthesized sample.
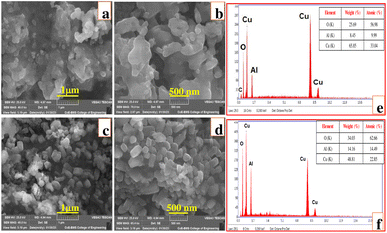 |
| | Fig. 4 (a–d) SEM images at different magnifications, (e and f) EDAX spectrum, (inset: elemental composition) of CAOU (top row) and CAOT (bottom row) NPs. | |
D. TEM morphological analysis of CAOU and CAOT NPs
Fig. 5a shows the TEM image of CAOU NPs. The image clearly indicates the formation of agglomerated NPs. Fig. 5b and c depict the HRTEM images of the NPs. The lattice fringes are clearly visible (Fig. 5c). For those lattice fringes, the interplanar spacing of 0.2854, 0.1554 and 0.2434 nm correspond to the (220), (511) and (311) planes in the cubic structure of the copper aluminate. The crystallite size determined from the TEM image is found to be 25 nm which is in accordance with the size estimated by Scherrer's method. No other interplanar spacings corresponding to the CuO or Al2O3 crystalline phases are observed. The SAED pattern is depicted in Fig. 5d. The SAED pattern's observed diffraction rings amply demonstrate good crystallinity. These diffraction rings were assigned to the cubic phase of copper aluminate and were indexed to the (311), (331), (220), and (511) planes. These findings support the XRD analysis and confirms the formation of pure copper aluminate. Similar observations were also made in the TEM images and SAED pattern of CAOT NPs (Fig. 6a–d). But compared to CAOU, less good crystallinity is observed in CAOT NPs.
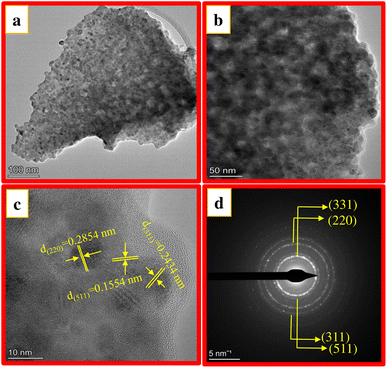 |
| | Fig. 5 (a) TEM image (b and c) HRTEM image and (d) SAED pattern of CAOU NPs. | |
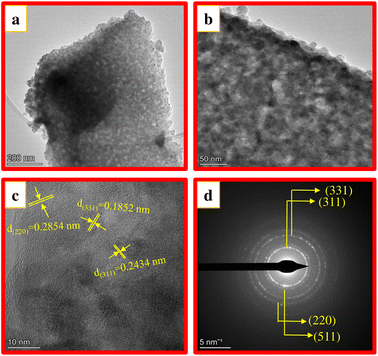 |
| | Fig. 6 (a) TEM image (b and c) HRTEM image and (d) SAED pattern of CAOT NPs. | |
E. FTIR spectroscopic analysis of CAOU and CAOT NPs
The FTIR spectra were recorded from 4000–400 cm−1 to show the different functional groups present in the as-formed CAOU and CAOT NPs (Fig. 7). The different functional groups and their corresponding wavenumbers are tabulated in Table 3. As we observed from Fig. 7, compared to CAOU, more IR absorption peaks are observed in CAOT between 1000 and 1550 cm−1. The IR absorption peak observed at 1064 and 1100 cm−1 corresponds to an asymmetric vibration of C–O and C–O–C related to the beta glycosidic linkage in the cellulose of the tulsi extract.30 A sharp peak with a center at 1391 cm−1 can indicate the presence of carboxylic components.
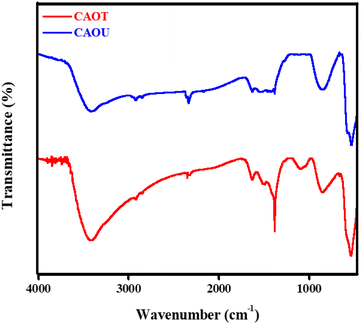 |
| | Fig. 7 FTIR spectroscopic analysis of the CAOU and CAOT NPs. | |
Table 3 FTIR analysis, functional group, wavenumber and their respective remarks of CAOU and CAOT NPs
| Functional groups and their remarks |
Wavenumber (cm−1) |
References |
| CAOU |
CAOT |
| –OH stretching of absorbed water |
3405 |
3441 |
26 |
| H–O–H bonding of absorbed water |
1620 |
1644 |
26 |
| Lattice vibrations of tetra and octahedrally coordinated metal ions |
537 |
532 |
27 |
| Al3+ occupied the tetrahedral site |
853 |
853 |
28 |
| C–O vibrations |
|
1090 |
29 |
C![[double bond, length as m-dash]](https://www.rsc.org/images/entities/char_e001.gif) C vibrations C vibrations |
|
1405 |
29 |
F. UV-visible analysis of CAOU and CAOT NPs
The percentage of incident radiation that a material absorbs over a range of electromagnetic radiation frequencies can be obtained from the absorption spectrum. The UV-Visible absorption spectra recorded from 200–800 nm show a broad absorption spectra in the case of both CAOU and CAOT (Fig. 8a). Light scattering, from particles suspended in the sample comparable in size to the incident wavelength (250–300 nm) can reduce the amount of light reaching the detector leading to an increase in apparent absorbance. UV-Visible spectroscopy information may be presented as a graph of absorbance, optical density (OD) or transmittance as a function of wavelength. OD and absorbance both measure the amount of light intensity lost in an optical component, but OD takes into consideration loss from light scattering whereas absorbance does not. If very little light scattering is present in a measurement, then OD may be approximated directly using absorbance and Beer–Lambert's law may be used. Even though scattering is associated with the interaction of UV Visible light with the nanoparticles, light scattering does not affect the molar extinction coefficient of a compound. Furthermore, the measured spectrum in UV-Visible spectroscopy corresponds to the absorbance and hence, the impact of light scattering on UV-Visible measurements is negligible. The broadness of the spectra ranges from 255 to 395 nm followed by a long tail in the visible region. At each energy level, a number of vibrational energies are available. The transitions between the different vibrational energy levels are mainly responsible for the peak broadening. Based on this UV-Visible absorption spectra, the direct energy band gap was determined using Wood and Tauc's relation. The tangent extrapolation to the X-axis obtained from the plot of (αhν)2 vs. hν gives the energy gap of the synthesized nanomaterial (Fig. 8b). The calculated direct energy band gap was found to be 3.05 and 2.82 eV for CAOT and CAOU respectively. The decrease in crystallite size of CAOT can be correlated to the increase in energy band gap. Grain size affects the energy gap as a consequence of the charge carrier movement confinement in a limited space. As the size decreases the energy gap increases. As the crystallite size decreases, electron hole pairs are much closer together and the coulombic interaction between them increases giving an overall higher kinetic energy. This increase in kinetic energy leads to the expansion of the band gap.
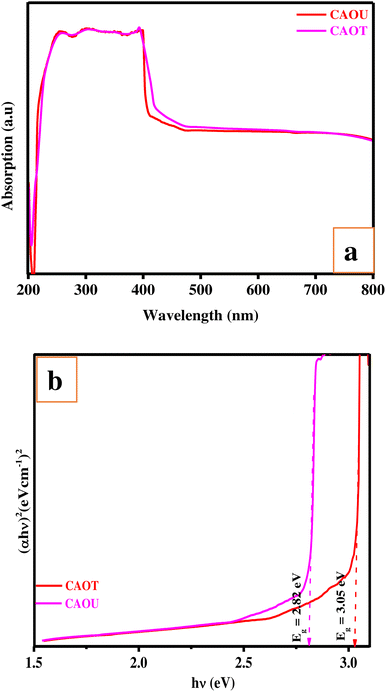 |
| | Fig. 8 (a) UV-Visible absorption spectra of CAOU and CAOT NPs. (b) Wood and Tauc's plot of CAOU and CAOT NPs. | |
G. Photoluminescence analysis of CAOU and CAOT NPs
PL measurements are carried out on CAOU and CAOT NPs to understand the recombination phenomenon in the host matrix. The PL excitation spectrum was recorded by monitoring the emission wavelength at 610 nm (Fig. 9a). The excitation spectrum of CAOT NPs contains a sharp intense peak at 302 nm which can be attributed to transitions involved in the copper aluminate.17 The excitation spectrum taken for CAOU NPs is similar except the small variation in intensity. By choosing the 302 nm as an excitation wavelength, an emission spectrum was recorded for CAOU NPs. The emission spectrum contains a sharp intense peak at 607 nm (Fig. 9b). No other additional peaks are observed. The emission spectrum is associated with the interstitial oxygen species. The electron transition takes place from shallow donor levels to the valence band. The defects provide the donor levels near the conduction band edge of CuAl2O4. Due to the lengthy lifetime of these levels, electrons in the conduction band (CB) initially stay back at the shallow donor level before recombining with the holes in the valence band.31 A similar emission spectra was obtained for CAOT also except the variation in intensity. The highest intensity of CAOT indicates the higher rate of recombination of electrons and the holes. The pictorial representation for the PL excitation and emission is shown in Fig. 10.
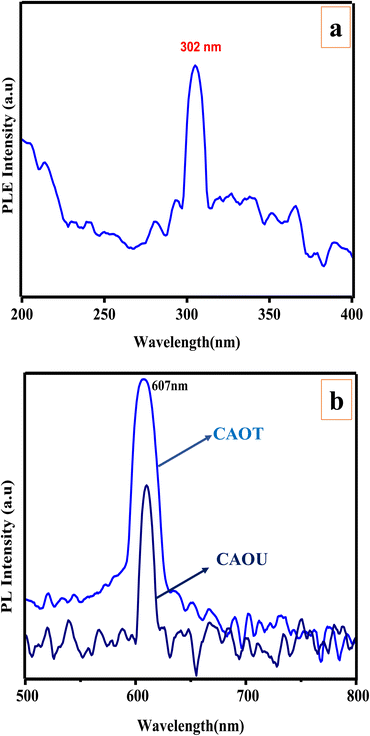 |
| | Fig. 9 (a) PL excitation spectrum. (b) PL emission spectra (λex = 350 nm) of the as-formed and calcined CAOT and CAOU NPs. | |
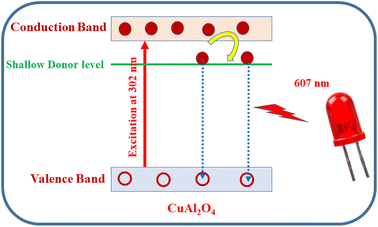 |
| | Fig. 10 Pictorial representation of the PL excitation and red emission of CuAl2O4 NPs. | |
Using the PL emission spectra, the chromaticity coordinates of CAOU and CAOT nanophosphors for luminous color are obtained from the Commission Internationale De L’Éclairage (CIE) 1931 colour space. The CIE coordinates (0.6514, 0.3443) and (0.6031, 0.3345) for CAOT and CAOU respectively fall in the red region (Fig. 11). The intensity of the redness is found to be greater for CAOT than CAOU. From the CIE coordinates, color correlated temperature was calculated to understand the technical applicability of the sample. The CCT value for both CAOT and CAOU was found to be less than 5000 K which is regarded as ‘warm light emission’ and meets the need of illuminating devices.
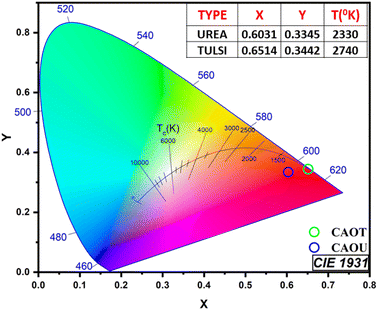 |
| | Fig. 11 CIE spectra of the as-formed and calcined CAOT and CAOU NPs. | |
IV. Summary
In the present work, for the first time, copper aluminate was successfully synthesized by using two different fuels/reducing agents. The effect of urea as a chemical fuel and tulsi extract as a green reducing agent on the structural, optical are discussed. The diffraction patterns confirm the cubic phase in both the samples, but the crystallite size was found to be smaller and the direct energy band gap was found to be higher for CAOT NPs. Green reducing agent helps in tuning the energy band gap of the synthesized NPs. The oxygen defects form a shallow donor level below the conduction band. The electrons present in the conduction band stay back in the shallow donor level and thereafter undergo recombination with holes present in the valence band. PL analysis, CIE and CCT coordinates confirm that the present synthesized CAOU and CAOT NPs could find an application in warm red light emitting diodes. But the intensity of red emission was found to be higher for CAOT than CAOU NPs.
Conflicts of interest
There is no conflicts to declare.
References
- I. Ganesh, A review on magnesium aluminate (MgAl2O4) spinel: synthesis, processing and applications, Int. Mater. Rev., 2013, 58, 63 CrossRef CAS.
- C. Doroftei and L. Leontie, Porous nanostructured gadolinium aluminate for high-sensitivity humidity sensors, Materials, 2021, 14, 7102 CrossRef CAS PubMed.
- T. Andrade, G. Santos, I. Oliveira and V. Pandolfelli, Synthesis optimization of calcium aluminate cement phases for biomedical applications, Mater. Res., 2015, 18, 382 CrossRef.
- P. Jisha, S. Prashantha and H. Nagabhushana, Luminescent properties of Tb doped gadolinium aluminate nanophosphors for display and forensic applications, J. Sci.: Adv. Mater. Devices, 2017, 2, 437 Search PubMed.
- M. K. Habibi, S. M. Rafiaei, A. Alhaji and M. Zare, ZnAl2O4: Ce3+ phosphors: study of crystal structure, microstructure, photoluminescence properties and efficient adsorption of Congo red dye, J. Mol. Struct., 2021, 1228, 129769 CrossRef CAS.
- G. Ertl, R. Hierl, H. Knözinger, N. Thiele and H. Urbach, XPS study of copper aluminate catalysts, Appl. Surf. Sci., 1980, 5, 49 CrossRef CAS.
- K. L. Scrivener, J.-L. Cabiron and R. Letourneux, High-performance concretes from calcium aluminate cements, Cem. Concr. Res., 1999, 29, 1215 CrossRef CAS.
- N. Bayal and P. Jeevanandam, Synthesis of metal aluminate nanoparticles by sol–gel method and studies on their reactivity, J. Alloys Compd., 2012, 516, 27 CrossRef CAS.
- T. Yamamoto, T. Tanaka, S. Suzuki, R. Kuma, K. Teramura, Y. Kou, T. Funabiki and S. Yoshida, NO reduction with Co in the presence of O2 over Cu/Al2O3 (3)–structural analysis of active species by means of XAFS and UV/Vis/NIR spectroscopy, Top. Catal., 2002, 18, 113 CrossRef CAS.
- I. Mindru, D. Gingasu, L. Patron, G. Marinescu, J. M. Calderon-Moreno, S. Preda, O. Oprea and S. Nita, Copper aluminate spinel by soft chemical routes, Ceram. Int., 2016, 42, 154 CrossRef CAS.
- E. C. Marques, R. M. Friedman and D. J. Dahm, The structure of copper aluminate: cation distribution at different temperatures and its implications for Cu/A12O3 catalysts, Appl. Catal., 1985, 19, 387 CrossRef CAS.
- M. A. Triana, E.-L. Hsiang, C. Zhang, Y. Dong and S.-T. Wu, Luminescent nanomaterials for energy-efficient display and healthcare, ACS Energy Lett., 2022, 7, 1001 CrossRef CAS.
- C. Moretti, X. Tao, L. Koehl and V. Koncar, Electrochromic textile displays for personal communication, in Smart textiles and their applications, Elsevier, 2016, pp. 539–568 Search PubMed.
- Y. T. Guo and Y. M. Huang, Green aluminate phosphors used for information display, in Key Engineering Materials, Trans Tech Publ., 2010, vol. 428, pp. 421–425 Search PubMed.
- K. Yokota, S.-X. Zhang, K. Kimura and A. Sakamoto, Eu2+-activated barium magnesium aluminate phosphor for plasma displays–phase relation and mechanism of thermal degradation, J. Lumin., 2001, 92, 223 CrossRef CAS.
- D.-S. Xing, K.-W. Cheah, P.-Y. Cheng, J. Xu, J.-X. Shi, H.-B. Liang and M.-L. Gong, A novel blue magnesium strontium aluminate-based phosphor for PDP application, Solid State Commun., 2005, 134, 809 CrossRef CAS.
- C. Ragupathi, J. J. Vijaya, L. J. Kennedy and M. Bououdina, Nanostructured copper aluminate spinels: Synthesis, structural, optical, magnetic, and catalytic properties, Mater. Sci. Semicond. Process., 2014, 24, 146 CrossRef CAS.
- V. Kirankumar and S. Sumathi, Structural, optical, magnetic and photocatalytic properties of bismuth doped copper aluminate nanoparticles, Mater. Chem. Phys., 2017, 197, 17 CrossRef CAS.
- W. Lv, Z. Luo, H. Yang, B. Liu, W. Weng and J. Liu, Effect of processing conditions on sonochemical synthesis of nanosized copper aluminate powders, Ultrason. Sonochem., 2010, 17, 344 CrossRef CAS PubMed.
- W. Lv, B. Liu, Q. Qiu, F. Wang, Z. Luo, P. Zhang and S. Wei, Synthesis, characterization and photocatalytic properties of spinel CuAl2O4 nanoparticles by a sonochemical method, J. Alloys Compd., 2009, 479, 480 CrossRef CAS.
- J.-u. Yang, J. H. Cho and M. J. Yoo, Selective metallization on copper aluminate composite via laser direct structuring technology, Composites, Part B, 2017, 110, 361 CrossRef CAS.
- V. Elakkiya, R. Abhishekram and S. Sumathi, Copper doped nickel aluminate: Synthesis, characterisation, optical and colour properties, Chin. J. Chem. Eng., 2019, 27, 2596 CrossRef CAS.
- P. Arunkumar, R. Aadhavan, S. Bhanuchandar and K. S. Babu, Effect of fuel ratio on combustion synthesis and properties of magnetic nanostructures, Mater. Res. Express, 2014, 1, 035011 CrossRef CAS.
- Y. Vidya, K. Anantharaju, H. Nagabhushana, S. Sharma, H. Nagaswarupa, S. Prashantha and C. Shivakumara, et al., Combustion synthesized tetragonal ZrO2: Eu3+ nanophosphors: structural and photoluminescence studies, Spectrochim. Acta, Part A, 2015, 135, 241 CrossRef CAS PubMed.
- I. Gosens, J. A. Post, L. J. de la Fonteyne, E. H. Jansen, J. W. Geus, F. R. Cassee and W. H. de Jong, Impact of agglomeration state of nano-and submicron sized gold particles on pulmonary inflammation, Part. Fibre Toxicol., 2010, 7, 37 CrossRef CAS PubMed.
- S. Tripathy and D. Bhattacharya, Rapid synthesis and characterization of mesoporous nanocrystalline MgAl2O4 via flash pyrolysis route, J. Asian Ceram. Soc., 2013, 1, 328 CrossRef.
- K. Waldner, R. Laine, S. Dhumrongvaraporn, S. Tayaniphan and R. Narayanan, Synthesis of a double alkoxide precursor to spinel (MgAl2O4) directly from Al(OH)3, MgO, and triethanolamine and its pyrolytic transformation to spinel, Chem. Mater., 1996, 8, 2850 CrossRef CAS.
- T. Hinklin and R. Laine, Synthesis of metastable phases in the magnesium spinel- alumina system, Chem. Mater., 2008, 20, 553 CrossRef CAS.
- L. Zhong and K. Yun, Graphene oxide-modified zno particles: synthesis, characterization, and antibacterial properties, Int. J. Nanomed., 2015, 10, 79 CAS.
- P. Chauhan and A. Kumar, Development of a microbial coating for cellulosic surface using aloe vera and silane, Carbohydr. Polym. Technol. Appl., 2020, 1, 100015 Search PubMed.
- P. Bhavani, A. Manikandan, P. Paulraj, A. Dinesh, M. Durka and S. A. Antony, Okra (abelmoschus esculentus) plant extract-assisted combustion synthesis and characterization studies of spinel ZnAl2O4 nano-catalysts, J. Nanosci. Nanotechnol., 2018, 18, 4072 CrossRef CAS PubMed.
|
| This journal is © The Royal Society of Chemistry 2023 |
Click here to see how this site uses Cookies. View our privacy policy here.  Open Access Article
 *a,
Y. S. Vidya
 *b,
R. Munirathnama,
K. N. Sridharc,
S. Manjunathad and
E. Krishnakantha
![[3 with combining macron]](https://www.rsc.org/images/entities/char_0033_0304.gif) m space group. The crystallite size, crystallinity and other structural parameters are discussed. The surface morphology of CAOU is agglomerated in nature whereas that of CAOT is hexagonal in shape. The smaller crystallite size CAOT NPs show a higher energy band gap. The photoluminescence (PL) analysis excited at 302 nm shows that the CIE coordinates fall in the red region. The oxygen defects are mainly responsible for the PL emission. The CCT coordinates confirm that both CAOU and CAOT NPs can find an application in warm light emitting diodes.
m space group. The crystallite size, crystallinity and other structural parameters are discussed. The surface morphology of CAOU is agglomerated in nature whereas that of CAOT is hexagonal in shape. The smaller crystallite size CAOT NPs show a higher energy band gap. The photoluminescence (PL) analysis excited at 302 nm shows that the CIE coordinates fall in the red region. The oxygen defects are mainly responsible for the PL emission. The CCT coordinates confirm that both CAOU and CAOT NPs can find an application in warm light emitting diodes.![[3 with combining macron]](https://www.rsc.org/images/entities/char_0033_0304.gif) m space group (JCPDS no. 78-0556). No other impurity related peaks are detected. The PXRD intensity of CAOT was found to be higher compared to CAOU. The reducing agent/fuel plays an important role in the stoichiometry, intensity, defect centers and size of the NPs.23 The crystallite size was estimated by using Scherrer's and W–H plot methods.24 The crystallite size of CAOU and that of CAOT was found to be 25 and 20 nm respectively. The green extract helps to tune the crystallite size of the NPs. The crystallinity of the sample was found to be improved in CAOT. The other structural parameters such as strain, dislocation density, and structural factor are determined and tabulated in Table 1. Similar to chemical fuel, the green extract which is ecofriendly helped in retaining the single cubic phase.
m space group (JCPDS no. 78-0556). No other impurity related peaks are detected. The PXRD intensity of CAOT was found to be higher compared to CAOU. The reducing agent/fuel plays an important role in the stoichiometry, intensity, defect centers and size of the NPs.23 The crystallite size was estimated by using Scherrer's and W–H plot methods.24 The crystallite size of CAOU and that of CAOT was found to be 25 and 20 nm respectively. The green extract helps to tune the crystallite size of the NPs. The crystallinity of the sample was found to be improved in CAOT. The other structural parameters such as strain, dislocation density, and structural factor are determined and tabulated in Table 1. Similar to chemical fuel, the green extract which is ecofriendly helped in retaining the single cubic phase.
![[3 with combining macron]](https://www.rsc.org/images/entities/char_0033_0304.gif) m
m![[thin space (1/6-em)]](https://www.rsc.org/images/entities/char_2009.gif)
![[thin space (1/6-em)]](https://www.rsc.org/images/entities/char_2009.gif)
![[thin space (1/6-em)]](https://www.rsc.org/images/entities/char_2009.gif)


![[double bond, length as m-dash]](https://www.rsc.org/images/entities/char_e001.gif) C vibrations
C vibrations


