 Open Access Article
Tumor-homing bacterium-adsorbed liposomes encapsulating perfluorohexane/doxorubicin enhance pulsed-focused ultrasound for tumor therapy†
Xia Ou,
Zhong Zhang,
Li Lin,
Yan Du,
Yu Tang,
Yaotai Wang and
Jianzhong Zou *
*
State Key Laboratory of Ultrasound in Medicine and Engineering, Chongqing Key Laboratory of Biomedical Engineering, College of Biomedical Engineering, Chongqing Medical University, Chongqing, 400016, People's Republic of China. E-mail: zoujzh@cqmu.edu.cn; Tel: +86-13708302390
First published on 23rd June 2023
Abstract
Objective: To make up for the insufficient ultrasound ablation of tumors, the energy output or synergist is increased but faces the big challenge of normal tissue damage. In this study, we report a tumor-homing bacterium, Bifidobacterium bifidum (B. bifidum), adsorbing liposomes that encapsulate perfluorohexane (PFH) and doxorubicin (DOX) to enhance the pulsed-focused ultrasound (PFUS) for tumor therapy, so as to improve the efficacy, safety and controllability of ultrasound treatment. Methods: The PFH and DOX co-loaded cationic liposomal nanoparticles (CL-PFH-DOX-NPs) were prepared for ultrasound (US) imaging, cell-killing, and B. bifidum adsorption for the reactive oxygen species (ROS) testing. The aggregation of B. bifidum and CL-PFH-DOX-NPs is called tumor-homing aggregation (B. bifidum@CL-PFH-DOX-NPs) in this study, and the synergistic effects of B. bifidum@CL-PFH-DOX-NPs were analyzed in vivo. Results: Comprehensive studies validated that CL-PFH-DOX-NPs can enhance US imaging and cell-killing and B. bifidum can promote ROS, and B. bifidum@CL-PFH-DOX-NPs achieve PFUS synergism in vivo. Importantly, active homing of B. bifidum facilitated the delivery and retention of CL-PFH-DOX-NPs in tumors, reducing dispersion in normal tissues, achieving the targeting ability of B. bifidum@CL-PFH-DOX-NPs. The best sonication time was chosen according to the distribution of CL-PFH-DOX-NPs in vivo to achieve efficient therapy. Especially, B. bifidum@CL-PFH-DOX-NPs amplified cavitation and the immune-boosting effects. Conclusion: Multifunctional B. bifidum@CL-PFH-DOX-NPs were successfully constructed with well targeting, which not only realized US imaging monitoring, strong cavitation and complementary killing during PFUS, but also achieved immunity enhancement after PFUS. The combination of PFUS, B. bifidum and CL-PFH-DOX-NPs provides a new idea for the potential application of ultrasound therapy in solid tumors.
1. Introduction
Focused ultrasound is widely used for ablating various solid tumors due to its noninvasive nature, which mainly transmits energy in the form of continuous waves, but its practical clinical application is limited by insufficient therapeutic effects.1 PFUS can disintegrate or liquefy tissues via strong acoustic cavitation, avoiding heat-related adverse effects.2,3 Especially, during PFUS exposure, the vascular permeability and endothelial cell space of tumor tissue increase, the extracellular matrix remodeling enhances the deep and targeted penetration of nanoparticles, while blood vessels gradually return to the pre-exposure state after exposure to prevent their extravasation, minimizing non-target tissue damage.4,5 It was also reported6–8 that PFUS sonication can enhance the overall anti-tumor immune response of the host. Clearly, PFUS has shown great advantages in treating solid tumors.However, PFUS alone has its limitations: sonication time may be extended to achieve intense mechanical power because of the needed low duty cycle,9 the effect of US monitor during therapy being not obvious always,2 and tumor residue that may occur in un-irradiated areas. Various kinds of synergistic substances are introduced to enhance ultrasonic energy deposition and shorten the sonication time with some effects.10–12 Unfortunately, the delivery of ultrasound energy and synergistic substances are hindered seriously due to the chaotic microvessels and non-specific microenvironment in most solid tumors, resulting in weak tumor-targeting, low synergistic efficiency, and high damage of non-target organs. Therefore, it is of great significance to study the combination strategy of PFUS and synergistic substance, which shows high efficiency, safety and controllability.
Bifidobacterium is a human probiotic with acidophilic and anaerobic properties, which can specifically be employed in various solid tumors at different depths. Some researchers have confirmed it as a biological carrier to improve the targeting efficiency of synergistic substances,13–15 which largely makes up for the deficiencies of previous nanoparticle delivery systems. PFH is capable of liquid–gas phase transition and is often used for enhancing imaging and improving the cavitation effect of ultrasound.16,17 DOX is one of the most widely studied and used adjuvant antitumor drugs in clinical practice,18 and has a broad-spectrum full-cycle inhibitory effect on tumor cells.19
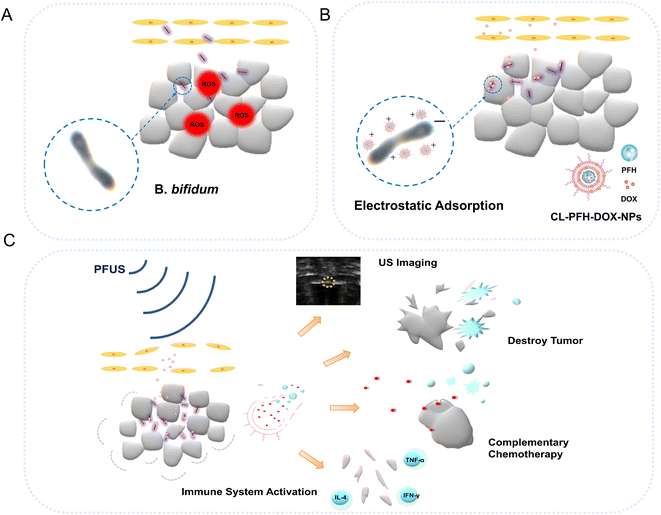
Based on the above-mentioned research findings, we propose a new strategy to comprehensively improve the efficacy of tumor treatment. A rationally designed PFUS-responsive positively charged nanoparticle was constructed by directly encapsulating PFH and DOX in liposomes to highlight the dual roles of US imaging and complementary therapy. As shown in Fig. 1A, negatively charged B. bifidum can home to and facilitate damage of tumors, and it is hypothesized that the CL-PFH-DOX-NPs can be continuously adsorbed onto tumors due to the electrostatic adsorption of B. bifidum and form B. bifidum@CL-PFH-DOX-NPs (Fig. 1B). It is expected that B. bifidum@CL-PFH-DOX-NPs enhance the quality of PFUS therapy notably for tumors (Fig. 1C), which will offer an innovative opportunity for tumor treatment.
1.1 B. bifidum, cells and animal models
The B. bifidum strain ATCC29521 obtained from US Type Culture Collection was anaerobically cultured in a Man–Rogosa–Sharpe (MRS) broth at 37 °C for 24 h until the logarithmic growth period and then centrifuged at 4 °C and 4000 rpm for 10 min. B. bifidum was suspended in cold, sterile phosphate-buffered saline (PBS, pH 7.4), and the concentration was adjusted to 106 CFU mL−1.Mouse breast cancer 4T1 cells (Shanghai Fuheng Biotechnology Co., Ltd.) were cultured in a Roswell Park Memorial Institute-1640 (RPMI-1640) medium containing 10% fetal bovine serum (FBS) and 1% penicillin/streptomycin at 37 °C in a humidified incubator with 5% CO2.
Each BALB/C mouse (female, 4–6 weeks old, about 20 g body weight) was subcutaneously injected with 4T1 tumor cells (1 × 10 6) suspended in 100 μL sterile PBS, as described previously.20 Each procedure was carried out in accordance with the guidelines of the Animal Care Institution of Chongqing Medical University. The mouse was sacrificed when the tumor volume was ≥2000 mm3, reaching the ethical endpoint of the experiment.
1.2 Preparation of cationic nanoparticles
DPPC, DC-CHOL, and DSPE-PEG (2000)-amine (Avanti Polar Lipids, Inc., Alabaster, AL, USA) were dissolved in 10 mL CHCl3 (Chuandong Chemical Group, Shanghai, China) (weight ratio of 6![[thin space (1/6-em)]](https://www.rsc.org/images/entities/char_2009.gif) :
:![[thin space (1/6-em)]](https://www.rsc.org/images/entities/char_2009.gif) 2
2![[thin space (1/6-em)]](https://www.rsc.org/images/entities/char_2009.gif) :
:![[thin space (1/6-em)]](https://www.rsc.org/images/entities/char_2009.gif) 2) and then evaporated under reduced pressure in a rotary evaporator at 50 °C. One hour later, 3 mL of deionized water was added to hydrate the lipid membrane. A mixture of 200 μL of PFH and 1.5 mL of DOX aqueous solution (1.0 mg mL−1) (Aladdin Co., Ltd., Shanghai, China) was sonicated with 100 W power for 2 min (2 s on and 2 s off) for the first homogeneous emulsification. Then, the PFH–DOX mixture was added into the lipid membrane emulsified with a power of 120 W for further 3 min (2 s on and 2 s off). The nanoparticles loaded with PFH and DOX were centrifuged (8000 rpm, 5 min) and washed to obtain the CL-PFH-DOX-NPs. The CL-PFH-NPs or CL-DOX-NPs were obtained by not adding DOX or PFH during the preparation process. The fluorescent nanoparticles were obtained by adding DiI (BioFrox, Co., Ltd., Germany) or DiR (Avanti Polar Lipids, Inc., Alabaster, AL, USA) to CHCl3.
2) and then evaporated under reduced pressure in a rotary evaporator at 50 °C. One hour later, 3 mL of deionized water was added to hydrate the lipid membrane. A mixture of 200 μL of PFH and 1.5 mL of DOX aqueous solution (1.0 mg mL−1) (Aladdin Co., Ltd., Shanghai, China) was sonicated with 100 W power for 2 min (2 s on and 2 s off) for the first homogeneous emulsification. Then, the PFH–DOX mixture was added into the lipid membrane emulsified with a power of 120 W for further 3 min (2 s on and 2 s off). The nanoparticles loaded with PFH and DOX were centrifuged (8000 rpm, 5 min) and washed to obtain the CL-PFH-DOX-NPs. The CL-PFH-NPs or CL-DOX-NPs were obtained by not adding DOX or PFH during the preparation process. The fluorescent nanoparticles were obtained by adding DiI (BioFrox, Co., Ltd., Germany) or DiR (Avanti Polar Lipids, Inc., Alabaster, AL, USA) to CHCl3.
1.3 Characterization of B. bifidum and CL-PFH-DOX-NPs
The B. bifidum were stained with Gram staining (G1060, Solarbio Co., Ltd., China), and observed using an optical microscope (CX22, Olympus, Tokyo, Japan). The internal and external morphology of the CL-PFH-DOX-NPs were evaluated by transmission electron microscopy (TEM) (7500, Hitachi, Co., Ltd., Tokyo, Japan), fluorescence microscopy (FM) (IX73, Olympus, Tokyo, Japan) and optical microscopy. The size distributions of B. bifidum and CL-PFH-DOX-NPs were measured using a DLS Nanometer (NanoDLS, Brookhaven, NY, USA). The B. bifidum size distribution lies in the center of two values, and the two values differed greatly, thus a rough range of length and diameter of B. bifidum was obtained. The concentration dependence curve of DOX in the CL-PFH-DOX-NPs was obtained at 485 nm absorption wavelength. The encapsulation efficiency (%) = (total DOX − unbound DOX)/total DOX. Loading efficiency (%) = (total DOX − unbound DOX)/total lipid nanoparticles.1.4 Ultrasound imaging and cell-killing of CL-PFH-DOX-NPs triggered by PFUS
PBS, DOX (1 mg mL−1), CL-DOX-NPs and CL-PFH-DOX-NPs (1 mg mL−1) (all 200 μL) were put separately into an agar gel phantom and sonicated using a JC200 focused ultrasound tumor therapeutic system (Chongqing Haifu Medical Technology Co., Ltd., China). Ultrasound imaging before and after sonication was performed in the bright mode (B mode) and contrast-enhanced ultrasound mode (CEUS mode) (Mylab 90 Esaote). The DFY software (Chongqing Academy of Medical Sciences) was used to measure the echo intensity (EI) within the region of interest (ROI). The parameters used in this study were an ultrasonic frequency of 1.0 MHz, a PRF of 100 Hz, a sonication time of 3 s, a duty cycle of 10% and a power of 120 W.The suspensions of 4T1 breast cancer cells were inoculated into 6-well plates at a density of 1 × 10⁴ cells per well and divided into group 1 (free DOX), group 2 (CL-PFH-DOX-NPs), group 3 (free DOX + PFUS), and group 4 (CL-PFH-DOX-NPs + PFUS). The medium in groups 1 and 3 was replaced by a medium containing free DOX (100 μg mL−1). The medium in groups 2 and 4 was replaced by a medium containing CL-PFH-DOX-NPs (100 μg mL−1). The cells in groups 3 and 4 were exposed to a low-power focused ultrasound instrument (Chongqing Ronghai Engineering Research Center of Ultrasound Medicine Co., Ltd. China). Ultrasonic waves were emitted from the surface of the transducer, at 5 W for 150 s with an ultrasonic frequency of 1.0 MHz, a focus area of 0.09 cm2, and pulse mode. The morphology of the cells was observed using a scanning electron microscope (SEM) (S-3400N Hitachi, Co., Ltd., Tokyo, Japan). The DOX fluorescence in cells was evaluated using a confocal laser scanning microscope (CLSM) (tCs-SP8 SR, Leica Microsystems, Wetzlar, Germany). Treated in the same way, the cell suspension after exposure in each group and 0.4% Trypan blue solution were mixed to stain the dead cells, counted using an optical microscope. Living cell rate (%) = (number of unstained cells/total number of cells) × 100%.
1.5 Adsorption between B. bifidum and CL-PFH-DOX-NPs in vitro
The electric potentials of B. bifidum, CL-PFH-NPs, CL-PFH-DOX-NPs and B. bifidum@CL-PFH-DOX-NPs were measured using a DLS nanometer, and the size of B. bifidum@CL-PFH-DOX-NPs was also measured. CL-PFH-NPs and CL-PFH-DOX-NPs labeled with DiI were diluted at 1 mg mL−1. B. bifidum labeled with FITC was added into the two groups at a CL-PFH-NPs/B. bifidum or CL-PFH-DOX-NPs/B. bifidum ratio of 1![[thin space (1/6-em)]](https://www.rsc.org/images/entities/char_2009.gif) :
:![[thin space (1/6-em)]](https://www.rsc.org/images/entities/char_2009.gif) 2 v:v. The adsorption effect was observed using a CLSM (A1R, Nikon Microsystems, Japan). Similarly, the adsorption efficiency was quantified by flow cytometry (FCM) (FACSVantage SE, BD Biosciences, Franklin Lake, NJ, USA), and B. bifidum were not stained this time.
2 v:v. The adsorption effect was observed using a CLSM (A1R, Nikon Microsystems, Japan). Similarly, the adsorption efficiency was quantified by flow cytometry (FCM) (FACSVantage SE, BD Biosciences, Franklin Lake, NJ, USA), and B. bifidum were not stained this time.
1.6 Homing of B. bifidum and its effect on tumor
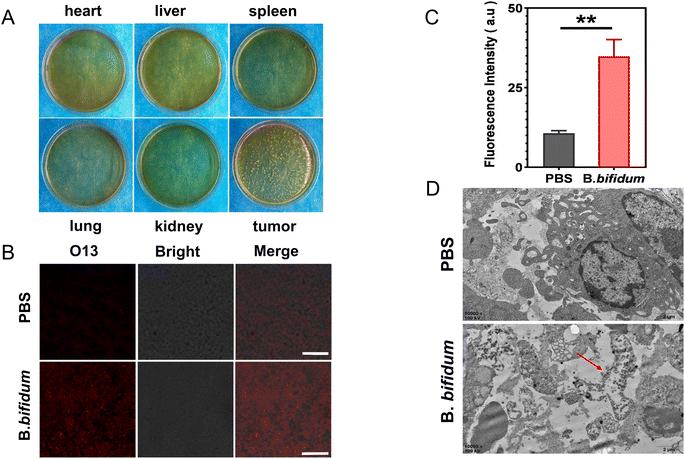
In short, three tumor-bearing mice were treated with 200 μL of PBS containing B. bifidum every 24 h via tail vein injection, three injections in total, and were sacrificed on day 7. Half of the tumor and major organs of each mouse were disinfected, and the tissues above were homogenized respectively, and then the homogenate was diluted with equal amounts of PBS. The homogenate supernatant of the above tissues was absorbed in an equal amount and coated on a LB solid medium in sterile Petri dishes respectively. Then, the dishes were sealed and incubated in a 37 °C incubator for 48 h before being taken out for observing the distribution of B. bifidum colony. About 1 mm3 of the tumor taken from the center of the remaining tumor was fixed in glutaraldehyde to make electron microscopic specimens. The remaining tumor was immediately frozen and made into ultra-thin sections. The generation of reactive oxygen species (ROS) in the tumor was evaluated by the specific reaction of O13 (BestBio Co., Ltd., Shanghai, China) with ROS. The same methods were used to evaluate tissue morphological changes and ROS production in the tumor of the control group (mice injected with the same amount of PBS).1.7 Homing of CL-PFH-DOX-NPs adsorbed by B. bifidum in vivo
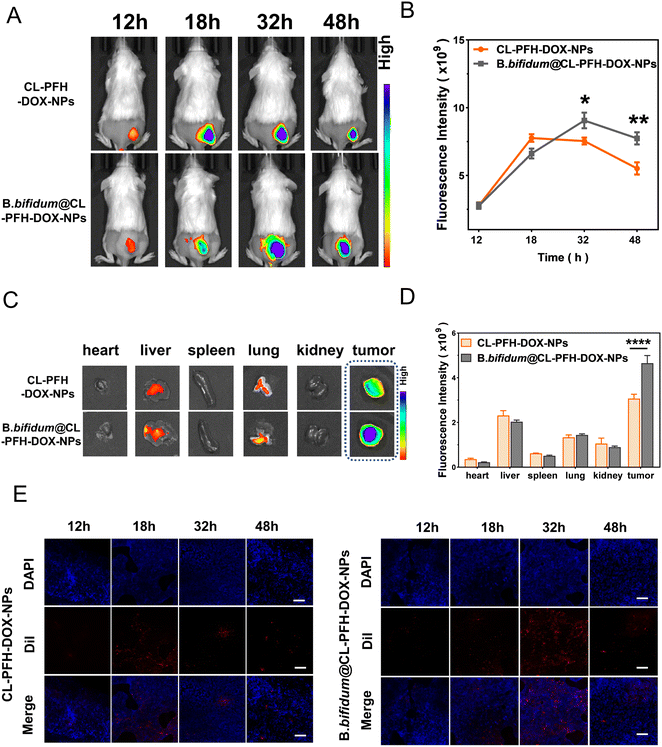
The tumor-bearing mice were randomly divided into CL-PFH-DOX-NPs group and B. bifidum@CL-PFH-DOX-NPs group (three mice/group) and treated with 200 μL of PBS or B. bifidum suspension every 24 h, three times in total, via tail vein injection. On day 7, all mice were injected again with 200 μL of DiR-labeled CL-PFH-DOX-NPs (1 mg mL−1) intravenously. Images of each mouse in both groups were acquired using a LB983 imaging system (Berthold Technologies GmbH & Co. KG, Germany) at predetermined time intervals (12, 18, 32, and 48 h) for quantifying the fluorescence intensity at the tumor site. The tumor and major organs were harvested at 48 h. Similarly, 24 tumor-bearing mice were randomly divided and treated following the above-mentioned procedure, and CL-PFH-DOX-NPs (1 mg mL−1) were labeled with DiI this time. At each corresponding time point, three mice randomly selected from each group were sacrificed, and the tumors were harvested to make ultra-thin sections and stained with DAPI (Beyotime Biotechnology Ltd. Co., China).1.8 PFUS sonication in vivo
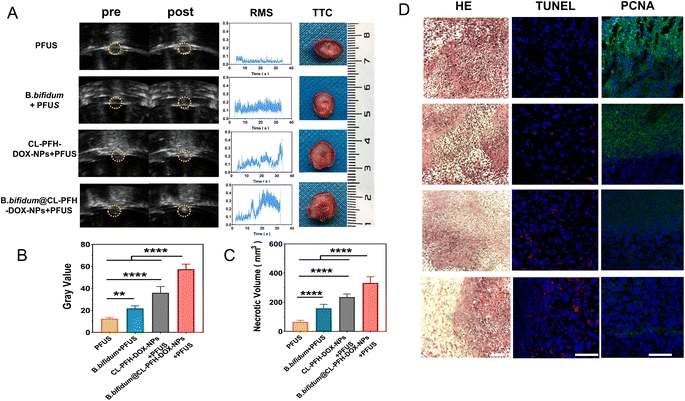
Tumor-bearing mice were randomly allocated to four groups (five mice/group): (1) PFUS, (2) B. bifidum + PFUS, (3) CL-PFH-DOX-NPs + PFUS, and (4) B. bifidum@CL-PFH-DOX-NPs + PFUS. The mice in the PFUS and CL-PFH-DOX-NPs + PFUS groups were treated with 200 μL of PBS every 24 h via tail vein injection, while the mice in the B. bifidum + PFUS and B. bifidum@CL-PFH-DOX-NPs + PFUS groups were treated with 200 μL of B. bifidum suspension, three times in total. On day 7, the mice in group PFUS and B. bifidum + PFUS were injected intravenously again with 200 μL of PBS, while the mice in CL-PFH-DOX-NPs + PFUS and B. bifidum@CL-PFH-DOX-NPs + PFUS groups were injected with 200 μL of CL-PFH-DOX-NPs (1 mg mL−1). After injection, PFUS was performed (ultrasonic frequency = 1.0 MHz, PRF = 100 Hz, duty cycle = 10%, sonication time = 30 s, and power = 120 W). The gray change and real-time broadband noise root mean square (RMS) information were recorded using an ultrasound monitor and a passive cavitation detection (PCD) system respectively. Then, mice were sacrificed, and half of the tumors were stained with 2,3,5-triphenyltetrazolium chloride (TTC) to determine the necrosis volume and energy efficiency factor (EEF). The other half one was used for hematoxylin–eosin (HE) staining, terminal deoxynucleotide transferase-mediated end-incision labeling (TUNEL) and antibody against proliferating cell nuclear antigen (anti-PCNA) assay. The major organs of the B. bifidum@CL-PFH-DOX-NPs + PFUS group were retained. Volume (mm3) = (π/6) × length × width × depth. EEF (J mm−3) = ηPt/V, where η refers to the focusing coefficient of the transducer (in this instrument η was set as 0.7), P (W) is the total acoustic power, and t (s) is the actual treatment time.1.9 Late effect on tumor inhibition in growth and metastasis
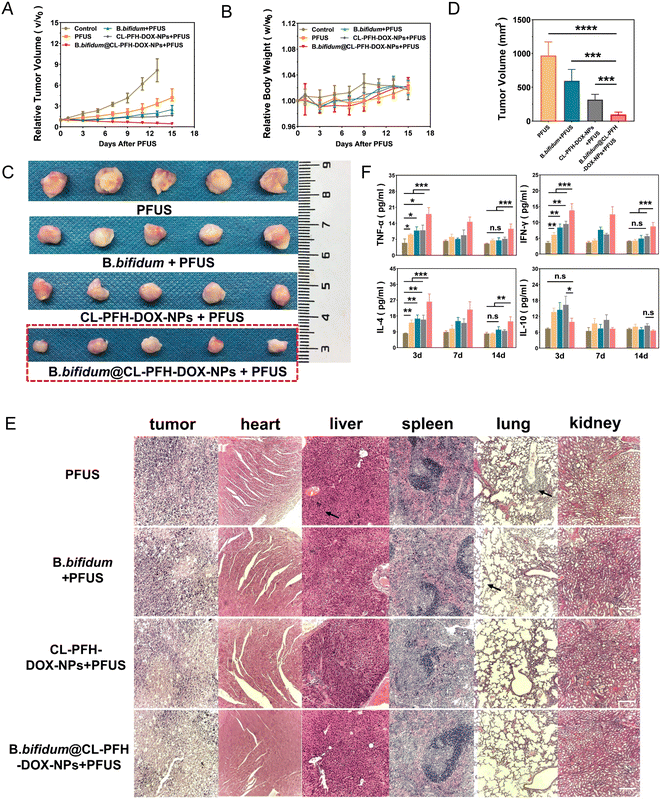
Tumor-bearing mice were randomly allocated to five groups (five mice/group): (1) control, (2) PFUS, (3) B. bifidum + PFUS, (4) CL-PFH-DOX-NPs + PFUS, (5) B. bifidum@CL-PFH-DOX-NPs + PFUS. The mice in the control group were subjected to no treatment, while the mice in other groups were treated as described in Clause 1.8. The tumor sizes and mice weights were recorded. On day 15, the tumors and major organs were stained with HE for pathological observation. The relative tumor volume (RTV) or relative body weight (RBW) was normalized, and RTV or RBW was treated one/initial one. Similarly, 45 tumor-bearing mice were randomly divided into the above-mentioned five groups with the same treatment methods. Blood samples were collected from three randomly sampled mice in each group on day 3, 7 and 14 after sonication, which were centrifuged at 4 °C to obtain the serum. The concentrations of immune cytokines were quantitatively determined using a cytokine combination test reagent (Jiangxi Sygi, China) according to immunofluorescence, including tumor necrosis factor α (TNF-α), interferon γ (IFN-γ), interleukin 4 (IL-4) and interleukin 10 (IL-10).1.10 Safety evaluation
Hemolysis test was used to evaluate the biocompatibility of CL-PFH-DOX-NPs in vitro. Blood samples were detected to assay the biosafety of B. bifidum@CL-PFH-DOX-NPs in vivo after injecting on day 3, 7 and 14, including complete blood count and markers of liver and kidney functions. The major organs of the mice in the B. bifidum@CL-PFH-DOX-NPs group and of untreated mice controls were stained with HE to determine the safety during PFUS.1.11 Statistical analysis
All data were performed using GraphPad Prism version 8.0. Continuous data were expressed as mean ± standard deviation (SD). Student's t-test and one-way analysis of variance were used for data analysis. P < 0.05 was considered statistically significant (n.s. no significance, *P < 0.05, **P < 0.01, ***P < 0.001, ****P < 0.0001).1.12 Ethics approval
This study was carried out in accordance with the principles of the Basel Declaration and recommendations of the Animal Ethics Committee of Chongqing Medical University (approval # 2022097).2. Results
2.1 Characterization of B. bifidum and CL-PFH-DOX-NPs
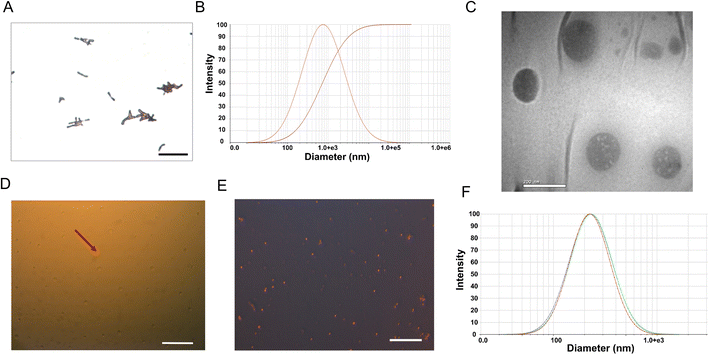
B. bifidum appeared as short rods, with a few of them having a small bifurcation at one end in a “Y” shape (Fig. 2A), of about 1.5–2.0 μm length (Fig. S1†) and 0.5–0.7 μm diameter (Fig. 2B). CL-PFH-DOX-NPs displayed spherical shape containing small transparent vacuoles (Fig. 2C) and could expand into large bubbles because of PFH phase transition (Fig. 2D) and showed red fluorescence due to DOX (Fig. 2E), indicating that the PFH and DOX were encapsulated in the lipid nanoparticles successfully. The mean diameter was 227.9 ± 3.4 nm (Fig. 2F). According to the standard curve of DOX (Fig. S2†), the encapsulation efficiency and loading efficiency of DOX in CL-PFH-DOX-NP were 73.46% and 9.02%, respectively.2.2 Ultrasound imaging and cell-killing of CL-PFH-DOX-NPs triggered by PFUS
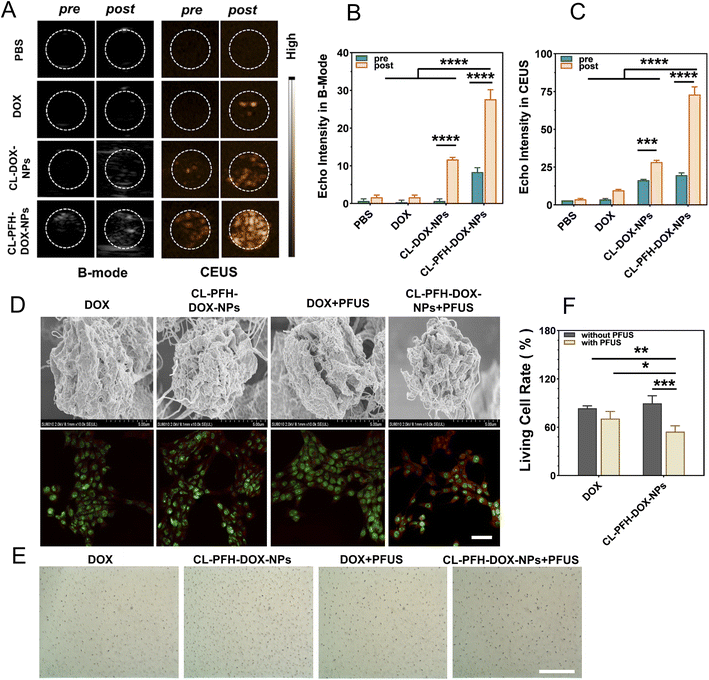
In order to determine the targeting and killing efficiency of CL-PFH-DOX-NPs in actual cancer cells, the CL-PFH-DOX-NPs and PFUS were used in breast cancer cells. At first, different kinds of solution were irradiated with PFUS and imaged with ultrasound. The ultrasound imaging of the CL-DOX-NPs and CL-PFH-DOX-NPs groups changed remarkably compared with the other groups (Fig. 3A). Especially, the EI in the B and CEUS mode of the CL-PFH-DOX-NPs groups increased to 27.6 ± 0.6 and 73.0 ± 5.0 respectively after sonication, corresponding to about 3.4-fold and 3.7-fold of the pre-sonication level (all P < 0.0001). In contrast to other groups, the EI of the CL-PFH-DOX-NPs group was over several, even ten folds higher after sonication (Fig. 3B and C), indicating that nanoparticles (NPs) can be used for ultrasound imaging and effectively monitored in the B and CEUS mode, and the phase transition of PFH further strengthen the imaging capability of CL-PFH-DOX-NPs.Then, to observe the interaction between CL-PFH-DOX-NPs and cancer cells exposed to PFUS, morphological appearances of cells and DOX fluorescence in cells were evaluated by SEM and CLSM. As shown in Fig. 3D, “holes” and even “furrows” appeared on the surface of cells in the CL-PFH-DOX-NPs + PFUS group, and intracellular red fluorescence was mainly distributed in the cytoplasm and much more in cells of the CL-PFH-DOX-NPs + PFUS group, indicating that an enhanced number of DOX was endocytosed by cancer cells, which may be because of “acoustic pores” caused by CL-PFH-DOX-NPs exposed to PFUS. The cell viability was assessed by the Trypan blue test, and damaged cells were blue (Fig. 3E). The cell viability rates of the CL-PFH-DOX-NPs group and the CL-PFH-DOX-NPs + PFUS group were 90.3% and 54.6% respectively, which corresponded to the highest and lowest rates in the experiment, and the rate of DOX group or DOX + PFUS group was both higher than that of the CL-PFH-DOX-NPs + PFUS group (Fig. 3F). The results indicated that cell killing was avoided when DOX was in the CL-PFH-DOX-NPs, while the toxic effect of DOX in the CL-PFH-DOX-NPs on cells was enhanced because of PFUS sonication.
2.3 Adsorption between B. bifidum and CL-PFH-DOX-NPs in vitro
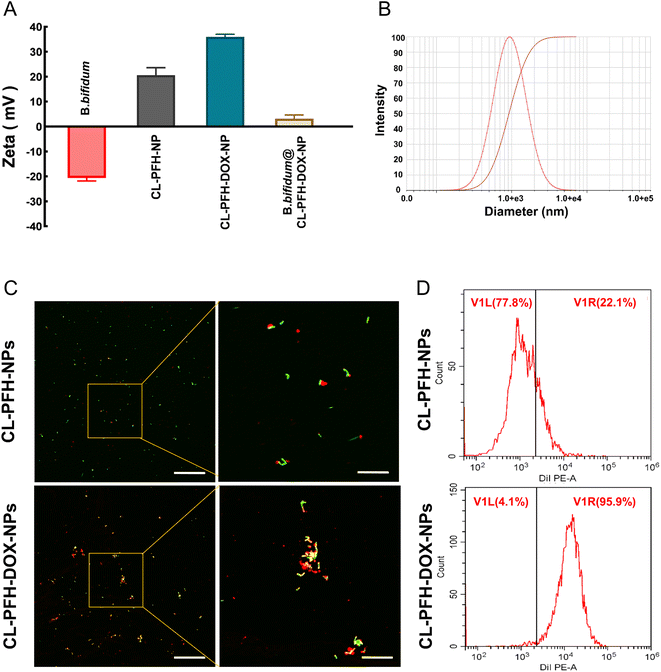
The zeta potential of B. bifidum, CL-PFH-NPs, CL-PFH-DOX-NPs and B. bifidum@CL-PFH-DOX-NPs is shown in Table 1 and Fig. 4A. The surface of B. bifidum was negatively charged, and CL-PFH-NPs, CL-PFH-DOX-NPs and B. bifidum@CL-PFH-DOX-NPs were positively charged. The value of CL-PFH-DOX-NPs was statistically higher than that of CL-PFH-NPs. B. bifidum@CL-PFH-DOX-NPs was about 1.5–2.2 μm in length (Fig. S3†) and 0.6–0.9 μm in diameter (Fig. 4B). The electrostatic adsorption between NPs and B. bifidum was assessed. CLSM (Fig. 4C) indicated that the DiI-labeled NPs exhibited red fluorescence, and the FITC-labeled B. bifidum presented green fluorescence. Not only more red fluorescence signal could be observed on the surface mixed with CL-PFH-DOX-NPs than on those mixed with CL-PFH-NPs, but also orange fluorescence could be seen owing to the close overlap and agglomeration of CL-PFH-DOX-NPs and B. bifidum. FCM (Fig. 4D) showed that the adsorption rate between CL-PFH-DOX-NPs and B. bifidum was higher than that between CL-PFH-NPs and B. bifidum, confirming that it was feasible and successful to aggregate B. bifidum and CL-PFH-DOX-NPs in vitro by electrostatic adsorption, and the adsorption effect was good.2.4 Homing of B. bifidum and effect on tumor
The distribution of B. bifidum in vivo was explored by sampling and homogenizing tissues ex vivo and incubating homogenate containing B. bifidum in vitro. A number of B. bifidum was found on the LB solid medium of the tumor tissue on day 7, whereas almost no B. bifidum was detected in other tissues, indicating that B. bifidum actively homed to the tumor and proliferated finally (Fig. 5A). In order to determine whether B. bifidum can produce ROS and has an effect on tumor tissues, we performed O13 specific reactions and observed the ultrastructural changes of tumor. Compared with the tumor tissues injected with B. bifidum, the O13 red fluorescence was brighter than that injected with the PBS one (Fig. 5B), and the ROS level was several times higher than the latter (P = 0.0014) (Fig. 5C). TEM (Fig. 5D) showed that the tumor cells in the PBS group were thriving, whereas the peripheral villi disappeared, the lipid droplet structure in the cytoplasm increased significantly, and chromatin margination was observed around B. bifidum. Therefore, these results indicated that B. bifidum can change the tumor microenvironment and may damage tumor cells.2.5 Homing of CL-PFH-DOX-NPs adsorbed by B. bifidum in vivo
Then, the in vitro adsorption results were confirmed in vivo. As depicted in Fig. 6A, the fluorescence signal could be seen in the tumors of the CL-PFH-DOX-NPs and B. bifidum@CL-PFH-DOX-NPs groups during the observation period, and more fluorescence signal could be observed in latter one at 48 h. The latter peaked at 32 h and was later than that of the former at 18 h, which was 1.2-fold that of the former one (Fig. 6B). Fluorescence imaging and fluorescence intensity analysis ex vivo at 48 h (Fig. 6C and D) confirmed again that the fluorescence signal of tumors in the B. bifidum@CL-PFH-DOX-NPs group was significantly higher than that of the CL-PFH-DOX-NPs group, those of tumors in both groups were still higher than that in other organs, and only very few CL-PFH-DOX-NPs were accumulated in the liver and lungs. Compared with the ultra-thin section from the CL-PFH-DOX-NPs group (Fig. 6E), those in the B. bifidum@CL-PFH-DOX-NPs group exhibited an extensive, uniform dispersion of red fluorescence throughout the entire view and peaked at 32 h, in agreement with the fluorescence imaging results in vivo. Hence, the B. bifidum facilitated the homing and retention of CL-PFH-DOX-NPs in tumor, forming the B. bifidum@CL-PFH-DOX-NPs in vivo.2.6 PFUS sonication in vivo
PFUS sonication time was chosen at 32 h after injecting CL-PFH-DOX-NPs for the maximum concentration of NPs observed in the tumor. Grayscale change and RMS recorded the PFUS process, while TTC reflected the ablation effect of PFUS. Grayscale change increased gradually to varying degrees during PFUS in all groups (Fig. 7A); however, the gray value in the B. bifidum@CL-PFH-DOX-NPs + PFUS group was the highest, and inferior one was the group of CL-PFH-DOX-NPs + PFUS (Fig. 7B). The RMS value in the CL-PFH-DOX-NPs + PFUS group and the B. bifidum@CL-PFH-DOX-NPs + PFUS group were maintained at a high level compared with the PFUS group (Fig. 7A). Meanwhile, the TTC results showed that (Fig. 7A) the active tissue surrounding was stained red, and the boundaries were easily observed between the necrotic tissue and the active tissue. Necrotic tissues with variable translucence and opalescence were characteristic of ischemic and coagulative necrosis, and pink chyle and cavity in the middle was typical of liquefaction necrosis. Further comparison (Fig. 7C) showed that the necrosis volume of the B. bifidum@CL-PFH-DOX-NPs + PFUS group was larger than that of the other three groups, and the one of the CL-PFH-DOX-NPs + PFUS group was larger than that of the PFUS group. The EEF of the B. bifidum@CL-PFH-DOX-NPs + PFUS group decreased significantly, almost one-sixth that of the PFUS group (Fig. S4†). The EEF is the ablated volume in function to the ultrasound power.21 The above-mentioned results revealed that groups containing the CL-PFH-DOX-NPs can achieve enhanced US imaging and necrotic volume. That is to say, the CL-PFH-DOX-NPs combined with PFUS could reduce the duration of treatment with more accurate monitoring compared to PFUS alone. Moreover, B. bifidum promoted the synergistic effects of CL-PFH-DOX-NPs on tumor further during PFUS.Next, to observe the subtle changes in tumors, morphology and immunohistochemistry markers in tumors of each group were evaluated (Fig. 7D). The characteristics of different degrees of thermal ablation and mechanical ablation could be observed by light microscopy in all groups, whereas the tumor tissue in the B. bifidum@CL-PFH-DOX-NPs + PFUS group was more seriously damaged and characterized by obvious liquefaction, and a large number of red blood cells were found to overflow from the blood vessels. The apoptosis of tumor tissues after different treatments was assayed by the TUNEL staining, and the results indicated that compared with other groups, more apoptotic bodies labeled with red probes were observed in the B. bifidum@CL-PFH-DOX-NPs + PFUS group, while the one in the PFUS group was the fewest. Especially, the more severe the nucleus was destructed, the more apoptotic bodies were seen around the nucleus. Cell proliferation detection was performed to investigate the precision and controllability of tumor ablation. Although dividing lines with different extents were detected between the necrotic site and the non-necrotic site in each group, the boundary of the B. bifidum@CL-PFH-DOX-NPs + PFUS group was clear, and almost no green fluorescence was displayed in the necrotic site.
2.7 Late effects on tumor inhibition in growth and metastasis
The efficacy and quality of continuous improvement are important for clinical cure. Therefore, it is necessary to assess the changes in tumors and the immunity in body after corresponding treatment. Varying degrees of increase in RTV were observed in all groups except the B. bifidum@CL-PFH-DOX-NPs + PFUS group, which was decreased (Fig. 8A). Furthermore, the influence on the body weight was negligible (Fig. 8B). The tumor volumes of the B. bifidum@CL-PFH-DOX-NPs + PFUS group were measured and analyzed on day 15 (Fig. 8C and D), which were also confirmed to be decreased compared with other groups. However, obvious metastases were found in organs in the PFUS and B. bifidum + PFUS groups, and only CL-PFH-DOX-NPs + PFUS and B. bifidum@CL-PFH-DOX-NPs + PFUS groups showed no abnormalities in the morphology of organ tissues (Fig. 8E).We focused on cytokines secreted by T helper type 1 cells including TNF-α and IFN-γ and interleukin secreted by T helper type 2 cells including IL-4 and IL-10, which are important in the cellular immunity system and humoral immunity respectively. As shown in Fig. 8F, all indexes of the experimental groups were at their peak on day 3 and then gradually decreased over time, but little change was observed in the control group. The concentrations of TNF-α, IFN-γ and IL-4 in the serum of B. bifidum@CL-PFH-DOX-NPs + PFUS group were always significantly higher than those of the other four groups. The concentrations of TNF-α, IFN-γ and IL-4 of group PFUS, B. bifidum + PFUS and CL-PFH-DOX-NPs + PFUS were higher than that of the control group on day 3, but there were no differences between them on day 14. The concentrations of IL-10 of B. bifidum@CL-PFH-DOX-NPs + PFUS group were lower than the one of CL-PFH-DOX-NPs + PFUS group, but no significant difference was found compared to the control group at first, and there was no conspicuous difference between each group finally.
2.8 Safety evaluation
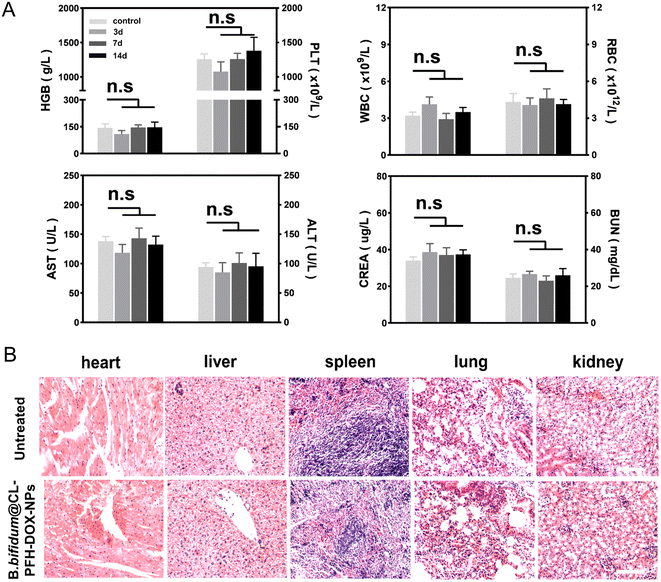
To evaluate the biosafety of CL-PFH-DOX-NPs and the B. bifidum@CL-PFH-DOX-NPs, the hemolysis ratio of mice erythrocyte and the blood indexes of mice were tested in vitro and in vivo respectively. The results indicated the CL-PFH-DOX-NPs did not induce obvious hemolysis in the range of experimental concentrations, which provided safe confidence for testing in vivo (Fig. S5†). The blood indexes after injecting B. bifidum@CL-PFH-DOX-NPs were similar to the control group during observation time, indicating good biosafety and no detectable toxicity to mice in the study (Fig. 9A). Further, no obvious structural damage was observed in major organs of the mice in the B. bifidum@CL-PFH-DOX-NPs group compared with the untreated mice after PFUS, suggesting the favorable therapeutic safety of the combination therapy (Fig. 9B).3. Discussion
In this study, we developed a new strategy for the combination of PFUS and B. bifidum@CL-PFH-DOX-NPs in tumor therapy based on the strong mechanical destructive effect of PFUS and the tumor-homing of B. bifidum. The experimental results indicated the effectiveness of this method in killing and inhibiting tumors while leaving non-tumor tissues mostly unaffected.The lipid membrane of CL-PFH-DOX-NPs and CL-PFH-NPs both contained DC-CHOL, which imparts positive charge to the surface.15 The DOX molecule encapsulated also had a positive charge, resulting in enhanced amphiphilicity, internal stability and electro-positivity.22 Therefore, these NPs can target negatively charged structures or organism, B. bifidum for example. The method minimizes the modification of B. bifidum or nanoparticles, preserving the original characteristics of B. bifidum and the stability of nanoparticles to the greatest extent. Although both CL-PFH-DOX-NPs and CL-PFH-NPs had electrostatic adsorption potentials, the value of CL-PFH-DOX-NPs was significantly higher than that of CL-PFH-NPs, indicating a stronger adsorption force than that of the CL-PFH-NPs. Due to the agglomeration of CL-PFH-DOX-NPs on the surface of B. bifidum, the synergistic interaction between particles can increase the subsequent adhesion of particles.23 The excellent adsorption effects between B. bifidum and CL-PFH-DOX-NPs lay a base for B. bifidum@CL-PFH-DOX-NPs in vivo. In vitro experiments exhibited that CL-PFH-DOX-NPs irradiated by PFUS can be detected by US and decrease the viability of tumor cells remarkably. The advantages of US imaging and complementary therapy of B. bifidum@CL-PFH-DOX-NPs can be highlighted because of the CL-PFH-DOX-NPs.
B. bifidum in this study was about 0.5–0.7 μm in width, while B. bifidum@CL-PFH-DOX-NPs about 0.6–0.9 μm in width. To minimize the difficulty of entering the tumor because of the increased size, B. bifidum and CL-PFH-DOX-NPs were delivered separately. The diameter of tumor vessels was 1.2 to 2.0 μm, and even the vascular endothelial space was up to 20 μm.24 Therefore, B. bifidum can freely pass through the abnormal vascular system of tumors. A hypoxic microenvironment in solid tumors has become a target in tumor therapy, and also provides a good space for the survival and reproduction of anaerobic bacteria.25 The abnormal high pressure in the tumor tissue gap prevents immune components from entering the tumor, forming an immune defense vacuum, which provides protection for bacteria.26 Additionally, a large number of intermediates produced by vigorous metabolism of tumor also become favorable conditions for the growth of anaerobic bacteria.27 Given the above-mentioned mechanisms and the inherent biocompatibility of Bifidobacterium,28 B. bifidum can home and clone within the hypoxic microenvironment of tumors. B. bifidum activated ROS during proliferating, which can alleviate certain cancers and promote tumor apoptosis and death, and accelerate autophagy through different pathways.16,24,29 The morphological changes of tumor cells under an electron microscope might be direct evidence. The adsorption of B. bifidum and classic enhanced permeability and retention (EPR) effect endowed CL-PFH-DOX-NPs with high affinity for the tumor, offering a foundation for the self-aggregation of B. bifidum and CL-PFH-DOX-NPs within the tumor. The continuous attraction of B. bifidum reduced the probability of CL-PFH-DOX-NP being cleared from the reticuloendothelial system (RES) in blood circulation or being retained in normal tissues, decreasing the damage risk of normal tissues and providing experimental basis for PFUS therapy in vivo.
The intuitive and quantitative results provided by TTC staining and necrotic volume confirmed that B. bifidum@CL-PFH-DOX-NPs significantly improve the treatment efficiency, which can be attributed to the following factors. At first, homing and cloning of B. bifidum changed the internal microenvironment of tumors, facilitating ultrasound's energy deposition.14 Second, the passive homing of CL-PFH-DOX-NPs suddenly increased the number of cavitation nuclei in the targeted tissues. Third, CL-PFH-DOX-NPs phagocytosis was promoted in the internal environment of tumors and underwent phase transformation during PFUS. The process was reflected by the significant rise of the RMS value and gray changes, indicating a strong transient cavitation effect in tumors. Those conditions were triggered simultaneously, causing severe destruction in the center of the tumor where the therapy would have maximum activity against the tumor and minimum side effects to normal tissues around, which was certified by the HE, TUNEL and PCNA results.
The HE staining results indicated that the tumor tissue in the B. bifidum@CL-PFH-DOX-NPs + PFUS group had more severe damage, including nuclear fragmentation, dissolution, liquefaction, and vacuolization in the cytoplasm, even complete disappearance of cell structure, which was similar to the results by Wang et al.2 The apoptosis phenomenon was also notable in the B. bifidum@CL-PFH-DOX-NPs + PFUS group compared with controls, suggesting a higher tumor-killing effect than that of B. bifidum combined with PFUS or CL-PFH-DOX-NPs combined with PFUS. Interestingly, many studies confirmed that Bifidobacterium exerts its antitumor effects by inhibiting proliferation and inducing apoptosis to tumor cells without damaging normal cells30–32 and can even enhance the apoptosis effect of chemical drugs,33 supporting the present study. Furthermore, the least proliferation was observed in the B. bifidum@CL-PFH-DOX-NPs + PFUS group, revealing that this method can not only accurately ablate tumors but also effectively inhibit tumor proliferation in situ. A growing body evidence suggested that B. bifidum@CL-PFH-DOX-NPs were potential multifunctional synergists.
To study the late effects of this method on tumor inhibition in growth and metastasis, the changes of tumor were observed in a period. Surprisingly, only tumor in the B. bifidum@CL-PFH-DOX-NPs + PFUS group decreased at last and HE staining revealed that major organs in the CL-PFH-DOX-NPs + PFUS and B. bifidum@CL-PFH-DOX-NPs + PFUS groups showed no signs of metastasis. In other words, the immunity induced by PFUS alone or in combination with B. bifidum was insufficient to inhibit the escape or regeneration of 4T1 tumor cells. Although it was reported that the fragments, extracts, and extracellular polysaccharides (EPS) produced by Bifidobacterium could have beneficial pleiotropic effects on the immune system, including anti-proliferative and immunomodulatory activities against tumors,34,35 our study showed that B. bifidum can facilitate the injuring of tumor cells but the benefit was limited in this experiment. The 4T1 breast cancer is a kind of “cold tumor” closest to human triple-negative breast cancer (TNBC) with easy metastasis and lacking targeted therapy at present, despite the tiny metastases detected in distant tissues. Migration and invasion of cancer cells are the main cause of host death. Therefore, it is indispensable to inhibit the metastasis of cancer cells to improve clinical prognosis. DOX, an anthracycline chemotherapy drug commonly used in clinical settings, not only directly kills cancer cells but also turns the immunosuppressed “cold tumor” into the immunoreactive “hot tumor” by activating the immune system to release immune-related molecules, regulating and enhancing the infiltration of immune cells into the tumor to reshape the microenvironment, thereby improving the antitumor immune response to achieve the inhibition of tumor metastasis and recurrence.36–38 At the same time, compared with chemotherapy alone, thermo-chemotherapy can significantly improve the efficacy by enhancing local blood circulation.39,40 Thus, the thermal effect of PFUS amplified the antitumor effect of DOX. In agreement with the above-mentioned views, the study suggested that DOX encapsulated in CL-PFH-DOX-NP might play a key role in inhibiting the metastasis of 4T1 cells.
However, the tumors in the CL-PFH-DOX-NPs + PFUS group have grown and the concentrations of IFN-γ, TNF-α, and IL-4 failed to show any conspicuous increase at last, which indicated that the non-targeted retention of CL-PFH-DOX-NPs in normal tissues may cause damage to the immune system. At the same time, the concentrations of IFN-γ, TNF-α, and IL-4 sustained high levels in the B. bifidum@CL-PFH-DOX-NPs + PFUS group, and the growth of IL-10 was inhibited in the B. bifidum@CL-PFH-DOX-NPs + PFUS group at first compared to the group of CL-PFH-DOX-NPs + PFUS (IL-10 had been demonstrated to accelerate tumor growth),41 indicating that not only more CL-PFH-DOX-NPs can be retained in the tumor of the B. bifidum@CL-PFH-DOX-NPs + PFUS group due to the adsorption of B. bifidum, and the adverse effect of the few residual CL-PFH-DOX-NPs can also be improved because of B. bifidum. The findings proved42–44 that live or killed B. bifidum can effectively inhibit the progress of different tumors. Oral intake of pretreated B. bifidum resulted in the extended survival of 4T1 tumor-bearing mice and inhibited severe weight loss due to its potential in stimulating differentiation, adjusting cell cycle and up-adjusting the pro-apoptotic pathways in cancer cells.42 Intravenous administration of B. bifidum into tumor-bearing mice led to the activation of tumor-specific IL-12, IFN-γ and CD8+ cytolytic responses that control and eradicate tumor growth.44 Moreover, B. bifidum also reduced tumor burden synergistically with oxaliplatin or PD-1 by potentiating the production of IFN-γ, enhancing the biosynthesis of immune-stimulating molecules and metabolites.45 The above-mentioned results probably explain the best anti-tumor effect in the B. bifidum@CL-PFH-DOX-NPs + PFUS group, showing the amplified advantages of B. bifidum and DOX on anti-tumor and decreased side-effects of DOX on the immune system. Importantly, no notable weight loss or signs of biological-risk were observed in the mice of the B. bifidum@CL-PFH-DOX-NPs + PFUS group.
In conclusion, we demonstrated the cooperative characteristics of PFUS and B. bifidum@CL-PFH-DOX-NPs for the first time. The combination maximized the tumor-killing effect with high prognostic quality, mainly via enhanced tumor-targeted effects, boosted cavitation effects, improved chemotherapy, and increased anti-tumor activity, eventually reducing the tumor volume and inhibiting distant metastasis. This is exciting and has important implications for improving clinical oncology. Nevertheless, the specific synergy mechanisms among PFUS, B. bifidum, and CL-PFH-DOX-NPs need to be studied further.
Author contributions
Xia Ou: conceptualization, methodology, and writing – original draft preparation. Zhong Zhang: data curation and software. Li Lin: visualization and investigation. Yan Du: formal analysis and investigation. Yu Tang: validation. Yaotai Wang: supervision. Jianzhong Zou: reviewing and editing.Conflicts of interest
All authors declare that they have no competing interests.References
- Z. Izadifar, Z. Izadifar, D. Chapman and P. Babyn, J. Clin. Med., 2020, 9, 460 CrossRef PubMed.
- Y. Wang, Q. Wang, Y. Luo, L. Jiang, Z. Zeng, L. Gan, J. Chen, H. Han and J. Zou, J. Ultrasound Med., 2020, 39, 259–271 CrossRef PubMed.
- T. Khokhlova, P. Rosnitskiy, C. Hunter, A. Maxwell, W. Kreider, G. Ter Haar, M. Costa, O. Sapozhnikov and V. Khokhlova, J. Acoust. Soc. Am., 2018, 144, 1160 CrossRef CAS PubMed.
- D. G. You, H. Y. Yoon, S. Jeon, W. Um, S. Son, J. H. Park, I. C. Kwon and K. Kim, Nano Convergence, 2017, 4, 30 CrossRef PubMed.
- S. Lee, H. Han, H. Koo, J. H. Na, H. Y. Yoon, K. E. Lee, H. Lee, H. Kim, I. C. Kwon and K. Kim, J. Controlled Release, 2017, 263, 68–78 CrossRef CAS PubMed.
- N. D. Sheybani, A. J. Batts, A. S. Mathew, E. A. Thim and R. J. Price, Theranostics, 2020, 10, 7436–7447 CrossRef CAS.
- K. J. Pahk, C. H. Shin, I. Y. Bae, Y. Yang, S. H. Kim, K. Pahk, H. Kim and S. J. Oh, Sci. Rep., 2019, 9, 9050 CrossRef PubMed.
- S. Qu, T. Worlikar, A. E. Felsted, A. Ganguly, M. V. Beems, R. Hubbard, A. L. Pepple, A. A. Kevelin, H. Garavaglia, J. Dib, M. Toma, H. Huang, A. Tsung, Z. Xu and C. S. Cho, Journal for ImmunoTherapy of Cancer, 2020, 8, e000200 CrossRef PubMed.
- S. Peng, P. Zhou, W. He, M. Liao, L. Chen and C. M. Ma, Phys. Med. Biol., 2016, 61, 6754–6769 CrossRef CAS PubMed.
- L. Huang, K. Zhou, J. Zhang, Y. Ma, W. Yang, L. Ran, C. Jin, D. D. Dimitrov and H. Zhu, Int. J. Hyperthermia, 2019, 36, 244–252 Search PubMed.
- M. B. Cooley, E. C. Abenojar, D. Wegierak, A. Sen Gupta, M. C. Kolios and A. A. Exner, Bioact. Mater., 2023, 19, 642–652 CrossRef CAS PubMed.
- W. Zhou, X. Tang, J. Huang, J. Wang, J. Zhao, L. Zhang, Z. Wang, P. Li and R. Li, J. Mater. Chem. B, 2022, 10, 3462–3473 RSC.
- C. Chen, Y. Wang, Y. Tang, L. Wang, F. Jiang, Y. Luo, X. Gao, P. Li and J. Zou, Int. J. Hyperthermia, 2020, 37, 870–878 CrossRef CAS PubMed.
- D. Xu, W. Zou, Y. Luo, X. Gao, B. Jiang, Y. Wang, F. Jiang, J. Xiong, C. Chen, Y. Tang, H. Qiao, H. Li and J. Zou, Sci. Rep., 2020, 10, 7772 CrossRef CAS PubMed.
- Y. Wang, C. Chen, Y. Luo, J. Xiong, Y. Tang, H. Yang, L. Wang, F. Jiang, X. Gao, D. Xu, H. Li, Q. Wang and J. Zou, Int. J. Nanomed., 2020, 15, 1871–1888 CrossRef CAS PubMed.
- J. Zheng, Y. Sun, T. Long, D. Yuan, S. Yue, N. Zhang and Z. Yang, Drug Delivery, 2022, 29, 1164–1175 CrossRef CAS PubMed.
- F. Maghsoudinia, H. Akbari-Zadeh, F. Aminolroayaei, F. F. Birgani, A. Shanei and R. K. Samani, Eur. J. Pharm. Sci., 2022, 174, 106207 CrossRef CAS PubMed.
- I. Rosenthal, J. Z. Sostaric and P. Riesz, Ultrason. Sonochem., 2004, 11, 349–363 CrossRef CAS PubMed.
- K. Johnson-Arbor and R. Dubey, in StatPearls, Treasure Island (FL), 2022 Search PubMed.
- Y. Luo, D. Xu, X. Gao, J. Xiong, B. Jiang, Y. Zhang, Y. Wang, Y. Tang, C. Chen, H. Qiao, H. Li and J. Zou, Biochem. Biophys. Res. Commun., 2019, 514, 1147–1153 CrossRef CAS PubMed.
- Y. L. Franco, T. R. Vaidya and S. Ait-Oudhia, Breast Cancer, 2018, 10, 131–141 CAS.
- R. Goldman, T. Facchinetti, D. Bach, A. Raz and M. Shinitzky, Biochim. Biophys. Acta, 1978, 512, 254–269 CrossRef CAS PubMed.
- N. N. Nguyen, R. Berger and H. J. Butt, ACS Appl. Mater. Interfaces, 2020, 12, 14599–14606 CrossRef CAS PubMed.
- W. A. Al-Otaibi and S. M. AlMotwaa, Drug Delivery, 2022, 29, 2190–2205 CrossRef CAS PubMed.
- H. Shi, L. Chen, Y. Liu, Q. L. Wen, S. Lin, Q. Wen, Y. Lu, J. Dai, J. M. Li, S. S. Xiao and S. Z. Fu, Int. J. Nanomed., 2023, 18, 1299–1315 CrossRef CAS PubMed.
- J. Theys, S. Barbé, W. Landuyt, S. Nuyts, L. Van Mellaert, B. Wouters, J. Anné and P. Lambin, Curr. Gene Ther., 2003, 3, 207–221 CrossRef CAS PubMed.
- L. Ippolito, A. Morandi, E. Giannoni and P. Chiarugi, Trends Biochem. Sci., 2019, 44, 153–166 CrossRef CAS PubMed.
- N. T. Kimura, S. Taniguchi, K. Aoki and T. Baba, Cancer Res., 1980, 40, 2061–2068 CAS.
- X. Zhang, H. Li, C. Liu and X. Yuan, Mol. Med. Rep., 2022, 26, 303 CrossRef CAS PubMed.
- M. Uccello, G. Malaguarnera, F. Basile, V. D'Agata, M. Malaguarnera, G. Bertino, M. Vacante, F. Drago and A. Biondi, BMC Surg., 2012, 12(Suppl 1), S35 CrossRef PubMed.
- M. Valko, D. Leibfritz, J. Moncol, M. T. Cronin, M. Mazur and J. Telser, Int. J. Biochem. Cell Biol., 2007, 39, 44–84 CrossRef CAS PubMed.
- S. Wang, X. Han, L. Zhang, Y. Zhang, H. Li and Y. Jiao, BioMed Res. Int., 2018, 2018, 2871710 Search PubMed.
- L. Zhong, X. Zhang and M. Covasa, World J. Gastroenterol., 2014, 20, 7878–7886 CrossRef PubMed.
- N. Lee, S. Lee, S. W. Jang, H. S. Shin, J. H. Park, M. S. Park and B. H. Lee, Saudi J. Biol. Sci., 2021, 28, 5115–5118 CrossRef CAS PubMed.
- X. B. Cui, H. Peng, R. R. Li, J. Q. Mu, L. Yang, N. Li, C. X. Liu, J. M. Hu, S. G. Li, Y. Wei, Y. Laibo, H. Zhou, F. Li and Y. Z. Chen, Oncotarget, 2017, 8, 92454–92469 CrossRef PubMed.
- J. Zhang, X. Sun, X. Zhao, L. Liu, X. Cheng, C. Yang, H. Hu, M. Qiao, D. Chen and X. Zhao, ACS Appl. Mater. Interfaces, 2022, 14, 20762–20777 CrossRef CAS PubMed.
- L. Nguyen, C. Christie, S. J. Madsen, Q. Peng, K. Berg and H. Hirschberg, Photodiagn. Photodyn. Ther., 2022, 38, 102879 CrossRef CAS PubMed.
- J. Rios-Doria, N. Durham, L. Wetzel, R. Rothstein, J. Chesebrough, N. Holoweckyj, W. Zhao, C. C. Leow and R. Hollingsworth, Neoplasia, 2015, 17, 661–670 CrossRef CAS PubMed.
- J. Gao, F. Wang, S. Wang, L. Liu, K. Liu, Y. Ye, Z. Wang, H. Wang, B. Chen, J. Jiang, J. Ou, J. C. M. van Hest, F. Peng and Y. Tu, Adv. Sci., 2020, 7, 1903642 CrossRef CAS PubMed.
- H. Liu, X. Lv, J. Qian, H. Li, Y. Qian, X. Wang, X. Meng, W. Lin and H. Wang, ACS Nano, 2020, 14, 13304–13315 CrossRef CAS PubMed.
- L. A. Méndez-García, K. E. Nava-Castro, T. L. Ochoa-Mercado, M. I. Palacios-Arreola, R. A. Ruiz-Manzano, M. Segovia-Mendoza, H. Solleiro-Villavicencio, C. Cázarez-Martínez and J. Morales-Montor, J. Interferon Cytokine Res., 2019, 39, 39–55 CrossRef PubMed.
- F. Nazari, P. Jafari, B. Nomanpour, K. Varmira and F. Raissi, Iran. J. Microbiol., 2022, 14, 689–697 Search PubMed.
- S. Kim, H. H. Lee, W. Choi, C. H. Kang, G. H. Kim and H. Cho, Int. J. Mol. Sci., 2022, 23, 23179788 Search PubMed.
- I. Benito, I. J. Encío, F. I. Milagro, M. Alfaro, A. Martínez-Peñuela, M. Barajas and F. Marzo, Int. J. Mol. Sci., 2021, 22, 22094906 Search PubMed.
- E. Abdolalipour, M. Mahooti, A. Salehzadeh, A. Torabi, S. R. Mohebbi, A. Gorji and A. Ghaemi, Microb. Pathog., 2020, 145, 10420742 CrossRef CAS PubMed; S. H. Lee, S. Y. Cho, Y. Yoon, C. Park, J. Sohn, J. J. Jeong, B. N. Jeon, M. Jang, C. An, S. Lee, Y. Y. Kim, G. Kim, S. Kim, Y. Kim, G. B. Lee, E. J. Lee, S. G. Kim, H. S. Kim, Y. Kim, H. Kim, H. S. Yang, S. Kim, H. Chung, M. H. Moon, M. H. Nam, J. Y. Kwon, S. Won, J. S. Park, G. M. Weinstock, C. Lee, K. W. Yoon and H. Park, Nat. Microbiol., 2021, 6, 277–288 CrossRef PubMed.
Footnote |
| † Electronic supplementary information (ESI) available. See DOI: https://doi.org/10.1039/d3ra01876h |
| This journal is © The Royal Society of Chemistry 2023 |

