 Open Access Article
Optimization of hierarchical ZSM-5 structure from kaolin as catalysts for biofuel production
Dina Kartika Maharani ab,
Yuly Kusumawatia,
Widiya Nur Safitria,
Reva Edra Nugraha
 c,
Holilah Holilah
 de,
Novia Amalia Sholeha
 f,
Aishah Abdul Jalil
 gh,
Hasliza Bahruji
 i and
Didik Prasetyoko
 *a
*a
aDepartment of Chemistry, Faculty of Science and Data Analytics, Institut Teknologi Sepuluh Nopember, Keputih Sukolilo 60111, Surabaya, Indonesia
bDepartment of Chemistry, Faculty of Mathematics and Natural Science, Universitas Negeri Surabaya, Ketintang Surabaya, East Java 60211, Indonesia
cDepartment of Chemical Engineering, Faculty of Engineering, Universitas Pembangunan Nasional “Veteran” Jawa Timur, Surabaya, East Java 60294, Indonesia
dDepartment of Food Science and Technology, Faculty of Agriculture, Halu Oleo University, Indonesia
eResearch Center for Biomass and Bioproducts, National Research and Innovation Agency of Indonesia (BRIN), Cibinong 16911, Indonesia
fCollege of Vocational Studies, Bogor Agricultural University (IPB University), Jalan Kumbang No. 14, Bogor 16151, Indonesia
gCentre of Hydrogen Energy, Institute of Future Energy, 81310 UTM Johor Bahru, Johor, Malaysia
hDepartment of Chemical Engineering, Faculty of Chemical and Energy Engineering, Universiti Teknologi Malaysia, 81310 UTM, Skudai, Johor Bahru, Johor, Malaysia
iCentre for Advanced Material and Energy Sciences, Universiti Brunei Darussalam, Bandar Seri Begawan BE 1410, Brunei. E-mail: didikp@chem.its.ac.id
First published on 10th May 2023
Abstract
Optimization of hierarchical ZSM-5 structure by variation of the first hydrothermal step at different times provides insight into the evolution of micro/mesopores and its effect as a catalyst for deoxygenation reaction. The degree of tetrapropylammonium hydroxide (TPAOH) incorporation as an MFI structure directing agent and N-cetyl-N,N,N-trimethylammonium bromide (CTAB) as a mesoporogen was monitored to understand the effect towards pore formation. Amorphous aluminosilicate without the framework-bound TPAOH achieved within 1.5 h of hydrothermal treatment provides flexibility to incorporate CTAB for forming well-defined mesoporous structures. Further incorporation of TPAOH within the restrained ZSM-5 framework reduces the flexibility of aluminosilicate gel to interact with CTAB to form mesopores. The optimized hierarchical ZSM-5 was obtained by allowing hydrothermal condensation at 3 h, in which the synergy between the readily formed ZSM-5 crystallites and the amorphous aluminosilicate generates the proximity between micropores and mesopores. A high acidity and micro/mesoporous synergy obtained after 3 h exhibit 71.6% diesel hydrocarbon selectivity because of the improved diffusion of reactant within the hierarchical structures.
Introduction
Worldwide energy production has increased over the past decades to sustain rapid industrial development and global population growth. The fuel demand for diesel and jet engines is increasing annually,1 with the transportation sector dominating 27% of the global energy in the past five years.2 As the fuel demand increases significantly,3 the production of renewable fuels is becoming increasingly important.4 Biofuel from biomass offers a solution to reduce dependency on fossil fuels.5 In the beginning, renewable fuel production was highly dependent on edible biomass such as sugar from starch or syrup, and vegetable oil. Investigation towards non-edible oil containing triglyceride provides alternative raw material in producing biomass-based biofuels without compromising food security.6Catalysts improve the inferior properties of biomass by deoxygenation into biofuel. Bio-fuel consists of linear, cyclic, or branched C10–C20 hydrocarbons that can be used as jet fuel.1 ZSM-5 catalysts have been widely used as porous acid catalysts in industrial biofuel production.7 A previous study reported using microporous ZSM-5 catalysts with pores smaller than 2 nm for the aromatization of propane.8 Nonetheless, microporous ZSM-5 restricts the mass transfer of bulkier molecules or reactants due to inefficient diffusion within the micropore.9 The strategy for tackling diffusion limitation is synthesizing hierarchical ZSM-5 with large porosity with pores stability.10 Hierarchical zeolites ZSM-5 contain additional mesoporous (2–50 nm) and/or macroporous (>50 nm) that interconnect with the micropores to form a porous network.11 Hierarchical ZSM-5 with microporous and mesoporous structures enhanced the ability to catalyze large molecules such as triglycerides.12 The hierarchical structure extends the lifetime of the catalyst,13 enhances the transfer of molecules within the ZSM-5 framework,14 and facilitates the access of large reactant molecules to the acid sites.15 Hierarchical ZSM-5 has attracted significant interest as a catalyst or support in a wide range of catalytic reactions such as biofuel production via hydrocracking or deoxygenation,16 methanol to olefin reaction17 and CO2 methanation.18 Hierarchical structure in ZSM-5 was reported to improve Pt dispersion for efficient catalytic combustion of toluene,19 at it provides large surface area for metal nanoparticles deposition. The zeolitic cage in hierarchical ZSM-5 confined the ultrafine Pt nanoparticles inside the cavity thus maintaining a large active site for benzene oxidation.20
Hierarchical ZSM-5 can be synthesized using a post-modification method and templating method.21 The post-treatment method requires dissolving ZSM-5 in acid or alkaline solutions, which frequently produces non-uniform mesopores and can lead to the disintegration of the ZSM-5 framework.22 Furthermore, the disintegrated Al species from dealumination caused pore blockage and enhanced extra-framework aluminum species23,24 responsible for Lewis acidity, which might lead to coke formation and catalyst deactivation. Therefore, the template method has been preferred because it produces a larger mesopores between 3–12 nm while maintaining crystalline framework.21 Hierarchical ZSM-5 was obtained by self-assembly of the aluminosilicate gel to form large pores21 employing various templates such as tetrapropylammonium hydroxide (TPAOH),25 tetraethylammonium hydroxide (TEAOH),26 carbon nano tube,27 graphene,28 organosilanes ([3-(trimethoxysilyl)propyl] ammonium chloride (TPHAC)),29,30 surfactants (CTAB),31–33 or polymers (polyacrylic acid).7,34 TPAOH is the most widely employed template for forming hierarchically hollow mesoporous ZSM-5 via a dissolution–recrystallization mechanism.35 In addition to TPAOH, CTAB with a long-chain alkyl group and one head quaternary ammonium group has been extensively investigated because CTAB is more likely to produce amorphous mesoporous molecular sieves.36 Therefore, numerous works incorporate TPAOH and CTAB to synthesize the ZSM-5. Nugraha et al. produced hierarchical ZSM-5 with pore diameter of around 5.1 nm.37 Similarly, Zhao et al., was produced micro-mesoporous ZSM-5 with a pore diameter of 3 nm using TPAOH and CTAB templates.38
Optimization of hydrothermal conditions is also vital in achieving hierarchical structures and high crystallinity ZSM-5. The crystallization temperature affects the rate of crystal nuclei formation and the purity of ZSM-5.39 Synthesis of ZSM-5 from sodium aluminate precursor using various combinations of CTAB and seeds produced bimodal pores with improved hierarchical structures.12 Li et al. synthesized hierarchical ZSM-5 from silica spheres, showing that optimizing hydrothermal conditions was crucial in improving activity and stability as catalysts for methanol to olefin reaction.40 The type of precursor also has a role in accelerating the crystal nucleation and directing the hydrogel transformation to micro/mesoporous structure as observed when using silica spheres as silica source.40 Hierarchical ZSM-5 produced from kaolin showed higher catalytic activity for catalytic cracking of biofuel compared to hierarchical ZSM-5 synthesized using tetraethyl orthosilicate, due to highly porous hierarchical ZSM-5 was formed from kaolin.41 Optimization of synthesis condition and understanding on its effect towards the evolution of hierarchical pores will be beneficial to ensure homogeneity of ZSM-5 characteristics particularly for large scale production. The temperature and concentrations gradient between laboratory synthesis and pilot scale resulted in a large discrepancy on the hierarchical structures.42
In this study, optimization of synthesis condition was conducted for the formation of hierarchical ZSM-5 with an optimum microporous and mesoporous structure to improve the deoxygenation of Reutealis trisperma oil (RTO) into diesel biofuel. TPAOH was used as a structure-directing agent to obtain the MFI-type framework, while cationic surfactant CTABs were used as mesoporogen. The transformation of kaolin to hierarchical ZSM-5 was optimized by varying the hydrothermal time during MFI formation, followed by addition with CTAB surfactant. The changes in crystallinity, acidity, porosity, and morphology are monitored to understand the effect of hydrothermal times on the properties of hierarchical ZSM-5. The studies highlighted the importance of achieving optimum interaction between micropores and mesopores in ZSM-5 to obtain high conversion to diesel range hydrocarbon.
Experimental
Materials
The precursor for hierarchical ZSM synthesis, kaolin Al4(Si4O10)(OH)8 as silica and alumina sources was obtained from Bangka island, Indonesia. The composition of kaolin is 57% SiO2 and 22% Al2O3. The chemical used in this research is NaOH (>99%) from Merck, Germany. LUDOX® HS-40 colloidal silica (30% Si in water), from Sigma Aldrich, Germany, TPAOH (C12H29NO, 40% in water) from Merck and CTAB (C19H42BrN, 99%) from Applichem. All chemicals used in this work were in analytical grade purity. The feedstock Reutealis trisperma oil (RTO) was purchased from Surabaya, Indonesia.Synthesis of catalysts
The hierarchical catalyst was synthesized by dissolving 1.6 g of NaOH with 19.42 g of distilled water in a Teflon container for 30 minutes. Then 1.85 g of Bangka kaolin was added slowly to the Teflon container. Ludox colloidal silica (36.48 g) to increase the Si composition was mixed with 19.42 g of distilled water and was added dropwise with vigorous stirring for 8 hours at room temperature. The mixture was aged for 6 hours at 70 °C, before adding 20.34 g of TPAOH and stirring for 30 minutes. The mixture was placed in Teflon line autoclave and heated in an oven at 80 °C, but with different crystallization times of 1; 1.5; 3; 6; 9 hours. The gel formed was cooled to room temperature before adding 18.91 g of CTAB. The gel was thoroughly mixed and heated for another 24 hours at 150 °C. The gel formed was then washed with distilled water until the pH was neutral. The solid was dried at 60 °C for 24 hours, calcined at 550 °C, 2 °C min−1 in N2 atmosphere for 2 hours, and continued under air for 6 h. The ZSM-5 catalysts were labeled as Z1, Z1.5, Z3, Z6 and Z9 according to their hydrothermal time variation.Characterization
All the catalysts were characterized its crystalline phase using powder X-ray diffraction (XRD) from PAN analytical X'pert Pro with Cu Ka radiation in the range 2θ = 10–90° for the wide angle and 2θ = 0–10° for the low angle analysis. The relative crystallinity of catalysts was calculated using peak intensity analysis compared to commercial ZSM-5. Fourier transform infrared (FTIR, SHIMADZU 96500) spectrometer was employed to determine the functional group of catalysts via KBr method. Surface morphology and elemental distribution of catalysts were investigated by scanning electron microscope (SEM, JEOL 6360 LA) and transmission electron microscopy (TEM) Hitachi HR-9500 TEM with an acceleration voltage of 300 kV. The textural properties were determined using N2 adsorption–desorption of Quantachrome Touchwin v1.11 instrument. Quantachrome ASiQwin instrument was used to calculate the pore size distribution by NLDFT method. The acidity of the catalysts including Brønsted and Lewis were determined using pyridine-FTIR (Shimadzu Instrument Spectrum One 8400S). Approximately, 15 mg of catalyst in pellet form was placed in the homemade glass transmission cell and then calcined at 400 °C for 4 h under N2 flow. The catalysts were characterized using thermogravimetric analysis (TGA) Linseis STA PT-1000. The heating temperature range of catalysts was 28 to 600 °C with a heating rate of 10 °C per min under air.Deoxygenation reaction
The catalytic activity test was carried out RTO using a semi-batch reactor in 10% H2–90% N2 gas medium. Before use, each tool to be used was washed using acetone and n-hexane and dried in an oven. A total of 10 g of RTO, 0.3 g catalyst were put into a three-neck round bottom flask. The mixture was stirred and heated to 350 °C for 4 h. The liquid product was collected for further analysis using GC-MS.Deoxygenated liquid product analysis
The DO liquid products were analyzed using gas chromatography-mass spectroscopy (HP 6890 GC) equipped with HP-5MS as a capillary column (length: 30 m × inner diameter: 0.25 mm × film thickness: 0.25 mm). Internal standard 1-Bromohexane was used for quantitative analysis. The mass of solid char and non-condensable gas was determined by eqn (1) and (2), respectively. The selectivity of liquid products was calculated using eqn (3). The selectivity of solid char was determined using eqn (4). The selectivity of non-condensed gas was determined using eqn (5). Eqn (6) expresses the selectivity of hydrocarbon calculation. The conversion of the DO reaction was calculated using eqn (7), and the degree of deoxygenation was determined based on the amount of fatty acid (FA) in RTO and liquid product eqn (8). The functional group of deoxygenated liquid products was analyzed using FTIR spectrometer (PerkinElmer (PC) Spectrum 100) within the wavenumber range of 500–4000 cm−1 and the resolution was 4 cm−1.| Mass of solid char = mresidue − mcatalyst | (1) |
| Mass of non-condensable gas = minitial − mresidue − mliquid | (2) |
 | (3) |
 | (4) |
 | (5) |
 | (6) |
 | (7) |
 | (8) |
Results and discussion
XRD study
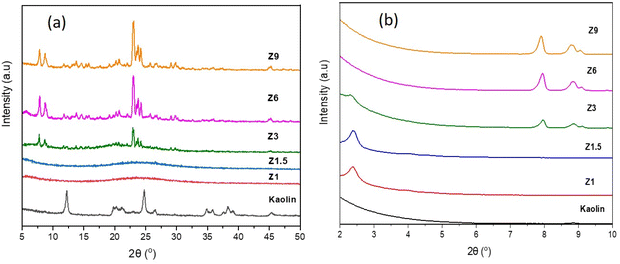
The X-ray diffraction pattern of the samples synthesized from kaolin at different hydrothermal times is shown in Fig. 1. The wide angle XRD pattern of kaolin powder confirmed the crystalline phase of kaolinite at 2θ = 12.4°, 23.7°, 24.9° and 38.4° (JCPDS no. 14-0164). Transformation of kaolinite into amorphous aluminosilicate was observed on Z1 and Z1.5 catalysts meanwhile, Z3, Z6 and Z9 catalysts exhibited the formation of crystalline ZSM-5. The XRD pattern of Z1 and Z1.5 samples show the broad peak centered at 2θ = 22°, characteristic of amorphous material.43 The Z3, Z6 and Z9 catalysts showed peaks at 2θ = 7.8°; 8.8°; 23°; 23.8° and 24° (JCPDS no. 44-0003) correspond to the ZSM-5 crystalline phase.37 The ZSM-5 peaks gained intensity with the increase of hydrothermal time from 3 h to 9 h. Hydrothermal condition improves the reactant reactivity and solubility for forming and rearranging the primary gels, thus improving the nucleation and crystallization rate.44 Longer crystallization time stabilizes the ZSM-5 zeolite structure by enhancing nucleation and crystallization of nanocrystals, consequently improving the crystallinity.45 The relative crystallinity calculated in Table 3 confirms that the increased crystallization time to 9 h produced a highly crystalline Z9 catalyst at 76.5% crystallinity, whereas the relative crystallinity of Z3 and Z6 catalysts were 53.1% and 71.6%, respectively.Fig. 1b depicts the low angle XRD pattern of catalyst and kaolin samples to provide information on the mesoporous structure. The peak around 2θ = 2.1° corresponds to the (001) diffraction plane, which is associated with ordered mesoporous structures of aluminosilicates in Z1 and Z1.5 catalysts. The decreased intensity for the Z3 catalyst indicates a less ordered mesoporous structure in the ZSM-5 framework.37 The order of mesoporous structure in the ZSM-5 framework decreases significantly with the longer hydrothermal time. Moreover, the peaks that appeared at 2θ = 7.8, 8.0 and 8.9° for Z3, Z6 and Z9 samples are identified as (101), (001) and (200) planes of ZSM-5.46
FTIR study
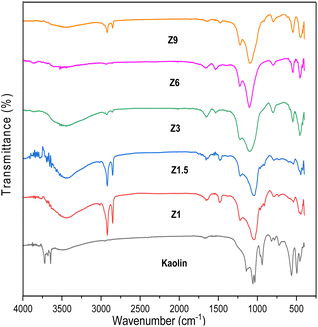
The FTIR spectra of kaolin and catalysts before calcination are shown in Fig. 2. Kaolin showed an absorption band at 538 cm−1, ascribed to the Al–OH bond vibration of Al[O(OH)]6. The absorption band at 432, 475, and 751 cm−1 were assigned to the vibration of Si–O bond from SiO4. The absorption band at 1115–1030 cm−1 was associated with the vibration of Si–O–Si bonds.47 The characteristic peaks of kaolin disappeared on the resulting catalysts indicating the kaolinite phase transformation to the aluminosilicate framework.37 All the catalysts display the characteristic bands at ∼447, 543, 799, 1080 and 1295 cm−1. The absorption band at 447 cm−1 indicates the bending vibration of the T–O group. The absorption band in the 543 cm−1 region is attributed to the five-membered ring vibration of ZSM-5.48 For the Z3, Z6, and Z9 catalysts, the 447 and 543 cm−1 bands gained intensity indicating the formation of crystalline ZSM-5 framework, whereas the intensity was lower in the Z1 and Z1.5 catalysts, which indicates the formation of amorphous aluminosilicate structure.The bands around 799 and 1080 cm−1 correspond to the external symmetric stretching and external asymmetric Si–O–T stretching vibration bond of ZSM-5, respectively.49 The band at 1080 cm−1 is absent in the amorphous Z1 and Z1.5 catalysts, but present in Z3, Z6 and Z9 catalysts which revealed crystalline ZSM-5 formation. The band at 1225 cm−1 corresponds to the asymmetric stretching vibration of TO4. The absorption band was less intense for amorphous Z1 and Z1.5 catalysts than for crystalline Z3, Z6, and Z9 catalysts. FTIR analysis further confirmed that the transformation of kaolin into the amorphous aluminosilicate framework occurred within 1 h of hydrothermal synthesis. The aluminosilicate gel was transformed into ZSM-5 at 3 h, with increased crystallinity at a prolonged crystallization time. Fig. 2 also showed the strong absorption band at 2993 cm−1 in the Z1 and Z1.5 samples, indicating the C–H vibration band of the organic template. This suggests the template is not fully incorporated into the aluminosilicate framework and is responsible for a low crystallinity ZSM-5 that underwent 1 and 1.5 h of hydrothermal time.50 When the hydrothermal time was extended to 3, 6 and 9 h, the amount of C–H vibration band from the organic template decreased significantly.
Acidity study
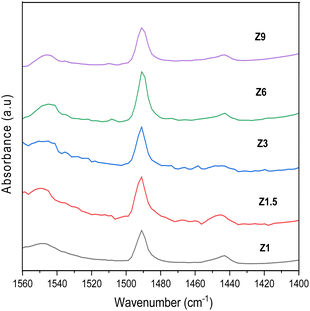
Pyridine was used as a probe molecule to determine the number of Lewis and Brønsted acid sites. Chemical interaction between pyridine with Lewis and Brønsted acid sites in the catalyst can be distinguished using FTIR analysis (Fig. 3). The absorption band at 1445 cm−1 was due to the interaction between the nitrogen atoms in pyridine molecules and the Lewis acid sites in the catalysts through the coordinate bond. On the other hand, the peak at 1545 cm−1 appeared when the Brønsted acid H+ interacted with pyridine to form pyridinium ion. The band at 1490 cm−1 arose from both Brønsted and Lewis sites.51 The number of Brønsted and Lewis acid sites is calculated based on the peak area and were summarized in Table 1.52,53 The hydrothermal condition affected the distribution of Brønsted and Lewis acid sites in the ZSM-5.54 The number of Lewis acid sites reduced at a longer hydrothermal time, whereas the Brønsted acid sites number were approximately similar for all catalysts. The number of Lewis acid sites in Z1.5 to Z9 catalysts was in the following order 89.94; 53.69; 15.24 and 14.44 μmol g−1. The Z1 catalyst displays a high density of Lewis acid sites, presumably due to its mesoporous structure that contains a high level of extra framework Al species.| Sample | SBETa (m2 g−1) | Smesob (m2 g−1) | Smicroc (m2 g−1) | Vmesob (cm3 g−1) | Vmicroc (cm3 g−1) | Vtotal (cm3 g−1) | Pore diameterb (nm) | Number of acid sitesd (μmol g−1) | Lewis densityd (μmol m−2) | |
|---|---|---|---|---|---|---|---|---|---|---|
| Brønsted | Lewis | |||||||||
| a BET surface area.b Vmeso and Smeso calculated based on DFT method.c Smicro and Vmicro (micropore volume) by t-plot method.d Acidity by pyridine adsorption. | ||||||||||
| Z1 | 767 | 592.01 | 408.17 | 0.583 | 0.249 | 0.832 | 3.825; 4.276 | 50.16 | 114.98 | 0.1499 |
| Z1.5 | 501 | 443.13 | 367.93 | 0.232 | 0.167 | 0.399 | 2.636; 3.092 | 39.95 | 86.94 | 0.1735 |
| Z3 | 426 | 378.39 | 275.74 | 0.192 | 0.127 | 0.319 | 1.874; 2.636; 3.438 | 55.58 | 53.69 | 0.1260 |
| Z6 | 286 | 262.41 | 174.09 | 0.069 | 0.076 | 0.145 | 1.455; 2.636 | 44.05 | 15.24 | 0.0533 |
| Z9 | 280 | 258.41 | 198.31 | 0.051 | 0.083 | 0.134 | 1.455; 2.599 | 31.40 | 14.44 | 0.0516 |
Catalysts synthesized at longer hydrothermal times exhibit a lower number of Brønsted acid sites from 50.16 to 31.40 μmol g−1. The number of Brønsted acid sites may correlate to the number of Al tetrahedrally-coordinated in the aluminosilicate mesoporous and crystalline catalysts.55 The Z3 catalyst exhibited the highest number of Brønsted acid sites that might benefit catalytic activity. The formation of highly crystalline ZSM-5 reduced the number of tetrahedrally-coordinated aluminum in the framework. After a prolonged hydrothermal synthesis, the number of Brønsted acid sites reduced, indicating that the mesoporous structure possesses a high tetrahedrally-coordinated Al framework responsible for Brønsted acidity. Meanwhile, increasing the hydrothermal synthesis time results in the deformation of the Al tetrahedrally coordinated framework, producing microporous structures and reducing the number of Brønsted acid sites. The total number of acid sites was continuously reduced from 165.14; 126.89; 109.27; 59.29; to 45.84 μmol g−1 on Z1 to Z9 catalyst.
N2 adsorption–desorption analysis
The N2 adsorption–desorption analysis provides information on the textural properties, including surface area, pore size distribution, total pore volume and pore diameter of the catalysts (Fig. 4). Table 1 summarizes data calculated from the N2 analysis. All the catalysts exhibited a similar type of isotherm but with different amounts of N2 uptake at P/P0 < 0.1. The high volume of N2 uptake at P/P0 > 0.1 implies multilayer adsorption and capillary condensation, characteristic of micropores. Z1 catalyst shows Type I and type IV isotherms, with high adsorption at P/P0 < 0. 1. The isotherm also exhibited a broad hysteresis loop at P/P0 = 0.1–0.3 which is a characteristic of regularly mesoporous material (Fig. 4a). The Z1 catalyst has a broad distribution of mesopore with intense N2 adsorption volume centered at 3.8 and 4.2 nm (Fig. 4b) due to the formation of intra-particle mesopores. At P/P0 = 0.4–1, the Z1 catalyst showed a narrow hysteresis loop indicating a decrease in intraparticle adsorption.56 The Z1.5 and Z3 catalysts showed similar N2 adsorption–desorption isotherms. Both catalysts display lower N2 adsorption at P/P0 < 0.1 and a narrow hysteresis loop compared to the Z1 catalyst at P/P0 0.1–0.3. This demonstrates less N2 adsorption in the intraparticle pores due, which implies the deterioration of the regularly mesoporous structure. The N2 adsorption–desorption at P/P0 = 0.4–1 was significantly lower than the Z1 catalyst with a slightly narrow hysteresis loop, suggesting the interparticle adsorption in the micropores.57 The Z1.5 and Z3 catalysts also display the combination of type I and type IV isotherms. The N2 adsorption–desorption isotherm pattern of Z6 and Z9 catalysts were relatively identical, exhibiting type I joining with type IV isotherm, typically ascribed to the microporous zeolite. The Z6 and Z9 catalysts showed a very high N2 uptake at P/P0 < 0.1, then continued by moderately increasing adsorption at P/P0 = 0.1–0.3. The Z6 and Z9 catalysts also exhibit a narrow hysteresis loop in the region of P/P0 = 0.4–1, indicating no regular mesopores structure in these catalysts. The prolonged crystallization process in hydrothermal synthesis transforms the intraparticle mesopores into interparticle pores in Z6 and Z9 catalysts.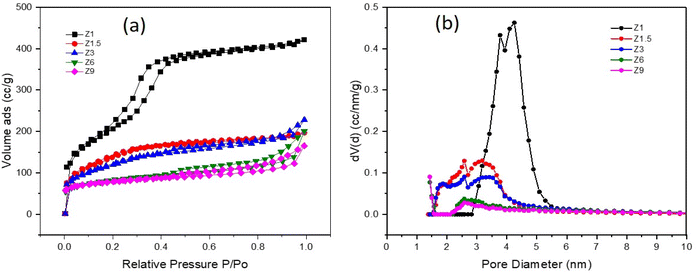 | ||
| Fig. 4 N2 adsorption–desorption isotherm (a) and pore size distribution by DFT method (b) of catalysts. | ||
Based on Table 1, the Z1 catalyst has the highest BET surface area of 761 m2 g−1, which inferred the formation of highly mesoporous structures from the concentrated gel. From this point, the initial gel was gradually transformed into crystalline mesoporous ZSM-5. In general, the specific surface area of all catalysts decreased significantly with increasing hydrothermal synthesis time. The formation of large intraparticle mesopores enhances the BET surface area.58
TGA analysis
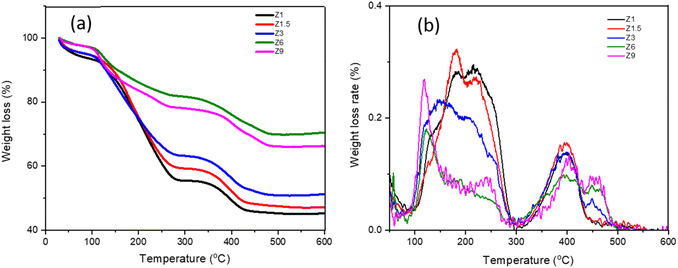
The TGA analysis was conducted to provide information on incorporating the organic templates during the hydrothermal synthesis (Table 2). Fig. 5 demonstrates three different stages of weight loss at 30–120 °C, 120–300 °C and 300–480 °C. The first weight loss is due to the evacuation of physisorbed water.59 All the catalysts exhibit similar water evacuation beginning at 35 °C, with weight loss reduced from 5.4% to 1.7% with increasing hydrothermal time. The second weight loss starting from 150–320 °C is due to the decomposition of cationic CTAB surfactant, in which the temperature and the weight loss percentage reflected the degree of mesoporosity.60 CTAB decomposed from aluminosilicate between 150–400 °C depending on the interaction with SiO- or AlO- and the Si/Al ratios.61 Strong interaction between CTAB with aluminum shifts the decomposition to 400 °C. For the Z6 and Z9 catalysts that showed less mesoporosity, the decomposition temperature of CTAB occurred at 150 °C, suggesting the decomposition of surface bound CTAB.60 For Z1, Z1.5, and Z3 catalysts, the broad decomposition peak from 150 °C to 300 °C indicates a high concentration of CTAB with multiple interactions on the catalysts or within the mesopores. Intercalation of CTAB within the mesopores enhanced the decomposition temperatures to 300 °C. The weight loss percentage at the second decomposition region of Z1, Z1.5 and Z3 catalysts was measured at between 37.11%–30.4%, while Z6 and Z9 were determined at 15.3% and 18.2%. At the prolonged hydrothermal time, where the ZSM-5 crystalline structure was formed, the CTAB only adsorbed on the surfaces, thus restricting the formation of mesopores in the Z6 and Z9 catalysts, resulting in less ordered mesostructured catalyst.14| Catalyst | Tregion1 (°C) | Tregion2 (°C) | Tregion3 (°C) | Wloss region1 (%) | Wloss region2 (%) | Wloss region3 (%) | Residue Wloss 600 °C (%) |
|---|---|---|---|---|---|---|---|
| Z1 | 29.18 | 289.34 | 318.67 | 5.74 | 37.11 | 11.07 | 46.08 |
| Z1.5 | 32.44 | 286.17 | 346.93 | 4.26 | 34.21 | 9.77 | 51.76 |
| Z3 | 32.45 | 107.88 | 335.67 | 3.97 | 30.22 | 9.09 | 56.72 |
| Z6 | 31.26 | 98.71 | 322.18 | 3.28 | 15.33 | 11.23 | 70.16 |
| Z9 | 32.28 | 98.49 | 356.77 | 1.71 | 18.29 | 10.56 | 69.44 |
The third weight loss from 300–480 °C is ascribed to the oxidative decomposition of TPA+ cation in the zeolite framework.62 As TPAOH, TPA+ is easily decomposed at ∼130 °C. However, TPA+ decomposed at 240 °C when stabilized with a larger anion such as Br−.63 Following incorporation with zeolite, TPA+ interacted with SiO- or AlO-, enhancing the decomposition temperatures to reach 300–400 °C. TPA+ decomposed at ∼380 °C is assigned to the loosely held TPA+, presumably on the outer shell. Decomposition at 425 °C attributed to the strongly confined TPA+ strained ions within the ZSM-5 framework,64 which was only observed on Z3, Z6 and Z9. The TGA results suggested that the variation of hydrothermal time affected the incorporation of TPA+ into the ZSM-5 framework. The first stage of hydrothermal synthesis involves the incorporation of TPA+ within the aluminosilicate sol to form the MFI framework. Prolonged synthesis up to 6 h and 9 h, allowing the confinement of TPA+ within the zeolite micropores. Therefore, it can be proposed that by extending the hydrolysis time, a more significant number of aluminosilicate oligomers diffused into quartered ammonium groups region to balance the cationic hydrophilic surface of the micelle, leading to a higher atomic arrangement. In general, the total weight loss of Z1, Z1.5, and Z3 catalysts is higher than that in Z6 and Z9 catalysts due to different degrees of CTAB incorporation. The total weight loss of the catalyst containing a large mesoporous structure is around 45% to 55% for Z1 to Z3 catalysts.
Morphology analysis
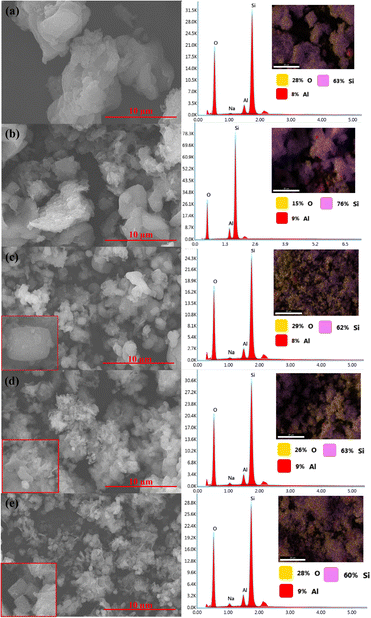
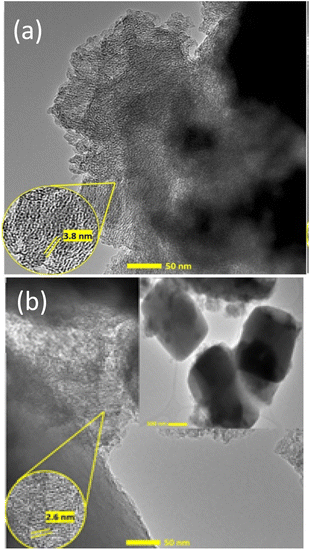
SEM analysis showed that hydrothermal synthesis time strongly affected the morphology and crystal structures of the catalysts (Fig. 6). Z1 and Z1.5 catalysts contain non-uniformed agglomerate particles. The prolonged hydrothermal synthesis time significantly affects the crystal growth of ZSM-5. Z3 catalyst showed smaller non-uniform particles than Z1 and Z1.5 indicating the formation of the crystalline structure of ZSM-5. Z6 catalyst showed the characteristic of the cubic shape of ZSM-5 crystalline structure. The more regular cubic shape of ZSM-5 was formed on the Z9 catalyst, which indicates highly crystalline particles were formed, in agreement with the XRD result. Although the cubic-shaped particles were observed in Z3, Z6 and Z9 catalysts, non-uniform aggregates were also observed, indicating incomplete crystallization of aluminosilicate gel. EDX analysis showed the distribution of Si and Al in the catalysts. All catalysts showed uniform Al and Si atoms distribution with comparable weight% of the elements. Table 3 summarizes the elemental composition of the catalysts composed of an average of 64.8 wt% of Si, 8.6 wt% of Al and 25.2 wt% of O.TEM analysis of Z1 and Z3 catalysts confirmed the formation of a regular mesoporous channel of hierarchical structures (Fig. 7). The TEM image of the Z1 catalyst revealed the formation of well-ordered mesopores with an estimated diameter of 3.8 nm as shown by low angle XRD analysis and N2 adsorption–desorption analysis. The TEM analysis of the Z3 catalyst obtained at 3 h hydrothermal time displayed the cubical crystalline shape of the ZSM-5 structure. The formation of the mesoporous channels can be seen with an estimated diameter of 2.6 nm. However, it is clear that the mesopores were observed on the non-uniform aggregates but not on the cubic ZSM-5. There is a possibility that at 3 h of hydrothermal synthesis, only the remaining aluminosilicate gel reacted with CTAB to form mesoporous. Meanwhile, the rigidity of ZSM-5 crystalline structures prevents CTAB incorporation for the formation of mesopores.
The catalytic deoxygenation of RTO
Deoxygenation (DO) of RTO was carried out at 350 °C for H2/N2 flow using catalysts, and the catalytic data were summarized in Table 4. The Z1 and Z1.5 catalysts achieved approximately similar oil conversion at 90.67–90.87% (Fig. 8a). For Z3, Z5 and Z9 catalysts, the conversion of RTO was slightly reduced to 86.29%, 86.23% and 84.43%, respectively. Fig. 8a also showed that the Z1 catalyst produced only 3.4% selectivity to carbon coke, with the coke selectivity gradually increased when using catalysts obtained at longer hydrothermal times. The mesoporous structure in Z1 is important to enhance oil conversion to liquid product and prevent coke formation during deoxygenation due to the efficient mass transfer.65,66 However, efficient mass transfer alone is insufficient; acid sites must catalyze C–C dissociation during deoxygenation. The high acidity of catalysts and mesoporosity reduced the coke formation, indicating a good resistance to coke production. However, ZSM-5 obtained at 9 h (Z9) maintained approximately similar oil conversion, but most products were uncondensed gases. The results indicate the detrimental effect of microporous structure in producing liquid yield due to the subsequent cracking reaction that transformed the liquid product into small molecules with low boiling points.| Catalysts | Conversion (%) | Sgas | Sliquid | Schar | DO degree (%) |
|---|---|---|---|---|---|
| Z1 | 90.67 | 67.95 | 28.64 | 3.41 | 89.45 |
| Z1.5 | 90.87 | 72.41 | 22.98 | 4.63 | 93.07 |
| Z3 | 86.29 | 73.49 | 21.82 | 5.59 | 93.91 |
| Z6 | 86.23 | 68.92 | 23.16 | 7.91 | 90.44 |
| Z9 | 84.43 | 84.70 | 6.73 | 8.57 | 90.91 |
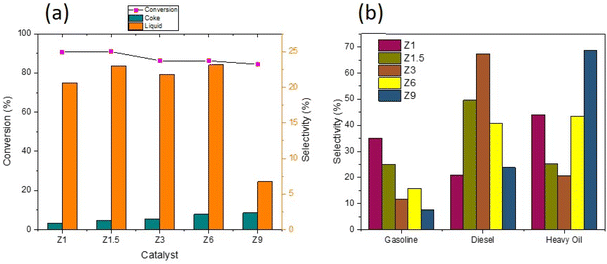 | ||
| Fig. 8 Conversion and product distribution of DO reaction using catalysts (a) and hydrocarbon composition in liquid yield (b). | ||
The liquid product was divided into hydrocarbon, aromatic, cyclic, carboxylic acid, ketone and alcohol compounds (Fig. 9). Hydrocarbon and carboxylic acid are the main product, followed by aromatic and cyclic compounds. Z1 catalyst showed similar selectivity between hydrocarbon and carboxylic acid at ∼37%. Hydrocarbon selectivity was increased to 52.12% when using Z3 catalyst, significantly reducing carboxylic and aromatic compounds. The hierarchical structure of Z3 increased the deoxygenation of fatty acids to produce hydrocarbon. The ordered mesoporous structure improved the accessibility to the acid sites and enhanced the mass transfer for large molecules. When the DO reaction was conducted using Z6 catalyst, the selectivity of hydrocarbon decreased to 35.61%, with the increased of carboxylic acid to 40.99%. Similar results were obtained when using Z9 catalyst, which further consolidated the effect of micropores in reducing the efficiency of deoxygenation into hydrocarbon.67 The production of cyclic alkanes and aromatics products might indicate further reaction of the resulting hydrocarbons. ZSM-5 catalyzed the formation of aromatics compounds from the dehydrogenation of cyclic olefins and the hydrocracking of fatty acids.68,69 ZSM-5 transformed a mixture of hydrocarbons pool into aromatic via several mechanism steps that begin with the dehydrogenation of alkanes to olefins. A high level of olefin generated from the deoxygenation reaction might have facilitated aromatics production. The reaction is followed by subsequent oligomerization, cyclization, and aromatics formation via the hydrogen transfer mechanism.70 Apart from ZSM-5 acidity to catalyze C–C bond dissociation in deoxygenation, the pore characteristics of ZSM-5 that consisted of intersecting straight and zig-zag channels are also crucial for aromatic compound formation from hydrocarbons.71 These studies revealed that aromatics formation favors mesoporous aluminosilicate instead of hierarchical ZSM-5, presumably due to the high production of light hydrocarbons on mesoporous aluminosilicate. The synergy between Brønsted/Lewis acidity was also reported to improve dehydrogenation–aromatization.72 Nevertheless, the aromatics selectivity was further increased on the Z6 catalyst despite having a lower Lewis/Brønsted acidity, suggesting the role of the micropore structure of ZSM-5 that fits into the benzene ring size.71
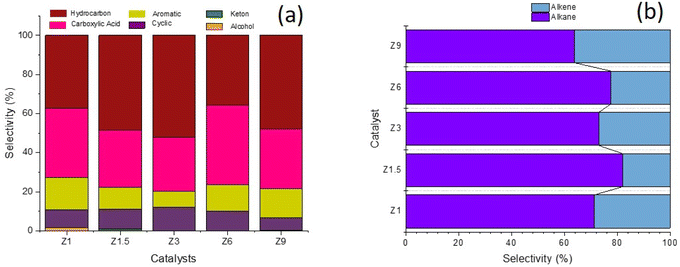 | ||
| Fig. 9 Liquid product selectivity of DO reaction using catalysts: based on functional groups (a) and alkane alkene (b). | ||
Hydrocarbon composition in liquid yield was divided into gasoline, diesel and heavy oil (Fig. 8b). The selectivity of gasoline hydrocarbon was gradually reduced when using catalysts obtained at a longer synthesis time. However, the diesel hydrocarbon showed a volcano trend in which diesel becomes the primary hydrocarbon produced from the Z3 catalyst. The diesel selectivity varied from 21.1%–67.4%, the gasoline selectivity from 7.5%–35.1%, and heavy oil selectivity between 20.7%–68.6%. In principle, the DO reaction is proposed to eliminate the oxygenated carbon comprising carboxylic and/or carbonyl fragments from the fatty acid to form straight-chain hydrocarbons. The major constituents of RTO feedstock are palmitic acid (C16![[thin space (1/6-em)]](https://www.rsc.org/images/entities/char_2009.gif) :
:![[thin space (1/6-em)]](https://www.rsc.org/images/entities/char_2009.gif) 0), oleic acid (C18
0), oleic acid (C18![[thin space (1/6-em)]](https://www.rsc.org/images/entities/char_2009.gif) :
:![[thin space (1/6-em)]](https://www.rsc.org/images/entities/char_2009.gif) 1) and linoleic acid (C18
1) and linoleic acid (C18![[thin space (1/6-em)]](https://www.rsc.org/images/entities/char_2009.gif) :
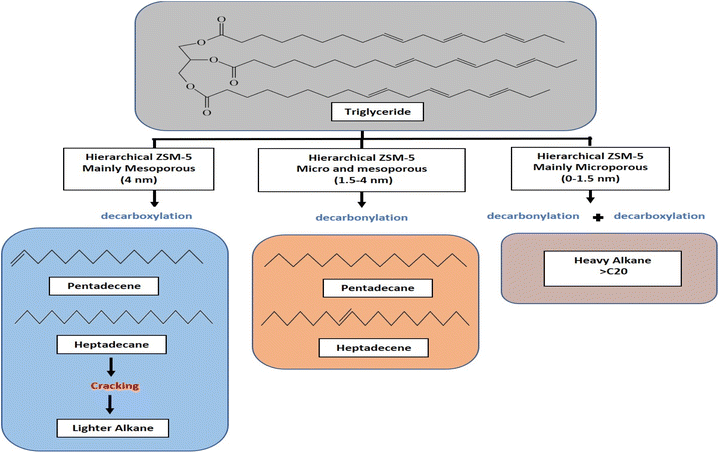
:![[thin space (1/6-em)]](https://www.rsc.org/images/entities/char_2009.gif) 0) (Table 5). The C8–12 gasoline yield increased when using catalysts obtained at a shorter hydrothermal time within 1 h and 1.5 h. The catalysts obtained at 3 h enhanced the C13–C20 diesel production, while the heavy oil containing long chain >C21 hydrocarbon became the main yield for catalysts obtained at 6 h and 9 h. Z3 shows high production of C13–C20 diesel hydrocarbon, presumably due to the hierarchical structure that promotes decarboxylation (DCO) and decarbonylation (DCOx) of RTO into a higher diesel range of biofuel. In contrast, heavy oil is the dominant product on the Z9 catalyst, caused by the increase in the crystallinity and micropore structure of ZSM-5. However, it is important to note that Z9 catalyst has poor selectivity toward the liquid product. Instead, most of the feedstock was converted to uncondensed gases. Another reason for the low hydrocarbon selectivity on Z9 is the lack of Lewis acidity in crystalline ZSM-5.31 The hydrocarbon can be further divided into alkane and alkene, which provides a further understanding of the role of the catalyst during deoxygenation. Generally, the selectivity of alkene from all the catalysts was lower than alkane (Fig. 9b). Alkenes were more susceptible to the cracking reaction than alkanes, which can reduce the composition of the unsaturated hydrocarbon in the biofuel product.73,74 Since no significant difference was observed in the ratio between alkene/alkane in all catalysts, we can suggest a negligible effect of hierarchical structure and acidity towards the ratio.
0) (Table 5). The C8–12 gasoline yield increased when using catalysts obtained at a shorter hydrothermal time within 1 h and 1.5 h. The catalysts obtained at 3 h enhanced the C13–C20 diesel production, while the heavy oil containing long chain >C21 hydrocarbon became the main yield for catalysts obtained at 6 h and 9 h. Z3 shows high production of C13–C20 diesel hydrocarbon, presumably due to the hierarchical structure that promotes decarboxylation (DCO) and decarbonylation (DCOx) of RTO into a higher diesel range of biofuel. In contrast, heavy oil is the dominant product on the Z9 catalyst, caused by the increase in the crystallinity and micropore structure of ZSM-5. However, it is important to note that Z9 catalyst has poor selectivity toward the liquid product. Instead, most of the feedstock was converted to uncondensed gases. Another reason for the low hydrocarbon selectivity on Z9 is the lack of Lewis acidity in crystalline ZSM-5.31 The hydrocarbon can be further divided into alkane and alkene, which provides a further understanding of the role of the catalyst during deoxygenation. Generally, the selectivity of alkene from all the catalysts was lower than alkane (Fig. 9b). Alkenes were more susceptible to the cracking reaction than alkanes, which can reduce the composition of the unsaturated hydrocarbon in the biofuel product.73,74 Since no significant difference was observed in the ratio between alkene/alkane in all catalysts, we can suggest a negligible effect of hierarchical structure and acidity towards the ratio.
| Compound | Yield (%) | |||||
|---|---|---|---|---|---|---|
| RTO | Z1 | Z1.5 | Z3 | Z6 | Z9 | |
Palmitic acid (C16![[thin space (1/6-em)]](https://www.rsc.org/images/entities/char_2009.gif) : :![[thin space (1/6-em)]](https://www.rsc.org/images/entities/char_2009.gif) 0) 0) |
40.35 | 6.04 | 4.44 | 2.62 | 5.79 | 3.82 |
Stearic acid (C18![[thin space (1/6-em)]](https://www.rsc.org/images/entities/char_2009.gif) : :![[thin space (1/6-em)]](https://www.rsc.org/images/entities/char_2009.gif) 0) 0) |
56.26 | 1.15 | 0.91 | 0.59 | 1.11 | 0.75 |
Oleic acid (C18![[thin space (1/6-em)]](https://www.rsc.org/images/entities/char_2009.gif) : :![[thin space (1/6-em)]](https://www.rsc.org/images/entities/char_2009.gif) 1) 1) |
— | 3.90 | 2.83 | 2.34 | 2.93 | 3.16 |
Linoleic acid (C18![[thin space (1/6-em)]](https://www.rsc.org/images/entities/char_2009.gif) : :![[thin space (1/6-em)]](https://www.rsc.org/images/entities/char_2009.gif) 2) 2) |
— | 1.46 | 0.77 | — | 1.69 | 0.57 |
During the deoxygenation of RTO using Z3 catalyst, C13–C22 linear paraffins were obtained with C15 pentadecane and C17 heptadecene as the dominant hydrocarbons. The Z1 and Z1.5 catalysts with higher mesopore structures were analyzed to produce a lower number of pentadecane and heptadecane, but instead produced mainly C8–C12 hydrocarbons. The formation of light hydrocarbon (C8–C12) resulted from the secondary cracking reaction of the hydrocarbons or the fatty acids in RTO.75,76 However, the hydrocarbon product of the Z9 catalyst was mainly in the form of heavy oil range, although liquid product yield only formed at 7% selectivity. The transformation from amorphous agglomerate to crystalline ZSM-5 framework due to the low efficiency of CTAB incorporation to form mesopores has significantly affected the hydrocarbon distribution. During the first stage of hydrothermal treatment, the formation of crystalline ZSM-5 structure enhanced the amount of AlO- incorporated in the tetrahedral framework of ZSM-5, thus reducing the flexibility for interaction with CTAB. It is suggested that only the amorphous aluminosilicate reacted with CTAB to form mesopores. When the condensation of aluminosilicate gel reached ∼50% crystallinity at 3 h of hydrothermal synthesis, the remaining non-framework SiO-/AlO- reacted with the CTAB to form mesopores. This was further supported by FTIR analysis that showed the increased ratio of 543 to 447 cm−1 peak with increasing hydrothermal synthesis time, indicating the transformation of Al tetrahedral from amorphous structure to crystalline ZSM-5. High-ordered mesopores implied a large number of Al extra-framework, increasing the number of total acid sites as determined on the Z1 catalyst at 165.4 μmol g−1. Furthermore, the mesopore provides more accessible acid sites for pyridine adsorption.77 The large external surface area in the Z1 catalyst implies that the terminal Al–OH groups are more available on their external surfaces.78 As the transformation from amorphous aluminosilicate to the crystalline phase of ZSM-5, the total acid site number of catalysts gradually decreased, implying a lower number of external Al tetrahedral frameworks. Dramatic reduction in acidity has a negligible effect on the conversion, indicating that deoxygenation reaction only requires a medium number of acid sites. However, the hierarchical structure dominates in determining product distribution and selectivity towards biofuel hydrocarbons.
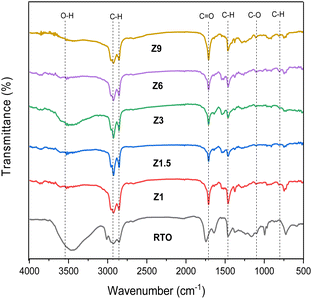
The liquid products from the DO reaction were characterized using FTIR analysis to provide insight into the mechanism (Fig. 11). The FTIR spectrum of RTO in Fig. 10 showed the characteristic of RTO absorption bands, including –OH broad absorption band at 3457 cm−1, –CH stretching of the aliphatic chain at 2922 cm−1, the –C![[double bond, length as m-dash]](https://www.rsc.org/images/entities/char_e001.gif) O stretching of ester at 1752 cm−1, C–O–C stretching at 1165 cm−1 and also the –CH alkane and the
O stretching of ester at 1752 cm−1, C–O–C stretching at 1165 cm−1 and also the –CH alkane and the ![[double bond, length as m-dash]](https://www.rsc.org/images/entities/char_e001.gif) CH alkene bending vibrations at 1453 and 749 cm−1 respectively. The absorption band of –C
CH alkene bending vibrations at 1453 and 749 cm−1 respectively. The absorption band of –C![[double bond, length as m-dash]](https://www.rsc.org/images/entities/char_e001.gif) O (ester) and C–O–C (carbonyl) stretching as the characteristics of oxygenated species in triglycerides were used to evaluate the mechanism of DO reaction.79 The moderate shift of the stretching vibration of ester functional group –C
O (ester) and C–O–C (carbonyl) stretching as the characteristics of oxygenated species in triglycerides were used to evaluate the mechanism of DO reaction.79 The moderate shift of the stretching vibration of ester functional group –C![[double bond, length as m-dash]](https://www.rsc.org/images/entities/char_e001.gif) O in liquid product from 1752 cm−1 to 1705 cm−1 (carboxylic acid group) following the DO reaction indicates the dissociation of ester bond to form intermediates fatty acid.80 Another evidence of oxygenate removal was observed in the elimination of the C–O–C band of the carbonyl group in RTO from the disappearance of the C–O–C stretching band at 1165 cm−1. The Z3 and Z1.5 catalysts showed a higher reduction of oxygenate compound from the reduced intensity of 1705 and 1165 cm−1 bands, suggesting the acid site strength and the hierarchical structure of the catalyst enhanced the deoxygenation of the oxygenated fragment from the fatty acids. When the DO reaction was catalyzed using Z9 catalyst, an intense –C
O in liquid product from 1752 cm−1 to 1705 cm−1 (carboxylic acid group) following the DO reaction indicates the dissociation of ester bond to form intermediates fatty acid.80 Another evidence of oxygenate removal was observed in the elimination of the C–O–C band of the carbonyl group in RTO from the disappearance of the C–O–C stretching band at 1165 cm−1. The Z3 and Z1.5 catalysts showed a higher reduction of oxygenate compound from the reduced intensity of 1705 and 1165 cm−1 bands, suggesting the acid site strength and the hierarchical structure of the catalyst enhanced the deoxygenation of the oxygenated fragment from the fatty acids. When the DO reaction was catalyzed using Z9 catalyst, an intense –C![[double bond, length as m-dash]](https://www.rsc.org/images/entities/char_e001.gif) O absorption band was observed, suggesting the low density of acid sites and microporosity restricted the deoxygenation reaction.
O absorption band was observed, suggesting the low density of acid sites and microporosity restricted the deoxygenation reaction.
Conclusions
The hierarchical ZSM-5 catalyst obtained from the optimization of ZSM-5 crystallization generates synergy between micro/mesoporous and acidity for efficient conversion of RTO into green diesel hydrocarbon. Maintaining similar Si/Al ratios on the catalysts and monitoring the Lewis acidity provides an understanding of the incorporation of AlO- into the ZSM-5 framework during different hydrothermal times. Continuous reduction of Lewis acidity with prolonged hydrothermal synthesis indicates the incorporation of AlO- into the Al tetrahedral framework of ZSM-5. However, the rigidity of the crystalline ZSM-5 bonds reduced the formation of secondary mesopores upon CTAB addition. The efficient synergy between micro/mesopores was obtained when approximately half of the aluminosilicate transformed into ZSM-5 crystalline framework, allowing mesopores to form on the remaining aluminosilicate amorphous. The extra framework Al identified from the formation of Lewis acidity was suggested to interact with CTAB efficiently to form mesopores. Z3 catalysts with micro/mesoporous structure and moderate acidity exhibit high selectivity for RTO conversion to green diesel hydrocarbon.Author contributions
Dina Kartika Maharani: conceptualization, methodology, investigation, validation, writing – original draft. Didik Prasetyoko: conceptualization, methodology, validation, supervision, writing – review and editing, resources. Aishah Abdul Jalil: validation, conceptualization, resources. Hasliza Bahruji: supervision, validation, writing – review and editing. Yuly Kusumawati: supervision, validation. Reva Edra Nugraha: validation, writing – review and editing. Holilah: validation, writing–review and editing. Widiya Nur Safitri: validation and editing. Novia Amalia Sholeha: validation and editing.Conflicts of interest
There are no conflicts to declare.Acknowledgements
The authors would like to acknowledge the Ministry of Education, Culture, Research and Technology for the financial support under PDD research grant with contract number 084/E5/PG.02.00.PT/2022.Notes and references
- Y. Nakagawa, M. Tamura and K. Tomishige, Fuel Process. Technol., 2019, 193, 404–422 CrossRef CAS.
- C. Gutiérrez-Antonio, F. I. Gómez-Castro, J. A. de Lira-Flores and S. Hernández, Renewable Sustainable Energy Rev., 2017, 79, 709–729 CrossRef.
- P. R. Bhoi, A. S. Ouedraogo, V. Soloiu and R. Quirino, Renewable Sustainable Energy Rev., 2020, 121, 109676 CrossRef CAS.
- M. G. Bidir, N. K. Millerjothi, M. S. Adaramola and F. Y. Hagos, Energy Rep., 2021, 7, 3614–3627 CrossRef.
- J. Yang, Z. Xin, Q. (Sophia) He, K. Corscadden and H. Niu, Fuel, 2019, 237, 916–936 CrossRef CAS.
- W. C. Wang and L. Tao, Renewable Sustainable Energy Rev., 2016, 53, 801–822 CrossRef CAS.
- X. Mi, Z. Hou, X. Li, H. Liu and X. Guo, Microporous Mesoporous Mater., 2020, 302, 110255 CrossRef CAS.
- G. G. Oseke, A. Y. Atta, B. Mukhtar, B. J. El-Yakubu and B. O. Aderemi, J. King Saud Univ., Eng. Sci., 2021, 33, 531–538 Search PubMed.
- R. J. White, A. Fischer, C. Goebel and A. Thomas, J. Am. Chem. Soc., 2014, 136, 2715–2718 CrossRef CAS PubMed.
- J. Liu, G. Jiang, Y. Liu, J. Di, Y. Wang, Z. Zhao, Q. Sun, C. Xu, J. Gao, A. Duan, J. Liu, Y. Wei, Y. Zhao and L. Jiang, Sci. Rep., 2014, 4, 1–6 Search PubMed.
- H. Qu, Y. Ma, B. Li and L. Wang, Emergent Mater., 2020, 3, 225–245 CrossRef CAS.
- B. Velaga, R. Doley and N. R. Peela, Adv. Powder Technol., 2021, 32, 1033–1046 CrossRef CAS.
- Z. Zhou, R. Jiang, X. Chen, X. Wang and H. Hou, J. Solid State Chem., 2021, 298, 122132 CrossRef CAS.
- Z. Wang, R. Zhang, J. Wang, Z. Yu, Y. Xiang, L. Kong, H. Liu and A. Ma, Fuel, 2022, 313, 122669 CrossRef CAS.
- C. Zhao, X. Hu, C. Liu, D. Chen, J. Yun, X. Jiang, N. Wei, M. Li and Z. Chen, J. Environ. Chem. Eng., 2022, 10, 106868 CrossRef CAS.
- Y. Wang, S. Li, Y. Liu, J. Zheng, X. Sun, Y. Du, Z. Liu, B. Qin, W. Li, G. Wang, M. Pan and R. Li, Ind. Eng. Chem. Res., 2022, 61, 9136–9148 CrossRef CAS.
- T. Weissenberger, A. G. F. Machoke, J. Bauer, R. Dotzel, J. L. Casci, M. Hartmann and W. Schwieger, ChemCatChem, 2020, 12, 2461–2468 CrossRef CAS.
- N. A. Sholeha, S. Mohamad, H. Bahruji, D. Prasetyoko, N. Widiastuti, N. A. Abdul Fatah, A. A. Jalil and Y. H. Taufiq-Yap, RSC Adv., 2021, 11, 16376–16387 RSC.
- D. Yang, S. Fu, S. Huang, W. Deng, Y. Wang, L. Guo and T. Ishihara, Microporous Mesoporous Mater., 2020, 296, 109802 CrossRef CAS.
- J. Tian, K. B. Tan, Y. Liao, D. Sun and Q. Li, Chemosphere, 2022, 292, 133446 CrossRef CAS PubMed.
- D. Kerstens, B. Smeyers, J. Van Waeyenberg, Q. Zhang, J. Yu and B. F. Sels, Adv. Mater., 2020, 32, 1–47 CrossRef PubMed.
- Q. Almas, C. Sievers and C. W. Jones, Appl. Catal., A, 2019, 571, 107–117 CrossRef CAS.
- M. C. Silaghi, C. Chizallet, J. Sauer and P. Raybaud, J. Catal., 2016, 339, 242–255 CrossRef CAS.
- M. C. Silaghi, C. Chizallet and P. Raybaud, Microporous Mesoporous Mater., 2014, 191, 82–96 CrossRef CAS.
- J. Lin, T. Yang, C. Lin and J. Sun, Catal. Commun., 2018, 115, 82–86 CrossRef CAS.
- Y. Zhang, M. Li, E. Xing, Y. Luo and X. Shu, RSC Adv., 2018, 8, 37842–37854 RSC.
- S. S. Kim, J. Shah and T. J. Pinnavaia, Chem. Mater., 2003, 15, 1664–1668 CrossRef CAS.
- A. Sakthivel, S. J. Huang, W. H. Chen, Z. H. Lan, K. H. Chen, T. W. Kim, R. Ryoo, A. S. T. Chiang and S. Bin Liu, Chem. Mater., 2004, 16, 3168–3175 CrossRef CAS.
- G. Song, W. Chen, P. Dang, Y. Wang and F. Li, R. Soc. Open Sci., 2018, 5(11) DOI:10.1098/rsos.181691.
- M. Yang, B. Wang, F. Hu, X. Mi, H. Liu, H. Liu, X. Gao and C. Xu, Mater. Lett., 2018, 222, 153–155 CrossRef CAS.
- Y. Zhang, X. Han and S. Che, Chem. Commun., 2019, 55, 810–813 RSC.
- L. Meng, X. Zhu, W. Wannapakdee, R. Pestman, M. G. Goesten, L. Gao, A. J. F. van Hoof and E. J. M. Hensen, J. Catal., 2018, 361, 135–142 CrossRef CAS.
- M. Zhou, F. Wang, W. Xiao, L. Gao and G. Xiao, React. Kinet., Mech. Catal., 2016, 119, 699–713 CrossRef CAS.
- K. Miyake, Y. Hirota, Y. Uchida and N. Nishiyama, J. Porous Mater., 2016, 23, 1395–1399 CrossRef CAS.
- X. Niu, F. Feng, G. Yuan, X. Zhang and Q. Wang, Nanomaterials, 2019, 9(3), 362 CrossRef CAS PubMed.
- Y. Shen, H. Li, X. Zhang, X. Wang and G. Lv, Nanoscale, 2020, 12, 5824–5828 RSC.
- R. E. Nugraha, D. Prasetyoko, N. Asikin-Mijan, H. Bahruji, S. Suprapto, Y. H. Taufiq-Yap and A. A. Jalil, Microporous Mesoporous Mater., 2021, 315, 110917 CrossRef CAS.
- J. Zhao, Z. Hua, Z. Liu, Y. Li, L. Guo, W. Bu, X. Cui, M. Ruan, H. Chen and J. Shi, Chem. Commun., 2009, 7578–7580 RSC.
- Y. Yue, Y. Kang, Y. Bai, L. Gu, H. Liu, J. Bao, T. Wang, P. Yuan, H. Zhu, Z. Bai and X. Bao, Appl. Clay Sci., 2018, 158, 177–185 CrossRef CAS.
- S. Li, H. Yang, S. Wang, M. Dong, J. Wang and W. Fan, Microporous Mesoporous Mater., 2022, 329, 111538 CrossRef CAS.
- W. T. Hartati, R. R. Mukti, I. A. Kartika, P. B. D. Firda, S. D. Sumbogo, D. Prasetyoko and H. Bahruji, J. Energy Inst., 2020, 93, 2238–2246 CrossRef CAS.
- P. Peng, Y. Wang, Z. Zhang, K. Qiao, X. Liu, Z. Yan, F. Subhan and S. Komarneni, Chem. Eng. J., 2016, 302, 323–333 CrossRef CAS.
- E. Mohiuddin, Y. M. Isa, M. M. Mdleleni and D. Key, Microporous Mesoporous Mater., 2017, 237, 1–11 CrossRef CAS.
- Y. He, S. Tang, S. Yin and S. Li, J. Cleaner Prod., 2021, 306, 127248 CrossRef CAS.
- C. Zhang, Q. Wu, C. Lei, S. Pan, C. Bian, L. Wang, X. Meng and F. S. Xiao, Ind. Eng. Chem. Res., 2017, 56, 1450–1460 CrossRef CAS.
- M. Hamidzadeh, M. Saeidi and S. Komeili, Mater. Today Commun., 2020, 25, 101308 CrossRef CAS.
- N. A. Sholeha, L. Jannah, H. N. Rohma, N. Widiastuti, D. Prasetyoko, A. A. Jalil and H. Bahruji, Clays Clay Miner., 2020, 68, 513–523 CrossRef.
- W. Li, H. Wang, X. Wu, L. E. Betancourt, C. Tu, M. Liao, X. Cui, F. Li, J. Zheng and R. Li, Fuel, 2020, 274, 117859 CrossRef CAS.
- D. Duan, Y. Zhang, J. Li, L. Huang, Z. Xu, Y. Zhang, W. Sun, Q. Wang and R. Ruan, Fuel, 2023, 331, 125757 CrossRef CAS.
- Z. Chen, Z. Li, Y. Zhang, D. Chevella, G. Li, Y. Chen, X. Guo, J. Liu and J. Yu, Chem. Eng. J., 2020, 388, 124322 CrossRef.
- H. Li, Y. Wang, F. Meng, H. Chen, C. Sun and S. Wang, RSC Adv., 2016, 6, 99129–99138 RSC.
- P. F. Corregidor, E. N. Tolaba, D. E. Acosta and H. A. Destéfanis, Appl. Catal., A, 2020, 602, 117717 CrossRef CAS.
- E. Selli and L. Forni, Microporous Mesoporous Mater., 1999, 31, 129–140 CrossRef CAS.
- J. Zhou, Z. Liu, L. Li, Y. Wang, H. Gao, W. Yang, Z. Xie and Y. Tang, Chin. J. Catal., 2013, 34, 1429–1433 CrossRef CAS.
- I. Qoniah, D. Prasetyoko, H. Bahruji, S. Triwahyono, A. A. Jalil, S. Suprapto, H. Hartati and T. E. Purbaningtias, Appl. Clay Sci., 2015, 118, 290–294 CrossRef CAS.
- G. T. M. Kadja, T. R. Suprianti, M. M. Ilmi, M. Khalil, R. R. Mukti and S. Subagjo, Microporous Mesoporous Mater., 2020, 308, 110550 CrossRef CAS.
- W. Li, F. Li, H. Wang, M. Liao, P. Li, J. Zheng, C. Tu and R. Li, Mol. Catal., 2020, 480, 110642 CrossRef CAS.
- J. Ding, T. Xue, H. Wu and M. He, Chin. J. Catal., 2017, 38, 48–57 CrossRef CAS.
- C. Wang, L. Cao and J. Huang, Surf. Interface Anal., 2017, 49, 1249–1255 CrossRef CAS.
- A. Asranudin, A. S. Purnomo, D. Prasetyoko, H. Bahruji and H. Holilah, Mater. Chem. Phys., 2022, 291, 126749 CrossRef CAS.
- J. Goworek, A. Kierys, W. Gac, A. Borówka and R. Kusak, J. Therm. Anal. Calorim., 2009, 96, 375–382 CrossRef CAS.
- M. R. Sakha, S. Soltanali, D. Salari, M. Rashidzadeh and P. H. Tabrizi, J. Solid State Chem., 2021, 301, 122342 CrossRef CAS.
- Y. Yan, R. Cai, Y. Liu and S. Gu, J. Am. Chem. Soc., 2010, 132, 12776–12777 CrossRef PubMed.
- J. El Hage-Al Asswad, N. Dewaele, J. B. Nagy, R. A. Hubert, Z. Gabelica, E. G. Derouane, F. Crea, R. Aiello and A. Nastro, Zeolites, 1988, 8, 221–227 CrossRef CAS.
- T. Li, J. Cheng, R. Huang, W. Yang, J. Zhou and K. Cen, Int. J. Hydrogen Energy, 2016, 41, 21883–21887 CrossRef CAS.
- H. Chen, Y. Wang, C. Sun, X. Wang and C. Wang, Catal. Commun., 2018, 112, 10–14 CrossRef CAS.
- H. Sharbini Kamaluddin, X. Gong, P. Ma, K. Narasimharao, A. Dutta Chowdhury and M. Mokhtar, Mater. Today Chem., 2022, 26 DOI:10.1016/j.mtchem.2022.101061.
- N. Mo and P. E. Savage, ACS Sustainable Chem. Eng., 2014, 2, 88–94 CrossRef CAS.
- D. B. Lukyanov, N. S. Gnep and M. R. Guisnet, Ind. Eng. Chem. Res., 1994, 33, 223–234 CrossRef CAS.
- D. Zeng, G. Zhu and C. Xia, Fuel Process. Technol., 2022, 226, 107087 CrossRef CAS.
- B. Valle, A. Remiro, N. García-Gómez, A. G. Gayubo and J. Bilbao, J. Chem. Technol. Biotechnol., 2019, 94, 670–689 CrossRef CAS.
- J. Zhang, C. Li, H. Yuan and Y. Chen, Renewable Energy, 2022, 184, 280–290 CrossRef CAS.
- J. Abbot and B. W. Wojciechowski, J. Catal., 1989, 115, 1–15 CrossRef CAS.
- S. Khan, K. M. Qureshi, A. N. Kay Lup, M. F. A. Patah and W. M. A. Wan Daud, Biomass Bioenergy, 2022, 164, 106563 CrossRef CAS.
- X. Wu, P. Jiang, F. Jin, J. Liu, Y. Zhang, L. Zhu, T. Xia, K. Shao, T. Wang and Q. Li, Fuel, 2017, 188, 205–211 CrossRef CAS.
- R. Edra Nugraha, D. Prasetyoko, H. Bahruji, S. Suprapto, N. Asikin-Mijan, T. P. Oetami, A. Abdul Jalil, D.-V. N. Vo and Y. Hin Taufiq-Yap, RSC Adv., 2021, 11, 21885–21896 RSC.
- T. Xue, H. Liu, Y. Zhang, H. Wu, P. Wu and M. He, Microporous Mesoporous Mater., 2017, 242, 190–199 CrossRef CAS.
- M. H. Nada and S. C. Larsen, Microporous Mesoporous Mater., 2017, 239, 444–452 CrossRef CAS.
- M. Safa Gamal, N. Asikin-Mijan, M. Arumugam, U. Rashid and Y. H. Taufiq-Yap, J. Anal. Appl. Pyrolysis, 2019, 144, 104690 CrossRef CAS.
- H. Wang, H. Lin, Y. Zheng, S. Ng, H. Brown and Y. Xia, Catal. Today, 2019, 319, 164–171 CrossRef CAS.
| This journal is © The Royal Society of Chemistry 2023 |

