
 Open Access Article
 This Open Access Article is licensed under a Creative Commons Attribution-Non Commercial 3.0 Unported Licence
A novel method for synthesis of carbon dots and their applications in reactive oxygen species (ROS) and glucose detections
Chao-Sheng Chena,
Aaron Shinnosuke Yokokawab,
Kuan-Hsun Tsengc,
Ming-Hsu Wangd,
Kevin Sheng-Kai Maef and
Chin-Feng Wan *g
*g
aDepartment of Life Science, Imperial College London, London, UK
bDepartment of Electrical Engineering, National Sun Yat-sen University, Kaohsiung, Taiwan
cDepartment of Life Science, National Taiwan Normal University, Taipei, Taiwan
dCenter for General Education, Affiliated with College of Interdisciplinary Studies, Taipei Medical University, Taipei, Taiwan
eGraduate Institute of Biomedical Electronics and Bioinformatics, National Taiwan University, Taipei, Taiwan
fDepartment of Dentistry, Chung Shan Medical University and Hospital, Taichung, Taiwan
gDepartment of Medical Applied Chemistry, Chung Shan Medical University, Taichung, Taiwan. E-mail: jeanwan04@gmail.com
First published on 25th September 2023
Abstract
A simple and novel method is proposed for preparation of water-soluble fluorescent carbon dots (C-dots), which have potential to be applied in detecting reactive oxygen species (ROS). The C-dots with high fluorescence quantum yield were created by hydrothermal methods with lactose as the carbon source and tris(hydroxylmethyl)aminomethane (Tris) as the surface passivation reagent. The C-dots have some unique characteristics such as excellent biocompatibility with a broad pH working range of 5–11 and high fluorescence, which makes them especially useful in the bio-detection field. The optical properties, surface groups, and element components of the prepared C-dots have been systematically studied by fluorescence spectroscopy. This facile approach is efficient and environmentally friendly and allows large-scale production of the C-dots without any further post-treatment. The C-dots have been adopted as probes for fluorescence turn-off detection owing to their high sensitivity to the hydroxyl radical. The detection limit can reach ∼0.1 μM under optimized conditions when using hydrogen peroxide as the source for generating ROS. Moreover, when paired with glucose oxidase, these C-dots can track glucose concentrations in samples. This adaptability suggests their potential in detecting various metabolites, paving the way for practical uses in disease detection.
1. Introduction
1.1 Carbon dots
Carbon dots (C-dots), a new type of fluorescent carbon nanoparticle, have garnered considerable attention since they were first reported in 2004 by Xu et al.,1 who were purifying single-walled carbon nanotubes. In the last few years, C-dots have been explored because of their facile synthesis, easy surface modification, favorable optical properties, high biocompatibility, outstanding water solubility, low toxicity, and eco-friendly nature. These properties make C-dots a better candidate than the well-known semiconductor quantum dots for various applications,2–9 including small-molecule sensing, photocatalytic reactions, and biological applications such as biomolecular sensing, cellular imaging, photothermal therapy, and photodynamic therapy. Moreover, the facile and low-cost synthesis of C-dots offers a unique advantage in nanotechnology in terms of rapid and cost-effective production.Multiple methods have been developed for creating customized C-dots with specific properties suited for various applications. Broadly speaking, these widely recognized synthesis approaches for C-dots can be categorized as either “top-down” or “bottom-up” strategies.10 Unlike top-down synthesis methods, bottom-up approaches employing carefully controlled synthetic conditions with small organic precursors enable the creation of more homogeneous C-dots and allow a diverse range of functional groups on their surface. The precursors initiate chemical transformations, fragmentation, and self-assembly processes under high-temperature and high-pressure conditions, leading to the formation of small carbonaceous structures. The carbon-rich intermediates undergo further reactions that result in the formation of small carbon clusters or nanoparticles. These clusters can be stabilized and passivated by the reaction with functional groups present in the reaction mixture. Surface passivation agents, such as organic molecules or polymers, may also be present in the reaction mixture. These passivating agents can adsorb onto the growing carbon dots' surface, stabilizing the structure and preventing further uncontrolled growth.10,11
1.2 Reactive oxygen species
Reactive oxygen species (ROS) are naturally produced during the typical oxygen metabolism and play roles in various physiological processes and diseases.12–14 Although ROS can be harmful when they are abundant, they are key signaling molecules. Therefore, the maintenance of suitable ROS levels is crucial to the integrity and survival of living organisms. Aberrant levels of ROS are associated with various pathological processes. For instance, the currently aggressive use of antibiotics, antivirals, and chemotherapeutic drugs may cause unwanted tissue inflammation and organ (e.g., liver and kidney) injury, thus increasing the in vivo levels of ROS and resulting in an additional stress burden. Therefore, real-time and deep-tissue imaging techniques are urgently needed for monitoring the in vivo levels of ROS; such monitoring is important for exploring various biological processes, treating several diseases, and evaluating drug toxicities. Furthermore, because of the distinct sources and biological effects of ROS, differential visualization of ROS may offer additional insights that could shed light on how ROS impact on relevant biological processes.12–14 Considerable effort has been invested in this field. Several imaging probes have been developed that can detect various types of ROS (e.g., H2O2, OH˙, O3 etc.). And these probes offer potential solutions for the in vivo detection of ROS.15–17 Most of these probes contain fluorescent dyes or nanoparticles.
In this study, we introduce a straightforward hydrothermal technique to produce highly fluorescent C-dots using a mixture of lactose and Tris. These C-dots serve as effective probes for fluorescence turn-off detection due to their sensitivity to the hydroxyl radical. Notably, the fluorescence intensity of these C-dots diminishes in the presence of the hydroxyl radical, allowing for the real-time tracking of glucose levels when the C-dots are coupled with glucose oxidase (as depicted in Scheme 1). The C-dots sensor can distinctly identify glucose even when mixed with up to three other saccharides, all without the need for prior sample preparation. We anticipate these C-dots to be versatile tools for broad metabolite monitoring. Their low toxicity also suggests potential applications in diverse detection methodologies.
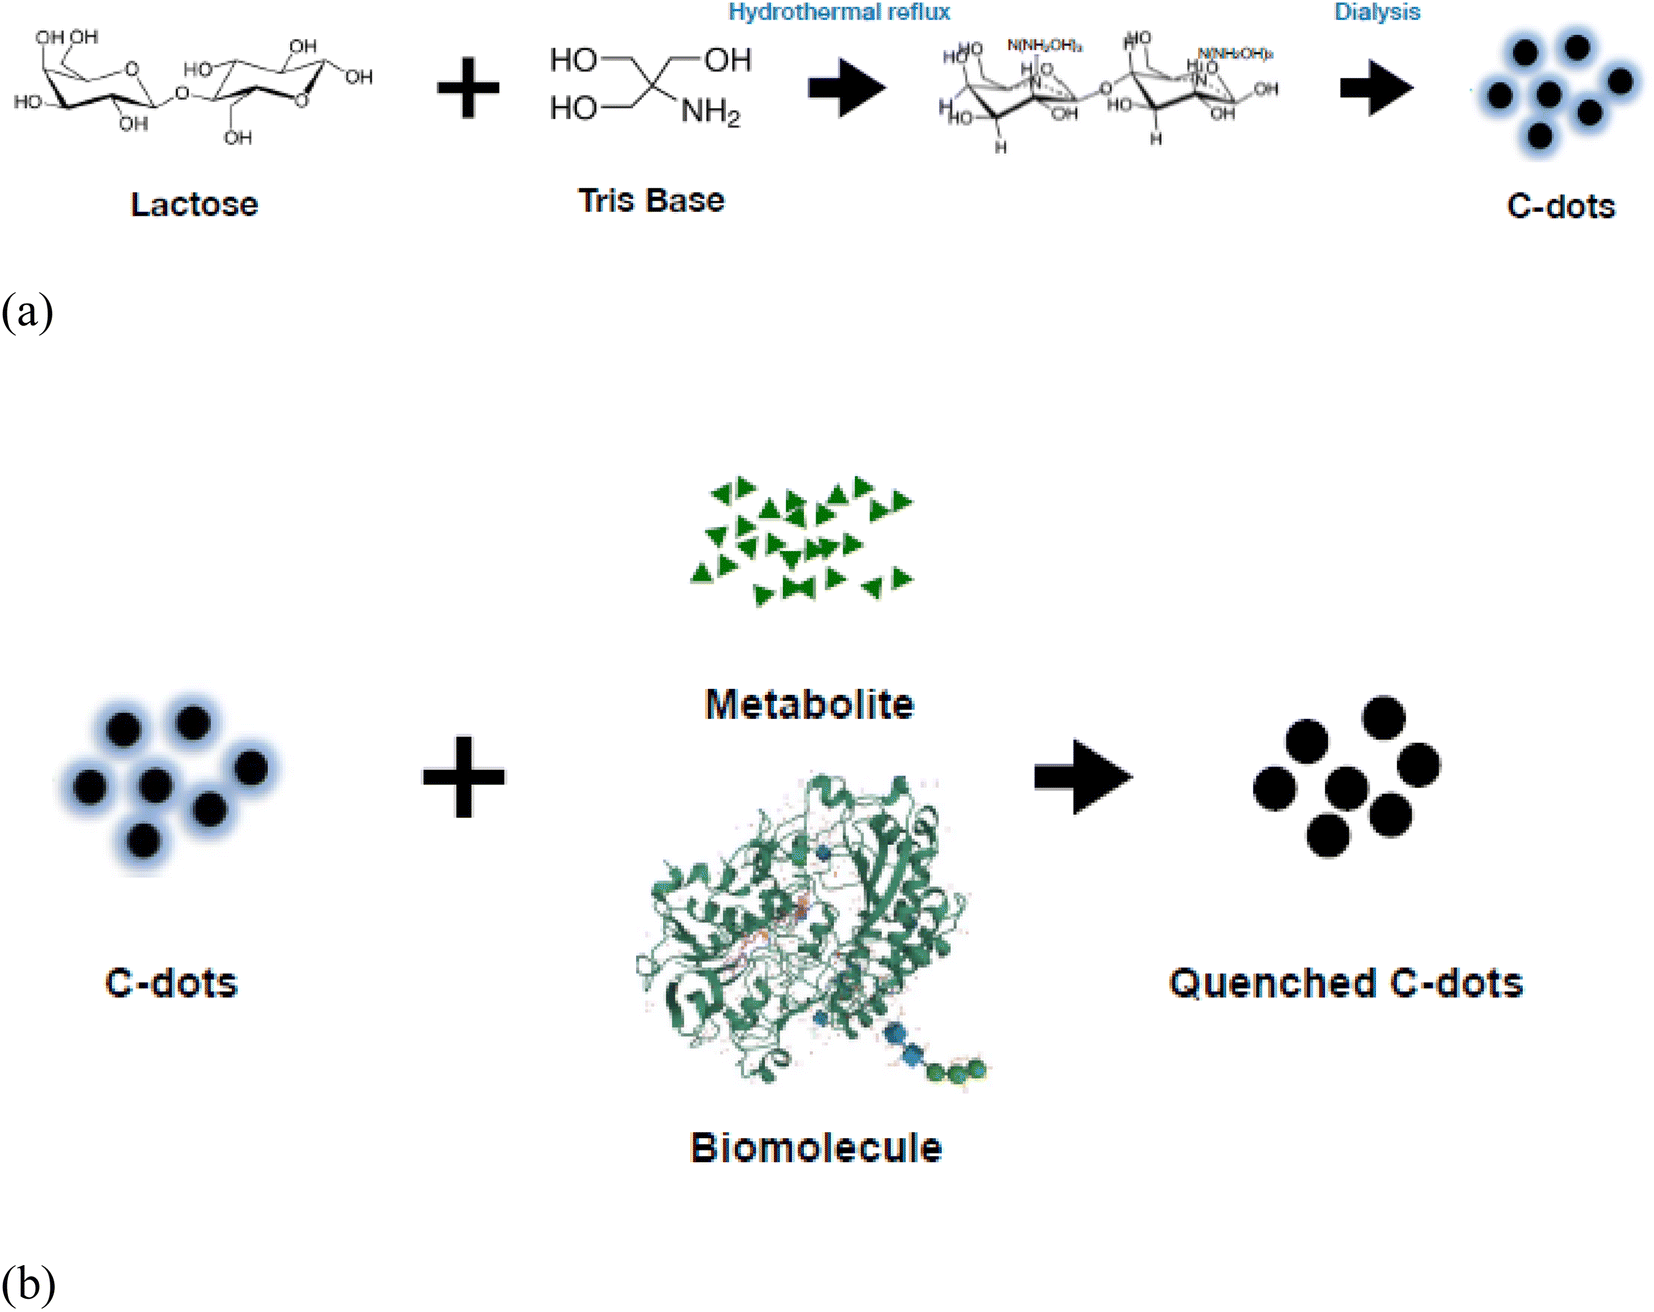 | ||
| Scheme 1 (a) Green synthesis of carbon dots. (b) Mechanisms underlying the reaction between metabolite, biomolecule and the C-dots. | ||
2. Materials and methods
2.1 Reagents and chemicals
Lactose, Na2HPO4, NaH2PO4, potassium phosphate, Tris–HCl, and NaHCO3 were purchased from Sigma-Aldrich. β-Glucose oxidase was obtained from Sigma-Aldrich. Dialysis membrane pre-treated RC tubing MWCO: 1 kDa (vol/length: 4.6 mL cm−1) was purchased from Spectrum Laboratories, Inc., Rancho Dominguez, CA, USA. Luminescent C-dots were synthesized in our laboratory. All reagents were of analytical grade or higher and used as received without further treatment.2.2 Instrumentation
All fluorescence experiments were performed using the Hitachi 2500 spectrometer. Ultraviolet-visible (UV-vis) spectroscopic analyses were performed using the SPECTROstar Nano (BMG LABTECH, Germany). High performance liquid chromatography (HPLC) experiments were performed using the Shimadzu, SPD-20, LC-20AT, C-18 column.2.3 Synthesis and purification of luminescent C-dots
Luminescent C-dots were synthesized via a single-step hydrothermal pathway (Scheme 1). In brief, 0.125 g of lactose and 2.0 g of Tris were dissolved in 40 mL pure water in a round bottom flask. The pH of the mixture was 10.5. It was hydrothermally refluxed at 100 °C with stirring for 8 hours until the colorless solution turned yellow. The boiling-hot C-dot solution was maintained at 25 °C for 3 days until the lactose had reacted completely with Tris. The pH was neutralized with HCl and dialyzed against pure water. The purification phase extended over 11 hours, utilizing a dialysis membrane pre-treated RC tubing with a 65 mL capacity (with MWCO 1 kDa). To ensure the comprehensive purification of the C-dots, a combination of fluorescence spectroscopy and HPLC chromatography systems tracked the process at intervals: 0 hours, 7 hours, 10 hours, and 11 hours into the dialysis.2.4 Analysis and characterization of C-dots
The synthesized C-dots were subjected to further analysis by TEM, FT-IR, XPS and XRD. X-ray diffraction (XRD) patterns were measured on a D2 diffractometer (Bruker-D2 Phaser, Germany) using Cu Kα radiation (30 kV, 10 mA, and 2 theta). The molecular structures of the C-dots synthesized were detected by a FT-IR spectrometer (Bruker Optics FT-IR, Alpha OPUS, Germany). The spectra (over the range 600–4000 cm−1) were collected by scans with a resolution of 2 cm−1. The Escalab 250 X-ray photoelectron spectrometer (XPS) (ULVAC PHI, Versa Probe 4 Japan) with a mono X-ray source Al Kα excitation (0.5 eV, Ag 3d5/2) was used to characterize the content and the types of bonding of various elements in the samples. For morphological investigation, transmission electron microscope (TEM) images were provided which were obtained on a HT 7700 transmission electron microscope (HITACHI, Japan).2.5 Stability of C-dots
To evaluate the stability of the synthesized C-dots, their response to changes in pH, ionic strength, and exposure duration was investigated. The C-dots solution was subjected to different pH levels (pH 5, 7, 9, and 11) by adjusting with hydrochloric acid (HCl) and sodium hydroxide (NaOH). Subsequently, the UV absorbance and fluorescence intensity of the C-dots sample were measured after a 10 minute interval. The impact of ionic strength on C-dots was further studied using potassium chloride (KCl). Various KCl solutions were prepared at concentrations of 0.2 M, 0.4 M, 0.6 M, 0.8 M, and 1.0 M. Subsequently, 5 mL of C-dots solution was added to each KCl solution in centrifugal tubes. The resulting mixtures were allowed to react for 10 minutes and subjected to UV-vis spectroscopy and photoluminescence spectrum measurements upon excitation at 348 nm.To verify the photo stability of the C-dots, the C-dots solution was exposed to continuous UV radiation for a duration of 180 minutes to exam its photo stability. At intervals of 15 minutes, 1 mL of the solution was extracted to measure its UV absorption and photoluminescence intensity. This step was repeated throughout the entire 180 minute exposure period to monitor any changes in the UV absorption and photoluminescence properties of the C-dots over time.
2.6 Selectivity and interference measurements of C-dots
For the selectivity test, a mixture of 300 μL glucose (0.1 M) and 25 μL of glucose oxidase (0.1 g/5 mL) solution was added into a cuvette, allowing the enzyme reaction to proceed for roughly 30 minutes. Separate aliquots of different ion solutions, including uric acid, L-ascorbic acid, Fe3+, Ca2+, Pb2+, Mg2+, and K+ (each at 100 μL and 1 × 10⁻⁵ M), were each mixed with 300 μL of the C-dots, and then combined with the pre-incubated enzyme reaction solution. The fluorescence intensity of individual mixtures was subsequently recorded. The interference of different ions on C-dot's H2O2 detection was determined by comparing fluorescence intensities of individual C-dots/enzyme reaction mixture containing different ions.2.7 Preparation and characterization of β-glucose oxidase/C-dots biocomposite
The C-dots (2 mg mL−1) were subjected to sonication, centrifugation, and dialysis to remove small unreacted lactose particles and were then stirred for 30 min. Afterward, freshly prepared β-glucose oxidase solution (20 mg mL−1) was mixed with 0.1 M glucose for 30 min then added the C-dots solution and stirred for 1 min. The hybrid biocomposite was sonicated and centrifuged at 1500 rpm to remove aggregates. Samples of this mixture were carefully collected and analyzed using UV-vis spectroscopy and fluorescence spectroscopy to verify that the β-glucose oxidase had reacted completely with the C-dots. All experiments were performed at least triplicate to ensure reproducibility. Scheme 1 presents a schematic showing the mechanisms underlying the reaction between β-glucose oxidase and the C-dots.2.8 β-Glucose oxidase/C-dots biocomposite stability in pH buffers
The stability of the aforementioned biocomposite was evaluated at seven pHs: those of pH 5, 6, 7, 8, 9, 10, and 11. The aqueous pH was established at 0.05 M by using the following buffers: Na2HPO4 + NaH2PO4 (pH 5.0), Na2HPO4 + NaH2PO4 (pH 6.0), potassium phosphate (pH 7.0), HCl + Tris (pH 8.0 and 9.0), and NaHCO3 (pH 10.0 and 11.0); the ionic strength was adjusted to 0.20 M by using NaCl.3. Results and discussion
3.1 Purification and characterization of the synthesized C-dots
The emergence of unwanted byproducts, residual precursors, or impurities is a common occurrence during the synthesis of C-dots. Therefore, it is necessary to further purify the reaction products via dialysis before further applications. The results for these C-dots, both from fluorescence spectrophotometer and HPLC, are depicted in Fig. 1 at intervals of 0 h, 7 h, 10 h, and 11 h post-dialysis. Interestingly, Beatrice Bartolomei and Maurizio Prato18 noted that C-dots derived from RR-Dphen, o-phenylenediamine (o-PDA) and L-Trp require approximately 120 h for complete purification, a duration surpassing the usual dialysis timeframes typically mentioned in C-dot studies. This finding suggests that many purification efforts might not be thorough enough.18 In contrast, our HPLC results demonstrated that a maximum of 11 h was needed to purify our sample of carbon dots. This purification duration, while considerable, is still shorter than the ∼120 h cited by Beatrice Bartolomei and Maurizio Prato.18 for C-dots synthesized through bottom-up techniques. Although top-down synthesis methods tend to yield a higher product volume, carbon dots produced via the bottom-up approach often possess superior purity.19 Additionally, when carbon dots are derived using biomass, chiral or waste materials instead of refined chemicals, the synthesis might introduce a variety of contaminants. Consequently, deriving carbon dots from such biomass, chiral or waste materials remains a challenge due to these potential impurities, necessitating extended purification times.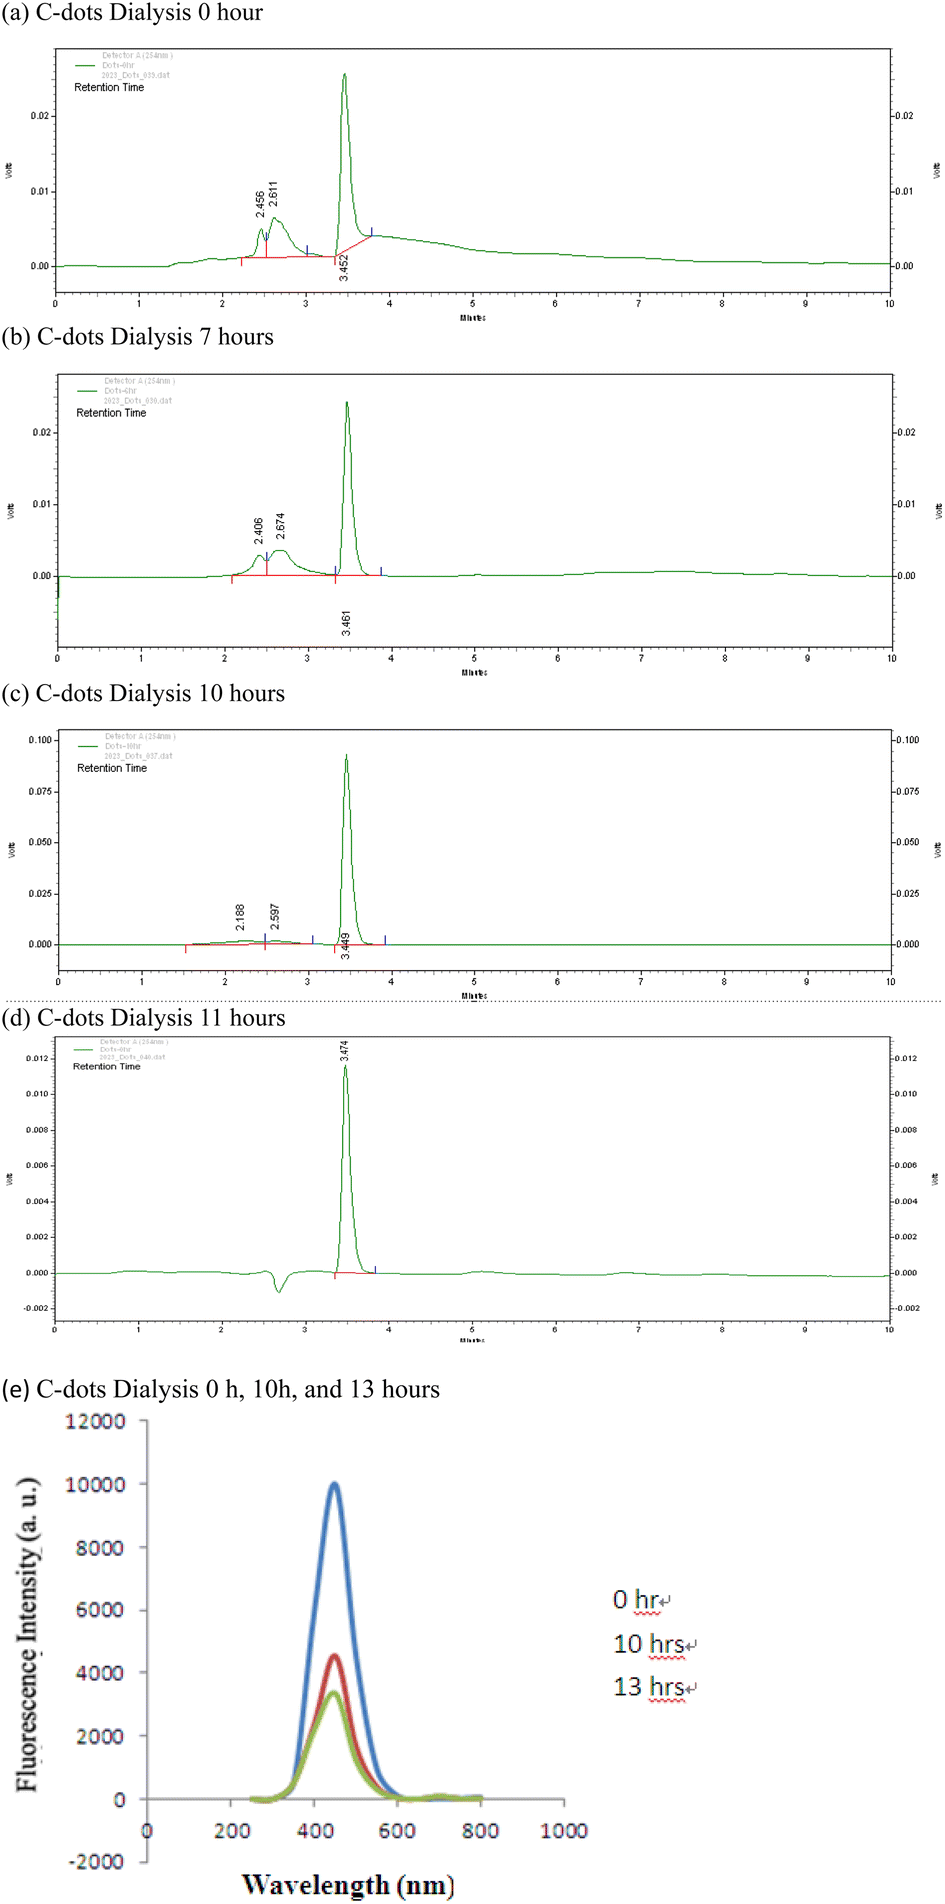 | ||
| Fig. 1 HPLC chromatogram (a–d) and fluorescence spectrophotometer (e) of C-dots at different dialysis times. | ||
The purified C-dots were further subjected to several different analysis. Transmission electron microscopy (TEM), FT-IR, X-ray photoelectron spectroscopy (XPS), and X-ray diffraction (XRD) results show that the core of C-dots is carbon, and the surface groups are functionalized by simple oxygen-related groups. The results confirm that C-dots have inherent visible emission spectra at 438 nm. This study provides a new way to prepare visible-emitting C-dots, which will greatly promote the application of C-dots (Fig. 2–5).
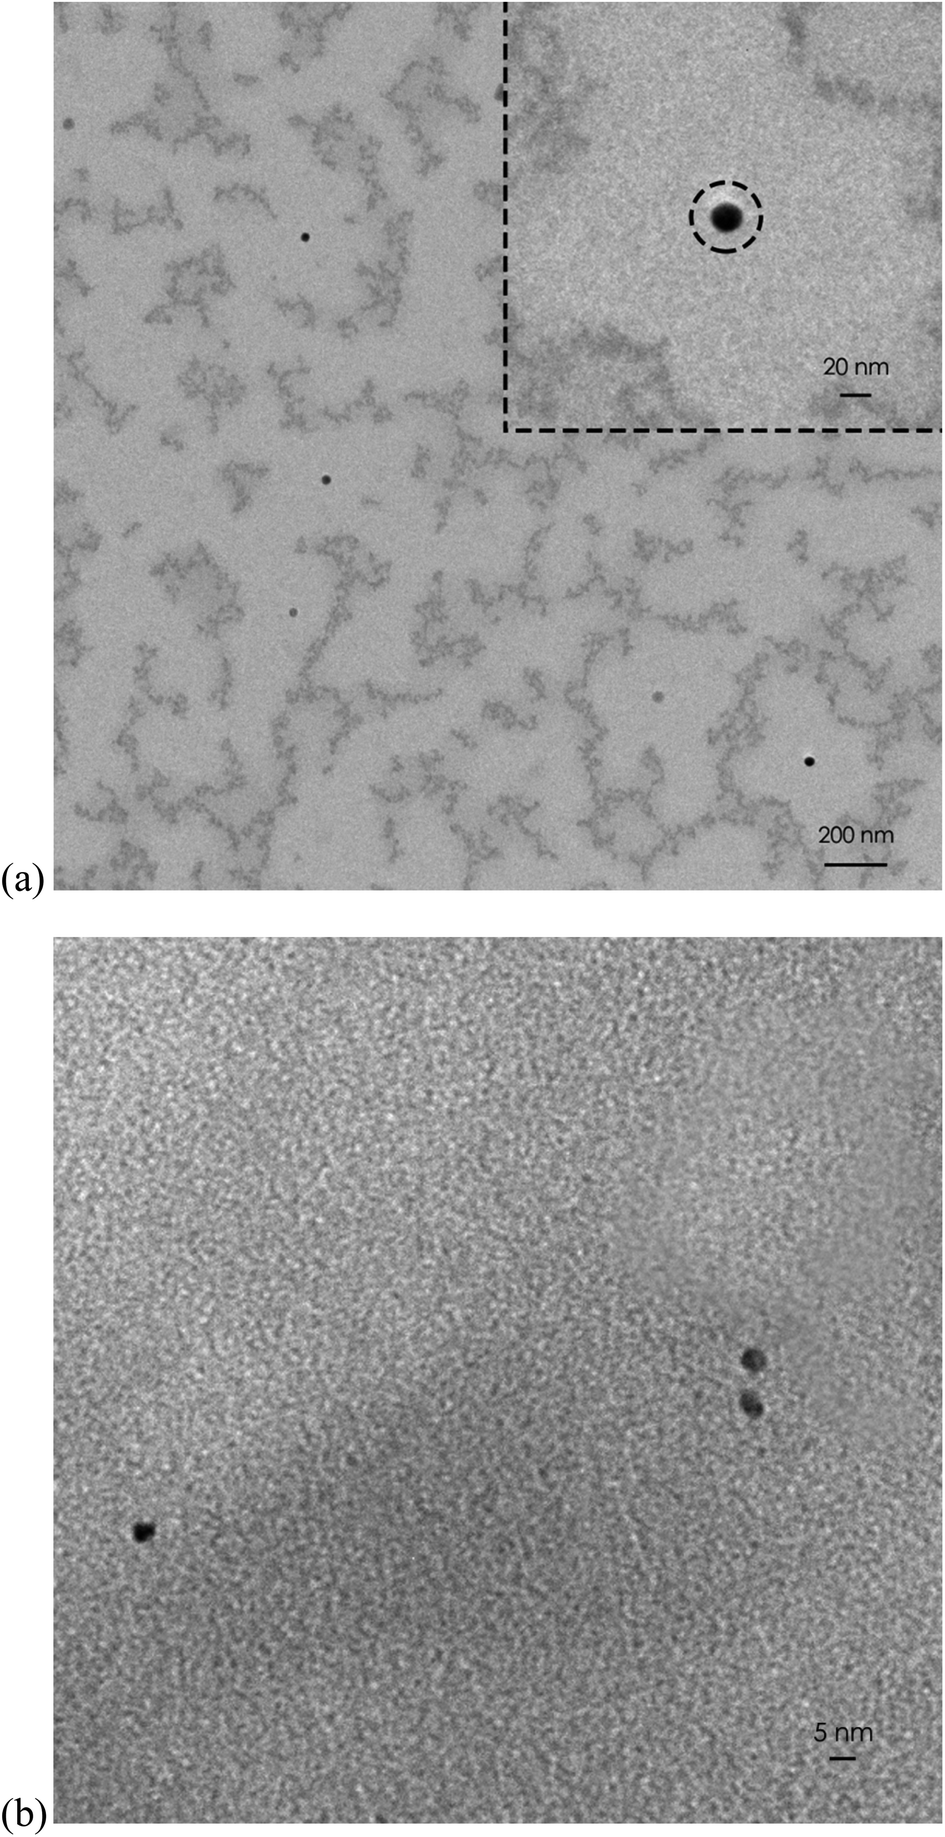 | ||
| Fig. 2 TEM image of the C-dots (a) 20 nm (b) 5 nm. | ||
![[double bond, length as m-dash]](https://www.rsc.org/images/entities/char_e001.gif) C bonds. Additionally, the faint absorption observed between 1200 and 1500 cm−1 is likely associated with C–C bonds. The peak around 1100 cm−1 could be corresponding to the presence of C–O, C–C, and C–N bonds. The FTIR analysis results suggest that a considerable amount of O–H, N–H, and C–N functional groups are present on the surface of the synthesized carbon dots. These groups also contribute to the high solubility of the C-dots.
C bonds. Additionally, the faint absorption observed between 1200 and 1500 cm−1 is likely associated with C–C bonds. The peak around 1100 cm−1 could be corresponding to the presence of C–O, C–C, and C–N bonds. The FTIR analysis results suggest that a considerable amount of O–H, N–H, and C–N functional groups are present on the surface of the synthesized carbon dots. These groups also contribute to the high solubility of the C-dots.
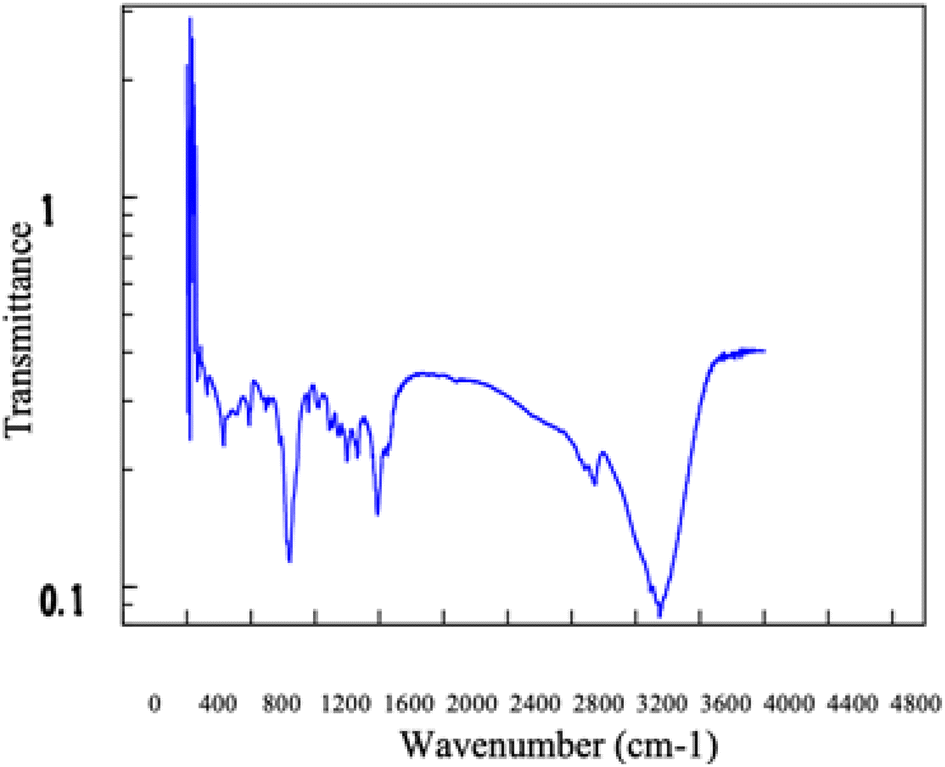 | ||
| Fig. 3 FTIR spectrum of sample C-dots. | ||
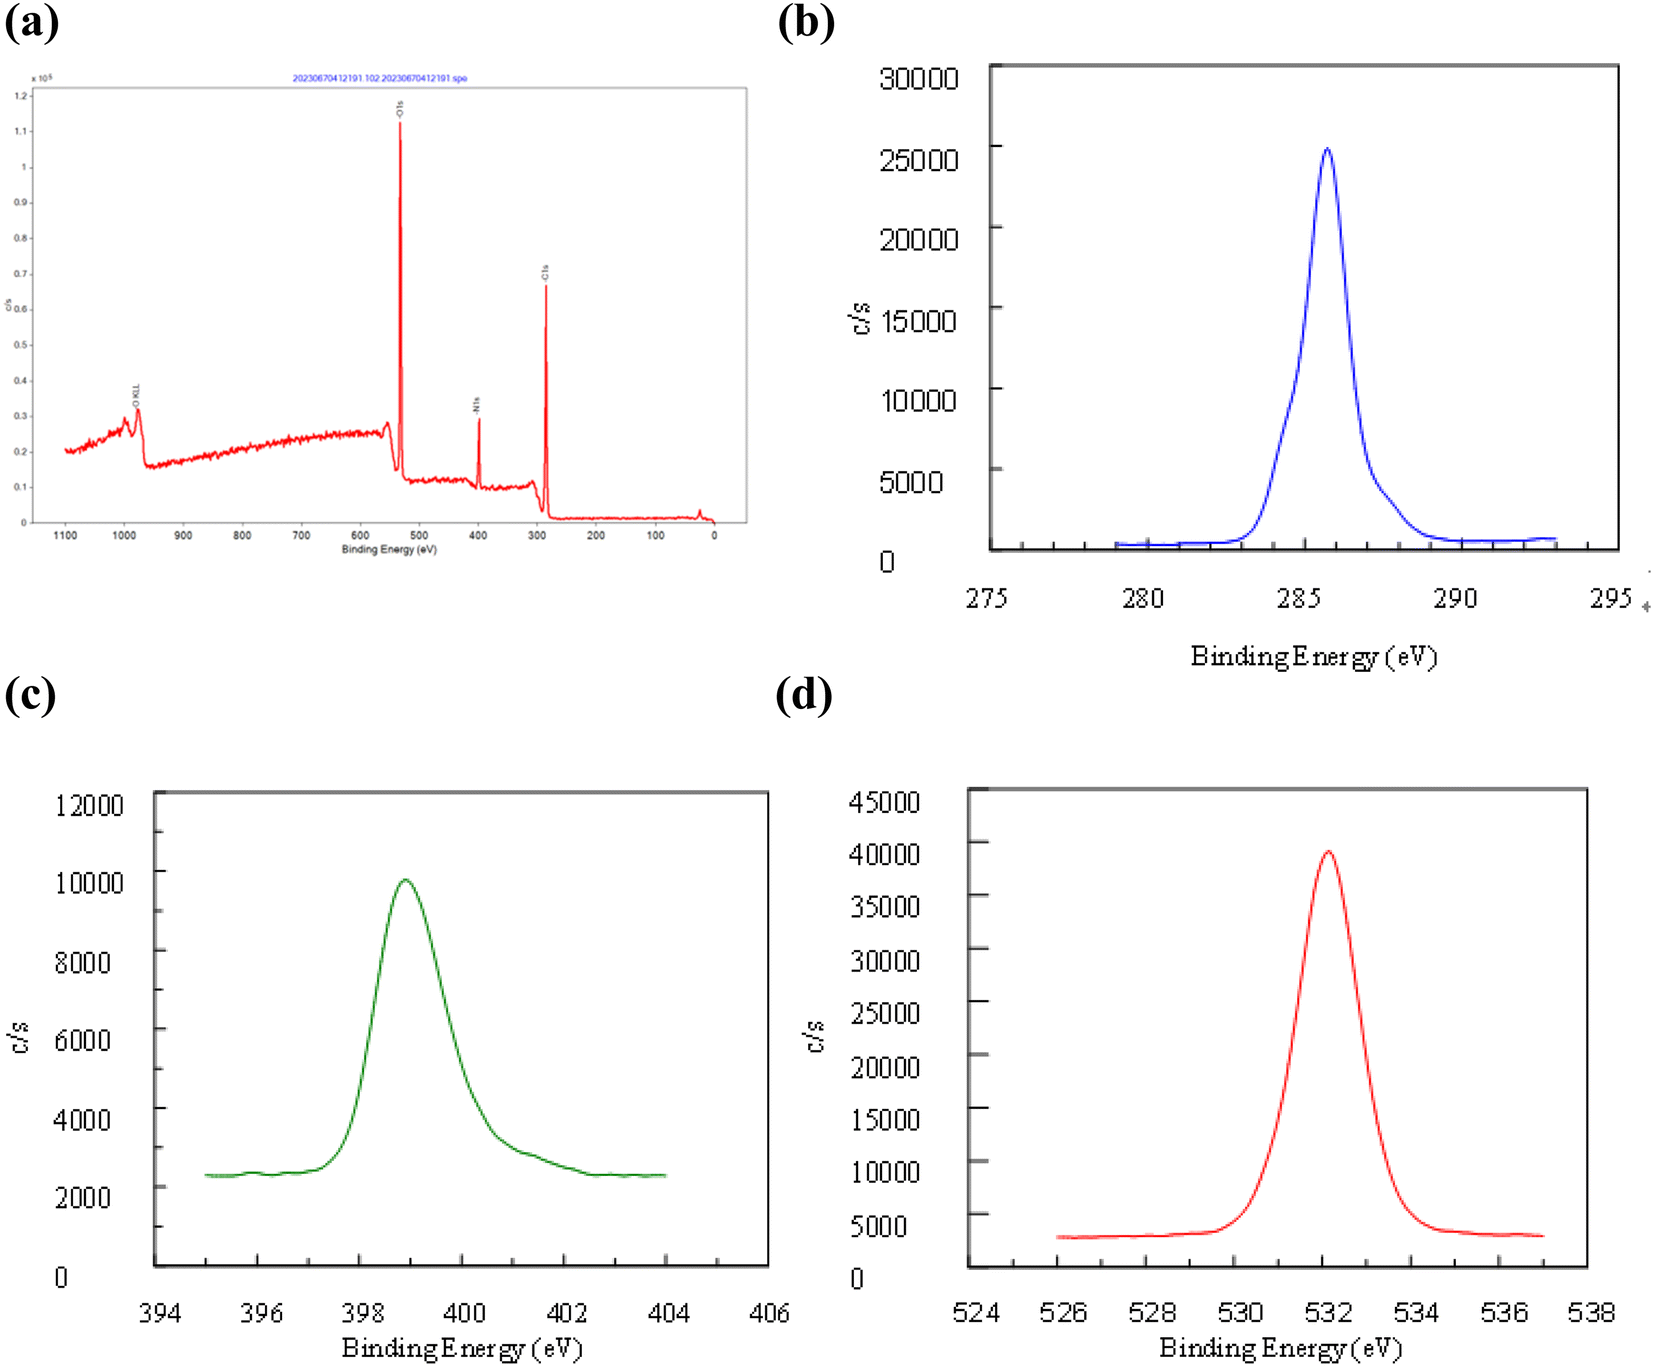 | ||
| Fig. 4 XPS full spectrum (a), fine spectrum of C 1s (b), fine spectrum of N 1s (c), fine spectrum of O 1s (d) of C-dots. | ||
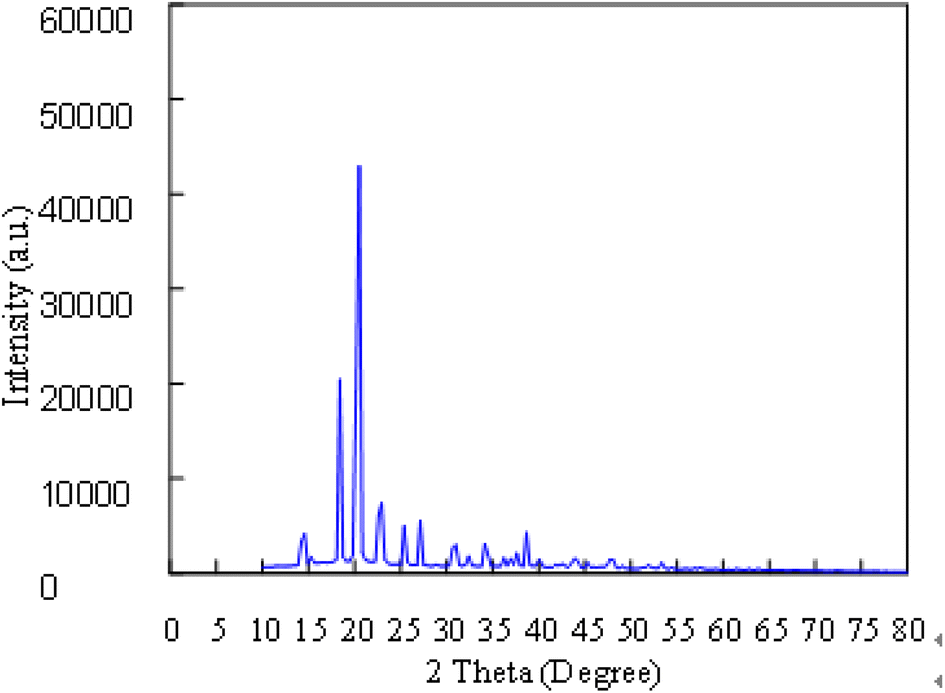 | ||
| Fig. 5 XRD of the C-dots showing typical Bragg's reflections. | ||
3.2 Formation of C-dots – impacts of carbon sources and surface passivation reagents
In current study, we utilized a “bottom-up” strategy to synthesize C-dots through a straightforward hydrothermal process. Three different carbon sources: lactose, glucose, and sucrose, were tested in conjunction with the Tris base for surface passivation. Successful C-dot synthesis was achieved using either lactose or glucose under our experimental conditions. Notably, although lactose and sucrose share an isomeric structure (C12H22O11), they yielded differing results. Lactose-derived C-dots possess strong fluorescence, while those from sucrose did not. This discrepancy can be attributed to the following two reasons:(1) Lactose interacts with Tris to form a pyrrolic ring. In contrast, the planar tetrahydrofuran ring in sucrose prevents pyrrolic ring formation. Additionally, the α-1,4-glycosidic bond in sucrose challenges carbon core passivation as it positions the hydrogen atoms linked to C1 and C5 on opposite sides of the ring.
(2) Lactose contains an active hydroxyl group within its hemiacetal structure, a feature absents in sucrose. Under the gentle conditions of our study, this hydroxyl group might have significantly impacted carbon core formation by triggering a condensation reaction between two saccharides before carbonization.
Additionally, as depicted in Fig. 6(a), substituting glucose with lactose led to a quantum yield surge in C-dots by roughly 45.3% (from 8.6% to 12.5%). This increase might stem from glucose's aqueous solution state. Unlike lactose's two relatively stable rings, glucose exists partly as a chain structure, which isn't ideal for carbonization and forming a consistent carbon core. Under basic conditions, glucose might transform into mannose and fructose via epimerization, as shown in Fig. 7.24 These monosaccharides may not interact well with Tris base due to their structural properties, resulting in lower quantum yields in glucose-derived C-dots compared to those synthesized using lactose.
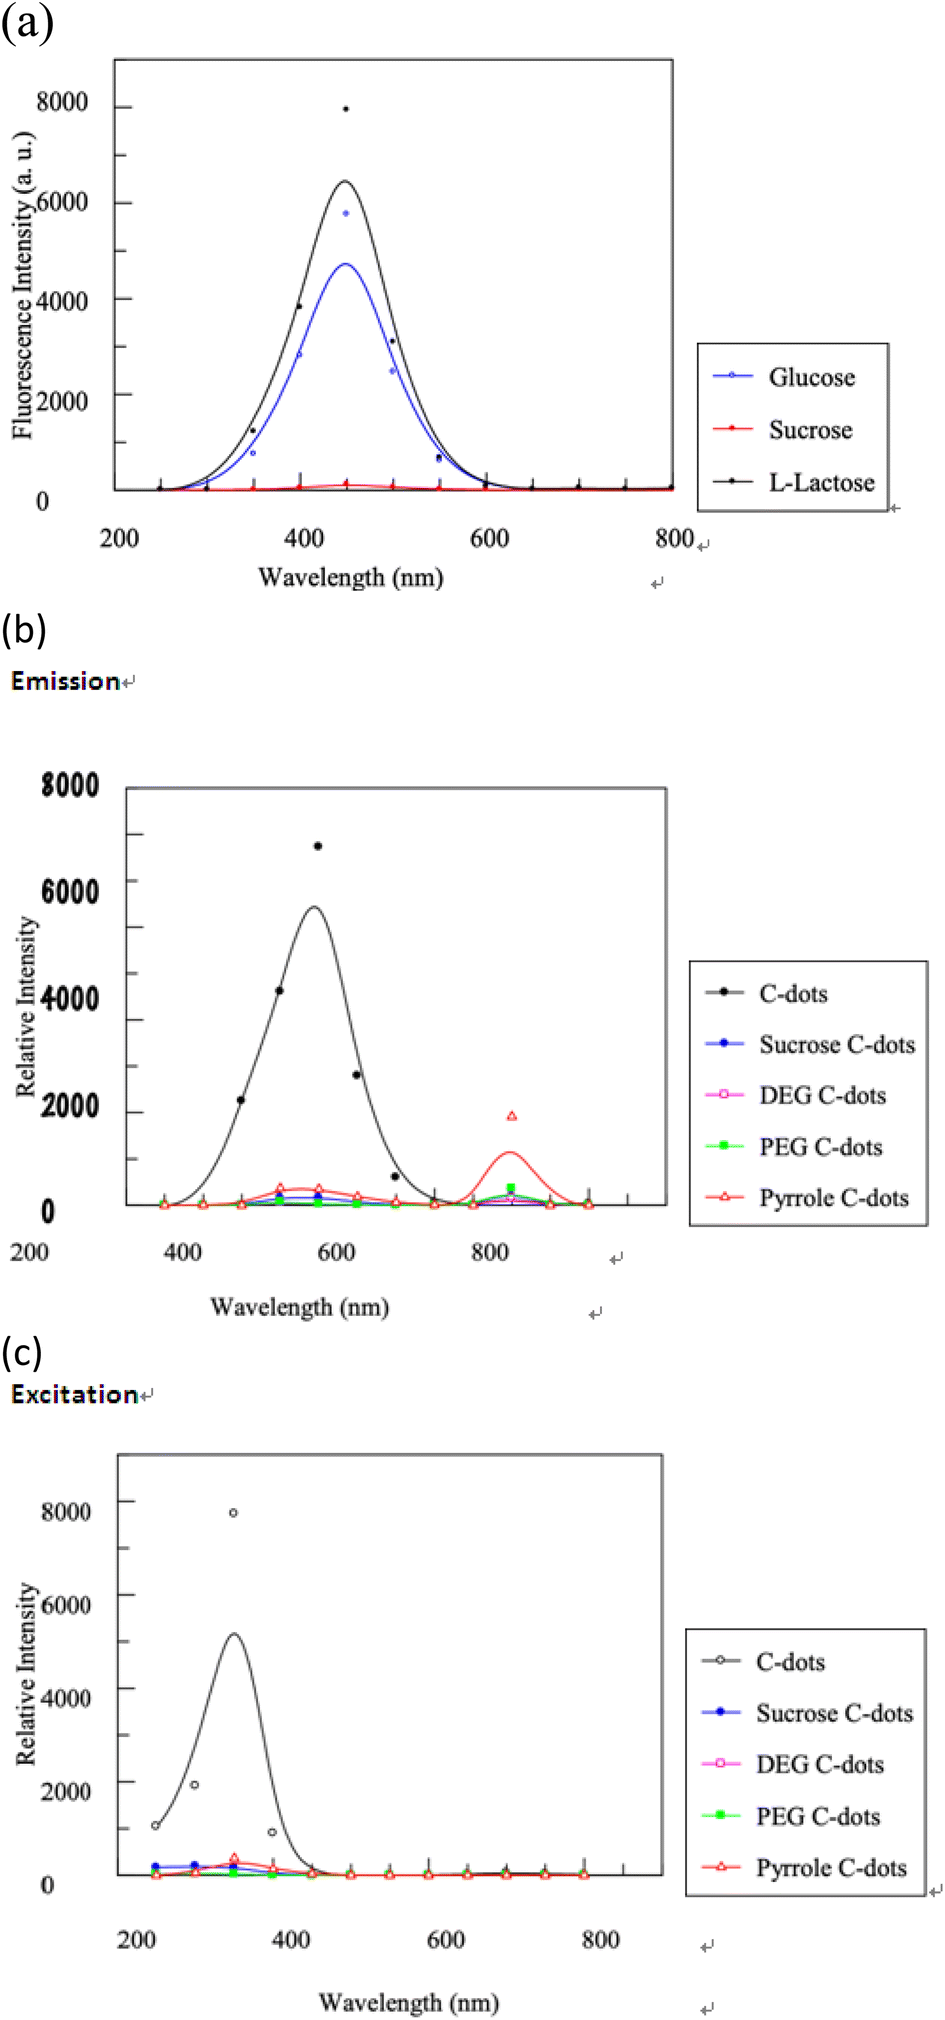 | ||
| Fig. 6 Three types of carbon source: lactose (black), glucose (blue), and sucrose (red) and found that C-dots could be successfully synthesized using only lactose or glucose (a). Three small organic compounds as potential surface passivation agents: Tris base, diethylene glycol, and polyethylene glycol (PEG-200) were also examined fluorescence C-dots effective (b and c). | ||
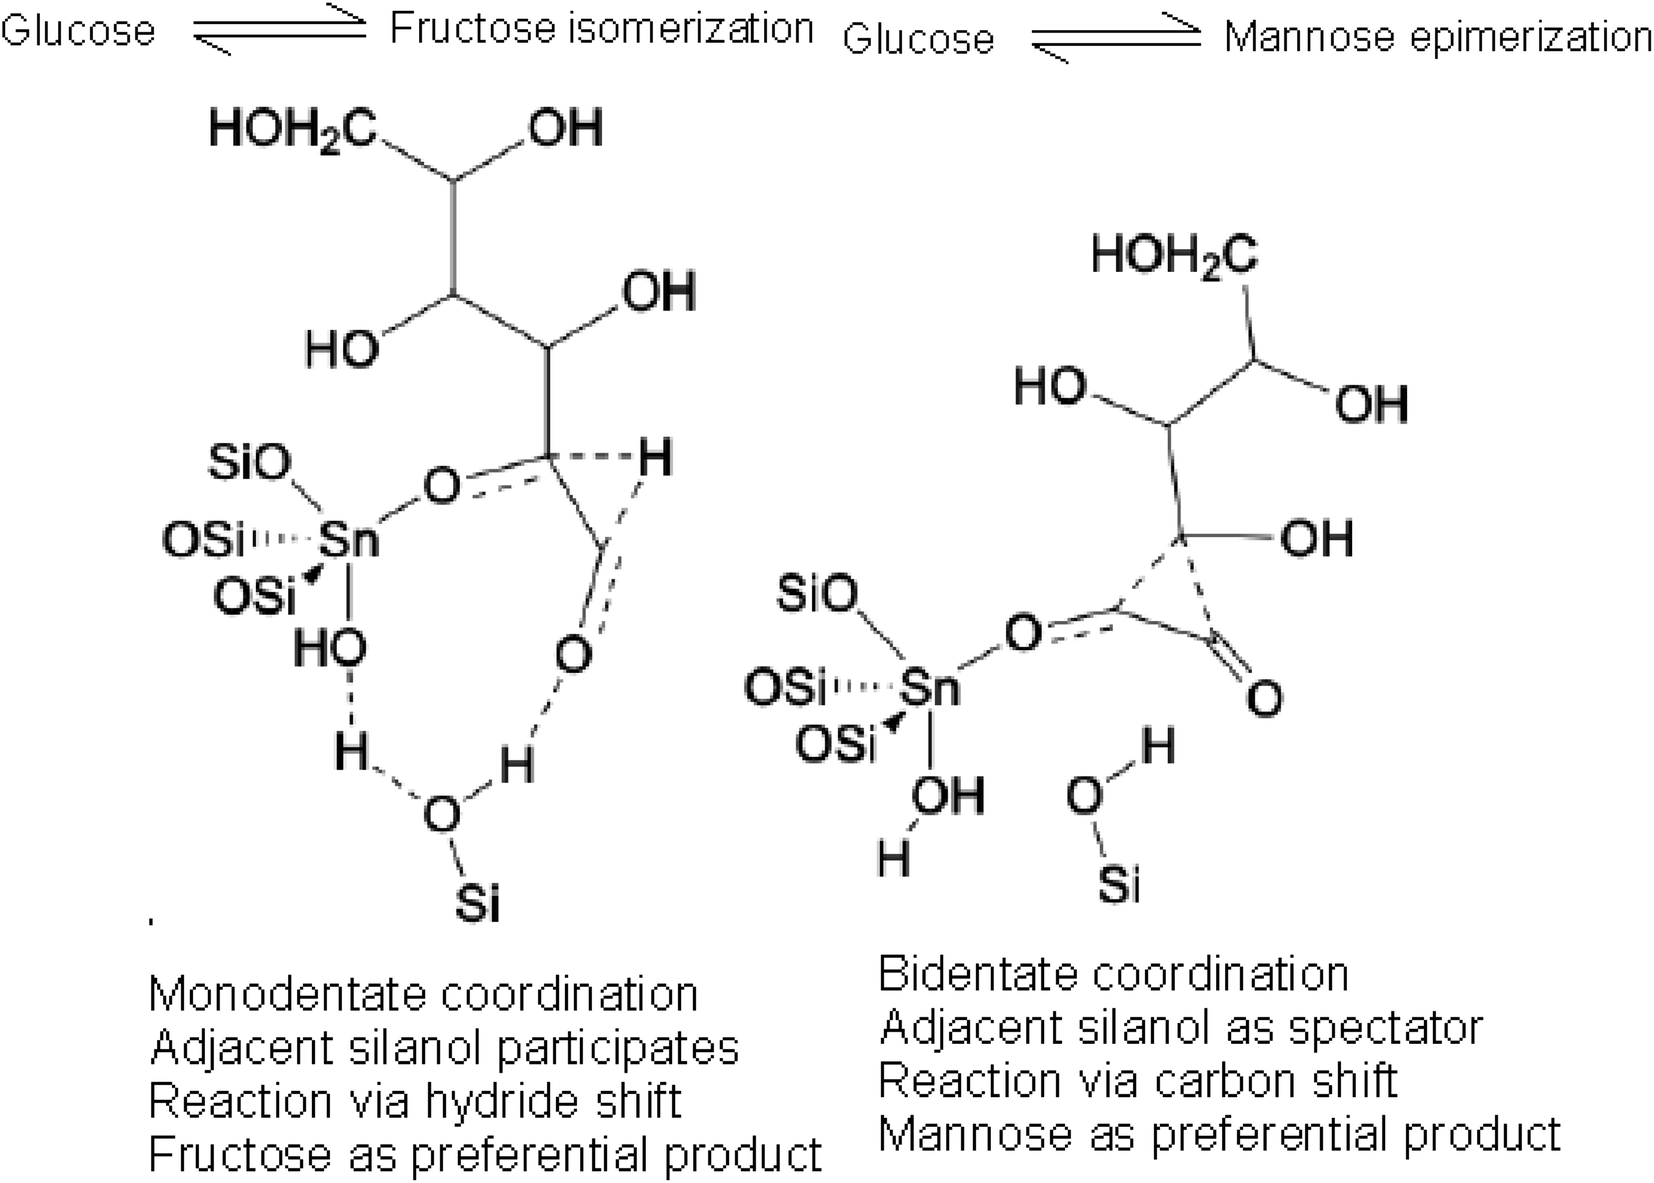 | ||
| Fig. 7 Glucose is converted into mannose and fructose partly under the alkalescence condition through epimerization. | ||
Three small organic compounds as potential surface passivation agents: Tris base, diethylene glycol, and polyethylene glycol (PEG-200) were also examined in the current study. Fluorescent C-dots were effectively created with Tris base (as shown in Fig. 6(b) and (c)). Yet, passivation with diethylene glycol or PEG-200 yielded no detectable luminescence. Analyzing the molecular structures of these agents, we believe that the presence of an amino group (or secondary amine) significantly impacts the synthesis. Hence, nitrogen, especially in the form of an amino group, appears to be pivotal for intense fluorescence emission. Tris likely amplified fluorescence for several reasons. Being an alkali, Tris sets up an alkaline environment conducive to carbon core formation. Moreover, its inherent amino group renders Tris an efficient surface passivation agent for C-dots (illustrated in Scheme 1). During the process, the luminescent C-dot synthesis and surface modification might have transpired concurrently. Notably, in separate reflux experiments, neither lactose nor Tris displayed any photoluminescence. Furthermore, the chosen passivation agents influenced not only the fluorescence intensity but also the C-dots' emission wavelength. Specifically, Tris-passivated C-dots showcased blue fluorescence with a peak emission at 438 nm.
3.3 Stability of C-dots
A range of experiments were carried out to assess the stability of the synthesized C-dots, considering factors such as pH, salt concentration and UV exposure duration. Understanding these stability parameters is vital as the C-dots are intended for various practical uses, which might involve diverse salt concentrations and pH levels. In addition, for commercial applications, it's essential that the C-dots exhibit exceptional photostability.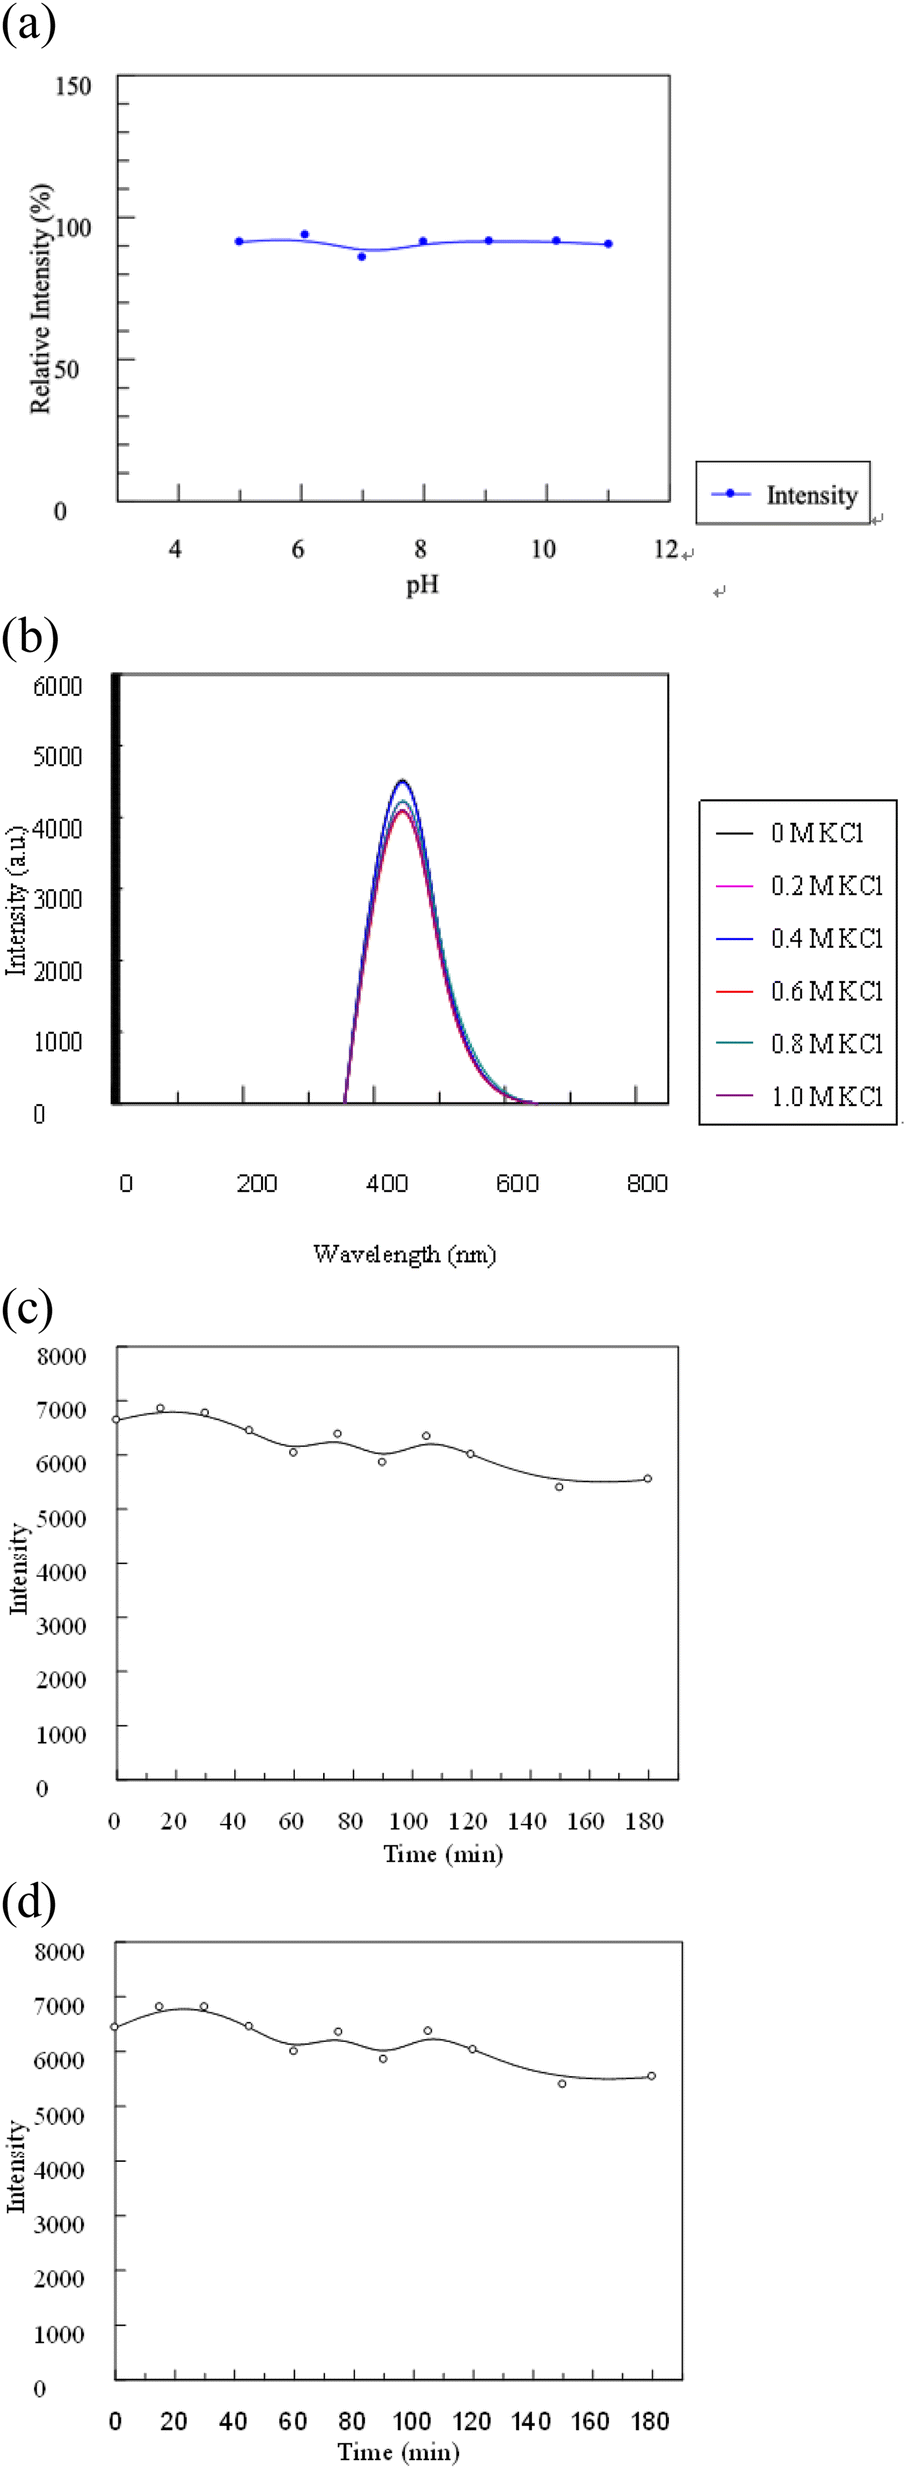 | ||
| Fig. 8 The influence of pH on the stability of C-dots (a). Ionic strength (b). A study on the effect of exposure time towards C-dots fluorescence characteristics is carried out where C-dots samples were stored under continuous UV radiation at 365 nm for 180 minutes. Emission spectrum of C-dots. (c). Excitation spectrum of C-dots. (d). | ||
3.4 Selectivity and sensitivity of the C-dots
Seven common ions were employed in interference experiments to assess the selectivity and sensitivity of the C-dots. Fig. 9 illustrates the fluorescence intensities of C-dots when combined with different ions. To gauge the specificity and practicality of the synthesized C-dots for H2O2 detection, we explored the fluorescence response of a variety of potentially interfering ions within the glucose/glucose oxidase/C-dots system at a set concentration, as depicted in Fig. 9. These investigations revealed that H2O2 generated by the glucose/glucose oxidase enzymatic reaction can significantly reduce the fluorescence intensity of the C-dots in an aqueous solution in the presence of those tested ions. This enhanced selectivity for the enzyme reaction might be due to H2O2's robust interaction with the C-dots compared to the other seven cations. As such, the C-dots/enzyme system offers promise as a “turn-off” fluorescence probe for H2O2 detection. Fig. 10 displays the variations in fluorescence intensity of the C-dots throughout the proposed sensing process.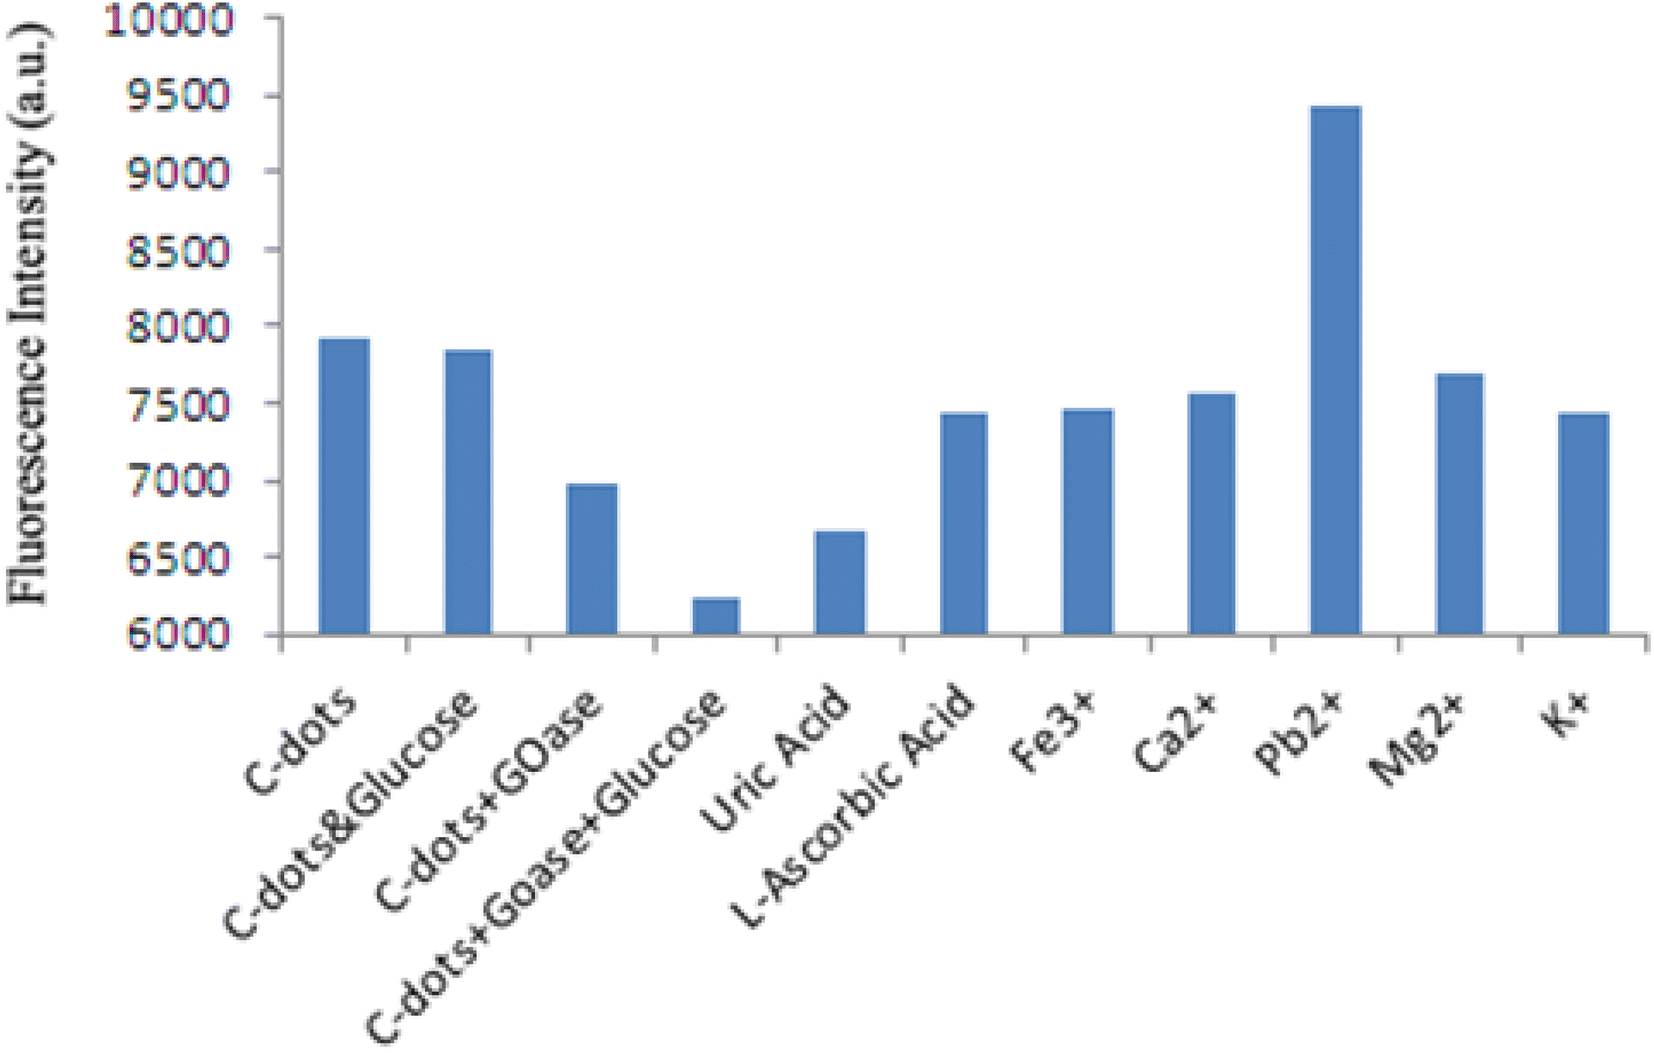 | ||
| Fig. 9 Interference from other cation ion in the enzyme reaction/C-dots sensing solution. | ||
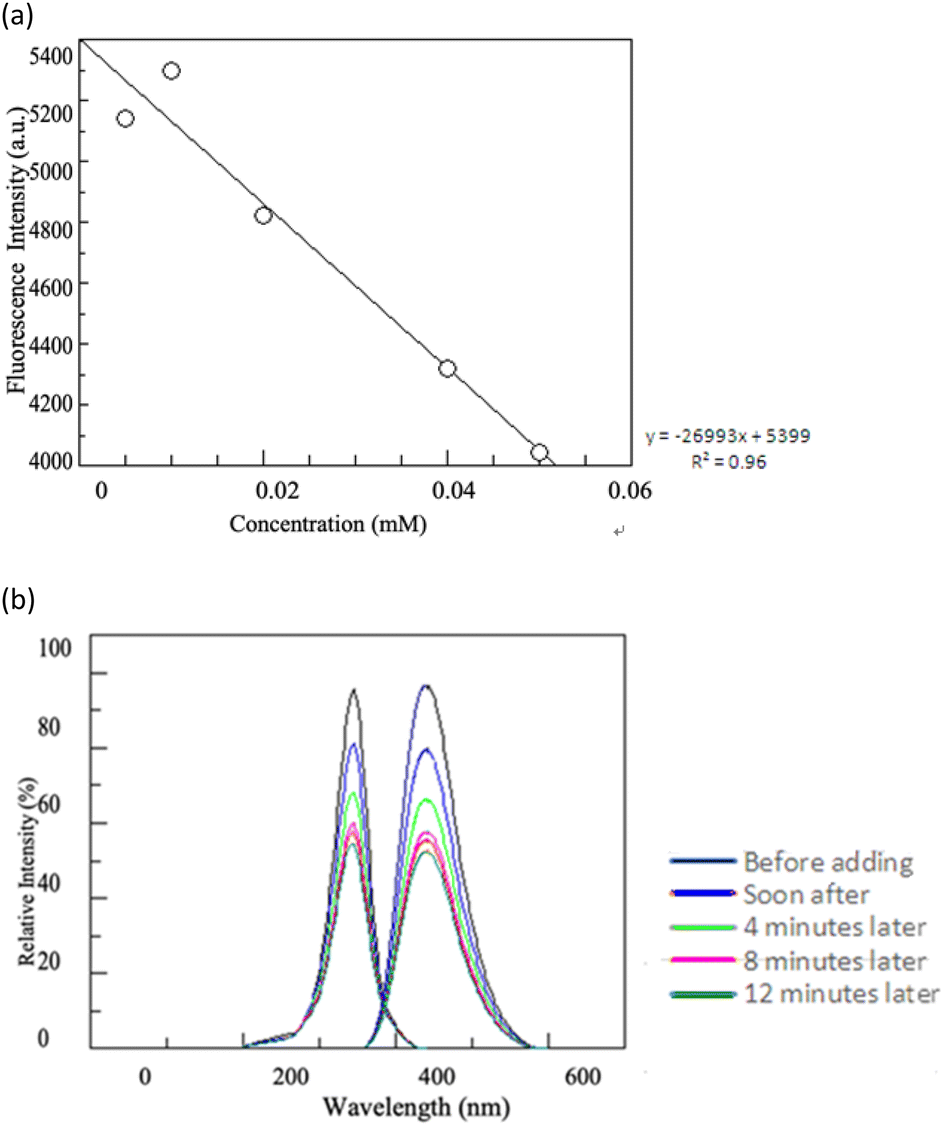 | ||
| Fig. 10 Linear relationship between the fluorescence intensity (λem = 438 nm) and the glucose concentration. Glucose show linear behavior in 0.005–0.05 mM range (a). Fluorescence spectra of metabolite, biomolecule and carbon dots conjugate for different reaction durations (excitation wavelength, 348 nm; path length, 1 cm) (b). | ||
3.5 Optical properties of the C-dots
The key features of C-dots are their fluorescence properties, which were thoroughly examined using UV-visible and fluorescence spectroscopy. In a 0.2 mg mL−1 aqueous solution, the C-dots possessed two distinct UV-visible absorption peaks in the 270–310 nm range, as depicted in Fig. 11. These peaks likely arise from a combination of various electronic transitions. | ||
| Fig. 11 Absorption spectra of the C-dots with enzyme reaction in difference time. Here, the concentration of enzyme and C-dots were the same in all cases. | ||
Subsequently, a fluorescence map was derived by scanning the excitation wavelength from 280 to 500 nm for the enzyme reaction/C-dots and a blank solution, both set at pH 7.0. To ensure the fluorescence emanated specifically from the C-dots and wasn't influenced by the precursor, solvent, or secondary excitations, a control experiment using a lactose–water solution (pH 7.0) was also conducted. The results revealed a pronounced fluorescence at 438 nm from the C-dots, suggesting their potential as robust fluorescent probes in the visible spectrum. To further confirm this finding, the fluorescence of varying concentrations of C-dots were assessed. It was observed that the intensity of the emitted fluorescence was directly proportional to the enzyme reaction/C-dots concentration, within the range of 25–3.125 μg mL−1 (refer to Fig. 10(a) and (b)). The most intense fluorescence was detected at an excitation wavelength of 348 nm and an emission wavelength of 438 nm.
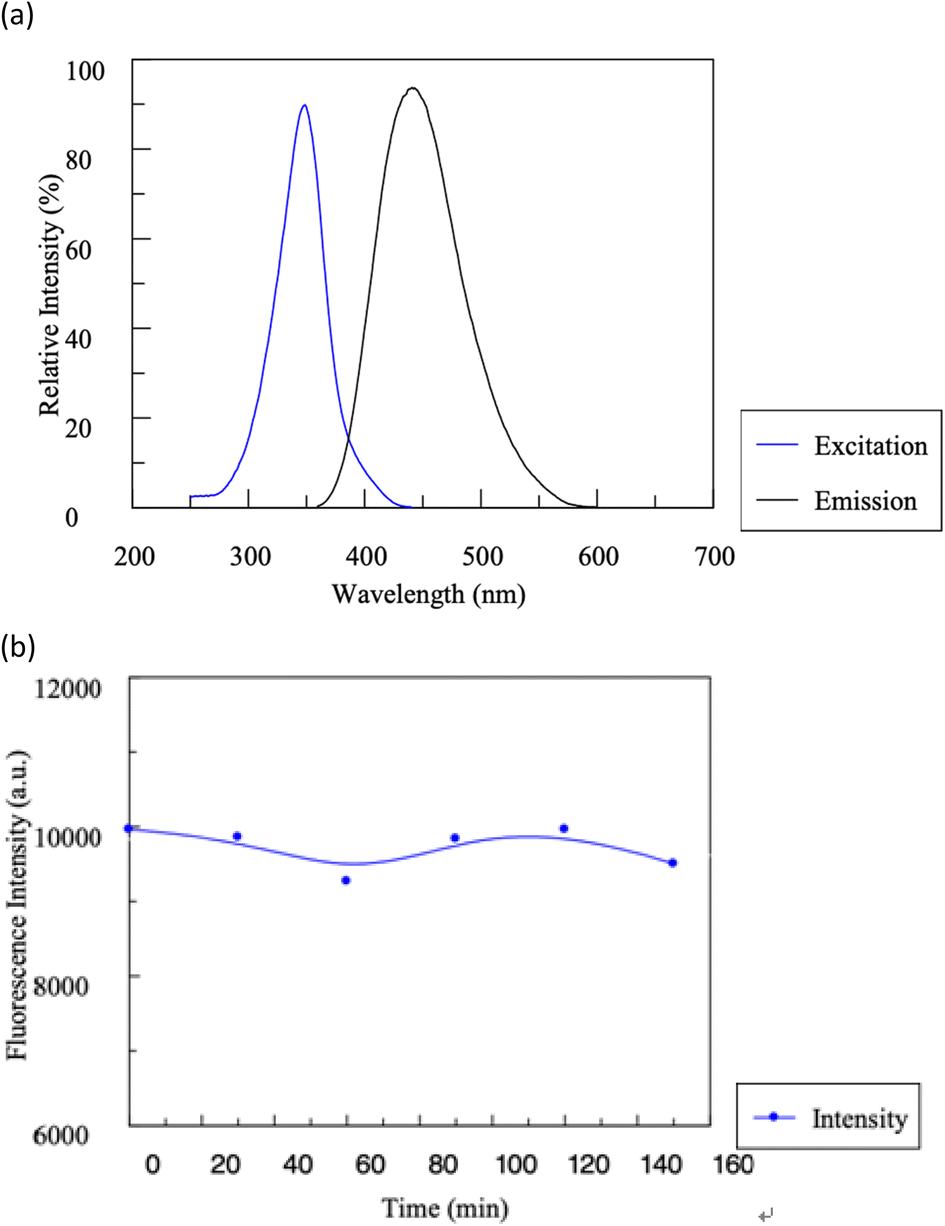
In our study, the fluorescence characteristics of C-dots produced through an aqueous hydrothermal method were assessed. As demonstrated in Fig. 12, the C-dots displayed characteristic absorption and photoluminescence patterns. There was a discernible absorption peak around 348 nm. Interestingly, these C-dots could be excited across a broad wavelength spectrum (285–385 nm). An emission peak of 380 to 470 nm can be detected when the C-dots were excited using wavelength ranges of 300 to 360 nm. The small full-width at half-maximum difference, approximately 90 nm, indicates a fairly consistent size distribution for these nanoparticles. Notably, the synthesized C-dots showcased both a pronounced Stokes shift and robust fluorescence.
 | ||
| Fig. 12 Typical absorption and photoluminescence emission spectra of the C-dots (a). The influence of time on the stability of C-dots (b). | ||
Furthermore, the C-dots aqueous solution maintained stability for a remarkable six months; the fluorescence diminished only slightly by 4.8%, with no evidence of sedimentation, when stored at 4 °C. The quantum yield of these C-dots was gauged against quinine sulfate (used as a reference with an excitation wavelength of 410 nm).25 Boasting a fluorescence quantum yield of 12.5%, these C-dots either matched or surpassed the yields of some previously documented C-dots.
3.6 UV-vis spectra of the biocomposite and its enzymatic reactions
Fig. 11 presents the UV-vis absorption spectra of the biocomposite. Three peaks were observed at 270, 280, and 320 nm. The first two peaks were due to π–π* transitions, and the third was due to n–π* transitions. The absorption peak of β-glucose oxidase was at 280 nm and that of the C-dots was at 320 nm. By adding glucose to the conjugate of β-glucose oxidase/C-dots biocomposite, the intensity of the absorption peaks quenched over time (Fig. 11).3.7 Fluorescence spectra of the biocomposite
To further explore the formation of the biocomposite, we obtained the emission spectra of the biocomposite at excitation wavelengths ranging from 250 to 450 nm. The fluorescence spectra, shown in Fig. 10, depict the results of treating glucose with the biocomposite at the excitation wavelength of 348 nm. This particular wavelength was chosen due to its highest absorbance. Two primary bands emerged at 348 nm and 438 nm. The 348 nm absorption can be attributed to the aromatic amino acid residues from the associated enzyme, while the 438 nm emission is linked to the indigo component formed post-glucose oxidation. As evident from Fig. 10(b), the biocomposite facilitates glucose oxidation, indicated by the diminishing emission band at 438 nm over time. Typically, emission decreases as ROS levels rise, which is consistent with the hydrogen peroxide production from the enzyme coupling.3.8 Fluorescence quenching of C-dots and glucose detection mechanism
In general, each C-dot has a surface passivation layer on its core to reduce the system's Gibbs free energy. When hydrophilic carbon precursors are used, hydrophilic C-dots are usually obtained, mainly because of the existence of rich hydroxyl, and amine groups on their surfaces. To modulate the properties of C-dots, modifiers such as Tris molecules is used to passivate their surfaces. When C-dots encounter ROS, such as singlet oxygen (1O2), superoxide anion (O2−), or hydroxyl radical (˙OH), they can undergo quenching of their fluorescence via different mechanisms. Here are a few possible quenching mechanisms involving ROS.26(1) Electron transfer: C-dots can transfer electrons to ROS, leading to their reduction and subsequent quenching of the carbon dot fluorescence. The energy from the excited state of the carbon dot is used to reduce the ROS to a lower energy state, causing fluorescence quenching. Alternatively, C-dots can transfer their excited-state energy to ROS through a non-radiative energy transfer process. This energy transfer competes with the radiative decay process responsible for fluorescence emission, effectively reducing the fluorescence intensity.
(2) Oxidation of C-dots: certain ROS, such as singlet oxygen, can oxidize the C-dots' surface, resulting in the formation of various surface functional groups or defects. These modifications can alter the carbon dot's electronic structure, causing a decrease in fluorescence intensity.
(3) Reactive species-induced surface passivation: ROS can induce surface modifications on carbon dots that lead to the creation of non-emissive states or energy traps, which effectively quench the fluorescence.
Fig. 10 and 11 presents the detection mechanism of the proposed C-dot sensor. C-dots were covalently bonded with the enzyme, which led to a decrease in the fluorescence intensity (Fig. 10(b)). This reduction (50%) in the initial fluorescence of the C-dots indicated quenching in a turned-off system.
The aromatic residues in the enzyme and the –OH groups in the C-dots and glucose interact with the sp2 hybridization groups in the enzyme, bringing the enzyme closer to quench fluorescence. Glucose molecules interact with the enzyme due to their oxidation and the ability of the C-dots to irreversibly inhibit the enzyme. Consequently, the enzyme undergoes conformational changes,27 leading to formation of the C-dot–enzyme complex. Thus, π–n interactions occur in the biocomposite, leading to fluorescence emission by the conjugate complex in the presence of glucose, is a highly distance-dependent fluorescence quenching ability.28
4. Conclusion
In this study, we showed that C-dots can be synthesized using L-lactose and Tris base by a hydrothermal method. The resulting C-dots can be further purified via a simple 11 hour dialysis procedure. Interestingly, these carbon dots demonstrated the feasibility of utilizing carbohydrates as a base. Yet, distinct differences in their PL properties emerged depending on whether the precursor was activated.Fluorescent C-dots with strong blue emission at 438 nm have been innovatively designed and synthesized using a straightforward hydrothermal method. Remarkably, these C-dots have a quantum yield of 44.5%. Their exceptional stability across a pH range of 5–11 and resilience to various salt concentrations mark them as ideal candidates for biosystem sensing. Notably, their fluorescence intensity wanes in the presence of hydroxyl radicals, making them potent probes for fluorescence turn-off detection. By coupling these C-dots with glucose oxidase, glucose levels can be monitored in real-time. With their low toxicity, these C-dots are poised to be invaluable in an array of detection techniques, especially when paired with the right substrates. We envision them playing a pivotal role in comprehensive metabolite monitoring in the future.
Conflicts of interest
There are no conflicts to declare.Acknowledgements
We sincerely express our gratitude to the Ministry of Education of the Republic of China (Taiwan) for providing financial support and to Chung Shan Medical University for granting us access to essential instruments, significantly facilitating our research efforts. Our appreciation extends to the Instrumentation Center at National Tsing Hua University, with special thanks to Shang-Fang Chang, who offered valuable assistance with TEM techniques. Moreover, we are thankful to Ya-Hui Chen and the Precision Instrument Support Center at Feng Chia University for their expert support with XPS and XRD techniques. We also thank Chin-Hsuan Wan at the Institute of Visual Studies of National Yang Ming Chiao Tung University for helping with data analysis graph. The collective contributions of these individuals and institutions have played a vital role in the successful completion of our research project.References
- X. Xu, R. Ray, Y. Gu, H. J. Ploehn, L. Gearheart, K. Raker and W. A. Scrivens*, Electrophoretic Analysis and Purification of Fluorescent Single-Walled Carbon Nanotube Fragments, J. Am. Chem. Soc., 2004, 126, 12736 CrossRef CAS PubMed.
- V. G. Reshma and P. V. Mohanan, Quantum dots: Applications and safety consequences, J. Lumin., 2019, 205, 287 CrossRef CAS.
- W. A. A. Mohamed*, H. A. El-Gawad, S. Mekkey, H. Galal, H. Handal, H. Mousa and A. Labib, Quantum dots synthetization and future prospect applications, Nanotechnol. Rev., 2021, 10, 1926 CrossRef CAS.
- A. AH Abdellatif, M. A. Younis, M. Alsharidah, O. Al Rugaie and H. M Tawfeek, Biomedical Applications of Quantum Dots: Overview, Challenges, and Clinical Potential, Int. J. Nanomed., 2022, 17, 1951 CrossRef PubMed.
- M. J. Molaei, Carbon quantum dots and their biomedical and therapeutic applications: a review, RSC Adv., 2019, 9, 6460 RSC.
- B. Hasannejadasl, F. P. Janbaz, E. Choupani, M. Fadaie, M. A. Hamidinejad and D. Ahmadvand, Thrita, 2020, 9(2), e100105 Search PubMed.
- J. Liu, R. Li and B. Yang*, Carbon Dots: A New Type of Carbon-Based Nanomaterial with Wide Applications, ACS Cent. Sci., 2020, 6, 2179 CrossRef CAS PubMed.
- M. R. Biswal* and S. Bhatia, Carbon Dot Nanoparticles: Exploring the Potential Use for Gene Delivery in Ophthalmic Diseases, Nanomaterials, 2021, 11, 935 CrossRef CAS PubMed.
- V. S. Sivasankarapillai, A. V. Kirthi, M. Akksadha, S. Indu, U. D. Dharshini, J. Pushpamalar and L. Karthik, Recent advancements in the applications of carbon nanodots: exploring the rising star of nanotechnology, Nanoscale Adv., 2020, 1760, 10.1039/C9NA00794F.
- L. Cui, X. Ren, M. Sun, H. Liu and L. Xia, Carbon Dots: Synthesis, Properties and Applications, Nanomaterials, 2021, 11, 3419, DOI:10.3390/nano11123419.
- F. Rigodanza, M. Burian, F. Arcudi and et al, ., Snapshots into carbon dots formation through a combined spectroscopic approach, Nat. Commun., 2021, 12, 2640, DOI:10.1038/s41467-021-22902-w.
- R. Li, Z. Jia and M. A. Trush, Defining ROS in Biology and Medicine, React. Oxygen Species, 2016, 1, 9, DOI:10.20455/ros.2016.803.
- B. C. dickinson and C. J Chang, Chemistry and biology of reactive oxygen species in signaling or stress responses, Nat. Chem. Biol., 2011, 7, 504, DOI:10.1038/nchembio.607.
- S. J. Forrester, D. S. Kikuchi, M. S. Hernandes, Q. Xu and K. K. Griendling, Reactive Oxygen Species in Metabolic and Inflammatory Signaling, Circ. Res., 2018, 122, 877, DOI:10.1161/CIRCRESAHA.117.311401.
- A. N. Vaneev, P. V. Gorelkin, A. S. Garanina, H. V. Lopatukhina, S. S. Vodopyanov, A. V. Alova, O. O. Ryabaya, R. A. Akasov, Y. Zhang, P. Novak, S. V. Salikhov, M. A. Abakumov, Y. Takahashi, C. R. W. Edwards, N. L. Klyachko, A. G. Majouga, Y. E. Korchev and A. S. Erofeev, In Vitro and In Vivo Electrochemical Measurement of Reactive Oxygen Species After Treatment with Anticancer Drugs, Anal. Chem., 2020, 92, 8010 CrossRef CAS PubMed.
- E. M. Espinoza, J. J. Røise, I.-C. Li, R. Das and N. Murthy, Advances in Imaging Reactive Oxygen Species, J. Nucl. Med., 2021, 62, 457, DOI:10.2967/jnumed.120.245415.
- G. C. V. d. Bittner, E. A. Dubikovskay, C. R. Bertozzia and C. J. Changa, In vivo imaging of hydrogen peroxide production in a murine tumor model with a chemoselective bioluminescent reporter, Proc. Natl. Acad. Sci. U.S.A., 2010, 107, 21316 CrossRef PubMed.
- B. Bartolomei and M. Prato, The Importance of the Purification Step and the Characterization of the Products in the Synthesis of Carbon Nanodots, Small, 2023, 19, 2206714 CrossRef CAS PubMed.
- R. B. González-González, L. T. González, M. Madou, C. Leyva-Porras, S. O. Martinez-Chapa and A. Mendoza, Synthesis, Purification, and Characterization of Carbon Dots from Non-Activated and Activated Pyrolytic Carbon Black, Nanomaterials, 2022, 12, 298, DOI:10.3390/nano12030298.
- S. Dua, P. Kumar, B. Pani, A. Kaur, M. Khannaf and G. Bhatt, Stability of carbon quantum dots: a critical review, RSC Adv., 2023, 13, 13845–13861 RSC.
- R. Lehmacher and C. Feldmann, Polyol-Mediated Synthesis of Nitrogen-Containing Carbon-Dots from Tetracyanobenzene with Intense Red Fluorescence, Nanomaterials, 2019, 9, 1470, DOI:10.3390/nano9101470.
- V. Arul and M. G. Sethuraman, Hydrothermally Green Synthesized Nitrogen-Doped Carbon Dots from Phyllanthus emblica and Their Catalytic Ability in the Detoxification of Textile Effluents, ACS Omega, 2019, 4, 3449–3457, DOI:10.1021/acsomega.8b03674.
- Y. Bian, B. He and J. Li, A One-step Hydrothermal Method of Nitrogen-doped Graphene Quantum Dots Decorated Graphene for Fabrication of Paper-based Fluorescent Composite, BioResources, 2016, 11(3), 6299–6308 CrossRef CAS.
- I. Delidovich and R. Palkovits, Catalytic Isomerization of Biomass-Derived Aldoses: A Review, ChemSusChem, 2016, 9, 547, https://www.chemsuschem.org Search PubMed.
- I. Alkian, H. Sutanto and H. Hadiyanto, Quantum yield optimization of carbon dots using response surface methodology and its application as control of Fe3+ ion levels in drinking water, Mater. Res. Express, 2022, 9, 015702 CrossRef CAS.
- F. Noun, E. A. Jury and R. Naccache, Elucidating the Quenching Mechanism in Carbon Dot-Metal Interactions–Designing Sensitive and Selective Optical Probes, Sensors, 2021, 21, 1391, DOI:10.3390/s21041391.
- M. Li, X. Zhou, S. Guo and N. Wu, Detection of lead (II) with a “turn-on” fluorescent biosensor based on energy transfer from CdSe/ZnS quantum dots to graphene oxide, Biosens. Bioelectron., 2013, 43, 69 CrossRef CAS PubMed.
- P. Reineck, D. Gómez, S. H. Ng, M. Karg, T. Bell, P. Mulvaney and U. Bach, Distance and Wavelength Dependent Quenching of Molecular Fluorescence by Au@SiO2 Core–Shell Nanoparticles, ACS Nano, 2013, 7, 6636, DOI:10.1021/nn401775e.
| This journal is © The Royal Society of Chemistry 2023 |