
 Open Access Article
 This Open Access Article is licensed under a
 Creative Commons Attribution 3.0 Unported Licence
Enhanced soft magnetic properties and high-frequency stability of FeNiMo powder cores by coating SiO2 insulation layer†
Jinming Lai‡
ab,
Likang Xiao‡c,
Zhengwei Xiong *d,
Leiming Fange,
Wenkun Zhud,
Fangguang Kuangf and
Zhipeng Gao*g
*d,
Leiming Fange,
Wenkun Zhud,
Fangguang Kuangf and
Zhipeng Gao*g
aSchool of Microelectronics, Xidian University, Xi'an 710071, China
bChina Electronics Technology Group Corporation 29th Research Institute, Sichuan Broadband Microwave Circuit High Density Integration Engineering Research Center, Chengdu 610036, China
cSchool of Electronic Science and Engineering, University of Electronic Science and Technology of China, Southwest Institute of Applied Magnetism, Mianyang 621010, China
dJoint Laboratory for Extreme Conditions Matter Properties, School of Mathematics and Physics, Southwest University of Science and Technology, Sichuan Civil-military Integration Institute, Mianyang 621010, China. E-mail: zw-xiong@swust.edu.cn
eInstitute of Physics Nuclear and Chemistry, China Academy of Engineering Physics, Mianyang, 621900, China
fSchool of Physics and Electronic Information, Gannan Normal University, Ganzhou 341000, China
gInstitute of Fluid Physics, China Academy of Engineering Physics, Mianyang 621900, China. E-mail: z.p.gao@foxmail.com
First published on 26th May 2023
Abstract
FeNiMo/SiO2 powder cores were prepared using the sol–gel method. Tetraethyl orthosilicate (TEOS) was added to produce an amorphous SiO2 coating outside the FeNiMo particles to form a core–shell structure. The thickness of the SiO2 layer was designed by varying the concentration of TEOS, and the optimized permeability and magnetic loss of the powder core could achieve 78.15 and 633.44 kW m−3 at 100 kHz and 100 mT, respectively. Compared with other soft magnetic composites, these FeNiMo/SiO2 powder cores have a significantly higher effective permeability and a lower core loss. Surprisingly, the high-frequency stability of permeability could be substantially enhanced through the insulation coating process in which μf/μ100 kHz could reach 98.7% at 1 MHz. In comparison with 60μ commercial products, the comprehensive soft magnetic properties of the FeNiMo/SiO2 cores were superior to most manufacturers, which would be potentially applied to high-performance inductance devices in high-frequency ranges.
1. Introduction
Metal soft magnetic materials are widely used as inductors, transformers, and filters due to the high magnetic flux densities at saturation, high permeabilities, and low magnetostrictive coefficients.1 Nowadays, the common metal soft magnetic materials are Fe, FeSiAl, FeSiCr, FeNi, and FeNiMo. By comparison, FeNiMo possesses higher permeability and lower eddy current loss than that of other metal soft magnetic materials,2,3 which can be applied to higher operating frequencies. Unfortunately, the low resistivity of metal soft magnetic materials leads to large eddy current loss, and further performance decreases significantly with the increase of temperatures, limiting its application at high frequencies. Soft magnetic composites (SMCs) with high resistivity and low eddy current loss were developed by coating a layer of insulation material on the surface of the soft magnetic particles.4,5 There are two types of insulation coating materials, including organic and inorganic materials.6–9 Wherein, the inorganic materials are more popular owing to the poorer stability and easier decomposition of organic materials at high temperatures.5,7 As a typical representative of inorganic materials, SiO2 is widely utilized because of its simple preparation process, easy synthesis, excellent insulation properties, and heat resistance.SiO2 is typically coated with silane coupling agent (APTES) and tetraethyl orthosilicate (TEOS) using the sol–gel method. As the most important silicon source, TEOS can hydrolyze to produce SiO2, and then generate SiO2 coating outside the metal soft magnetic particles to form a core–shell structure. Li et al.10 fabricated Fe85Si9.6Al5.4/SiO2 SMCs by using the sol–gel method and adjusting the amounts of TEOS and APTES. The thickness of the SiO2 coating increases as the TEOS content rises. Fan et al.11 prepared FeSiAl/SiO2 SMCs by tuning the amount of TEOS by the sol–gel method. It has been confirmed that, as the TEOS content rises, the denser the powder core becomes, the thicker is the coating layer on the surface of the powder. Yang et al.12 fabricated Fe/SiO2 SMCs using the sol–gel method, which revealed that a uniform SiO2 layer was formed on the surface of Fe powders, significantly reducing the loss. Zhou et al.13 prepared soft magnetic particle cores from FeSiBCr/SiO2 using the sol–gel method. The results show that the samples with the optimal thickness have excellent magnetic properties. The excessively thick coating increases the iron core's hysteresis loss, resulting in an increase in total loss.13 As mentioned above, controlling the amount of TEOS and APTES can determine the thickness of the SiO2 coating, the shape of the core–shell structures, and ultimately the magnetic properties of the samples. To date, few studies on FeNiMo cores with the insulation coating of SiO2 have been conducted. In addition, FeNiMo in nature has a higher frequency stability of permeability relative to other metal soft magnetic materials. The SiO2 coating is further expected to enhance the high-frequency stability of FeNiMo.
In this work, the soft magnetic FeNiMo/SiO2 composites were successfully prepared by the sol–gel method. The coating thickness of the samples was modified by adjusting the amount of TEOS. The sample's magnetic properties as well as the hysteresis loss and eddy current loss were studied systematically.
2. Experimental procedure
2.1 Sample preparation
FeNiMo powders with an average particle size of 22.3 μm were obtained from a commercial supplier (Beijing Compo Advanced Technology Co., Ltd.). Their Ni and Mo contents were 86.67 wt% and 2.27 wt%, respectively, and the Fe content was 10.64 wt%. Triethoxysilane C9H23NO3Si (APTES, Chron Chemicals) and tetraethyl orthosilicate C8H20O4Si (TEOS, Chron Chemicals) were used as coupling agents and silicon sources, respectively. During the molding process, zinc stearate was used as a lubricant, and epoxy resin as an adhesive.20 grams of FeNiMo powder was used with 170 mL of absolute ethanol, and placed in a water bath. A mixture of 5 mL of APTES and 30 mL of deionized water was then added to the solution, and the mixture was maintained under mechanical stirring at 500 rpm for 1 hour. Following the APTES reaction for 1 hour at room temperature, TEOS was added and the temperature was further raised to 50 °C. After heating the solution for three hours, FeNiMo/SiO2 powder was obtained. The coated powder was dried at 60 °C for one hour.
Epoxy resin (1 wt%) was dissolved in acetone, then the coated powder was added and stirred until the acetone was evaporated. As a lubricant, 0.25 wt% zinc stearate was added to the coated powder before pressing. The powder mixture was pressed into an annular sample with an outer diameter of 10.2 mm and an inner diameter of 5.08 mm under a pressure of 1950 MPa. Following annealing at 600 °C for 1 hour in an argon atmosphere, the sample was cooled in the furnace. The parameters of preparation FeNiMo/SiO2-insulated powders and SMCs were optimized in the previous work.14
2.2 Material characterization
The particle sizes were measured by a laser particle size analyzer (Malvern Mastersizer 3000). The microstructure of FeNiMo powder and coated powder was obtained by scanning electron microscopy (SEM, TM4000, Hitachi). Energy dispersive spectroscopy (EDS) elemental mapping was used to characterize the SiO2 insulating coating. The density of the prepared sample was calculated using a water boiling method based on the Archimedes principle. The electrical switching behavior of the films was studied by using the four-probe system in dismal surroundings, which was equipped with a Keithley 2400 (Tektronix, America) source meter. X-ray diffraction was used to determine the phase structure of the powder (XRD, SmartLab, Rigaku). The density of SMCs was determined using the density balance. AC magnetic properties of the samples were measured using a B–H curve analyzer (SY-8218, Iwatsu) at a frequency range of 10–1000 kHz and a B value of 100 mT, that is, under typical industrial conditions for FeNiMo soft magnetic products. Based on the core loss Pcv, hysteresis loss Ph and eddy current loss Pe are obtained.15,16 In order to determine the effective permeability, the inductance of the magnetic particle core was measured using an impedance analyzer:11
 | (1) |
3. Results and discussion
3.1 Microstructure
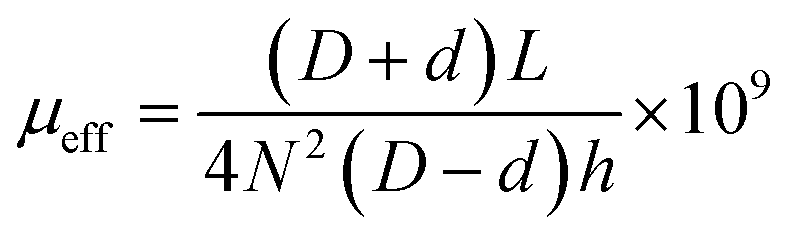
Fig. 1(a) shows the SEM image of FeNiMo powder, which presents an obvious spherical structure without agglomeration. The normal distribution diagram of the powder particle sizes obtained by the laser particle size analyzer is shown in Fig. 1(b), and the average particle size is 22.3 μm. By laser particle size analyzer, the average sizes of FeNiMo/SiO2 powder cores with different TEOS volumes can be obtained, as shown in Fig. S1.† Obviously, the particle sizes are increasing with the increase in TEOS concentrations. Compared with pure FeNiMo particles (Fig. 1(b)), the thickness of the SiO2 layer can be deduced in the range of 900 nm to 4.7 μm.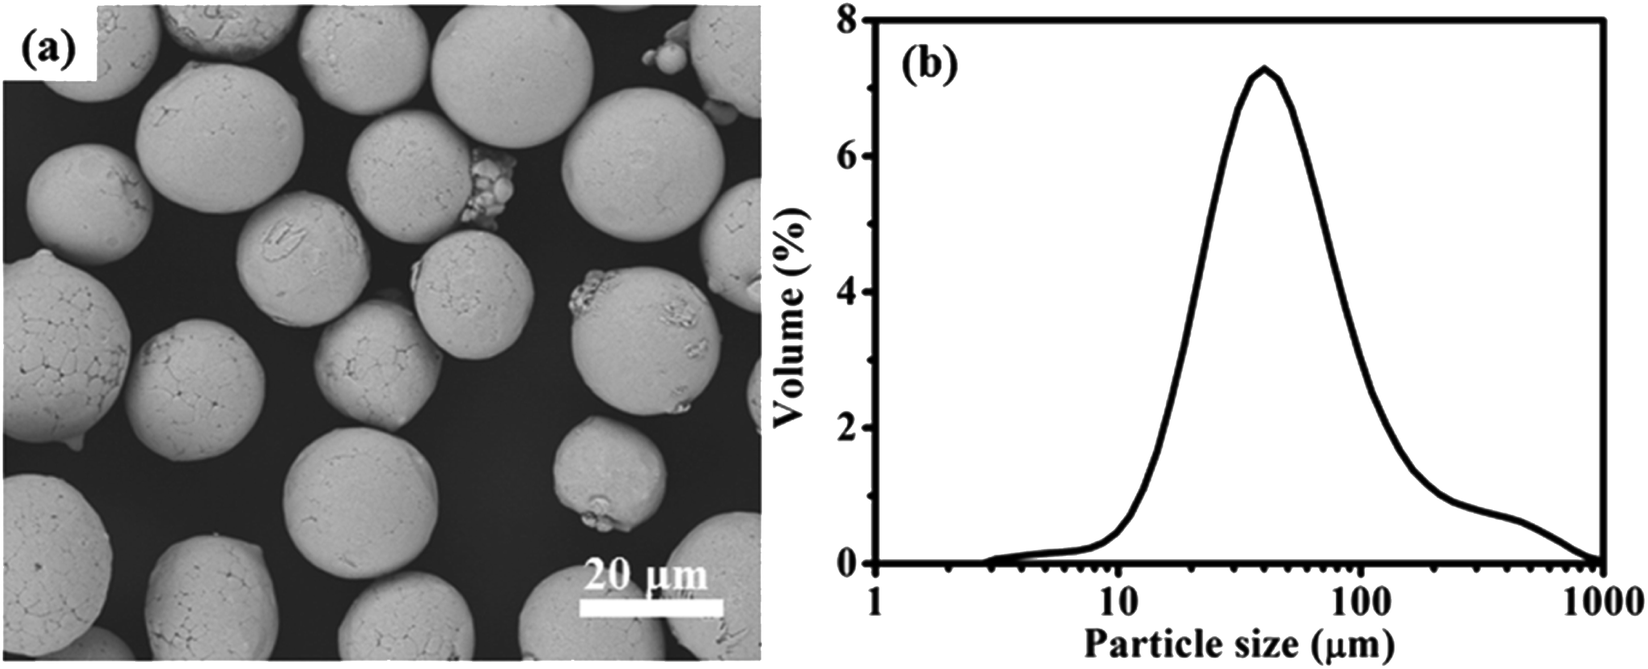 | ||
| Fig. 1 (a) SEM image and (b) particle size distribution curve of FeNiMo powders. | ||
After the FeNiMo powders were coated with the SiO2 layer by the sol–gel method, the SEM (Fig. 2(a)) and EDS elemental mapping of the corresponding area (Fig. 2(b)–(f)) showed that the coated sample was mainly composed of Fe, Ni, Mo, O, and Si elements. In addition, the elements were evenly distributed, and O and Si elements showed the same mapping intensity in the same bright area. The elemental distribution maps prove that the O and Si were successfully distributed uniformly on the particle surface.
 | ||
| Fig. 2 (a) SEM images of the FeNiMo powders coated with SiO2 and corresponding EDS elemental mapping of (b) Fe, (c) Ni, (d) Mo, (e) O, and (f) Si. | ||
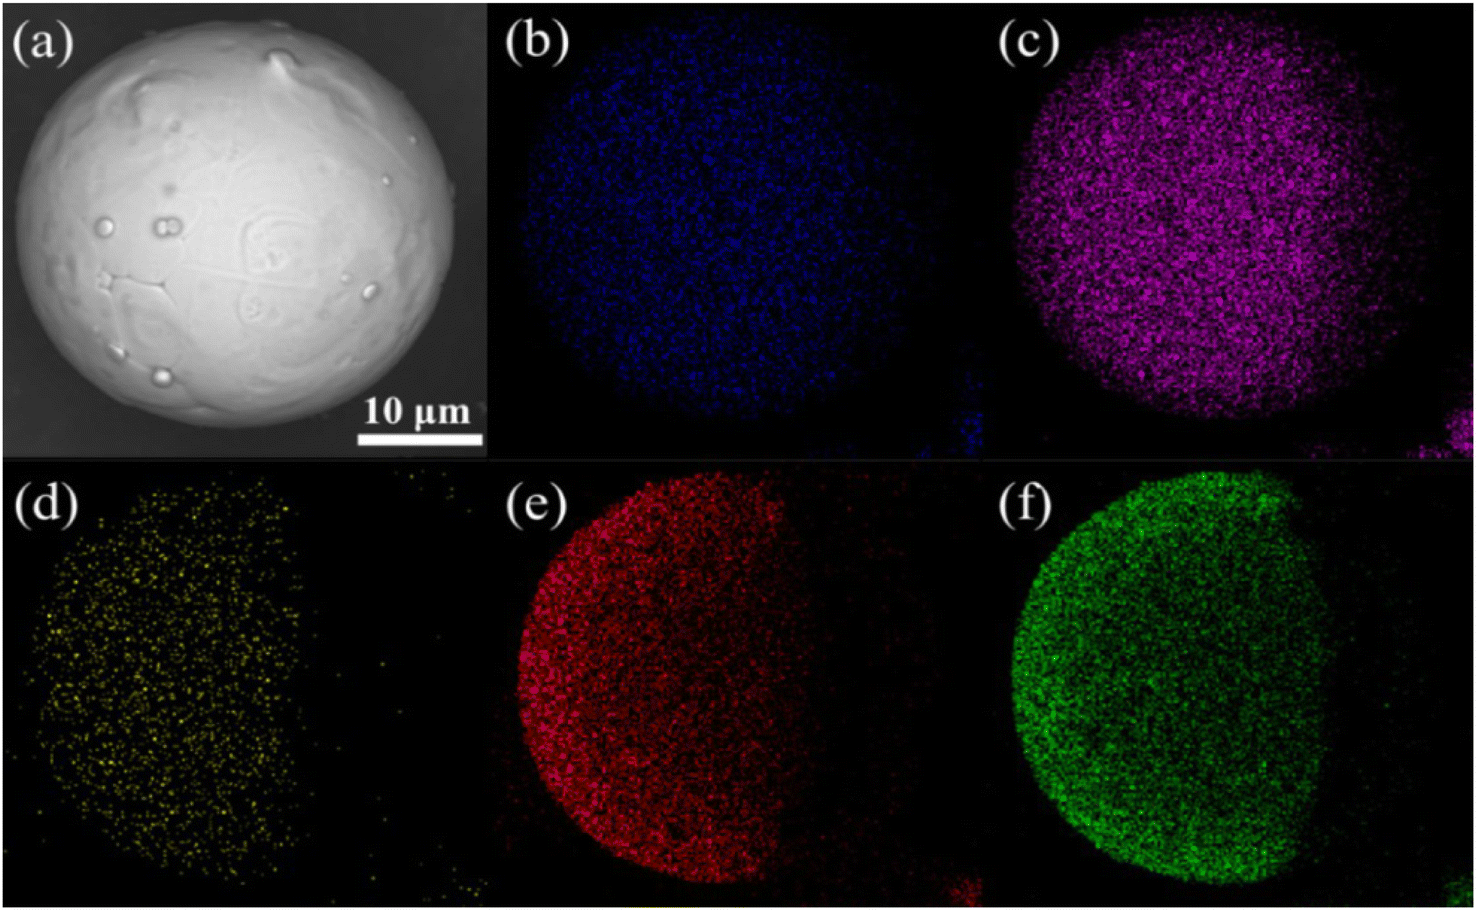
Fig. 3 shows the sectional SEM image and corresponding element distribution of FeNiMo/SiO2 powder cores annealed at 600 °C. From Fig. 3(a), it can be seen that the SiO2 coating is basically intact without the melting phenomenon after the pressed powder core was annealed at 600 °C. As shown in Fig. 3(b)–(f), Si and O elements were uniformly distributed in the FeNiMo particles, and there were no elements in the gaps between particles, proving that the core–shell structure of the sample was not damaged at 600 °C. In this case, the diffusion of the atoms that compose the insulating layer (Si and O) into the ferromagnetic FeNiMo phase can be almost negligible. Our past works have demonstrated that the excessive annealing temperatures led to gradual damage of the insulating layer, and further resulted in reduced resistivity and poor frequency characteristics.14 Several previous investigations also reported that the amorphous SiO2 layer could be well coated with FeSi and carbonyl iron particles after high-pressure pressing and high-temperature annealing.17,18
 | ||
| Fig. 3 (a) Sectional SEM and (b–f) EDS elemental distribution of FeNiMo/SiO2 powder cores annealed at 600 °C. | ||
3.2 Phase structure
Fig. 4 shows the XRD patterns. The diffraction peaks of raw powders are consistent with the indexed peaks of the Ni3Fe crystal structure (JCPDS card no. 88-1715). The raw FeNiMo powders have only a Ni3Fe crystalline phase within the accuracy of the instrument. With the coated SiO2 insulation, there is also an amorphous SiO2 phase at 15°–30°. Significantly, the amorphous SiO2 bulge still existed in the FeNiMo/SiO2 powder cores, indicating that the coated SiO2 layer was not damaged after annealing at 600 °C. The elemental ratios of raw FeNiMo and FeNiMo/SiO2 powders were obtained from the EDS spectrum, as shown in Table S1.† After the chemical deposition process, the Si and O concentrations were significantly increased. To confirm the core–shell structure, we further re-tested the EDS elemental distribution mapping of FeNiMo/SiO2 powders. Accordingly, to select the incompletely coated particles (Fig. S2†), the core–shell structures were clearly observed. Combined with the EDS elemental mapping map (Fig. 2), elemental ratios (Table S1†), and XRD analysis, it can be concluded that the FeNiMo powders were successfully coated with a uniform SiO2 layer by the sol–gel method, forming the core–shell FeNiMo/SiO2 SMCs.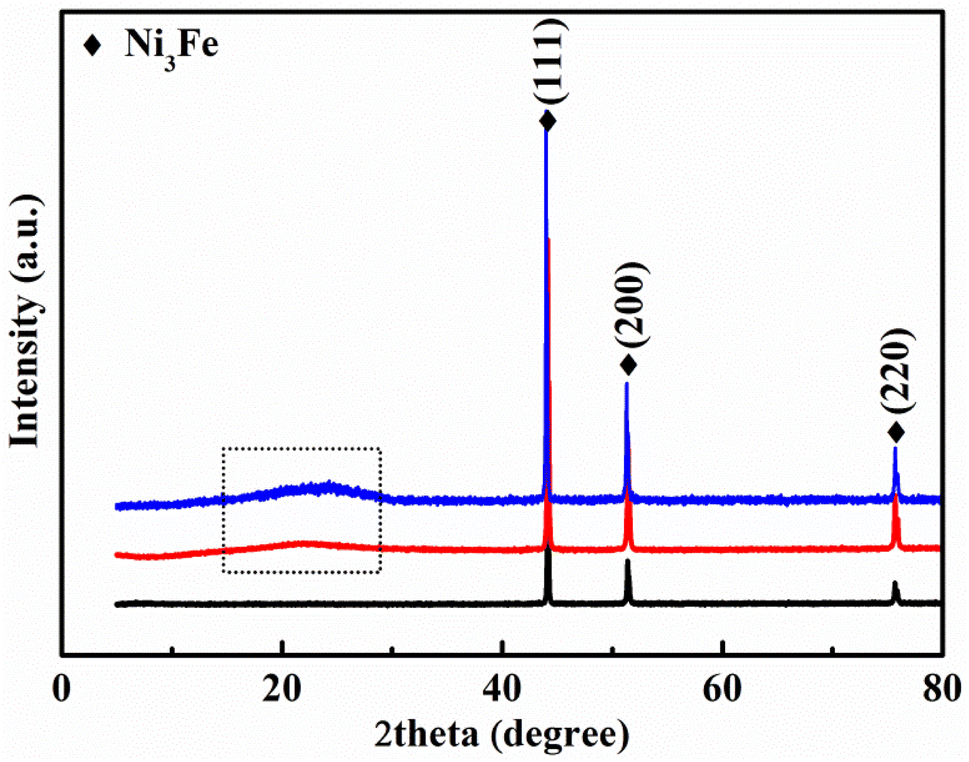 | ||
| Fig. 4 XRD patterns of raw FeNiMo powders (black), FeNiMo/SiO2 powders (red), and FeNiMo/SiO2 SMCs after annealing at 600 °C (blue). | ||
3.3 Soft magnetic properties
According to the theory, the core losses (Pcv) are made up of hysteresis loss (Ph), eddy current loss (Pe), and residual loss (Pr). At low magnetic induction, Pr is negligible. As a result, core losses can be expressed as follows:19,20
 | (2) |
The density and resistivity of the FeNiMo/SiO2 powder cores prepared with different amounts of TEOS are shown in Fig. 5(a) and (b). With the increase in the TEOS amount, the density is decreasing and the resistivity is increasing. Combined with SEM and XRD results, it can be deduced that the SiO2 coating becomes thicker with the more TEOS amount. The more insulating SiO2 shell on the FeNiMo core induces increased resistivity, which is a direct inducement to reduce the eddy currents. The increase of non-magnetic SiO2 could further result in the decrease of Br (Fig. 5(c)), meaning the weakening of magnetic properties. Meanwhile, Hc is gradually increased as the TEOS content increased (Fig. 5(d)). The enhanced Hc can directly cause an increase in hysteresis loss. The presence of the nonmagnetic SiO2 insulating layer between the magnetic FeNiMo particles acts as an air gap, serving as a demagnetizing field. The presence of pores or a non-magnetic SiO2 immobilizes the domain walls and increases the energy requirement for completing the same magnetization or demagnetizing process.21,22 Therefore, the Hc for FeNiMo/SiO2 composite compact is higher than that of FeNiMo compacts.
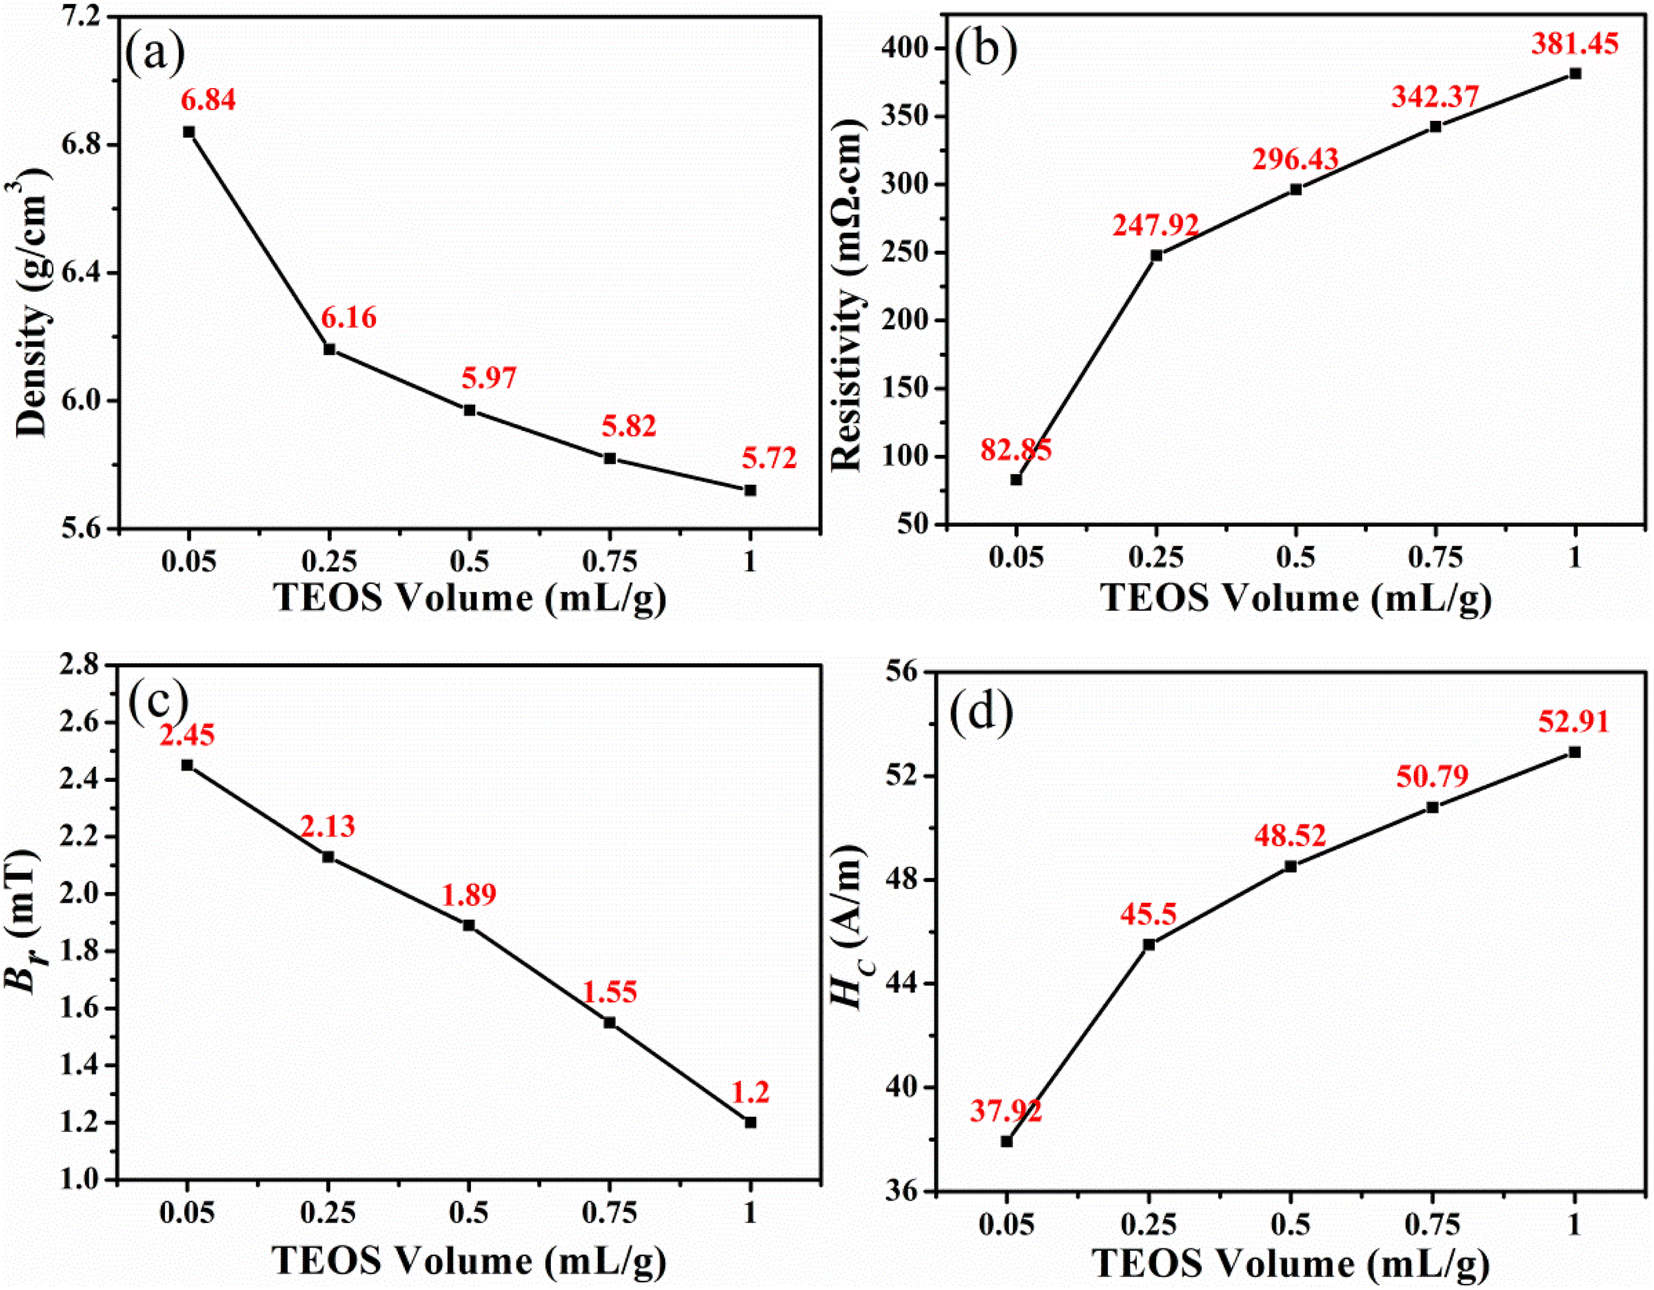 | ||
| Fig. 5 Effect of the addition of TEOS on (a) density, (b) resistivity, (c) residual magnetic flux density (Br), and (d) coercivity (Hc) of the FeNiMo/SiO2 SMCs at various frequencies and B = 100 mT. | ||
The AC magnetic properties of SMCs manufactured with the addition of the TEOS at various frequencies and B = 100 mT are depicted in Fig. 6. The effective permeability of the SMCs prepared at different TEOS concentrations remains unchanged with the increase of frequencies, and the change rate was less than 1% in the range of 10–1000 KHz. As the concentration of TEOS increases, the effective permeability gradually decreases. The effective permeability was optimized as 48.6 obtained with TEOS concentration of 0.05 mL g−1 (100 kHz, 100 mT). The SiO2 insulation coating is primarily responsible for the decreased effective permeability. As shown in Fig. 6(b), the core loss of SMCs increases as the TEOS concentration rises. The total sample loss is lowest as the TEOS concentration is 0.05 mL g−1, with a value of 926.94 kW m−3 (100 kHz, 100 mT). The sample's Ph increases as the TEOS concentration rises (Fig. 6(c)). The thick SiO2 insulation layer results in a high fraction of the non-magnetic phase,13 and the increased number of particle walls. The equivalent air gaps for the SiO2 can act as the pinning center for the domain wall to hinder the movement of the magnetic domain. Thus, a larger number of pinning centres are created by increasing the thickness of the SiO2 layer, leading to a higher Ph. Among them, the Ph at the TEOS concentration of 0.05 mL g−1 is 700.63 kW m−3 (100 kHz, 100 mT). Fig. 6(d) demonstrates that the Pe value decreases as the TEOS concentration increases, attributing to the increased resistivity of SMCs as a result of an increase in SiO2. The increase in the core loss of SMCs is attributable to the fact that the increase in the Ph exceeds the decrease in Pe. The dominant role of Ph in the total losses demonstrates that the magnetic mechanism can be attributed to the pinning effect of the domain wall. While the TEOS concentration is 0.05 mL g−1, the SMCs at 100 kHz and 100 mT have the highest effective permeability (48.6) and the lowest loss (926.94 kW m−3). The greater the amount of non-magnetic substances, the more the magnetism is diluted, resulting in a lower effective permeability.23,24 Additionally, the sample with a higher SiO2 content exhibited a lower density because it possessed more air gaps, a higher non-magnetic SiO2 content, and a higher inner demagnetizing field,18 which resulted in the larger Hc and lower magnetic induction values. Consequently, as the density increased, the coercivity decreased, and the hysteresis loss decreased.25 Apparently, the increased Ph arising from the domain wall pinning outweighed the decrease of Pe, resulting in an overall increased Pcv. This explains why the samples exhibited decreased μe and increased Pcv with increasing TEOS concentrations.
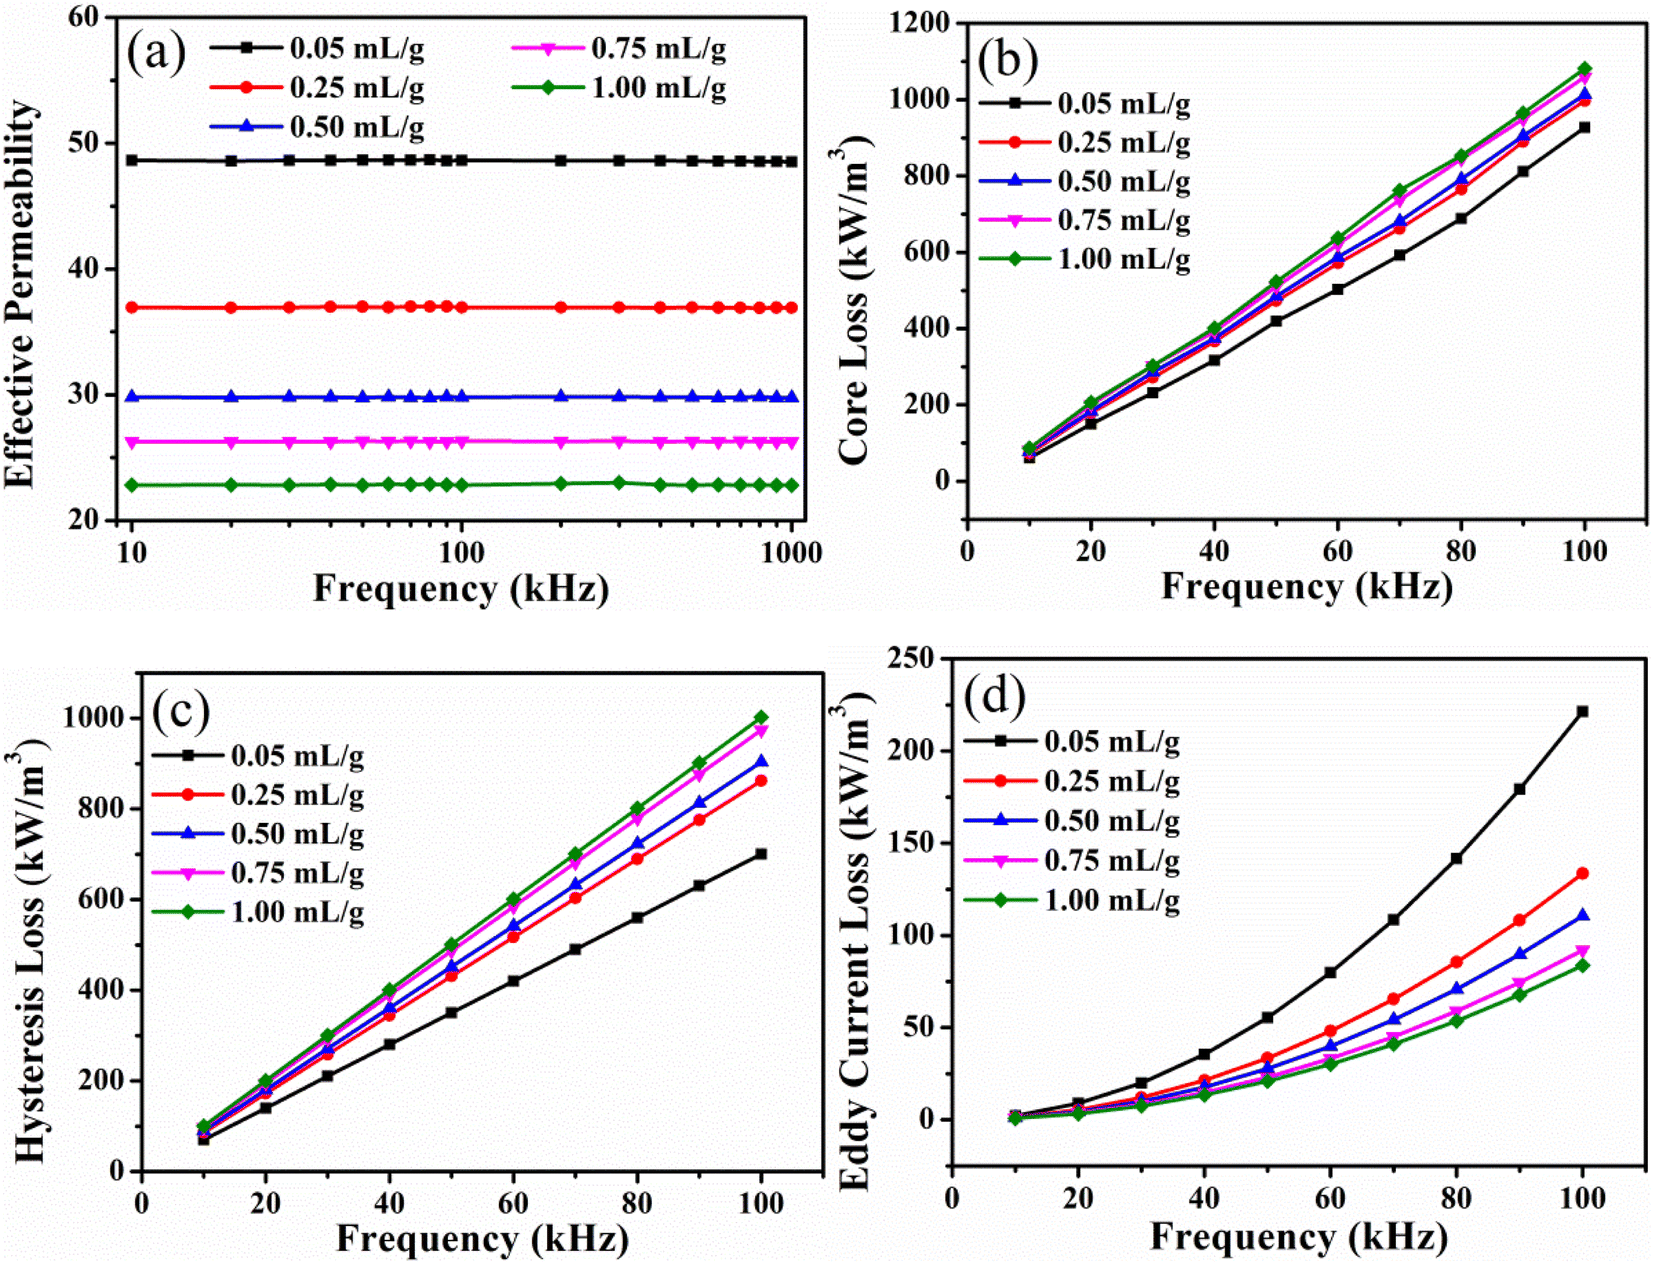 | ||
| Fig. 6 Effect of the addition of TEOS on AC magnetic properties of the FeNiMo/SiO2 SMCs at various frequencies and B = 100 mT: (a) effective permeability, (b) core loss, (c) hysteresis loss, (d) eddy current loss. | ||
In order to optimize the magnetic properties, the FeNiMo/SiO2 SMCs with lower TEOS concentrations were prepared, as shown in Fig. 7. The effective permeability of SMCs decreases gradually with increasing the TEOS concentration (Fig. 7(a)). Moreover, the high-frequency stability of SMCs was enhanced. In the frequency range of 100–1000 kHz, the effective permeability of the samples with a TEOS concentration of 0.02 mL g−1 decreases slightly with the increase of frequencies, and the change rate was less than 3%. Fig. 7(b) displays the core loss of SMCs manufactured with varying concentrations of TEOS. As the concentration of the TEOS increases, the core loss of the sample decreases and then rises until it reaches a minimum at the TEOS concentration of 0.02 mL g−1. As the TEOS concentration increases, the sample's hysteresis loss first decreases and then increases, reaching a minimum at 0.02 mL g−1 (Fig. 7(c)). Loss of hysteresis is proportional to coercivity (Fig. 8). Fig. 7(d) demonstrates that the sample's eddy current loss reaches its minimum at the TEOS concentration of 0.015 mL g−1. Eddy current loss is closely related to the sample's resistivity. The coated SiO2 insulating layer could effectively increase the distance between magnetic particles and restrict the eddy current between the particles. Meanwhile, a relatively thick insulating layer played a satisfactory insulating role and effectively reduced Pe. However, this Ph increases slightly in the 0.025 and 0.03 mL g−1 samples, which affects the increase of Pe once the coating layer proceeds beyond a certain thickness limit.26 Consequently, the eddy current loss of SMCs was slightly altered. Therefore, as 0.02 mL g−1 TEOS was added to FeNiMo/SiO2 SMCs, the magnetic properties were the best. The effective permeability was stable and reached the highest value of 78.15 and the lowest core loss of 633.44 kW m−3 at 100 kHz and 100 mT.
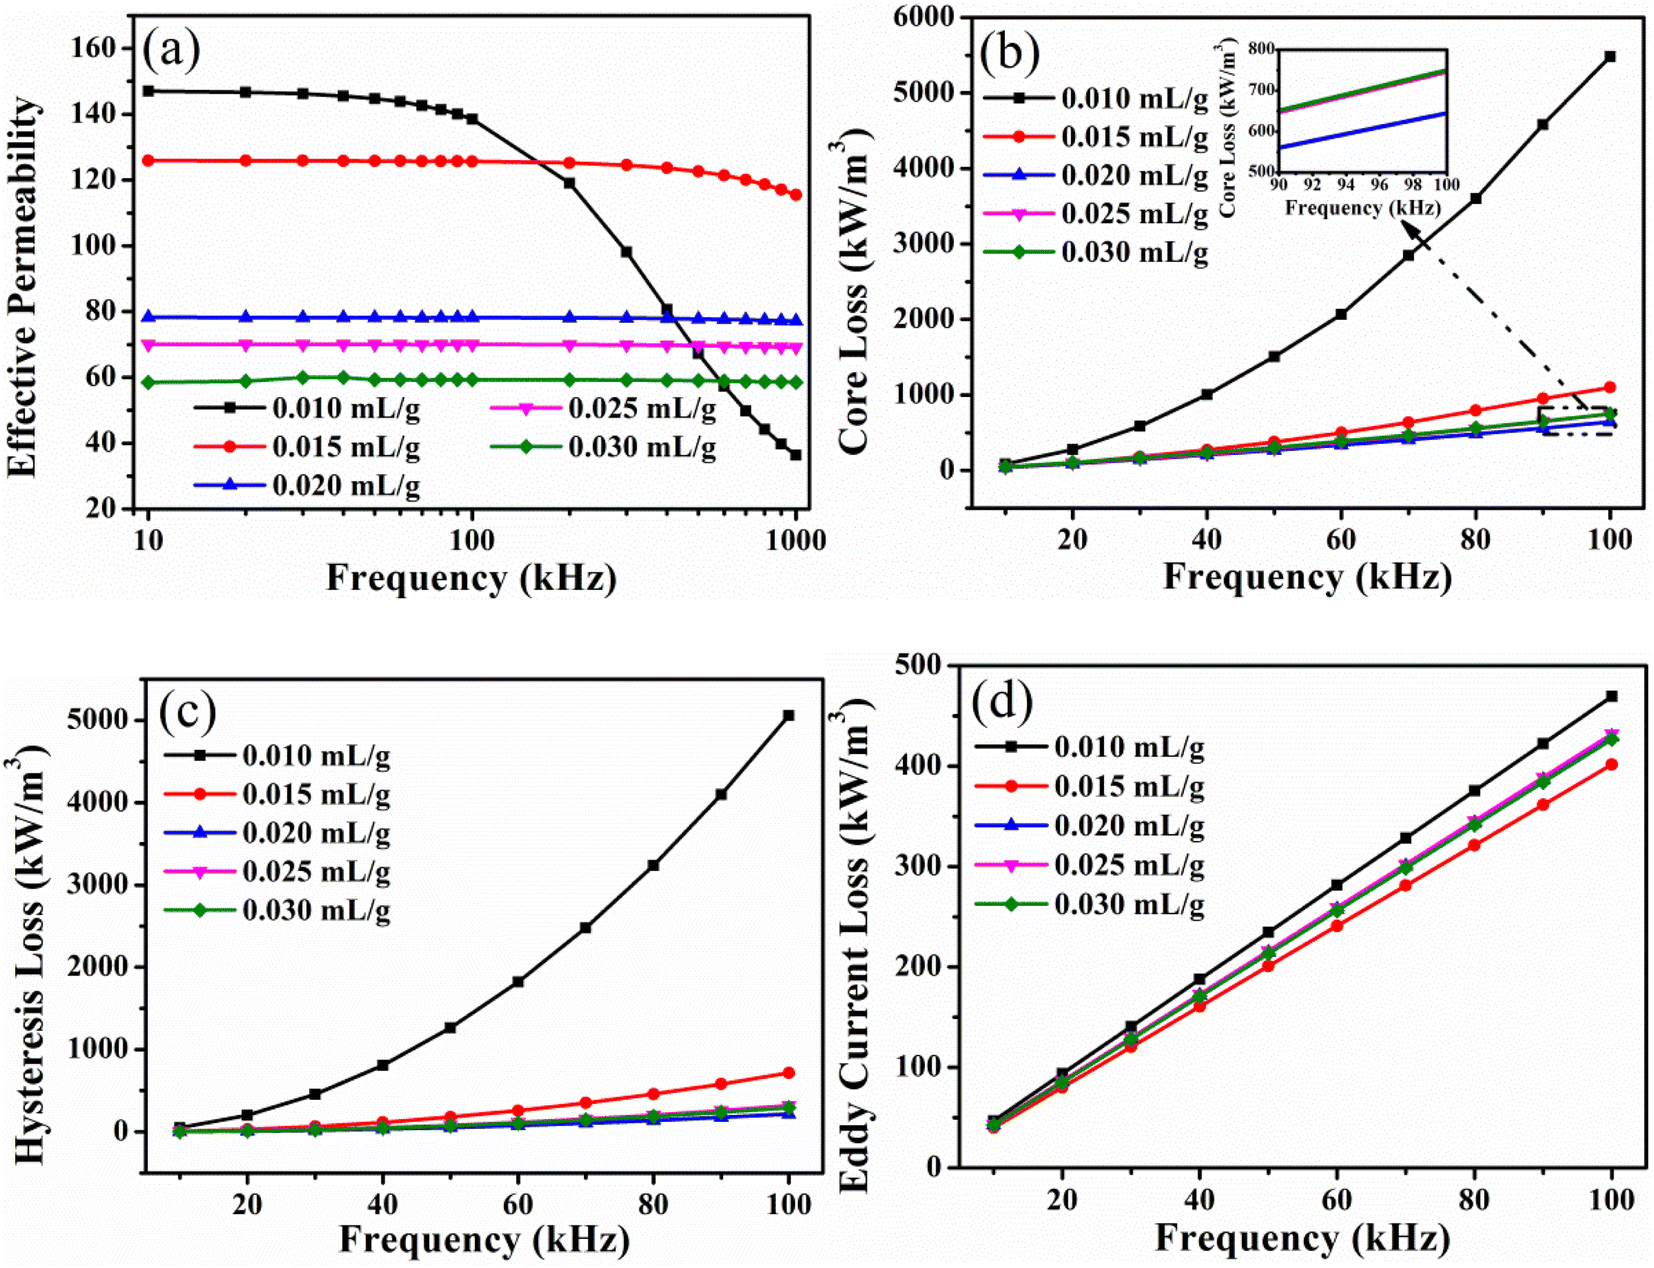 | ||
| Fig. 7 Effect of small concentration of TEOS on AC magnetic properties of the FeNiMo/SiO2 SMCs at various frequencies and B = 100 mT: (a) effective permeability, (b) core loss, (c) hysteresis loss, (d) eddy current loss. | ||
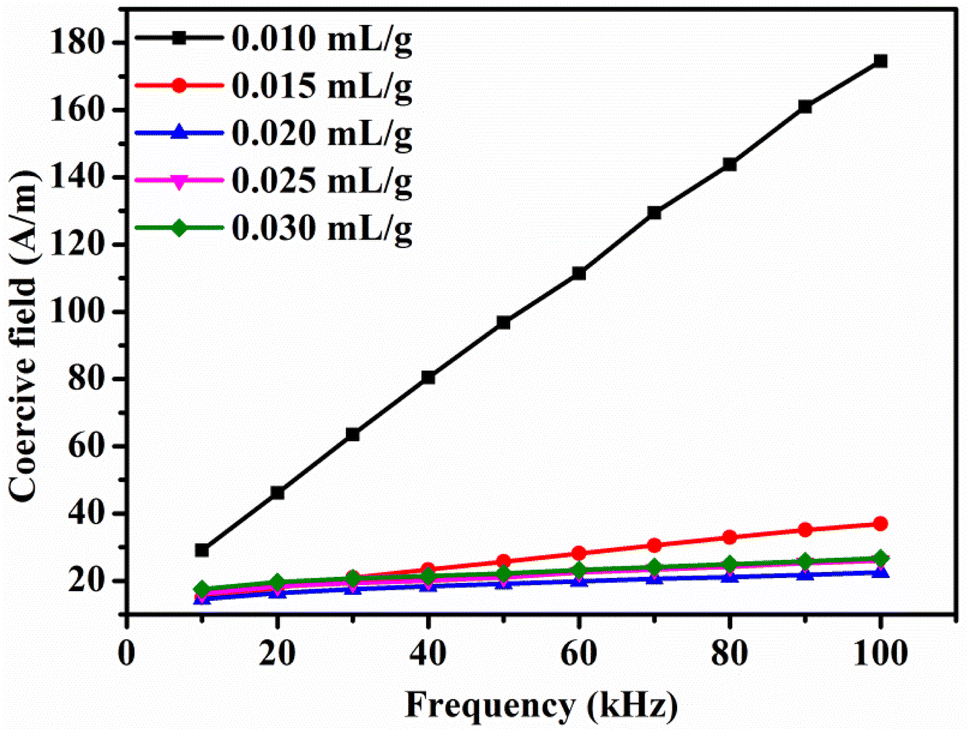 | ||
| Fig. 8 Effect of the TEOS concentration on coercive field of the FeNiMo/SiO2 SMCs at various frequencies and B = 100 mT. | ||
FeNiMo/SiO2 SMCs exhibited a coercive field in Fig. 8. The coercive field of the sample increases monotonously with the increase of frequencies. The change law of coercivity is the same as the hysteresis loss. The coercive field is sharply reduced when TEOS was added at 0.015 mL g−1 or more. Lower coercivity means a smaller hysteresis loop area and correspondingly smaller hysteresis loss and vice versa because hysteresis loss is closely related to the coercivity and hysteresis loop area.27 By reducing the coercive field, the hysteresis loss of the sample was reduced, which in turn reduced its core loss.
The effective permeability and core loss of SMCs prepared in the concentration range of 0.01–1 mL g−1 TEOS are shown in Fig. 9. As the concentration of TEOS rises, the effective permeability of SMCs decreases gradually. The non-magnetic SiO2 phase in SMCs is responsible for a reduction in effective permeability.28 An increase in the distance between ferromagnetic particles could result in a reduction in their effective permeability. The increasing thickness of the SiO2 layer could increase the distance between magnetic particles, resulting in a slower magnetic response of the magnetic particles to an applied magnetic field and a consequent increase in Hc.11 This causes the hysteresis loss of SMCs to increase. A sufficient amount of SiO2 can reduce eddy current loss significantly. Considering the overall magnetic properties of the SMCs, the sample with a TEOS content of 0.02 mL g−1 shows the optimum performance properties with an effective permeability of 78.15 and core loss of 633.44 kW m−3 at 100 kHz and 100 mT.
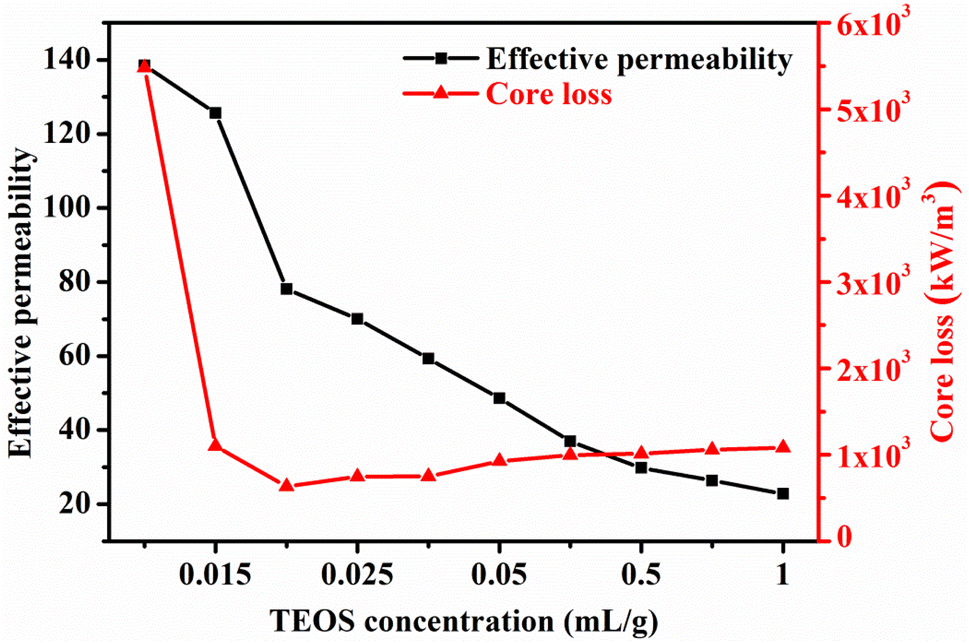 | ||
| Fig. 9 Magnetic properties of SMCs prepared with different TEOS concentrations measured at 100 mT. | ||
Table 1 displays the effective permeability and loss results for various types of soft magnetic composites. In our past works, we demonstrated that the pure FeNiMo compacts presented higher effective permeability (152) and larger loss (7038 kW m−3) after 600 °C pretreatment process in H2/Ar mixture.14 The high-temperature treatment in a reducing atmosphere could effectively remove metal oxides from the FeNiMo material surface and increase the content of elemental states, thereby further significantly improving the effective permeability of FeNiMo raw powders. Kollár also reported that the pure FeNiMo with smoothing the surfaces of individual particles exhibited smaller hysteresis loss and larger eddy loss.29,30 At 100 kHz and 100 mT, the effective permeability and the core loss of FeNiMo/SiO2 SMCs optimized by the insulation coating process were 78.15 and 633.44 kW m−3, respectively. Obviously, the SiO2 coating effectively reduces the core loss of FeNiMo. In comparison to FeNiMo-based SMCs, our samples have a greater effective permeability and lower core loss. Relative to Fe-based SMCs coated with SiO2, Al2O3, and NiZn ferrite, the FeNiMo/SiO2 SMCs have a significantly higher effective permeability and a significantly lower core loss. Comparative analysis revealed that FeNiMo/SiO2 SMCs have higher effective permeability and lower core loss than the majority of the soft magnetic particle cores under identical test conditions.
| SMCs | 50 kHz | 100 kHz | B/mT | Ref. | ||
|---|---|---|---|---|---|---|
| μeff | Pcv/kW m−3 | μeff | Pcv/kW m−3 | |||
| FeNiMo/SiO2 | 78.17 | 6.0664 | 78.15 | 24.318 | 20 | This work |
| 52.759 | 133.48 | 50 | ||||
| 263.29 | 633.44 | 100 | ||||
| FeNiMo/Al2O3 | 87.6 | 321.78 | — | — | 100 | 31 |
| FeNiMo/resin | — | — | 30 | 6180 | 100 | 32 |
| Fe/Al2O3 | 88.1 | 310.65 | — | — | 20 | 33 |
| Fe/Al2O3 | — | — | 42 | 353 | 20 | 34 |
| Fe/NiZn | 43.5 | 94.83 | 43.14 | 199.3 | 20 | 35 |
| Fe/SiO2/MnZn | — | — | 64 | 104.9 | 20 | 36 |
| Fe3Si/Al2O3 | 113.9 | 3609 | — | — | 50 | 11 |
3.4 High-frequency stability
The index parameter of high-frequency stability in the range of 100 kHz to 1 MHz, μf/μ100 kHz was used, where f represents the effective permeability at the given frequency and μ100 kHz is the effective permeability at 100 kHz. Fig. 10 shows a comparison of the high-frequency stability for various SMCs. In this study, the high-frequency stability of the optimized powder cores was significantly enhanced through the insulation coating process. Here 1 MHz stability is achieved at 98.7%. In comparison to other SMCs such as FeNiMo/Al2O3,31 Fe/Al2O3,34,37 Fe3Si/Al2O3,11 FeSiAl/Al2O3,24 Fe/SiO2 (ref. 36) and FeSiCr/NiZn,38 the FeNiMo/SiO2 cores have enhanced high-frequency stability in the range of 100–1000 kHz.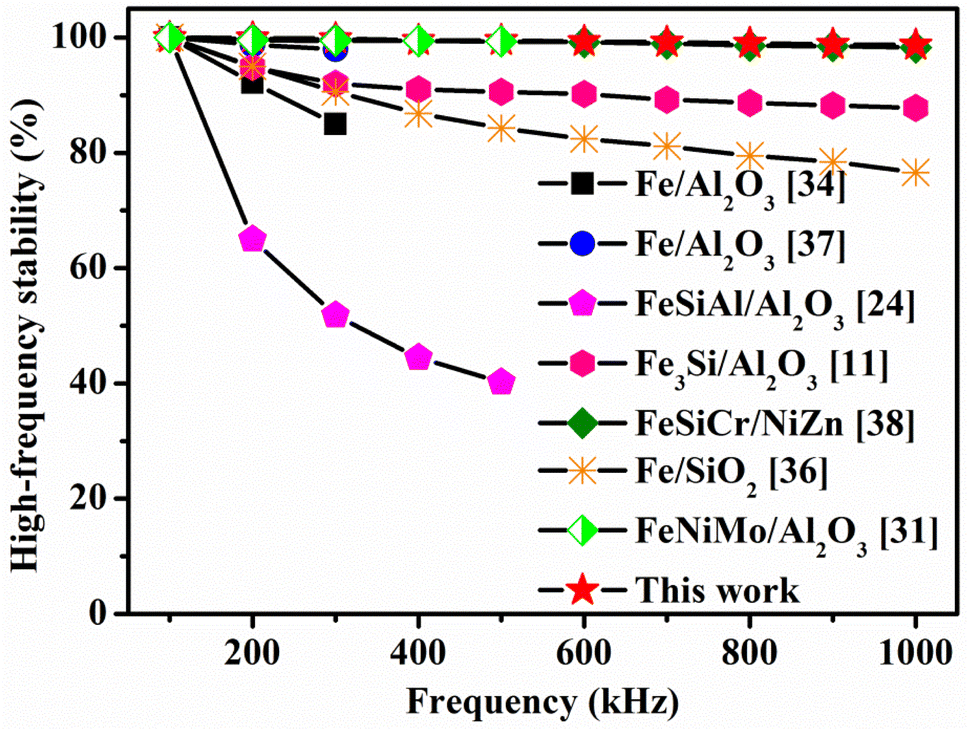 | ||
| Fig. 10 The comparison of high-frequency stability for different types of SMCs. | ||
3.5 Commercial product comparison
Fig. 11 illustrates the results of the comparison with the magnetic properties of domestic and foreign commercial molypermalloy powder (MPP) cores at 100 mT. More specific data are presented in Table S2 in the ESI.† In comparison with 60μ commercial products, the samples prepared in this paper are superior to those of Beijing Seven Star Flight Electron Co., Ltd. (abbreviated as SSFE) and Magnetics. Furthermore, the magnetic properties of our samples are similar to those of CSC and KDM. In addition, the samples prepared in this study have a higher effective permeability of 78μ.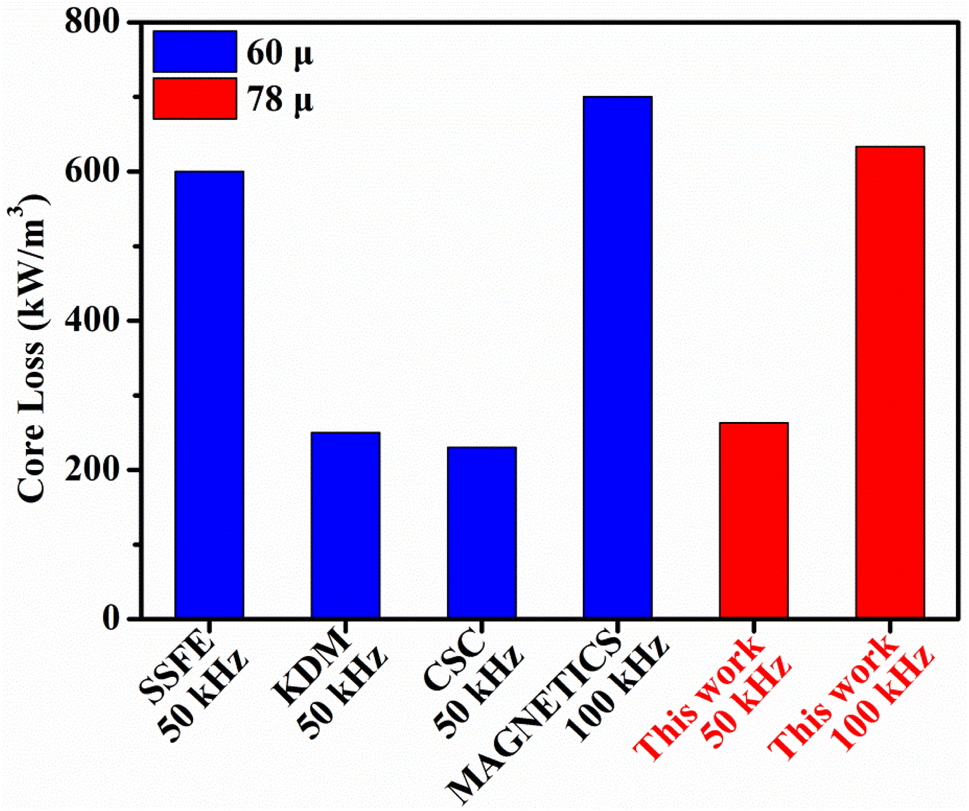 | ||
| Fig. 11 Comparison of magnetic properties with domestic and foreign commercial MPP cores at 100 mT. | ||
4. Conclusions
The magnetic properties of the sol–gel method-prepared FeNiMo/SiO2 soft magnetic composites were investigated. The results indicate that a uniform SiO2 insulating layer can effectively separate FeNiMo alloy particles. By adding TEOS, the thickness of the SiO2 insulating layer can be precisely controlled. However, excessive TEOS could decrease effective permeability and increase hysteresis loss in SMCs. This causes the magnetic properties of SMCs to decrease. The effective permeability of the SMCs decreases as the TEOS concentration range increases from 0.01 to 1 mL g−1, whereas the core loss initially decreases and then increases. Specifically, FeNiMo/SiO2 SMCs compacted with TEOS concentration of 0.02 mL g−1 exhibit favorable performance characteristics, including good frequency stability, high effective permeability (78.15 at 100 kHz), and low core loss (633.44 kW m−3 at 100 kHz and 100 mT). The SMCs described in this paper have higher effective permeability, lower loss, and enhanced high-frequency stability compared to the results reported in the literature. The magnetic properties of SMCs are comparable to those of commercially available materials. This research is anticipated to serve as a valuable resource for the domestic development of high-frequency SMCs.Conflicts of interest
There are no conflicts to declare.Acknowledgements
This work was supported by the National Natural Science Foundation of China (Grant No. U2230119 and 11964001), Sichuan Science and Technology Program (Grant No. 2022NSFSC0333) with special project for the resource development of Panxi, and Outstanding Youth Science and Technology Talents Program of Sichuan (Grant No. 22JCQN0005).Notes and references
- D. Z. Xie, K. H. Lin and S. T. Lin, J. Magn. Magn. Mater., 2014, 353, 34–40 CrossRef CAS.
- Y. Ustinovshikov and I. Shabanova, J. Alloys Compd., 2013, 578, 292–296 CrossRef CAS.
- J. Füzer, P. Kollár and D. Olekšáková, J. Alloys Compd., 2009, 483, 557–559 CrossRef.
- M. Streckova, R. Bures, M. Faberova and L. Medvecky, Chin. J. Chem. Eng., 2015, 23, 736–743 CrossRef CAS.
- Y. Yi, Y. D. Peng, C. Xia, L. Y. Wu, X. Ke and J. W. Nie, J. Magn. Magn. Mater., 2019, 476, 100–105 CrossRef CAS.
- M. M. Dias, H. J. Mozetic, J. S. Barboza and R. M. Martins, Powder Technol., 2013, 237, 213–220 CrossRef CAS.
- S. Wu, A. Z. Sun, F. Q. Zhai, J. Wang, Q. Zhang, W. H. Xu, P. Logan and A. A. Volinsky, J. Magn. Magn. Mater., 2012, 324, 818–822 CrossRef CAS.
- P. Kollár, V. Vojtek, Z. Birčáková, J. Füzer, M. Fáberová and R. Bureš, J. Magn. Magn. Mater., 2014, 353, 65–70 CrossRef.
- M. Yaghtin, A. H. Taghvaei, B. Hashemi and K. Janghorban, J. Alloys Compd., 2013, 581, 293–297 CrossRef CAS.
- A. K. Li, L. Y. Li, L. W. Wu and J. H. Yi, Chin. J. of Nonferrous Met., 2013, 23, 1065–1072 CAS.
- X. A. Fan, J. Wang, Z. Y. Wu and G. Q. Li, Mater. Sci. Eng. B, 2015, 201, 79–86 CrossRef CAS.
- B. Yang, Z. B. Wu, Z. Y. Zou and R. H. Yu, J. Phys. D: Appl. Phys., 2010, 43, 365003 CrossRef.
- B. Zhou, Y. Q. Dong, Q. Chi, Y. Q. Zhang, L. Chang, M. J. Gong, J. J. Huang, Y. Pan and X. M. Wang, Ceram. Int., 2020, 46, 13449–13459 CrossRef CAS.
- Z. Xiong, J. Yang, Y. Wang, L. Yang, X. Guan, L. Cao, J. Wang and Z. Gao, Acta Phys. Sin., 2022, 71, 157502 CrossRef.
- X. L. Zheng, Z. H. Zhu and X. M. Li, Rare Met., 2014, 33, 573–577 CrossRef CAS.
- R. B. Yang and W. F. Liang, J. Appl. Phys., 2013, 113, 17A315 CrossRef.
- X. A. Fan, Z. Y. Wu, G. Q. Li, J. Wang, Z. D. Xiang and Z. H. Gan, Mater. Des., 2016, 89, 1251–1258 CrossRef CAS.
- L. Li, Z. Gao, A. Li, J. Yi and Y. Ge, J. Magn. Magn. Mater., 2018, 464, 161–167 CrossRef CAS.
- J. L. Ni, F. Duan, S. J. Feng, F. Hu, X. C. Kan and X. S. Liu, J. Alloys Compd., 2022, 897, 162724 CrossRef.
- R. D. Guo, G. L. Yu, M. M. Zhu, Y. Qiu, G. H. Wu and H. M. Zhou, J. Alloys Compd., 2022, 895, 163191 Search PubMed.
- W. Li, T. Ohkubo and K. Hono, Acta Mater., 2009, 57, 1337–1346 CrossRef CAS.
- Y. Nakamura, J. Phys. Soc. Jpn., 1961, 16, 2167–2171 CrossRef.
- Z. G. Luo, X. A. Fan, W. T. Hu, F. Luo, G. Q. Li, Y. W. Li, X. Liu and J. Wang, Adv. Powder Technol., 2019, 30, 538–543 CrossRef CAS.
- F. Luo, X. A. Fan, Z. G. Luo, W. T. Hu, J. Wang, Z. Y. Wu, G. Q. Li, Y. W. Li and X. Liu, J. Magn. Magn. Mater., 2020, 498, 166084 CrossRef CAS.
- J. Fuzerova, J. Fuzer, P. Kollar, R. Bures and M. Faberova, J. Magn. Magn. Mater., 2013, 345, 77–81 CrossRef CAS.
- D. Liu, C. Wu, M. Yan and J. Wang, Acta Mater., 2018, 146, 294–303 CrossRef CAS.
- X. X. Zhong, J. C. Chen, L. Wang, B. J. Li and L. Z. Li, J. Alloys Compd., 2018, 735, 1603–1610 CrossRef CAS.
- K. J. Geng, Y. Y. Xie, L. Yan and B. Yan, J. Alloys Compd., 2017, 718, 53–62 CrossRef CAS.
- D. Olekšáková, P. Kollár, M. Jakubčin, J. Füzer, M. Tkáč, P. Slovenský, R. Bureš and M. Fáberová, J. Mater. Sci., 2021, 56, 12835–12844 CrossRef.
- P. Kollár, D. Olekšáková, M. Jakubčin, M. Tkáč, J. Füzer, R. Bureš and M. Fáberová, AIP Conf. Proc., 2021, 2411, 050007 CrossRef.
- Z. X. Yao, Y. D. Peng, C. Xia, X. W. Yi, S. H. Mao and M. T. Zhang, J. Alloys Compd., 2020, 827, 154345 CrossRef CAS.
- B. V. Neamţu, O. Geoffroy, I. Chicinaş and O. Isnard, Mater. Sci. Eng. B, 2012, 177, 661–665 CrossRef.
- Y. D. Peng, J. W. Nie, W. J. Zhang, J. Ma, C. X. Bao and Y. Cao, J. Magn. Magn. Mater., 2016, 399, 88–93 CrossRef CAS.
- J. Lei, J. W. Zheng, H. D. Zheng, L. Qiao, Y. Ying, W. Cai, W. C. Li, J. Yu, M. Lin and S. L. Che, J. Magn. Magn. Mater., 2018, 472, 7–13 CrossRef.
- Y. D. Peng, Y. Yi, L. Y. Li, H. Y. Ai, X. X. Wang and L. L. Chen, J. Magn. Magn. Mater., 2017, 428, 148–153 CrossRef CAS.
- L. Y. Li, Q. L. Chen, Z. Gao, Y. C. Ge and J. H. Yi, J. Alloys Compd., 2019, 805, 609–616 CrossRef CAS.
- J. W. Zheng, H. D. Zheng, J. Lei, Y. Ying, L. Qiao, W. Cai, W. C. Li, J. Yu, Y. P. Tang and S. L. Che, J. Magn. Magn. Mater., 2020, 499, 166255 CrossRef CAS.
- R. D. Guo, S. M. Wang, Z. Yu, K. Sun, X. N. Jiang, G. H. Wu, C. J. Wu and Z. W. Lan, J. Alloys Compd., 2020, 830, 154736 CrossRef CAS.
Footnotes |
| † Electronic supplementary information (ESI) available: Average sizes of FeNiMo/SiO2 powder cores (Fig. S1), EDS elemental distribution mapping (Fig. S2), elemental ratios of powders (Table S1), and the comparison of magnetic properties with domestic and foreign commercial molypermalloy powder (MPP) cores (Table S2). See DOI: https://doi.org/10.1039/d3ra01523h |
| ‡ These authors contributed equally to this work. |
| This journal is © The Royal Society of Chemistry 2023 |