 Open Access Article
Strongly bound Wannier–Mott exciton in pristine (LaO)MnAs and origin of ferrimagnetism in F-doped (LaO)MnAs†
Jessie Manopo abc,
Tio Prince Lubisab,
Muhammad Arief Mustajab Enha Maryono
 b,
Pepen Arifinb,
Toto Winatab,
Rena Widita
 d and
Yudi Darma
 *abc
*abc
aQuantum Semiconductor and Devices Lab, Department of Physics, Faculty of Mathematics and Natural Sciences, Bandung Institute of Technology, Jalan Ganesha 10, Bandung, 40132, Indonesia. E-mail: yudi@itb.ac.id
bPhysics of Electronic Materials Research Division, Department of Physics, Faculty of Mathematics and Natural Sciences, Bandung Institute of Technology, Jalan Ganesha 10, Bandung, 40132, Indonesia
cResearch Collaboration Center for Quantum Technology 2.0, Bandung 40132, Indonesia
dNuclear Physics and Biophysics Research Division, Department of Physics, Faculty of Mathematics and Natural Sciences, Bandung Institute of Technology, Jalan Ganesha 10, Bandung, 40132, Indonesia
First published on 9th May 2023
Abstract
We study the electronic, magnetic, and optical properties of (LaO1−xFx)MnAs (x = 0, 0.0625, 0.125, 0.25) systems, calculated using the generalized gradient approximation (GGA) corrected by Hubbard energy (U) = 1 eV. For x = 0, this system shows equal bandgap (Eg) values for spin-up and spin-down of 0.826 eV, with antiferromagnetic (AFM) properties and local magnetic moment in the Mn site of 3.86 μB per Mn. By doping F with x = 0.0625, the spin-up and spin-down Eg values decrease to 0.778 and 0.798 eV, respectively. This system, along with antiferromagnetic properties, also has a local magnetic moment in the Mn site of 3.83 μB per Mn. Increasing doping F to x = 0.125 induces increases of Eg to 0.827 and 0.839 eV for spin-up and spin-down. However, the AFM remains, where μMn slightly decreases to 3.81 μB per Mn. Furthermore, the excess electron from the F ion induces the Fermi level to move toward the conduction band and changes the bandgap type from indirect bandgap (Γ → M) to direct bandgap (Γ → Γ). Increasing x to 25% induces the decrease of spin-up and spin-down Eg to 0.488 and 0.465 eV, respectively. This system shows that the AFM changes to ferrimagnetism (FIM) for x = 25%, with a total magnetic moment of 0.78 μB per cell, which is mostly contributed by Mn 3d and As 4p local magnetic moments. The change from AFM to FIM behavior results from competition between superexchange AFM ordering and Stoner's exchange ferromagnetic ordering. Pristine (LaO)MnAs exhibits high excitonic binding energy (∼146.5 meV) due to a flat band structure. Our study shows that doping F in the (LaO)MnAs system significantly modifies the electronic, magnetic, and optical properties for novel advanced device applications.
Introduction
The layered oxypnictide (LnO)TPn (Ln = lanthanide, T = transition metal, and Pn = pnictide) has various physical properties that have attracted much attention and intensive investigations. The superconducting properties were discovered in (LaO)FeAs by doping F at high Curie temperature (26 K TC).1 (LnO)CoAs shows itinerant ferromagnetism with TC between 60 K and 80 K.2–4 LaONiAs exhibits superconducting transition at TC ∼ 2.4 K5 and a strong-coupling superconducting behavior with the enhanced TC by F substitutional doping at O sites.6 (LaO)ZnPn (Pn = P, As, Sb) shows diamagnetic semiconductor behavior for (LaO)ZnP and paramagnetic semiconductor for (LaO)ZnAs and (LaO)ZnSb.7–10(LaO)MnAs is one of the manganese-based layered oxypnictides, formed by La–O blocking layers and Mn–As layers stacked alternately along the c-axis. Arsenic ions are surrounded tetrahedrally by Mn, and La ions are surrounded by O. (LaO)MnAs exhibits negative giant magnetoresistance of up to −24% at 200 K.11 (LaO)MnAs is an antiferromagnetic semiconductor with high Néel temperature (317 K TN),11,12 and the antiferromagnetic semiconductor is seen as a promising material for spintronic devices because it has a higher magnetic ordering temperature than diluted magnetic semiconductors (DMSs). This suggestion is indicated by the high temperature.13,14 (LaO)MnAs also exhibits Mott insulator behavior15,16 due to the superexchange interaction between Mn and As ions,12 making this material interesting to study and develop.
Experimental research has reported the indirect bandgap value (∼1.4 eV) for (LaO)MnAs.17 A theoretical study reports an indirect bandgap of 0.46 eV and a magnetic moment of 3.54 μB per Mn cell from calculations based on density functional theory using generalized gradient approximation (GGA).18
Various doping approaches have been performed to modify the properties of the (LaO)MnAs system. A study in physical properties of the (LaO)MnAs layer due to F and Zn doping in the form of polycrystals grown by solid-state reaction method showed a clear increase in the lattice constants (a and c) for F doping. Increasing doping F in (LaO)MnAs decreases the absolute value of electrical resistivity dramatically (0–300 K), with a phase change from antiferromagnetic to paramagnetic properties. However, Zn substitution does not show apparent dependence on the resistivity.16 On the other hand, hole doping also changes the electronic properties of this system,19 and doping holes into [LaO] layers changes the antiferromagnetic insulating to ferromagnetic metallic behavior at room temperature (RT). The doping was performed by inducing defects in [LaO] layers. Achieving x = 0.3, the (LaO)1−xMnAs system exhibits metallic behavior for T < 150 K.20
In a previous work, we investigated the electronic and magnetic properties of the (LaO)MnAs system, again using a GGA functional, with Hubbard energy (U) applied for the Mn 3d orbital of 0–10 eV. The term U is significant in changing the structural properties, Eg, and magnetic moment of the Mn ion. Our calculation shows that the Eg of the system increases with the U value, with the maximum value at U = 8 eV, which is the closest Eg to the experimental result17 but shows an overestimated lattice parameter. In considering the structural properties, the value of U = 1 eV is the most appropriate, which leads to Eg and μMn of 0.834 eV and 4.31 μB. Increasing U induces increased local-symmetry distortions in MnAs4 and OLa4.21
In this paper, we study the structural, electronic, magnetic, and optical properties of layered manganese-based (LaO)MnAs, with doping F− ions at the O2− site. This system was calculated by first principles based on the density functional theory (DFT). We studied (LaO1−xFx)MnAs, where x = 0, 0.0625, 0.125, and 0.25. The structural parameters are systematically reported. The electronic properties are discussed in terms of band structure, and magnetic properties are discussed in terms of density of states (DOS). Energy-dependent total and projected DOS were revealed to find the electronic properties of each orbital. Finally, the dielectric function is also calculated to reveal its optical properties, which are yet to be explored.
Computational methodology
We used the Quantum ESPRESSO code22 to calculate the electronic and magnetic structure of (LaO1−xFx)MnAs. Our previous calculations using Quantum ESPRESSO confirmed accurate results supporting the experimental data.23 In this work, our calculation accomplishes the plane-wave method within the generalized gradient approximation (GGA) and employing the Perdew–Burke–Ernzerhof (PBE)-type exchange–correlation functional energy.24As the host material, (LaO)MnAs has a tetragonal crystal structure with the centrosymmetric space group P4/nmm. From the experimental result, we use the initial structural parameters a = b = 4122 Å and c = 9048 Å.12 For the self-consistence-field (SCF) calculation, we set the threshold energy of 10−3 hartree (∼2.72 × 10⁻³ eV), cut-off kinetic energy at 50 Rydberg (∼680 eV), and k-point mesh of 8 × 8 × 4 (x = 0) and 5 × 5 × 4 (x = 0.0625, 0.125, and 0.25). We use the on-site Coulomb repulsion energy (U)25 in the Mn 3d orbital with U = 1 eV, which is the most appropriate value considering the structural properties.21 For band calculation, we calculated within a k-point path of M–A–Z–Γ–X–M–Γ in the corresponding Brillouin zone, as in our previous work.21 Non-self-consistent-field (NSCF) calculation was performed to generate a spin-polarized total and projected DOS using the double k-point mesh of 16 × 16 × 8 (x = 0) and 10 × 10 × 8 (x = 0.0625, 0.125 and 0.25). The calculations of the dielectric tensor were carried out using density functional perturbation theory (DFPT) within random phase approximation (RPA) and independent particle approximation (IPA). Norm-conserving pseudopotentials from the SG15 database were used.
In order to predict the excitonic binding energy of all doped and pristine structures, the effective mass of the electron and hole was calculated using eqn (1) from the band structure curve. The electron effective mass and the hole effective mass were calculated from the specific band at the conduction band and valence band, respectively (depending on the optical transition of interest).
 | (1) |
The Wannier–Mott exciton binding energy was calculated using eqn (2),26
 | (2) |
 and is the reduced mass of the electron–hole pair calculated using an electron
  and hole
  effective mass; ε∞ is the calculated high-frequency dielectric constant at the PBE + U level, and Ry is the Rydberg energy (13.6 eV).
The crystal structure was visualized with X-Crysden.27 We use different supercell structures for each x of (LaO1−xFx)MnAs as shown in Fig. 1. For x = 0, we calculate within the unit cell structure (1 × 1 × 1). Supercells 2 × 2 × 2, 2 × 2 × 1, and 1 × 1 × 2 were used for x = 0.0625, 0.125, and 0.25, respectively, where F− replaced one of the atoms at the O2− site.
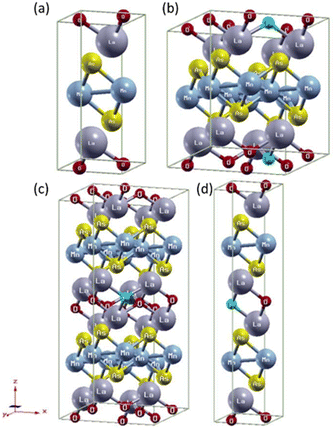 | ||
| Fig. 1 Crystal structure (LaO1−xFx)MnAs: (a) x = 0, (b) x = 0.0625 (supercell 2 × 2 × 2), (c) x = 0.125 (supercell 2 × 2 × 1), (d) x = 0.25 (supercell 1 × 1 × 2). | ||
Results and discussions
Band structure
Fig. 2 shows the band structure of the (LaO1−xFx)MnAs system with x = 0, 0.0625, 0.125, and 0.25, and we are only present for a single spin orientation. In Fig. 2a, the band structure for x = 0 exhibits the indirect band from Γ at the valence band maximum (VBM) to M at the conduction band minimum (CBM) (Γ → M) with an equal bandgap value of 0.826 eV for the spin up and spin down. This result shows not much difference from the previous calculation (0.834 eV from Γ to M) with the same U value.21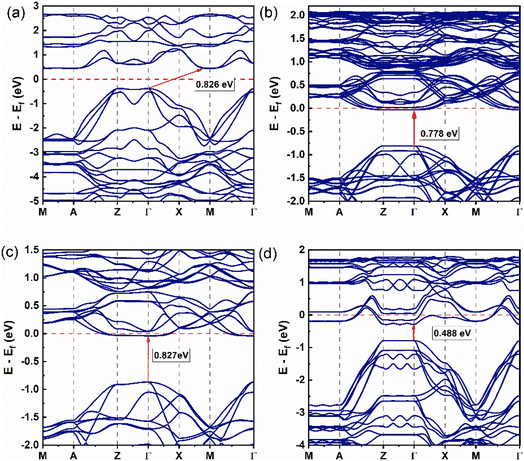 | ||
| Fig. 2 Band structure of (LaO1−xFx)MnAs system (single spin orientation, spin-up): (a) x = 0, (b) x = 0.0625, (c) x = 0.125, and (d) x = 0.25. | ||
Increasing the x value induces a change in bandgap type to a direct bandgap, from Γ at the VBM to Γ at the CBM for x = 0.0625, 0.125, 0.25, with the band gap values of 0.778 and 0.798 eV, 0.827 and 0.839 eV, and 0.488 and 0.465 eV, for spin-up and spin-down, respectively (Fig. 2b–d). Increasing the number of F doping changes the bandgap value with an irregular trend. In the higher doping concentration, we find that setting the x value to 0.0625, 0.125, and 0.25 induces the valence band to move closer to the conduction band until it passes the Fermi energy, which shows us the n-type semiconductor and metallic behavior is found and indicated by band spreading upon the Fermi level. The indirect band gap behavior at x = 0 shows a minimum energy transfer from Γ to M point, preferably showing in-plane electronic transport behavior. The energy transition from other high-symmetry k-points shows that the electronic transport is not completely in-plane.
Density of states
Fig. 3 shows the total DOS for the (LaO1−xFx)MnAs system in the approximate range of −6 to 3 eV. Symmetrical DOS between spin-up and spin-down (Fig. 3a, d and g) are shown for x = 0, 0.0625, and 0.125, which indicate the antiferromagnetic properties with the local magnetic moment in the Mn site of 3.86 μB per Mn, 3.83 μB per Mn, and 3.81 μB per Mn, respectively. For x = 0, the local Mn magnetic moment is in excellent agreement with the experimental value of 3.34 μB at low temperatures.28 The Mn2+ ion in the [MnAs]− layer contributed to this local magnetic moment.28 Due to tetrahedral crystal field splitting, the Mn2+ ion can be present in a high spin (S = 5/2, μ = 5 μB) and low spin state (S = 1/2, μ = μB). The drop in local magnetic moment can be explained by a more profound crystal field splitting, due to smaller Mn–As bond length and smaller As–Mn–As bond angles in the doped compound, which is shown in Table S1 (ESI†). Increasing x to 0.25 induces asymmetrical spin (shown in Fig. 3j), which is an indication of changes in magnetic properties. This system reveals the ferrimagnetic properties with a total magnetization of 0.78 μB per cell. The ferrimagnetic profile can be described using Stoner's model.29 It states that a material would exhibit a net magnetization if D(Ef) × Is ≥ 1, where D(Ef) is the total density of states at the Fermi level and Is is Stoner's parameter.29–31 Stoner's parameter was calculated using exchange splitting Δ and the magnetization density at the Fermi level. The calculated Is is 0.489 eV and D(Ef) is 14.1 states per eV, which corresponds to D(Ef) × Is = 6.91. Our recent findings suggest that the G-type antiferromagnetic behavior of pristine (LaO)MnAs originated from the superexchange mechanism of MnAs4 tetrahedra.21 This research suggests that the superexchange mechanism dominates in the low doping concentration, while high doping concentration (25%) is dominated by Stoner exchange-dominated ferromagnetic (FM) ordering.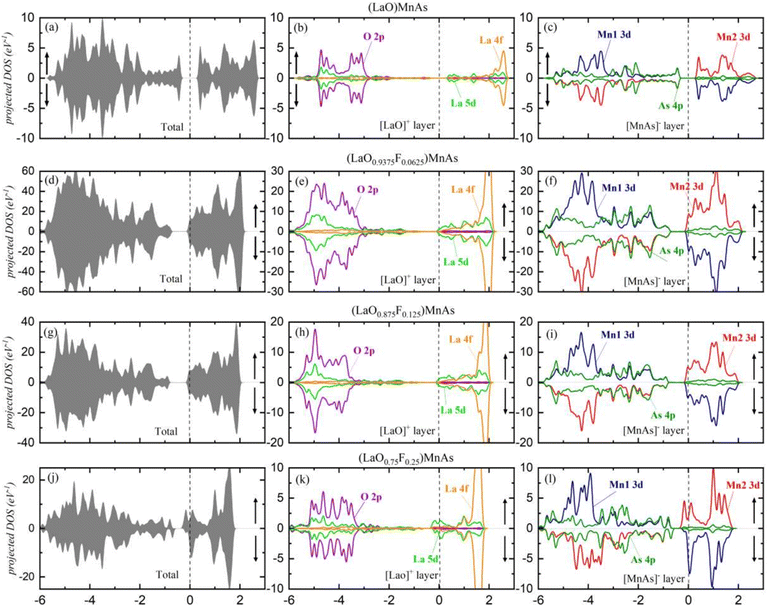 | ||
| Fig. 3 (a, d, g and j) The density of states, showing the total DOS for each x value; (b, e, h and k) the projected DOS for [LaO]− layer; (c, f, i and l) the projected DOS for [MnAs]+ layer. | ||
To explain why high doping concentration (25%) exhibits net magnetization, we plot the pDOS of Mn d orbitals, shown in Fig. S1 (ESI†). In the pristine and lower doping concentration, the dyz and dxz orbitals are degenerate, as shown in the overlapping pDOS graph. In the 25% doping concentration, these orbitals' degeneracy is broken. This is due to a strong deviation in the Mn–As bond length (p and q compared to r and s, as shown in Table S1 (ESI†)), which is not exhibited in the lower doping concentration. Furthermore, there is a huge difference in Mn–As bond lengths in Mn1 and Mn2 in the 25% F-doped (LaO)MnAs. This causes different energy levels of d orbital in the Mn1 compared to Mn2 and thus gives a net magnetization. The Mn d orbital interacts with As p orbital, which is shown in Fig. S2 (ESI†), and thus the As p orbital also exhibits net magnetization.
To confirm that this net magnetization is not caused by a change in the oxidation state of Mn, as we can see from Fig. S1 (ESI†), there are still five unfilled d states above the Fermi level, even after high doping concentration, confirming that there is no change in the Mn oxidation state. This method is also used by Hutchison et al. to predict the oxidation state of Fe in Fe–N–C.32
From the DOS graph, we found the CBM for x = 0 located at approximately 0.28 eV. Increasing the x value leads the CBM to move closer to the valence band (x = 0.0625, 0.125, 0.25; the CBM moving to −0.11 eV, −0.11 eV, and −0.32 eV, respectively), as also shown in the band structure. In the valence band, the highest peak was found in the approximate range of −5 to −4 eV, and in the conduction band, the highest peak was located at ∼2 eV. Different values of each DOS are caused by different cell structures (number of atoms) used for each x value.
The projected DOS are presented in Fig. 3b, e, h and k for the [LaO]+ layer and in Fig. 3c, f, i and l for the [MnAs]− layer. In the layered LaO, we find that La 5d and O 2p states are deeply located in the valence band around −3 eV for all x values. With the deep separation between both states and the Fermi level (EF), electrons in [LaO]+ layers are difficult to excite to the conduction band. On the other hand, La 4f states are localized at 2.4 eV, indicating that the La 4f orbital is empty. For the approximate range from −6 to −3 eV, O 2p orbital dominates the valence band, while La 5d dominates the conduction band in the approximate range of −0.3 to 1 eV. A high peak from La 4f is shown at ∼2 eV, showing this orbital is responsible for the highest peak in the valence band that appears in the DOS. For x = 0.25, suborbital La 5d displays asymmetrical spin at ∼0.1 eV, contributing 0.169 μB per La to the total magnetization.
In the [MnAs]− layer, the result shows conduction bands dominated by Mn1 3d and Mn2 3d in the approximate range of −0.2 to 2 eV. In the valence band, Mn1 3d and Mn2 3d dominate the approximately −3 to 5.5 eV range, and the As 4p state spreads along with the valence band. Mn1 (red line) and Mn2 (blue line) represent opposite magnetic spin in AFM. Increasing x to 0.25 induces asymmetrical spin in Mn and As orbitals. The suborbital As 4p displays asymmetrical spin around the VBM area, which contributes 0.011 μB per cell to the total magnetization, and asymmetrical spin from Mn 3d contributes 0.367 μB per cell.
Structural parameters
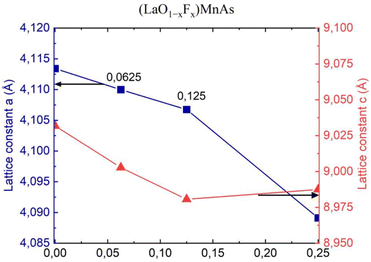
Fig. 4 shows the lattice constants a and c, corresponding to the x value. F− doping indicates a decreasing trend for a and also for c, except the c value for x = 0.25, which shows an increased value compared to the previous point.The decreasing trend for a and c is probably due to different ionic radii, where F− (1.33 Å) has a smaller ionic radius than O2− (1.4 Å).33 Thus, greater concentration of F− induces smaller values of the lattice constant. Different trends were reported in the experiment by Naito et al. (2014), where they found an increasing trend of lattice constant for x = 0–0.1 (step 0.05).16
Optical properties
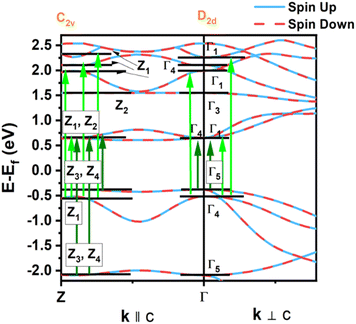
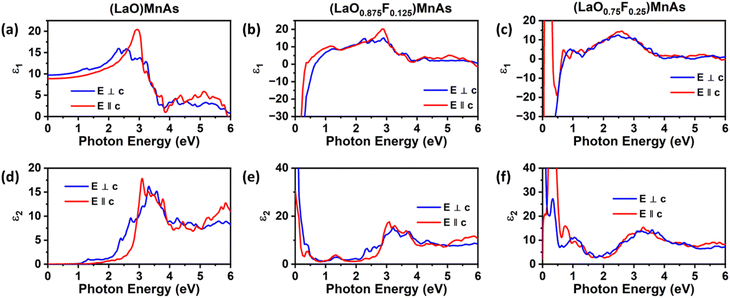
We also compare the optical properties of F-doped (LaO)MnAs and pristine (LaO)MnAs. First, we would like to discuss the calculated dielectric function of pristine (LaO)MnAs. The calculated dielectric function is shown in Fig. 6. The peaks shown in the dielectric function spectra can be assigned to its interband transition shown in Fig. 5, which is consistent with our calculated band structure. The Γ(000) and Z(001) points share the same symmetry with D2d and C2v point groups, respectively. These point groups are noncentrosymmetric; however, due to the nature of the centrosymmetric crystal structure of (LaO)MnAs, it allows optical transition between bands in these k-points. By using this information, we can determine the selection rules for dipolar interband transition using group theory.34 Fig. 5 shows the proposed optical dipole interband transition near the Γ point of pristine (LaO)MnAs. As can be seen in Fig. 5, the lowest energy direct transition from VB to CB on pristine (LaO)MnAs can occur at Z–Γ–X k-points. There is a possible symmetry-allowed direct transition from the topmost valence band to the lowermost conduction band, which is attributed to Γ5 → Γ4 transition, which needs the energy of 1.0265 eV. The electron and hole effective masses on these points are 0.8952me and 1.9694me. Using these values and the calculated high-frequency dielectric constant in E⊥c, which is ε∞ = 9.84, gives us 86.5 meV Wannier–Mott exciton binding energy. Another low-energy direct transition is Γ5 → Γ1 (Eg,da = 1.0265 eV, Eb = 56 meV) and Γ4 → Γ1 (Eg,da = 1.174 eV, Eb = 22 meV), where Eg,da and Eb are symmetry-allowed direct gap and excitonic binding energy, respectively. However, these points would not give such high excitonic binding energy as the band profile is not flat, resulting in low charge carrier effective mass. If we look at the Z point, there is a symmetry-allowed direct transition from the top of the valence band to the bottom of the conduction band, namely from Z3 → Z1, which gives us a symmetry-allowed direct gap of 1.0178 eV. Due to the flatness of the band structure, it gives us a high 2.21me and 1.96me electron and hole effective mass, respectively corresponding to the high excitonic binding energy of 146.5 meV. This high excitonic binding energy leads us to high electron–hole interaction, which is neglected in our calculation, resulting in a blueshift compared to experimental data presented in ref. 18. A similar effect is shown in Cs2SnI6, which shows a comparatively similar exciton binding energy of ∼130 meV, discussed in ref. 35. The imaginary part of the dielectric tensor (ε2) is strongly related to the absorption properties of a system, which we can compare to its interband transition (Fig. 5). From Fig. 6b, we can see that ε2 is higher if E⊥c in the low-energy region; this happens because the low-energy region is dominated by E⊥c symmetry-allowed transition, as illustrated in Fig. 5.Fig. 6 shows the calculated dielectric function of pristine and doped (LaO)MnAs. The dielectric function calculation shows metallic behavior of (LaO0.875F0.125)MnAs and (LaO0.75F0.25)MnAs, in agreement with the electronic structure calculation. The contribution of intraband transition is shown in the low-energy region, and the higher-energy region corresponds to interband transition. The plasmon frequency of (LaO0.875F0.125)MnAs is 1.88 × 10⁻⁴ cm−1 (E⊥c) and 3.45 × 10⁻⁴ cm−1 (E∥c), which can be described qualitatively using the Drude model; higher electron effective mass in k∥c corresponds to a smaller frequency if E∥c, which can be simply seen from the band structure. These plasmonic peaks are also shown in the low-energy region in the electronic energy loss function shown in Fig. 7. Due to doping, the intraband peaks are blueshifted to the higher energy region, in line with the conclusion from electronic structure calculation that the Fermi level position shifted more to the conduction band after electron doping.
 | ||
| Fig. 7 Calculated electron energy loss function (LF) of (a) pristine (LaO)MnAs, (b) (LaO0.875F0.125)MnAs, and (c) (LaO0.75F0.25)MnAs. | ||
The interband transition exhibits a similar profile compared to the pristine one. Several peaks are redshifted to the lower energy region, which is in line with the smaller band gap conclusion from the electronic structure calculation. From the dielectric function, we can obtain its absorption coefficient, refractive index, extinction coefficient, and the optical conductivity, which shows a similar profile to its dielectric function, shown in Fig. S3 (ESI†).
To investigate the interband transition profile of the doped compound, we also calculate the momentum matrix elements (P2) of all structures, which is shown in Fig. S4 (ESI†). Different values of P2 occur due to the different numbers of atoms in one unit cell in every doped compound; therefore, these values cannot be compared directly.36 The momentum matrix elements can determine the selection rule of dipolar optical transition. P2 exhibits nearly isotropic behavior in all k-points, indicating no symmetry-forbidden transition in all k-points, enhancing its optical properties. To explain the anisotropy, take a look at several special k-points, for example, the Z → Γ points belonging to the C2v point group and Γ → X points belonging to the Cs point group. In these point groups, the momentum operators in x, y, and z have different symmetry species; therefore, there is an anisotropy in these momentum matrix elements and also an anisotropy in the dielectric function curve.
Conclusions
We have studied the electronic, magnetic, and optical properties of the (LaO1−xFx)MnAs system with various values of x. The results show that doping F− ion in the O2− site changes the electronic properties in terms of band structure, where the bandgap type changes from indirect to direct bandgap, accompanied by changes in Eg values. Furthermore, F doping induces changes in magnetic properties. Increasing F dopant induces decreasing local magnetic moment in the Mn site due to a more profound crystal field splitting. Increasing the x value to 0.25 changes the antiferromagnetic (AFM) to ferrimagnetic (FIM) property, with a total magnetic moment of 0.78 μB per cell, which is attributed mostly to Mn 3d and La 5d orbitals. The change in AFM to FIM behavior results from competition between superexchange AFM ordering and Stoner's exchange ferromagnetic ordering. In terms of lattice constant, F doping induces a decreasing trend for a and c. Pristine (LaO)MnAs exhibited a high excitonic binding energy (∼146 meV) due to a flat band profile at the VBM and CBM. There is no symmetry-forbidden direct transition from VB to CB in every k-point in both pristine and doped compounds, which enhances its optical properties. Doped (LaO)MnAs exhibits metallic behavior in both optical and electronic properties.Author contributions
Jessie Manopo: methodology, investigation, visualization, formal analysis, writing – original draft. Tio Prince Lubis: investigation, visualization, formal analysis, writing – review and editing. Muhammad Arief Mustajab Enha Maryono: writing – review and editing. Pepen Arifin: writing – review and editing. Toto Winata: writing – review and editing. Rena Widita: formal analysis, validation, writing – review and editing. Yudi Darma: conceptualization, validation, writing – review and editing, supervision, project administration.Conflicts of interest
There are no conflicts to declare.Acknowledgements
This work is partly supported by the Ministry of Education, Culture, Research and Technology of the Republic of Indonesia through the 2022–2023 research program, Riset Unggulan and PPMI from the ITB research program year 2023. J. M. acknowledges Pendidikan Magister menuju Doktor untuk Sarjana Unggul (PMDSU) batch VI scholarship from the Ministry of Education, Culture, Research and Technology of the Republic of Indonesia. The calculation was partially performed at the High Performance Computing (HPC) facility provided by the Research Centre for Nanoscience and Nanotechnology, Institut Teknologi Bandung (ITB), and the HPC facility provided by the Department of Physics, ITB. The authors also thank S. Muhammady for the discussion and technical assistance.Notes and references
- Y. Kamihara, T. Watanabe, M. Hirano and H. Hosono, J. Am. Chem. Soc., 2008, 130, 3296–3297 CrossRef CAS PubMed.
- H. Yanagi, R. Kawamura, T. Kamiya, Y. Kamihara, M. Hirano, T. Nakamura, H. Osawa and H. Hosono, Phys. Rev. B: Condens. Matter Mater. Phys., 2008, 77, 224431 CrossRef.
- H. Ohta and K. Yoshimura, Phys. Rev. B: Condens. Matter Mater. Phys., 2009, 80, 184409 CrossRef.
- Y. K. Li, X. F. Xu, C. Cao, C. Y. Shen, Y. K. Luo, Q. Tao, X. Lin, L. Zhang, G. H. Cao and Z. A. Xu, Phys. Rev. B: Condens. Matter Mater. Phys., 2012, 86, 104408 CrossRef.
- T. Watanabe, H. Yanagi, Y. Kamihara, T. Kamiya, M. Hirano and H. Hosono, J. Solid State Chem., 2008, 181, 2117–2120 CrossRef CAS.
- Z. Li, G. Chen, J. Dong, G. Li, W. Hu, D. Wu, S. Su, P. Zheng, T. Xiang, N. Wang and J. Luo, Phys. Rev. B: Condens. Matter Mater. Phys., 2008, 78, 060504 CrossRef.
- S. Komatsuzaki, Y. Ohki, M. Sasaki, Y. Takahashi, K. Takase, Y. Takano and K. Sekizawa, AIP Conf. Proc., 2006, 850, 1255–1256 CrossRef CAS.
- K. Kayanuma, H. Hiramatsu, M. Hirano, R. Kawamura, H. Yanagi, T. Kamiya and H. Hosono, Phys. Rev. B: Condens. Matter Mater. Phys., 2007, 76, 195325 CrossRef.
- K. Kayanuma, R. Kawamura, H. Hiramatsu, H. Yanagi, M. Hirano, T. Kamiya and H. Hosono, Thin Solid Films, 2008, 516, 5800–5804 CrossRef CAS.
- S. Muhammady, A. S. Erlyanti, R. Widita and Y. Darma, Int. J. Quantum Chem., 2020, 120, e26090 CAS.
- N. Emery, E. J. Wildman, J. M. S. Skakle, G. Giriat, R. I. Smith and A. C. McLaughlin, Chem. Commun., 2010, 46, 6777–6779 RSC.
- K. Takase, S. Hiramoto, T. Fukushima, K. Sato, C. Moriyoshi and Y. Kuroiwa, Appl. Phys. Express, 2017, 10, 123001 CrossRef.
- A. P. Wijnheijmer, X. Martí, V. Holý, M. Cukr, V. Novák, T. Jungwirth and P. M. Koenraad, Appl. Phys. Lett., 2012, 100, 112107 CrossRef.
- T. Jungwirth, V. Novák, X. Martí, M. Cukr, F. Máca, A. B. Shick, J. Mašek, P. Horodyská, P. Němec, V. Holý, J. Zemek, P. Kužel, I. Němec, B. L. Gallagher, R. P. Campion, C. T. Foxon and J. Wunderlich, Phys. Rev. B: Condens. Matter Mater. Phys., 2011, 83, 035321 CrossRef.
- M. Zingl, E. Assmann, P. Seth, I. Krivenko and M. Aichhorn, Phys. Rev. B, 2016, 94, 045130 CrossRef.
- A. Naito, Y. Morosawa, T. Watanabe, Y. Takano and K. Takase, in Proceedings of the 12th Asia Pacific Physics Conference (APPC12), Journal of the Physical Society of Japan, 2014, vol. 1 Search PubMed.
- K. Kayanuma, H. Hiramatsu, T. Kamiya, M. Hirano and H. Hosono, J. Appl. Phys., 2009, 105, 073903 CrossRef.
- A. Beleanu, J. Kiss, G. Kreiner, C. Köhler, L. Müchler, W. Schnelle, U. Burkhardt, S. Chadov, S. Medvediev, D. Ebke, C. Felser, G. Cordier, B. Albert, A. Hoser, F. Bernardi, T. I. Larkin, D. Pröpper, A. V. Boris and B. Keimer, Phys. Rev. B: Condens. Matter Mater. Phys., 2013, 88, 184429 CrossRef.
- A. Higashiya, K. Nakagawa, A. Yamasaki, K. Nagai, S. Fujioka, Y. Kanai, K. Yamagami, H. Fujiwara, A. Sekiyama, A. Abozeed, T. Kadono, S. Imada, K. Kuga, M. Yabashi, K. Tamasaku, T. Ishikawa, S. Toyama and K. Takase, J. Electron Spectrosc. Relat. Phenom., 2017, 220, 58–60 CrossRef CAS.
- K. Takase, A. Naito, A. Higashiya, T. Kadono and S. Imada, Phys. Procedia, 2015, 75, 455–459 CrossRef CAS.
- R. Widita, S. Muhammady, R. D. Prasetiyawati, R. Marlina, L. Suryanegara, B. Purnama, R. Kurniadi and Y. Darma, ACS Omega, 2021, 6, 4440–4447 CrossRef CAS PubMed.
- P. Giannozzi, S. Baroni, N. Bonini, M. Calandra, R. Car, C. Cavazzoni, D. Ceresoli, G. L. Chiarotti, M. Cococcioni, I. Dabo, A. Dal Corso, S. De Gironcoli, S. Fabris, G. Fratesi, R. Gebauer, U. Gerstmann, C. Gougoussis, A. Kokalj, M. Lazzeri, L. Martin-Samos, N. Marzari, F. Mauri, R. Mazzarello, S. Paolini, A. Pasquarello, L. Paulatto, C. Sbraccia, S. Scandolo, G. Sclauzero, A. P. Seitsonen, A. Smogunov, P. Umari and R. M. Wentzcovitch, J. Phys.: Condens. Matter, 2009, 21, 395502 CrossRef PubMed.
- S. Muhammady, Y. Kurniawan, M. A. K. Purbayanto and Y. Darma, Mater. Res. Express, 2018, 5, 066303 CrossRef.
- J. P. Perdew, K. Burke and M. Ernzerhof, Phys. Rev. Lett., 1996, 77, 3865–3868 CrossRef CAS PubMed.
- J. Hubbard, Proc. R. Soc. London, Ser. A, 1963, 276, 238–257 Search PubMed.
- M. A. Fox, Optical Properties of Solids, Oxford Master Series in Physics, Oxford University Press, Oxford, 2002 Search PubMed.
- A. Kokalj, Comput. Mater. Sci., 2003, 28, 155–168 CrossRef CAS.
- N. Emery, E. J. Wildman, J. M. S. Skakle, A. C. McLaughlin, R. I. Smith and A. N. Fitch, Phys. Rev. B: Condens. Matter Mater. Phys., 2011, 83, 144429 CrossRef.
- P. M. Marcus and V. L. Moruzzi, Phys. Rev. B: Condens. Matter Mater. Phys., 1988, 38, 6949 CrossRef PubMed.
- G. M. Dalpian, J. L. F. Da Silva and S. H. Wei, Phys. Rev. B: Condens. Matter Mater. Phys., 2009, 79, 241201 CrossRef.
- M. Mi, X. Zheng, S. Wang, Y. Zhou, L. Yu, H. Xiao, H. Song, B. Shen, F. Li, L. Bai, Y. Chen, S. Wang, X. Liu and Y. Wang, Adv. Funct. Mater., 2022, 32, 2112750 CrossRef CAS.
- P. Hutchison, P. S. Rice, R. E. Warburton, S. Raugei and S. Hammes-Schiffer, J. Am. Chem. Soc., 2022, 144, 16524–16534 CrossRef CAS PubMed.
- R. D. Shannon, Acta Crystallogr., Sect. A: Cryst. Phys., Diffr., Theor. Gen. Crystallogr., 1976, 32, 751–767 CrossRef.
- M. S. Dresselhaus, G. Dresselhaus and A. Jorio, Group theory, Springer Berlin Heidelberg, 2008 Search PubMed.
- S. R. Kavanagh, C. N. Savory, S. M. Liga, G. Konstantatos, A. Walsh and D. O. Scanlon, J. Phys. Chem. Lett., 2022, 13, 10965–10975 CrossRef CAS PubMed.
- W. Meng, X. Wang, Z. Xiao, J. Wang, D. B. Mitzi and Y. Yan, J. Phys. Chem. Lett., 2017, 8, 2999–3007 CrossRef CAS PubMed.
Footnote |
| † Electronic supplementary information (ESI) available. See DOI: https://doi.org/10.1039/d3ra01506h |
| This journal is © The Royal Society of Chemistry 2023 |

