DOI:
10.1039/D3RA01460F
(Paper)
RSC Adv., 2023,
13, 17166-17178
Optimization of Ti–BA efficiently for the catalytic alcoholysis of waste PET using response surface methodology
Received
5th March 2023
, Accepted 21st May 2023
First published on 8th June 2023
Abstract
A titanium benzoate (Ti–BA) catalyst was prepared by hydrothermal method, which has an ordered eight-face structure, and was used for polyethylene terephthalate (PET) depolymerization. With bis(2-hydroxyethyl)terephthalate (BHET) as the target molecule and ethylene glycol (EG) as the solvent, the best reaction conditions for catalytic alcoholysis via a PET alcoholic solution were investigated via response surface experiments and found to be a EG/PET mass ratio of 3.59, temperature of 217 °C and reaction time of 3.3 h. Under these conditions, the amount of the catalyst required was only 2% of the mass of the PET, and the yield of BHET reached 90.01% and under the same conditions, the yield of BHET could still reach 80.1%. Based on the experimental results, the mechanism of alcoholysis, Ti–BA catalyst activated ethylene glycol deprotonation to achieve the progressive degradation of polymers. This experiment provides a reference for the degradation of polymer waste and other transesterification reactions.
1. Introduction
Polyethylene terephthalate (PET) is a major product in polyesters with the advantages of non-toxicity, odorlessness, transparency, stability, and easy processing, and it is widely used in various aspects of life, such as food packaging, clothing, electrical and electronic products, automobiles, machinery, and fast-moving consumer goods.1,2 PET is undoubtedly one of the most widely used plastics in China and the world.3 At present, the output of PET continues to grow, and it is estimated that the global output will exceed 72 × 106 t/a in 2050, but the recycling efficiency is less than 10%.4 The good stability of PET makes it difficult to degrade in nature, so it is of great significance to develop efficient recycling technology for waste PET to alleviate environmental pressure and resource circulation. According to the different ways of the recycling and reuse of waste PET at present, it can be divided into three categories: (1) chemical recycling.5,6 This process has high efficiency, under the added reagent, PET can be depolymerized into monomers at high temperatures, and the performance of PET polymerized by monomers is good. Chemical recycling is an effective way to achieve the sustainable use of the plastic cycle. (2) Physical recycling,7,8 this process recycles PET for the second time after extrusion using a machine, but the quality index of recycled PET will decrease, so the number of recycling is limited. (3) Biological recycling,9,10 this is similar to chemical recycling, which depolymerizes PET into monomers, but the cost of the biological enzyme catalyst used is high and the efficiency is poor, so it is restricted from industrial applications.
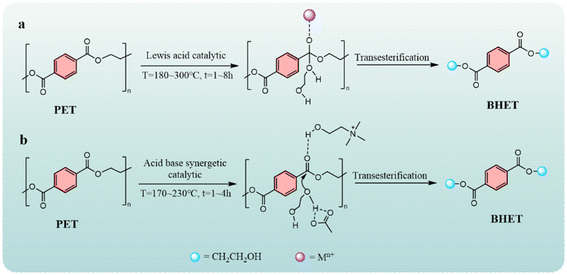
The chemical recycling process of PET can be further subdivided into hydrolysis,11 transesterification,12,13 pyrolysis,14,15 biodegradation,16,17 saccharification,18 amination,19 and hydrogenolysis,20 and the majority of the depolymerization products are terephthalic acid esters or terephthalic acid and ethylene glycol. Transesterification is the addition of alcohol solvents to the reaction system, which does not require high temperature and high pressure and generates no waste liquid compared with other depolymerization methods. EG as a transesterification solvent has been widely studied, and PET can be depolymerized into BHET monomers.21,22 The mechanism of EG transesterification of PET is shown in Fig. 1, catalysts for PET glycol degradation including ionic liquids, metal oxides, and metal salts. As for the current status of PET is concerned depolymerization, in terms of catalysts, ionic liquids are expensive, and the preparation process of metal oxide catalysts requires high temperatures, increasing input costs. Zinc acetate is a commonly used depolymerization catalyst, although it has a better effect than the first two types of catalysts. The corrosion of the equipment is more serious, and storage needs dry conditions to waterproof hydrolysis and be technically and economically viable. Currently, reported using ethylene glycol as a solvent for the degradation of PET, BHET yield is mostly 50–80%, rarely more than 90%. According to the type of catalyst, the alcohololysis mechanism is mainly divided into two types but the same point is that under the cooperation of alcohol, the active centers of the catalyst attack the carbonyl group to realize the degradation of PET.23–26
 |
| | Fig. 1 PET glycolysis mechanism. | |
Response surface methodology (RSM) is an effective tool and means to optimize a chemical process, which is the combination of designing experiments, establishing experimental models, and evaluating the influence of variables and their interactions.27,28 The main advantage of RSM is that it reduces the number of experiments, so it requires fewer levels and can evaluate independent variables and their interactions.29–31 The Box–Behnken design (BBD) is one of the many RSMs that have been widely used by researchers in PET depolymerization experiments to optimize variables while further analyzing the interactions between different variables. In addition, this method can effectively estimate the factors of the quadratic model and avoid combination processing within the extreme range.32–35
To find a catalyst with better comprehensive cost performance, in this study, we introduce a homemade Ti–BA catalyst for EG depolymerization of waste PET bottles at atmospheric pressure to obtain BHET, this has not been reported in the current catalytic degradation reaction system, compared with other catalysts for degrading PET, Ti–BA catalyst with titanium as the active center, harmless to organisms, and has no heavy metal effect, is the best choice as the metal activity center in the catalyst. The Ti–BA catalyst prepared in this study has high catalytic activity, low input cost, and is not easy to hydrolyze, which is suitable for catalyzing polyester depolymerization. Design Expert software was used to optimize the reaction parameters such as the solvent amount, depolymerization temperature, and depolymerization time through the response surface methodology, which maximized the BHET yield. This study introduces a fast and simple method for PET depolymerization.36–38
2. Experiment and methods
2.1 Materials and instruments
2.1.1 Materials. Waste PET flakes (polyester beverage bottles), benzoic acid (BA), ethanol, titanium ester, and other chemicals were analytically pure, deionized water was used.
2.1.2 Instruments. The infrared spectrometer (IR, Tensor II), Bruker Co., Germany, scanning electron microscope (SEM, TM-3000), Hitachi Co., Japan, laser particle size distributor (BT-800), Bettersize, China, nuclear magnetic resonance hydrogen spectrometer (1H-NMR, NEO-400), Bruker Co., Germany, differential Scanning Calorimeter (DSC, DSC-822e), Mettler Toledo, Switzerland, specific surface area and pore size analyzer (BET, JT-2000), Beijing Jiaxinrui Technology Co., China.
2.2 Methods
2.2.1 Synthesis of Ti–BA catalyst. A certain amount of BA and titanium ester were placed in a polytetrafluoroethylene bottle, stirred evenly, and then the polytetrafluoroethylene bottle containing the raw material was transferred to a water bath at 130 °C and reacted for 24 h. The solid product in the reaction bottle was washed with anhydrous ethanol several times and dried under vacuum at 80 °C for 12 h to obtain a white powdered product, which was the prepared catalyst and called Ti–BA. The schematic diagram is shown in Fig. 2.
 |
| | Fig. 2 Schematic diagram of synthesizing Ti–BA. | |
2.2.2 Depolymerization procedures. First, PET flakes (5.0 g) were washed and dried and a certain amount of catalyst, and EG were added to the reaction flask, and the reaction was carried out by magnetic stirring and reflux condensation. The reaction conditions for PET catalytic alcoholic cleavage were: reaction temperature of 180, 200, and 220 °C, catalyst was activated for a certain period before use, with an amount of 2% PET mass, EG amount of 3, 4, 5 times of PET mass, the reaction time of 2, 3, 4 h (the time when the reaction system reaches the set temperature as the reaction starting time). After the reaction, the reaction mixture was filtered into deionized water, placed in the refrigerator for 24 h, and finally, the product was filtered, dried in a vacuum at 100 °C, and then weighed.
2.2.3 Analytical procedures. After the degradation experiment, a certain amount of deionized water was added and washed, and filtered; the filter cake was undepolymerized PET oligomer, the undepolymerized PET oligomer was dried, weighed, and recorded; the filtrate was a mixture of ethylene glycol, deionized water, and BHET, put in the refrigerator and refrigerated (5 °C) for 24 h. Finally, the product was filtered, dried under vacuum at 100 °C and weighed, the BHET yield was calculated using the formula:| | |
Yield (%) = mc/ma × 100
| (1) |
ma – the theoretical mass of BHET, g; mb – the mass of the reacted PET, g; mc – the actual mass of BHET, g; Ma – the relative molecular mass of BHET; Mb – the relative molecular mass of the PET repeating unit.
2.2.4 Response surface optimization experiments. Using the Design Expert 13.0 software, the Box–Behnken central composite design was adopted and the mass ratio of EG/PET (A), reaction temperature (B), and reaction time (C) were selected as independent variables, and the yield of BHET obtained by catalytic degradation of PET was taken as response value. The coding values of factors and levels for response surface analysis are shown in Table 1.
Table 1 Experimental range and level of independent variables
| Symbol |
Factor |
Range and level |
| −1 |
0 |
1 |
| A |
m(EG)/m(PET) |
3.0 |
4.0 |
5.0 |
| B |
Depolymerization temperature (°C) |
180 |
200 |
220 |
| C |
Depolymerization time (h) |
2 |
3 |
4 |
The data fitting formulas used in this work are as follows.
| |
 | (3) |
| |
 | (4) |
| |
 | (5) |
xa,i – true value;
xp,i – predicted value;
xa,ave – the average of the true values.
2.3 Product characterization
Scanning electron microscopy (SEM) was used to characterize the surface morphology of the catalyst. The particle size of the catalyst was measured using a nanoparticle potentiometer. The pore structure and specific surface area of the catalyst were determined by a specific surface area and pore size analyzer, and the gas used was N2, The functional groups in the catalyst and BHET product were detected by infrared spectroscopy (IR), and the test conditions were as follows, potassium bromide plate method, wave number test range 400–4000 cm−1, The structure of the product was determined by 1H-NMR, using chloroform as a solvent; The melting point and enthalpy value of the product were determined using DSC.
3. Results and discussion
3.1 Characterization of Ti–BA
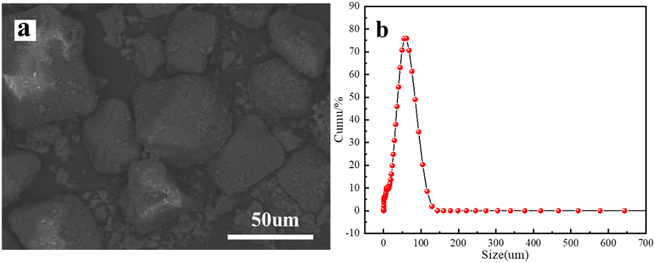
3.1.1 Topography analysis of Ti–BA. The morphology and particle size of the Ti–BA catalyst are shown in Fig. 3.
 |
| | Fig. 3 SEM of Ti–BA (a) and particle size (b). | |
From Fig. 3a, it can be seen that Ti–BA is a regular octahedral crystal with uniform size. To obtain the overall particle size distribution of the particles, the particle size distribution of Ti–BA was measured using a laser particle size distributor and is shown in Fig. 3b; it showed uniform particle size distribution between 20 and 100 μm, and the particle size of 50 μm has the widest distribution, accounting for about 75%. It can be concluded from the SEM combined with the particle size distribution that Ti–BA material is overall an ordered material, uniform in size.
3.1.2 IR analysis. The IR spectrum of the Ti–BA catalyst is shown in Fig. 4.
 |
| | Fig. 4 IR spectrum of Ti–BA. | |
The vibration peaks at 3056.1 cm−1 and 1398.0 cm−1 in the figure are the stretching vibrations of unsaturated C–H in the benzene ring, and the vibration peaks at 1597.1 cm−1 and 1530.2 cm−1 are attributed to the breathing vibration of C![[double bond, length as m-dash]](https://www.rsc.org/images/entities/char_e001.gif) C in the benzene ring, 651.9 cm−1 is the vibration of Ti–O bond, and no carboxyl vibration peak was found in the range of 3300–2500 cm−1, which proved that the carboxyl of benzene acid was completely formed by coordination with the central Ti atom, thus proving the successful preparation of Ti–BA from the structure.
C in the benzene ring, 651.9 cm−1 is the vibration of Ti–O bond, and no carboxyl vibration peak was found in the range of 3300–2500 cm−1, which proved that the carboxyl of benzene acid was completely formed by coordination with the central Ti atom, thus proving the successful preparation of Ti–BA from the structure.
3.1.3 BET analysis. To determine the specific surface area of the Ti–BA catalyst, we used the BET method for measurement at 77 K. Fig. 5 shows the N2 adsorption–desorption isotherms of the Ti–BA catalyst, and the specific surface area of the Ti–BA catalyst was determined to be 313.9 m2 g−1, the catalyst has a pore volume of 0.32 cm3 g−1 and a pore size of 4.1 nm, indicating that it is a mesoporous material. The results of the adsorption–desorption curve also indicate that the prepared Ti–BA catalyst has a mesoporous structure. The high specific surface area is beneficial for the dispersion of active components, thereby improving the catalytic activity of the catalyst.
 |
| | Fig. 5 N2 adsorption–desorption isotherms of Ti–BA. | |
3.2 Analysis and characterization of PET degradation products
3.2.1 IR analysis. The IR spectrum of the PET degradation product is shown in Fig. 6.
 |
| | Fig. 6 IR spectrum of BHET. | |
From Fig. 6, it can be seen that the absorption peak at 3274.6 cm−1 corresponds to the stretching vibration of the BHET terminal hydroxy O–H, the strong absorption peak at 1718.5 cm−1 corresponds to the stretching vibration of the ester CO, the vibration peak of the aromatic C–H at 1411.3 cm−1, the C–O vibration peaks at 1264.4 cm−1 and 1116.8 cm−1, and the bending vibration in the aromatic ring at 892.6 cm−1. The 2944.2 cm−1 and 2866 cm−1 are the C–H vibration peaks of the methylene in the EG chain. The infrared spectrum of the product is consistent with the infrared spectrum of BHET, which confirmed that the copolymer product was BHET.
3.2.2 1H-NMR analysis. The 1H-NMR spectral characteristics of the PET degradation product are shown in Fig. 7.
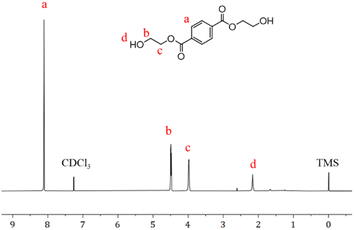 |
| | Fig. 7 1H-NMR of the PET degradation products in CDCl3. | |
1H-NMR analysis of PET alcoholysis product using chloroform as a deuterated reagent, 1H-NMR (400 MHz; CDCl3): δ 8.11 (s, 4H), 4.52–4.46 (m, 4H), 4.01–3.95 (m, 4H), 2.16 (s, 2H).
3.2.3 DSC analysis. The following Fig. 8 shows the DSC temperature rise curve of the PET degradation product, raising the temperature from 25 °C to 200 °C at a rate of 15 °C in an N2 atmosphere.
 |
| | Fig. 8 DSC temperature rise curve of the PET degradation product. | |
The melting point of the BHET monomer is about 110 °C, so DSC testing can be performed on the alcoholysis products separated and purified from the depolymerization products to preliminarily determine the presence of BHET in the products. Fig. 8 shows the DSC curve of a white needle-shaped crystal after separation and purification of the alcoholysis product, with an obvious melting peak near 111 °C, consistent with the theoretical value of BHET. The enthalpy value of BHET was 139.38 J g−1.
3.2.4 Hydrolysis stability test of Ti–BA catalyst. The hydrolysis resistance of the Ti–BA catalyst was tested, Ti–BA was placed in deionized water for hydrolysis, heated to boiling to start timing, and samples with a heating time of 2, 4, 6, 8, and 10 h were taken for FT-IR analysis, as shown in Fig. 9. Compared with the FT-IR at 0–10 h, it can be seen that the Ti–BA catalyst still maintained the original structure that was not changed, indicating that the Ti–BA catalyst had good hydrolysis resistance. This showed that during the process of washing the degradation products with deionized water, the catalyst will not undergo hydrolysis and cause structural changes, which is conducive to the recovery of the catalyst.
 |
| | Fig. 9 Hydrolysis stability test of Ti–BA. | |
3.3 Response surface experiment results
3.3.1 Experimental results. According to the coding values of the levels of each factor in Table 1 and the Box–Behnken model, 17 groups of experiments were designed. Design-Expert 13.0 software was used for analysis, and a response surface model was established. The design and experimental results of the response surface curves are shown in Table 2.
Table 2 Design and results of Box–Behnken
| Run |
A |
B |
C |
Conversion/% |
Selectivity/% |
BHET yield/% |
Residual (%) |
| Actual |
Predicted |
| 1 |
0 |
0 |
0 |
100 |
85.60 |
85.60 |
85.20 |
0.40 |
| 2 |
0 |
0 |
0 |
100 |
85.60 |
85.60 |
85.20 |
0.40 |
| 3 |
0 |
0 |
0 |
100 |
85.60 |
85.60 |
85.20 |
0.40 |
| 4 |
−1 |
−1 |
0 |
100 |
73.00 |
73.00 |
75.45 |
−2.45 |
| 5 |
−1 |
0 |
1 |
100 |
89.40 |
89.40 |
87.05 |
2.35 |
| 6 |
1 |
1 |
0 |
100 |
85.40 |
85.40 |
82.95 |
2.45 |
| 7 |
0 |
0 |
0 |
100 |
85.60 |
85.60 |
85.20 |
0.40 |
| 8 |
−1 |
0 |
−1 |
100 |
75.40 |
75.40 |
72.95 |
2.45 |
| 9 |
−1 |
1 |
0 |
100 |
86.00 |
86.00 |
88.35 |
−2.35 |
| 10 |
0 |
−1 |
−1 |
100 |
69.40 |
69.40 |
69.40 |
0.00 |
| 11 |
0 |
−1 |
1 |
100 |
79.10 |
79.10 |
79.00 |
0.10 |
| 12 |
1 |
0 |
−1 |
100 |
77.20 |
77.20 |
79.55 |
−2.35 |
| 13 |
0 |
0 |
0 |
100 |
83.60 |
83.60 |
85.20 |
−1.60 |
| 14 |
1 |
−1 |
0 |
100 |
74.60 |
74.60 |
72.25 |
2.35 |
| 15 |
0 |
1 |
1 |
100 |
84.40 |
84.40 |
84.40 |
0.00 |
| 16 |
0 |
1 |
−1 |
100 |
87.50 |
87.50 |
87.60 |
−0.10 |
| 17 |
1 |
0 |
1 |
100 |
69.40 |
69.40 |
71.85 |
−2.45 |
3.3.2 Analysis of the ANOVA model. One of the RSM is BBD, which is used to analyze various independent variables and their interactions. In this research, we chose BBD because it is easy and can decrease the number of experiments so it requires fewer levels. Experiments were conducted as many as 17 times, in which these experiments were used to approximate the response surface and obtain the optimum yield of BHET. Regression analysis of the BHET recovery rate and the numerical values of the three factors A, B, and C, shown in Table 2, was carried out by Design-Expert 13.0 software, yielding a regression model variance analysis table (Table 3) and a regression eqn (6). The significance of each variable to the BHET yield (response value) in the regression variance was determined by the F test, and the larger the F value, the greater the influence on the model. According to the F value of the three factors in the model and the BHET yield, the main and secondary order of the three influencing factors on the catalytic activity is B > A > C. The significance level of the corresponding variable was judged by the probability P value. The smaller the P value, the higher the significance level of the corresponding variable. From the figure, it can be seen that the P values of the model, B, and AC are all less than 0.01, indicating that the difference is extremely significant, and thus the selected model is meaningful.
Table 3 Results of the analysis of variance
| Source |
Sum of squares |
Degrees of freedom |
Mean square |
F value |
P value |
Significanta |
| * P < 0. 05, significant difference; ** P < 0. 01, very significant difference. Total = model + residual R2 = 0.9279, adj R2 = 0.8351, predicted R2 = −0.0867, std dev. = 2.65, mean = 80.99, CV% = 3.28, adequate precision = 9.3083. |
| Model |
634.3 |
9 |
70.48 |
10 |
0.0031 |
** |
| A |
36.98 |
1 |
36.98 |
5.25 |
0.0557 |
|
| B |
278.48 |
1 |
278.48 |
39.52 |
0.0004 |
** |
| C |
20.48 |
1 |
20.48 |
2.91 |
0.132 |
|
| AB |
1.21 |
1 |
1.21 |
0.1717 |
0.691 |
|
| AC |
118.81 |
1 |
118.81 |
16.86 |
0.0045 |
** |
| BC |
40.96 |
1 |
40.96 |
5.81 |
0.0467 |
* |
| A2 |
62.41 |
1 |
62.41 |
8.86 |
0.0206 |
* |
| B2 |
10.78 |
1 |
10.78 |
1.53 |
0.256 |
|
| C2 |
51.58 |
1 |
51.58 |
7.32 |
0.0304 |
* |
| Residual |
49.32 |
7 |
7.05 |
|
|
|
| Lack of fit |
46.12 |
3 |
15.37 |
19.22 |
0.0077 |
|
| Pure error |
3.2 |
4 |
0.8 |
|
|
|
| Totalb |
683.62 |
16 |
|
|
|
|
The regression equation is as follows:
| | |
R = 85.20 − 2.15A + 5.90B + 1.60C − 0.5500AB − 5.45AC − 3.20BC − 3.85A2 − 1.60B2 − 3.50C2
| (6) |
The R2 = 0.9279 and adj R2 = 0.8351, indicating that the model has a good fit with the experiment and the experimental misfit is small, so the regression equation can be used to replace the real experiment points to analyze the experimental results.
“Adequate precision” was used to gauge the signal ratio toward the noise, where the desired value was higher than 4. Whereas, the Adeq-Prec value of the model was 9.3083, where this value denotes an adequate signal so that this model can be used for navigating the design chamber. Besides, the relatively low coefficient of variation (3.28) indicates a higher level of precision and gives better reproducibility in conducting experiments. The standard deviation of the model was 2.65, which showed a good correlation between the experimental data and prediction models. Thus, the established model provides accurate and satisfying results for biodiesel production through the transesterification process.
Fig. 10 represents the standardized Pareto chart for the Box–Behnken model. This chart indicates that the B term (depolymerization temperature) is the most significant and has a positive influence on the yield. The other term that is most significant but has a negative influence is AC.
 |
| | Fig. 10 Standardized Pareto chart for the Box–Behnken method. | |
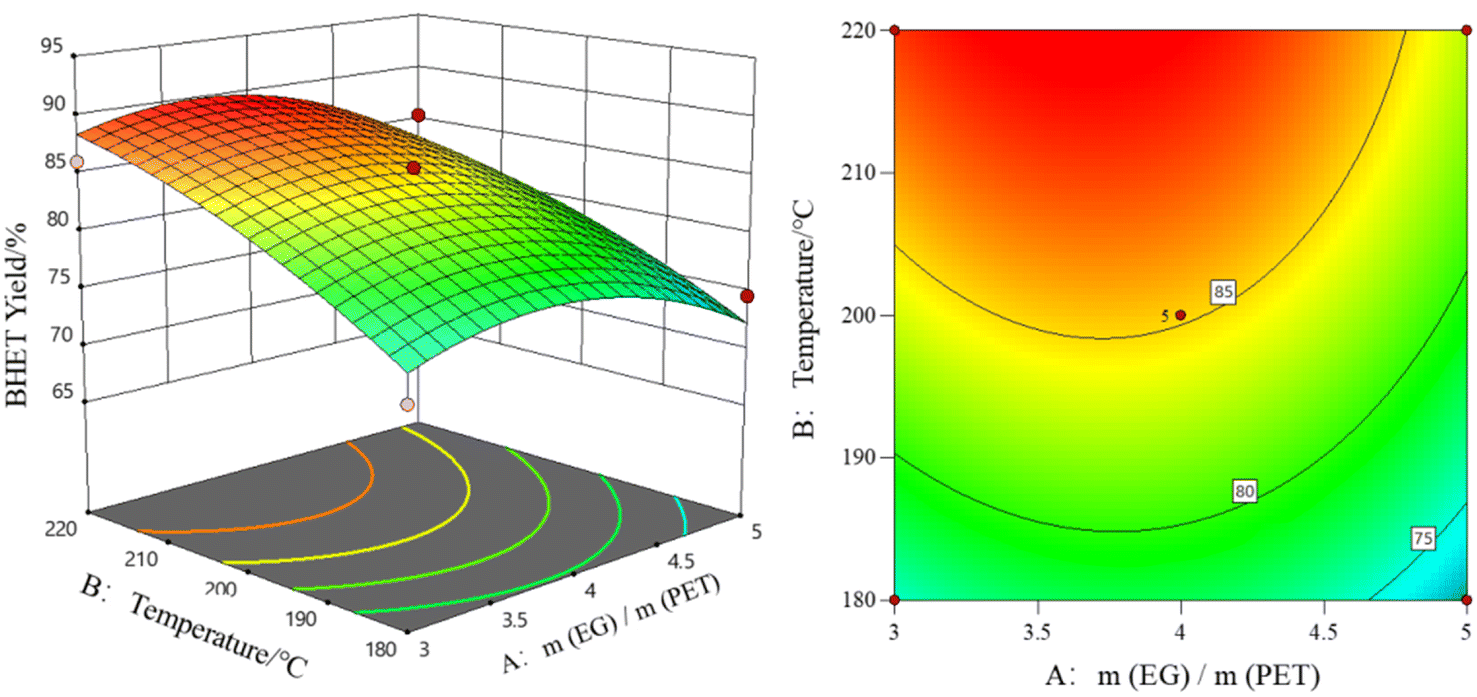
3.3.3 Response surface analysis. The response surface contour plot is the best means to express the effect of several parameters on the experimental results being investigated. In order to more intuitively reflect the influence of the interaction between each factor on the yield, the response surface and contour map were made by taking each two of the variables EG/PET quality ratio, reaction temperature, and reaction time as independent variables.Fig. 11 shows the 3-D and 2-D response surface graphs that were established to show the effect of the interaction between the EG/PET quality ratio and reaction temperature on BHET yield, while the fixed reaction time was 3 h.
 |
| | Fig. 11 Effect of EG/PET mass ratio and reaction temperature on BHET yield. | |
As shown in Fig. 11, when the EG/PET quality ratio was fixed, the BHET yield increased with the increase of the reaction temperature. When the yield of BHET was fixed, the reaction temperature required was lower than that under other quality ratios when the quality ratio was between 3.5 and 4.0. Therefore, a proper increase in the reaction temperature can increase the yield of BHET. This further proved that the influence of the reaction temperature on the BHET yield is greater than that of the EG/PET quality ratio, which is consistent with the conclusion obtained from the variance analysis of the regression equation in Table 3. The highest yield of BHET was obtained when the EG/PET quality ratio was 3.59 and the reaction temperature was 217 °C.
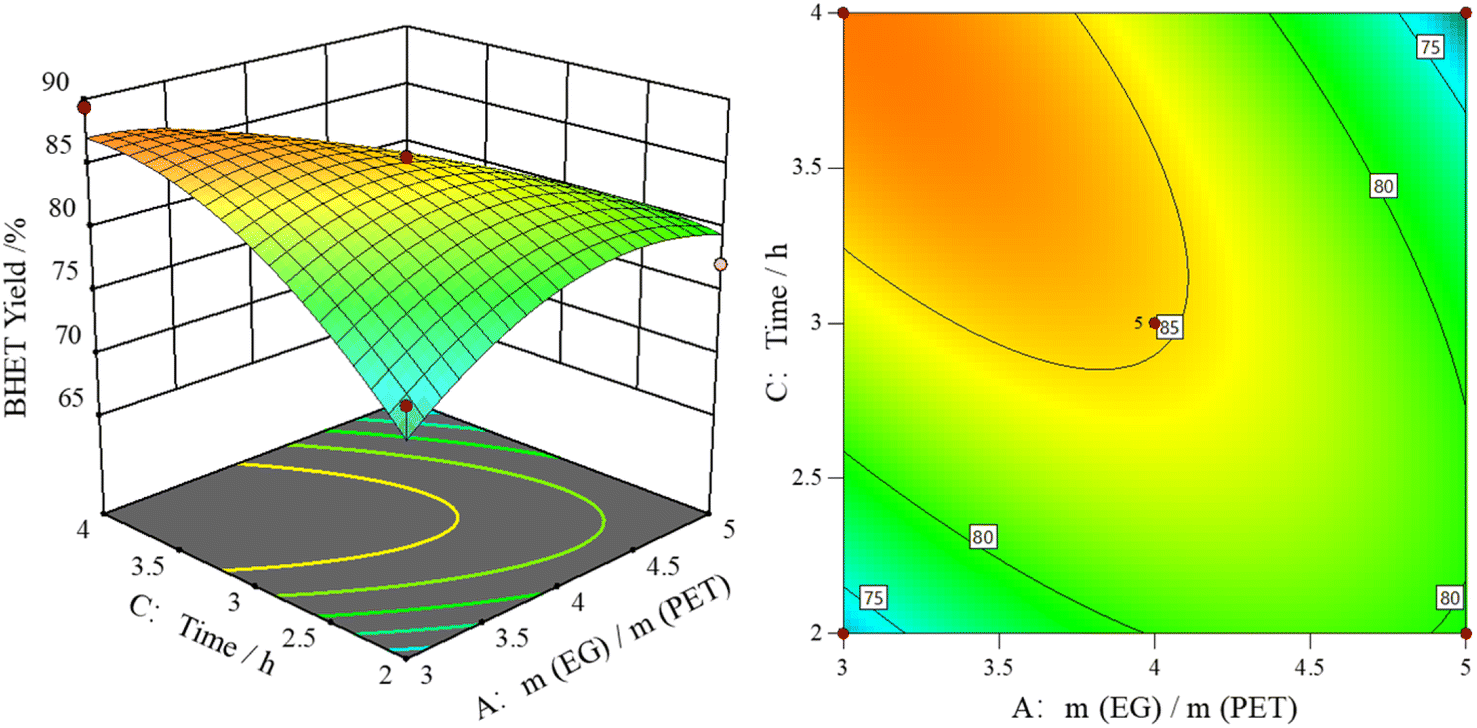
Fig. 12 shows the 3-D and 2-D response surface graphs that were established to show the effect of the interaction between the EG/PET quality ratio and reaction time on the BHET yield, while the reaction temperature was 200 °C.
 |
| | Fig. 12 Effect of EG/PET mass ratio and reaction time on BHET yield. | |
As shown in Fig. 12, when the EG/PET quality ratio was fixed, the yield of BHET increased gradually with the increase of the reaction time, and the highest yield of BHET was at 4 h reaction time. When the reaction time exceeded 2.5 h, the yield of BHET first increased and then gradually decreased when the amount of solvent EG was appropriately increased. The highest yield of BHET was obtained when the EG/PET quality ratio was 3.59 and the reaction time was 3.3 h.
Fig. 13 shows the 3-D and 2-D response surface graphs that were established to show the effect of the interaction between the reaction temperature and the reaction time on BHET yield, while the EG/PET quality ratio was 4.
 |
| | Fig. 13 The effect of the reaction temperature and reaction time on BHET yield. | |
From Fig. 13, it can be seen that when the reaction time was fixed, the yield of BHET increased with the increase in the reaction temperature. When the reaction temperature was fixed, prolonging the reaction time does not significantly increase the BHET yield, which further proved that the influence of reaction temperature on BHET yield is greater than that of the reaction time, which is consistent with the conclusion obtained from the variance analysis of the regression equation in Table 3. The highest yield of BHET was obtained when the reaction temperature was 217 °C and the reaction time was 3.3 h.
Therefore, combining response surface analysis and regression equation prediction, the optimal process conditions for Ti–BA catalyzed EG depolymerization of waste PET were the EG/PET mass ratio of 3.59, reaction temperature of 217 °C and reaction time of 3.3 h, the model predicted BHET yield was 89.51%. The experimental BHET yield of the above model optimal reaction conditions was 90.01%, which is close to the model predicted value, indicating that the model is reliable.
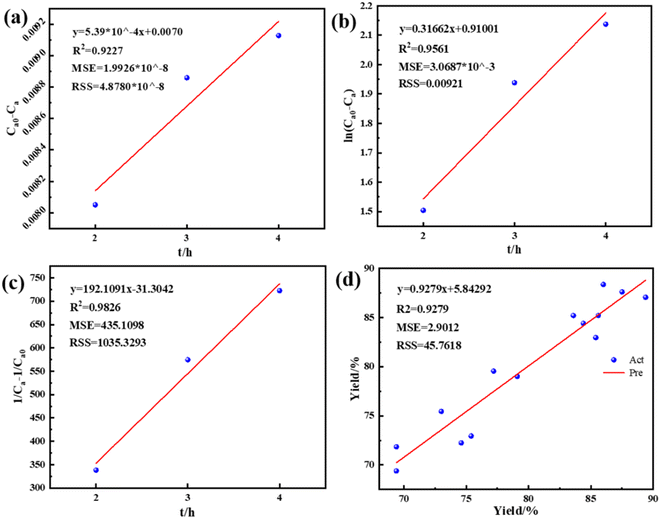
3.3.4 Depolymerization kinetic analysis. To study the kinetic analysis of the depolymerization process, the fitted curves were obtained and R2, MSE, and RSS were calculated based on the 0, 1 and 2-order reaction modeling (Fig. 14a–c). It is not difficult to see that from the R2 value, the 2-order reaction (R2 = 0.9826) can better reflect the depolymerization process, but from the RSS and MSE values, the 0-order reaction (MSE = 1.9926 × 10⁻⁸, RSS = 4.8780 × 10⁻⁸) can better reflect the depolymerization process. Fig. 14d shows the applicability of the Box–Behnken model to predict other response values, and it can be seen that the predicted value has a good fit with the actual value (R2 = 0.9279), so the model has good applicability and can be used to predict the response value under different conditions.
 |
| | Fig. 14 Fitted curve and error analysis, (a) 0-order (b) 1-order (c) 2-order (d) applicability of the BBD model to predicted response values. | |
3.3.5 Adequacy checking of the Box–Behnken model. Generally, model adequacy testing is essential as part of model validation when verifying the accuracy of models and verifying the analysis of experimental data. An effective and accurate mathematical model will provide a sufficient method for the actual process.39,40 The diagnostic diagram of the adequacy of the Box–Behnken model in the production of biodiesel by transesterification is shown in Fig. 15. In Fig. 15a, the testing of the normality hypothesis was studied using a graph of the relationship between the normal% probability and the studied residual. The experimental results showed that the experimental values approach along a straight line, and the response presents a normal distribution without variance. The graph of the actual value and predicted value of BHET yield is shown in Fig. 15b. It can be seen that there are data points near the straight line, indicating that the model is relatively close to the actual predicted value and has high reliability. This proves that the model can improve the good relationship between response variables and can be applied to optimization. At the same time, the excellent fitting of the model is analyzed through the relationship diagram between the experimental operation and research residual (Fig. 15c). Fig. 15c shows that all data points are still within the limit range of 0 ± 6. In Fig. 15d, since the values of all leverage points are still in the range of 0 to 1, there are no unforeseen errors in the obtained model. In addition, the distance value of Cook is still within the specified range (Fig. 15e). The results shown in Fig. 15 are satisfactory, indicating that the empirical model for calculating the yield of BHET using the response surface method is sufficient.41
 |
| | Fig. 15 Diagnostic plots for the Box–Behnken model adequacy. | |
3.4 The reuse performance of the Ti–BA catalyst
For reasons of economic and environmental suitability, we examined the reusability of Ti–BA catalysts under our optimized conditions to further depolymerize PET. After filtration, the catalyst was washed with deionized water and then dried at 80 °C for 6 h. Noting that this process typically loses 10% of the catalyst, we supplement it with a fresh catalyst. After the catalyst was cycled, the conversion rate of PET could still reach 100%, but the decrease in selectivity led to a decrease in yield, which could still reach 80.1% after 3 cycles (Fig. 16).
 |
| | Fig. 16 Reusability of Ti–BA catalyst. Reaction conditions: 5.0 g PET, 2% Ti–BA catalyst, 3.3 h, 217 °C. | |
3.5 Preliminary techno-economic calculation
We reviewed the depolymerization efficiency of some representative catalysts, including ILs, acetates, metal oxides, and biomass catalysts (Table 4). From the perspective of the efficiency of the catalytic reaction, ZnMn2O4, e-MON, and Ti–BA as catalysts for ethylene glycol decomposition of PET could obtain better BHET yield, of which e-MON catalyzed BHET was the highest, but the amount of EG required 18.5 times the mass of PET, and the dosage of ionic liquid catalytic depolymerization process was higher, up to 33.3%, but the BHET yield was still very low (45.6%), and the BHET yield of this work was 90.01%. Zn(AC)2, ZnMn2O4 catalyst depolymerization BHET products with color, oyster shell-derived catalyst, and orange peel ash (OPA) use biomass catalyst, undoubtedly the most beneficial to the environment, but BHET yield was still not high, the color of BHET in this work was white. The depolymerization speed of ZnMn2O4 and γ-Fe2O3 is fast, but the depolymerization temperature is high, the amount of IL catalyst is extremely high and the amount of EG is large, which undoubtedly increases the economic cost in the process of polymerization. In summary, it can be seen that Ti–BA is a kind of depolymerization catalyst with high catalytic activity, and high-efficiency depolymerization can be achieved with less Ti–BA and EG.
Table 4 Effect of catalyst on depolymerization of PET
| Catalyst |
Dosage of catalyst (w/w = cat/PET); temperature; time; dosage of EG (w/w = EG/PET) |
Yield of BHET (%) |
Reference |
| [deim][Zn(OAc)3] |
16.7; 180 °C; 150 min; 7.33 |
69.55 |
42 |
| ZnMn2O4 |
1%; 260 °C; 60 min; 17.2 |
92.2 |
43 |
| Oyster shell-derived catalyst |
1%; 195 °C; 45 min; 5 |
64.98 |
27 |
| Zn(OAc)2-[Bmim][OAc] |
33.3%; 190 °C; 180 min; 6.67 |
45.6 |
44 |
| e-MON |
0.01%; 200 °C; 30 min; 18.5 |
100 |
45 |
| Zn(ac)2 |
0.2%; 190 °C; 150 min; 6 |
86.82 |
46 |
| γ-Fe2O3 |
5%; 300 °C; 60 min; 3.3 |
>90 |
47 |
| Co/RZnO |
1%; 196 °C; 120 min; 8 |
80 |
24 |
| (dimim)2[Fe2Cl4(μ-ox)] |
20%; 170 °C; 180 min; 6 |
89 |
48 |
| Orange peel ash (OPA) |
10.4%; 190 °C; 90 min; 5.2 |
79 |
49 |
| Ti–BA |
2%; 217 °C; 198 min; 3.59 |
90.01 |
This work |
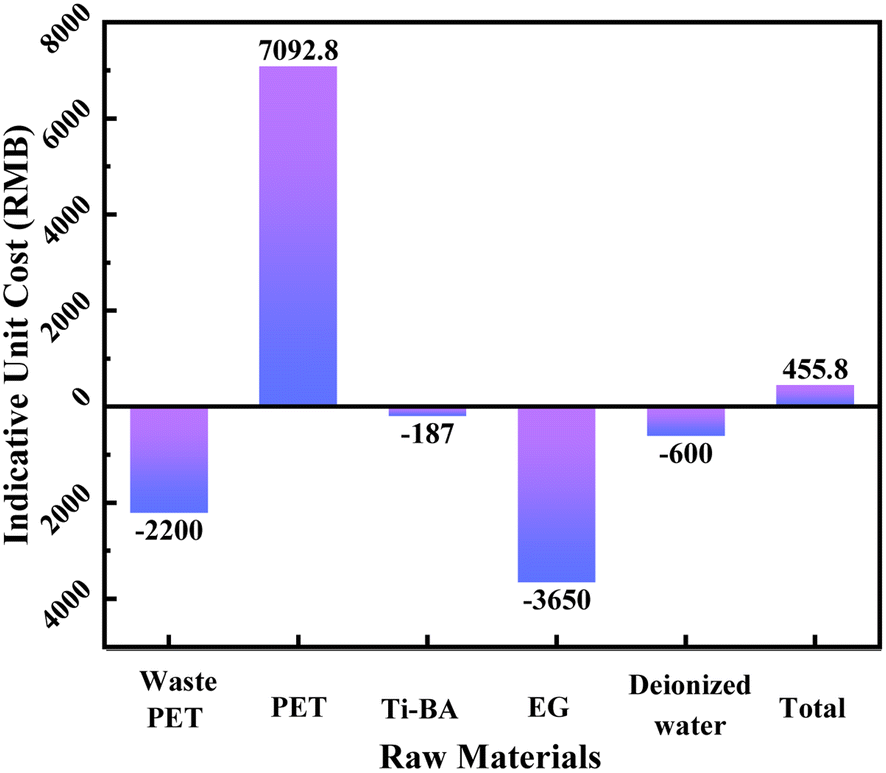
We performed a preliminary techno-economic calculation of the raw materials in the depolymerization process (taking 1 ton of waste PET as an example), as shown in Fig. 17, compared with the ethylene glycol depolymerized PET of other catalysts because the raw materials for its depolymerization are the same, only there are differences in the catalyst, and the amount of EG in this scheme is less than the amount of EG reported in other studies; in addition, the material of the synthesis catalyst is cheap, the synthesis method is simple, and the catalyst cost is lower than that reported for ILs and nanometal oxides. Therefore, in this scenario, it is technically economically feasible and a net profit of 455.8 RMB per ton of waste PET can be estimated by calculation.
 |
| | Fig. 17 Preliminary techno-economic calculation during Ti–BA depolymerization. | |
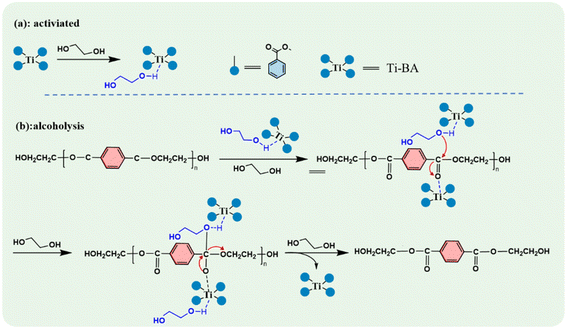
3.6 Analysis of Ti–BA alcoholysis mechanism
Based on the experimental results of this study, the experimental mechanism of Ti–BA-catalyzed EG depolymerization of waste PET is as follows. The depolymerization process was carried out in two steps, as shown in Fig. 18. First is the activation process of the catalyst, the titanium atom in Ti–BA forms a coordination structure with the hydroxyl group of ethylene glycol, which is a reversible reaction. Secondly, in the EG depolymerization of PET, after the catalyst is activated, the Ti–BA with an empty orbital structure can attack the ester group in the PET molecular chain to undergo nucleophilic substitution, and the titanium atom and oxygen atom cooperate to break the carbonyl double bond into a single bond, thus realizing the break of the PET main chain into low-molecular-weight PET, and the PET oligomer can repeat the above-mentioned breakage process to obtain the BHET monomer.
 |
| | Fig. 18 Ti–BA-catalyzed PET alcoholysis reaction mechanism. | |
4. Conclusions
Ti–BA catalyst was prepared from BA and titanium ester by a hydrothermal method, with the optimal conditions as follows, reaction temperature of 130 °C and reaction time of 24 h. The prepared Ti–BA material had a regular morphology structure, uniform size, and particle size distribution between 20–100 μm, the specific surface area was determined to be 313.9 m2 g−1, pore volume was 0.32 cm3 g−1 and pore size was 4.1 nm.
Ti–BA catalyst was used to catalyze the EG depolymerization of PET. The response surface method was used to optimize the depolymerization conditions of PET. For the Ti–BA catalyst, it was observed that the m(EG)/m(PET) (A), depolymerization temperature (B), and depolymerization time (C) coded parameters positively affected the depolymerization process according to the approximation functions obtained from RSM. It was determined that the most effective independent variable among the approximation function coefficients was depolymerization temperature. The optimal process conditions were obtained: EG/PET mass ratio of 3.59, reaction temperature of 217 °C and reaction time of 3.3 h, under which the catalyst dosage was 2%, the PET mass and the BHET yield were 90.01%, which was close to 89.51%, predicted by the model.
The prepared Ti–BA catalyst had a good catalytic effect in the EG depolymerization of PET. The highest yield of BHET could reach 90.01%, and the yield of the catalyst could still reach 80.1% after three cycles. The high-efficiency EG depolymerization of PET was attributed to the synergistic effect of titanium ions and deprotonated ethylene glycol, which could greatly increase the catalytic activity of Ti–BA. This study can provide certain references for the degradation of PET waste and other ester exchange reactions.
Author contributions
Guoliang Shen conceived, planned, and supervised the experiments. Ruiyang Wen and Guoliang Shen were the chief hosts and provided the research resources. Ruiyang Wen and Yang Yu performed the synthesis of the catalyst while Jie Wei and Sijin Jiang studied the catalytic performance. Shijie Xu performed SEM and IR experiments and analyses, respectively. Ruiyang Wen and Yue Huo wrote the first draft, while all authors reviewed the manuscript.
Conflicts of interest
The authors declare that they have no conflicts of interest.
Acknowledgements
Thanks to all the authors for their efforts in completing this manuscript.
References
- J. Chu, Y. Cai, C. Li, X. Wang, Q. Liu and M. He, Waste Manage., 2021, 124, 273–282 CrossRef CAS PubMed
 .
. - R. Gao, H. Pan, L. Kai, K. Han and J. Lian, World J. Microbiol. Biotechnol., 2022, 38, 1–14 CrossRef PubMed .
- X. Zhou, J. Deng, R. Yang, D. Zhou, C. Fang, X. He, D. Wang, W. Lei, J. Hu and Y. Li, Waste Manage., 2020, 107, 172–181 CrossRef CAS PubMed .
- J. Diao, Y. Hu, Y. Tian, R. Carr and T. S. Moon, Cell Rep., 2023, 42, 111908 CrossRef CAS PubMed .
- Y.-H. V. Soong, M. J. Sobkowicz and D. Xie, Bioengineering, 2022, 9, 98 CrossRef CAS PubMed .
- X. Zhang, M. Wang, C. Zhang, J. Lu, Y. Wang and F. Wang, RSC Adv., 2016, 6, 70842–70847 RSC .
- S. H. Lee, T. H. Han and S. H. Kim, Macromol. Res., 2014, 22, 782–787 CrossRef CAS .
- Y. Ohkado, Y. Kawamura, M. Mutsuga, H. O. Tamura and K. Tanamoto, Journal of the Food Hygienic Society of Japan, 2005, 46, 13–20 CrossRef CAS PubMed .
- E. Pinter, F. Welle, E. Mayrhofer, A. Pechhacker, L. Motloch, V. Lahme, A. Grant and M. Tacker, Sustainability, 2021, 13, 7370–7384 CrossRef CAS .
- L. Qiu, X. Yin, T. Liu, H. Zhang, G. Chen and S. Wu, J. Basic Microbiol., 2020, 60, 699–711 CrossRef CAS PubMed .
- A. Maurya, A. Bhattacharya and S. K. Khare, Front. Bioeng. Biotechnol., 2020, 8, 1–13 CrossRef PubMed .
- L. B. Li, R. Huang, L. Zhang and S. M. Hong, Polymer, 2001, 42, 2085–2089 CrossRef .
- F. Wang, X. Meng, X. Xu, B. Wen, Z. Qian, X. Gao, Y. Ding, S. Zhang and M. Yang, Polym. Degrad. Stab., 2008, 93, 1397–1404 CrossRef CAS .
- J. Lee, T. Lee, Y. F. Tsang, J.-I. Oh and E. E. Kwon, Energy Convers. Manage., 2017, 148, 456–460 CrossRef CAS .
- K. Song, Y. Li, F. Huo, J. Liu, W. Hou, N. Wang, Q. Zhou, J. Xu and X. Lu, Can. J. Chem. Eng., 2023, 1, 1–14 Search PubMed .
- X. Qi, W. Yan, Z. Cao, M. Ding and Y. Yuan, Microorganisms, 2022, 10, 39–63 CrossRef CAS PubMed .
- I. Taniguchi, S. Yoshida, K. Hiraga, K. Miyamoto, Y. Kimura and K. Oda, ACS Catal., 2019, 9, 4089–4105 CrossRef CAS .
- A. Zafar, M. N. Aftab, Z. U. Din, S. Aftab, I. Iqbal, A. Shahid, A. Tahir and I. ul Haq, Appl. Biochem. Biotechnol., 2016, 178, 294–311 CrossRef CAS PubMed .
- B. Bartels, P. Cueni, D. Muri and M. Koerner, Bioorg. Med. Chem., 2018, 26, 970–976 CrossRef CAS PubMed .
- Y. Kratish and T. J. Marks, Angew. Chem., Int. Ed., 2022, 61, 12576–12581 Search PubMed .
- Q.-q. Bao, H.-y. Sun, Z. Chen, J. Guan, M.-f. Zhu, L. Chen and W.-w. Zuo, Acta Polym. Sin., 2023, 54, 346–355 Search PubMed .
- M. Barth, T. Oeser, R. Wei, J. Then, J. Schmidt and W. Zimmermann, Biochem. Eng. J., 2015, 93, 222–228 CrossRef CAS .
- S. Chen, W. Shi, H. Cheng, H. Zhang, Z. Zhang and C. Fu, J. Therm. Anal. Calorim., 2021, 143, 3489–3497 CrossRef CAS .
- C. A. Fuentes, M. V. Gallegos, J. R. Garcia, J. Sambeth and M. A. Peluso, Waste Biomass Valorization, 2020, 11, 4991–5001 CrossRef CAS .
- C. V. Guimaraes Silva, E. A. da Silva Filho, F. Uliana, L. F. Rangel de Jesus, C. V. Paixao de Melo, R. C. Barthus, J. G. Aquino Rodrigues and G. Vanini, Polim.: Cienc. Tecnol., 2018, 28, 450–459 CrossRef .
- S. M. A. H. Siddiki, A. S. Touchy, M. Tamura and K.-i. Shimizu, RSC Adv., 2014, 4, 35803–35807 RSC .
- Y. Kim, M. Kim, J. Hwang, E. Im and G. D. Moon, Polymers, 2022, 14, 656–670 CrossRef CAS PubMed .
- A. K. Domingos, E. B. Saad, H. M. Wilhelm and L. P. Ramos, Bioresour. Technol., 2008, 99, 1837–1845 CrossRef CAS PubMed .
- A. Ansori, S. A. Wibowo, H. S. Kusuma, D. S. Bhuana and M. Mahfud, Open Chemistry, 2019, 17, 1185–1197 CAS .
- M. Iqbal, M. Z. Ahmad, K. Qureshi, I. A. Bhatti, N. Alwadai and H. S. Kusuma, Mater. Chem. Phys., 2021, 272, 124968–124981 CrossRef CAS .
- H. S. Kusuma and M. Mahfud, Indonesia, 2015, 1699, 050014 Search PubMed .
- R. Yang, W. Li and Y. Liu, AIP Adv., 2022, 12, 015205 CrossRef .
- X.-F. Huang, L.-Q. Mo, G. Huang and G.-P. Yuan, IEEE Access, 2019, 7, 111429–111438 Search PubMed .
- A. Moslemi and M. Seyyed-Esfahani, Int. J. Nonlinear Sci. Numer. Simul., 2022, 23, 163–175 CrossRef .
- H. Basser, T. M. Shaghaghi, H. Afshin, R. S. Ahari and S. S. Mirrezaei, Constr. Build. Mater., 2022, 315, 125370–125387 CrossRef CAS .
- H. S. Kusuma, A. N. Amenaghawon, H. Darmokoesoemo, Y. A. B. Neolaka, B. A. Widyaningrum, C. L. Anyalewechi and P. I. Orukpe, Environ. Technol. Innovation, 2021, 24, 102005 CrossRef CAS .
- H. S. Kusuma, A. N. Amenaghawon, H. Darmokoesoemo, Y. A. B. Neolaka, B. A. Widyaningrum, S. U. Onowise and C. L. Anyalewechi, Ind. Crops Prod., 2022, 186, 115194 CrossRef CAS .
- H. S. Kusuma, Ansori, S. Wibowo, D. S. Bhuana and Mahfud, Korean Chem. Eng. Res., 2018, 56, 435–440 CAS .
- H. S. Kusuma, R. G. M. Sudrajat, D. F. Susanto, S. Gala and M. Mahfud, Semarang, Indonesia, 2015.
- H. S. Kusuma, A. Altway and M. Mahfud, J. Chem. Technol. Metall., 2019, 54, 787–792 CAS .
- M. Shahedi, Z. Habibi, M. Yousefi, J. Brask and M. Mohammadi, Int. J. Biol. Macromol., 2021, 170, 490–502 CrossRef CAS PubMed .
- X. Zhou, X. Lu, Q. Wang, M. Zhu and Z. Li, Pure Appl. Chem., 2012, 84, 789–801 CAS .
- M. Imran, D. H. Kim, W. A. Al-Masry, A. Mahmood, A. Hassan, S. Haider and S. M. Ramay, Polym. Degrad. Stab., 2013, 98, 904–915 CrossRef CAS .
- A. M. Al-Sabagh, F. Z. Yehia, A. M. F. Eissa, M. E. Moustafa, G. Eshaq, A. M. Rabie and A. E. ElMetwally, Polym. Degrad. Stab., 2014, 110, 364–377 CrossRef CAS .
- S. G. Son, S. B. Jin, S. J. Kim, H. J. Park, J. Shin, T. Ryu, J.-M. Jeong and B. G. Choi, Flatchem, 2022, 36, 100430 CrossRef CAS .
- A. Aguado, L. Becerra and L. Martinez, Chem. Pap., 2023, 77, 3293–3303 CrossRef CAS .
- L. Bartolome, M. Imran, K. G. Lee, A. Sangalang, J. K. Ahn and D. H. Kim, Green Chem., 2014, 16, 279–286 RSC .
- S. Cot, M. K. Leu, A. Kalamiotis, G. Dimitrakis, V. Sans, I. de Pedro and I. Cano, Chempluschem, 2019, 84, 786–793 CrossRef CAS PubMed .
- S. Lalhmangaihzuala, Z. Laldinpuii, C. Lalmuanpuia and K. Vanlaldinpuia, Polymers, 2021, 13, 37 CrossRef CAS PubMed .
|
| This journal is © The Royal Society of Chemistry 2023 |
Click here to see how this site uses Cookies. View our privacy policy here. 
 Open Access Article
 This Open Access Article is licensed under a Creative Commons Attribution-Non Commercial 3.0 Unported Licence
 *,
Yang Yu,
Shijie Xu,
Jie Wei,
Yue Huo and
Sijin Jiang
*,
Yang Yu,
Shijie Xu,
Jie Wei,
Yue Huo and
Sijin Jiang