 Open Access Article
Crystal growth and negative thermal expansion properties of a Y2Mo4O15 single crystal†
Wanling Rong,
Fuan Liu*,
Xiangmei Wang,
Youxuan Sun,
Zeliang Gao* and
Xutang Tao
State Key Laboratory of Crystal Materials, Institute of Crystal Materials, Shandong University, Jinan, 250100, China. E-mail: gaozeliang@sdu.edu.cn; 202190000075@sdu.edu.cn
First published on 26th April 2023
Abstract
A bulk-size single crystal of Y2Mo4O15 with 20 × 11 × 8 mm3 was successfully grown by the top-seed solution growth (TSSG) method. The full-width at half maximum of (100) and (010) crystal faces is 37 and 27 arcsec, respectively. The thermal conductivity coefficients κ11, κ22, κ33, and κ13 are determined to be 1.519, 2.097, 0.445, and 0.997 W m−1 K−1, respectively. It is worth noting that the Y2Mo4O15 crystal shows significant anisotropy thermal expansion properties, which exhibits a negative thermal expansion along the b-axis (α22 = −5.11 × 10⁻⁶ K−1). The crystal structure analysis shows that the shrinking of Mo–O bond lengths along the b-axis with the increasing temperature would be the main origin of the negative thermal expansion properties for Y2Mo4O15 crystal, which does not comply with the current mechanism.
Introduction
Thermal expansion is one of the obstacles to improving the performance of high-precision instruments. The discovery of negative thermal expansion (NTE) provides the possibility to control thermal expansion, and negative thermal expansion materials also have broad application prospects in the fields of ceramics, optics, and electronic devices. Materials with excellent NTE characteristics are important and indispensable, but such materials are relatively rare. Since the emergence of research on ZrW2O8 exhibiting NTE characteristics in a wide temperature range (0.3–1050 K),1 it has opened the door for exploring a variety of NTE materials. More NTE materials such as oxides, fluorides, nitrides, cyanides, alloys, and metal–organic frameworks have been found in various compounds.At present, the known mechanisms of NTE materials can be roughly divided into two categories. The first category is directly caused by lattice vibrations (phonons). The bridge fluorine atoms in ScF3 crystals with double coordination generate lateral thermal vibrations.2,3 Therefore, the shortening of the metal spacing connecting the two ends leads to NTE. In addition, there are also ZrW2O8, ZrV2O7, and other materials caused by the coupled rotation of rigid polyhedra,4 the M–O bond has a large bond energy, which makes the bond length and bond angle in the polyhedron exhibit the characteristics of rigidity and being hard to deform. While the bond energy between the connecting rigid polyhedra is relatively weak, the M–O–M bonds of the rigid polyhedra that drive the connection are prone to rotational coupling, resulting in shortened distance between metal atoms M and overall shrinkage. There are also NTE caused by volume shrinkage caused by the deformation of frame structure materials such as chemical formula A2M3O12 with temperature changes.5–9 The second category of expansion mechanism is determined by the lattice vibration and the physical effects, such as the ferroelectricity of PbTiO3-based compounds,10–13 the ferromagnetism of Invar alloys,14–16 the interface and nanoscale effects,17,18 and the phase structure transitions.19–21
ZrW2O8 and ZrV2O7 are the most well-known NTE crystals, which exhibit isotropic NTE characteristics in a wide temperature range. With similar structures to ZrW2O8 and ZrV2O7, compounds of yttrium and lanthanum molybdate with a stoichiometry as AM2O7.5 have been studied as NTE materials in recent years. The chemical formula of these compounds is expressed as Y(Dy, Ho, Tm)2Mo4O15, which is twice the above-mentioned AM2O7.5. Abnormal thermal expansion behaviors along the crystallographic b-axis have been reported for these materials.22–24 However, the current research on this material mostly stays in ceramic solid solution. It is well known that the yttrium and lanthanum ions can be easily accessible for various rare-earth ion substitutions, and these molybdates would be potential laser and Raman materials. The thermal property is one of the most characteristic of optical applications. Due to the lack of bulk single crystals, the thermal properties such as total thermal expansion coefficients, thermal diffusivity, and thermal conductivity have not been studied in detail.
In this work, the Y2Mo4O15 bulk single crystal with dimensions of 20 × 11 × 8 mm3 was successfully grown by the top-seeded solution growth (TSSG) method. All the thermal properties have been studied in detail in the temperature from 25 to 400 °C. The crystal exhibits significant anisotropy of thermal expansions with NTE along the b-axis in the temperature range from 25 to 400 °C. The crystal structure analysis at different temperatures indicates a part of Mo1–O bond contraction along the b-axis is the origin of NTE, which is different from the current NTE mechanisms.
Experimental section
Synthesis of Y2Mo4O15 polycrystals
Polycrystalline Y2Mo4O15 powder was prepared by the traditional solid-phase synthesis technique. High purity Y2O3 and MoO3 powder were fully mixed and ground according to the molar ratio of 1![[thin space (1/6-em)]](https://www.rsc.org/images/entities/char_2009.gif) :
:![[thin space (1/6-em)]](https://www.rsc.org/images/entities/char_2009.gif) 8. Then the raw powders were pressed into 30 mm diameter and placed in a programmable Muff furnace which was preheated at 580 °C for 24 h. The control system was then set to heat up to 700 °C at a rate of 2 °C min−1 and kept for 72 h, with intermittent grinding every 24 h. The powder gradually turned to white color after sintering.
8. Then the raw powders were pressed into 30 mm diameter and placed in a programmable Muff furnace which was preheated at 580 °C for 24 h. The control system was then set to heat up to 700 °C at a rate of 2 °C min−1 and kept for 72 h, with intermittent grinding every 24 h. The powder gradually turned to white color after sintering.
X-ray powder diffraction
The X-ray powder diffraction (XRD) data were obtained using Bruker-AXS D8 ADVANCE X-ray diffractometer (Cu-Kα = 1.54056 Å) at room temperature. The measurements were carried out in the scanning angle range of 2θ from 10° to 90° with a scanning parameter of 0.02°/0.5 s.Optimized crystal growth
In 2020, the Y2Mo4O15 bulk single crystal was grown for the first time in our group.25 However, low transparency and obvious internal cracks of crystals seriously hindered our complete characterization of the properties of the crystal. To obtain high-quality and large-dimension crystals, the flux system, viscosity, and cooling rate were optimized in this work. To decrease the flux viscosity, the ratio of the mixture of LiCO3, MoO3, and Y2O3 with the molar ratio was changed from 1![[thin space (1/6-em)]](https://www.rsc.org/images/entities/char_2009.gif) :
:![[thin space (1/6-em)]](https://www.rsc.org/images/entities/char_2009.gif) 8
8![[thin space (1/6-em)]](https://www.rsc.org/images/entities/char_2009.gif) :
:![[thin space (1/6-em)]](https://www.rsc.org/images/entities/char_2009.gif) 2 to 1.5
2 to 1.5![[thin space (1/6-em)]](https://www.rsc.org/images/entities/char_2009.gif) :
:![[thin space (1/6-em)]](https://www.rsc.org/images/entities/char_2009.gif) 10
10![[thin space (1/6-em)]](https://www.rsc.org/images/entities/char_2009.gif) :
:![[thin space (1/6-em)]](https://www.rsc.org/images/entities/char_2009.gif) 2. Then the mixture was heated in a platinum crucible which was placed in a temperature controlled furnace. The temperature control program was set to heat to 960 °C at a rate of 5 °C h−1, and a platinum rod was used to stir the melt continuously for a day to achieve homogenization. The platinum wire was introduced and extended 2 mm below the surface of the melt at 805 °C, and the temperature was slowly lowered to induce spontaneous nucleation. After several times of grain-induced growth, the crystal seed along the [010] direction can be obtained. Subsequently, the crystallization temperature of 789 °C was accurately determined with an error of less than 0.5 °C. A crystal seed was gradually brought into the solution at 2 °C above the saturation temperature and maintained for an hour to melt the surface slightly. After the temperature rapidly reduced to the saturation temperature, the crystal growth was started at a cooling rate of 0.1–0.15 °C day−1. After 52 days, the single crystal was slowly lifted off and suspended above the liquid level. The programmable furnace was cooled to room temperature at a rate of no more than 8 °C h−1 to avoid crystal cracking.
2. Then the mixture was heated in a platinum crucible which was placed in a temperature controlled furnace. The temperature control program was set to heat to 960 °C at a rate of 5 °C h−1, and a platinum rod was used to stir the melt continuously for a day to achieve homogenization. The platinum wire was introduced and extended 2 mm below the surface of the melt at 805 °C, and the temperature was slowly lowered to induce spontaneous nucleation. After several times of grain-induced growth, the crystal seed along the [010] direction can be obtained. Subsequently, the crystallization temperature of 789 °C was accurately determined with an error of less than 0.5 °C. A crystal seed was gradually brought into the solution at 2 °C above the saturation temperature and maintained for an hour to melt the surface slightly. After the temperature rapidly reduced to the saturation temperature, the crystal growth was started at a cooling rate of 0.1–0.15 °C day−1. After 52 days, the single crystal was slowly lifted off and suspended above the liquid level. The programmable furnace was cooled to room temperature at a rate of no more than 8 °C h−1 to avoid crystal cracking.
Crystal quality characterization
To evaluate the crystallinity of the Y2Mo4O15 crystal, high-resolution X-ray diffraction (HRXRD) was performed on the Bruker-AXSD5005HR diffractometer equipped with two-crystal Ge (220) monochromator set for Cu-Kα radiation (λ = 1.54056 Å). The (100) and (010) crystal wafers with the dimension of 4 × 4 × 1 mm3 were used to measure Laue's back reflection patterns on a real-time Back reflection Laue camera system (Multiwire MWL 120 with Northstar software).Thermal properties
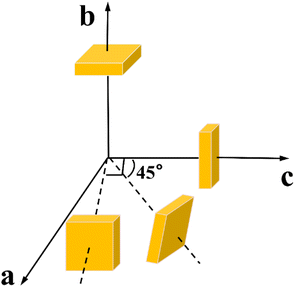
It is well known that the thermal properties of crystals are essential for crystal growth and application.26 The specific heat data of Y2Mo4O15 crystal was obtained by differential scanning calorimetry using a simultaneous thermal analyzer (TGA/DSC1/1600HT, MetttlerToledo Inc.), with the temperature range from 25 to 300 °C at a heating rate of 10 °C min−1. The Y2Mo4O15 belongs to a monoclinic system, and there are four independent thermal diffusivity, thermal expansion, and thermal conductivity coefficients. The samples used in the thermal diffusivity and thermal expansion determination were shown in Fig. 1, and they were finely polished and sprayed with 100 nm thick gold on both sides for thermal diffusivity measurement. The thermal diffusivity was determined by the laser flash method using a laser flash device (NETZSCH LFA 457 Nanoflash),. The thermal dilatometer (Diamond TMA) was used to measure the thermal expansion coefficients.Results and discussion
Synthesis and crystal growth of Y2Mo4O15
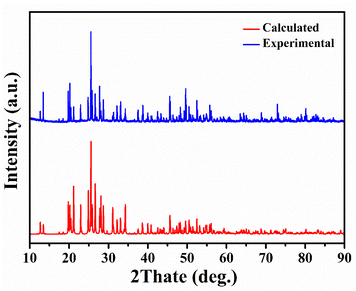
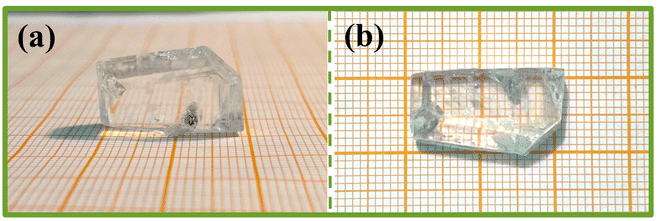
The purity of Y2Mo4O15 polycrystalline powder was tested by X-ray diffraction analysis. As shown in Fig. 2, the XRD pattern of polycrystalline Y2Mo4O15 powder obtained in the experiment accords well with the theoretical calculation results.The single crystals obtained by spontaneous crystallization and non-oriented seed crystal growth are shown in Fig. 3a and b. The crystal grown with a non-oriented seed is much larger than that of spontaneous crystallization. But there are many inclusions and polycrystals in crystal, and the crystal exhibits poor transparency. It is evident from many experiments that the high viscosity of the solution resulted in many inclusions during crystal growth, but the low viscosity will also limit the crystal growth rate and growth size. Therefore, the ratio of the mixture of Li2CO3, MoO3, and Y2O3 with It is considered that the crystal cracking is caused by the intense thermal expansion anisotropy. Therefore, it is difficult to avoid cracking or internal quality damage of Y2Mo4O15 crystal in the process of rapid heating or cooling. In our experiments, the crystal quality can be significantly improved by reducing the cooling rate. With the optimized flux, seed crystal rotating speed, and cooling rate, the high-quality bulk Y2Mo4O15 single crystal with the size of 20 × 11 × 8 mm3 was successfully grown by the TSSG method along the [010] orientation as shown in Fig. 4.
Crystal quality characterization
The rocking curves plotted for the (100) and (010) diffraction planes of the Y2Mo4O15 crystal are shown in Fig. 5a and b. They are sharp and symmetrical with full-width at half-maximum (FWHM) reaching 37 and 27 arcsec, respectively. In Fig. 5c and d, the symmetric and clear Laue diffraction patterns can be observed at four locations in each slice. Both the HRXRD and Laue diffraction results indicate the quality of the Y2Mo4O15 crystal after optimized conditions is sufficient to evaluate its intrinsic physical properties on this basis.27,28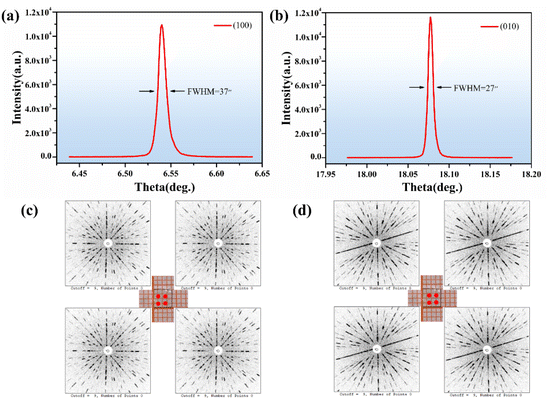 | ||
| Fig. 5 (a and b) The rocking curve of the Y2Mo4O15 crystal; (c and d) Laue back-reflection patterns of (100) and (010) wafers of Y2Mo4O15 crystal. | ||
The specific heat
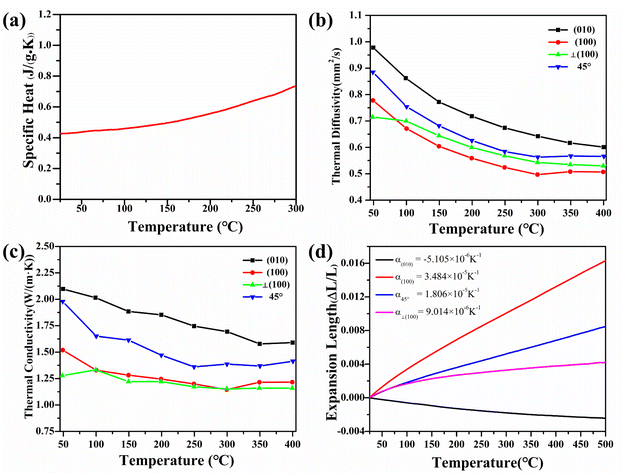
The large specific heat energy of the material is conducive to the application of crystal at high temperatures. The linear change curve of the specific heat of Y2Mo4O15 crystal as the temperature increases from 25 to 300 °C is shown in Fig. 6a (uncertainty less than 0.2%). The results indicate that the specific heat of Y2Mo4O15 crystal is 0.43 J (g−1 K−1) at room temperature and linearly increases to 0.73 J (g−1 K−1) at 300 °C.The thermal expansion
The thermal expansion curves along four directions from 25 to 500 °C are shown in Fig. 6d (uncertainty less than 0.1%). All the thermal expansions of the Y2Mo4O15 crystal exhibit nearly linear changing. In the [010] direction, the expansion exhibits NTE properties. Then the average linear thermal expansion coefficients can be calculated by the following equation:
 | (1) |
![[small alpha, Greek, macron]](https://www.rsc.org/images/entities/i_char_e0c2.gif) (T0 − T) is the average thermal expansion coefficient in the temperature from T to T0. L0 is the length of the sample at the T0, ΔL, and ΔT are the change in the length of the sample with temperature increasing from T to T0 and the range of temperature changes, respectively. At 25 °C, the thermal expansion coefficients are calculated to be α(010) = 34.8 × 10⁻⁶ K−1, α(010) = −5.11 × 10⁻⁶ K−1, α⊥(100) = 9.01 × 10⁻⁶ K−1, and α45° = 18.1 × 10⁻⁶ K−1, respectively. According to the formula for calculating the thermal expansion ellipsoid of the monoclinic system in the literature,29 the matrix of the thermal expansion coefficients can be calculated and expressed as follow:
(T0 − T) is the average thermal expansion coefficient in the temperature from T to T0. L0 is the length of the sample at the T0, ΔL, and ΔT are the change in the length of the sample with temperature increasing from T to T0 and the range of temperature changes, respectively. At 25 °C, the thermal expansion coefficients are calculated to be α(010) = 34.8 × 10⁻⁶ K−1, α(010) = −5.11 × 10⁻⁶ K−1, α⊥(100) = 9.01 × 10⁻⁶ K−1, and α45° = 18.1 × 10⁻⁶ K−1, respectively. According to the formula for calculating the thermal expansion ellipsoid of the monoclinic system in the literature,29 the matrix of the thermal expansion coefficients can be calculated and expressed as follow:
 | (2) |
The thermal expansion coefficients in the spatial distribution can be obtained with the thermal expansion coefficients. The orientation relationship between the principal axis of the thermal expansion ellipsoid and the crystallographic axis of the Y2Mo4O15 crystal is expressed in Fig. 7a. As shown in Fig. 7b, the thermal expansion coefficient of the crystal has obvious anisotropy with the transformation of the spatial orientation. Fig. 7c shows the tangent line between the α11 = 0 plane and the space-varying surface, that is, in the range of 25–500 °C, after performing the spatial rotation operation on α11 according to the θ–ψ combination on the curve of Fig. 7c, the average thermal expansion coefficient of the spatial orientation is 0.
The thermal diffusivity and thermal conductivity
Due to the thermal diffusivity coefficient is a second-rank symmetric tensor, four independent components need to be measured for monoclinic Y2Mo4O15 crystal. At 30–400 °C, the thermal diffusivities along four different directions are shown in Fig. 6b, and the uncertainty of measurement results is no more than 0.5%. Then the thermal conductivity can be calculated by the following equation:| κ = λρCp | (3) |
 | (4) |
As shown in Fig. 6c, the thermal conductivity of (100) and (001) are calculated to be 1.53 W (m−1 K) and 2.11 W (m−1 K) at room temperature, respectively. The thermal diffusion and thermal conductivity of Y2Mo4O15 show a decreasing trend with the increase of temperature from room temperature to 400 °C.
Negative thermal expansion mechanism
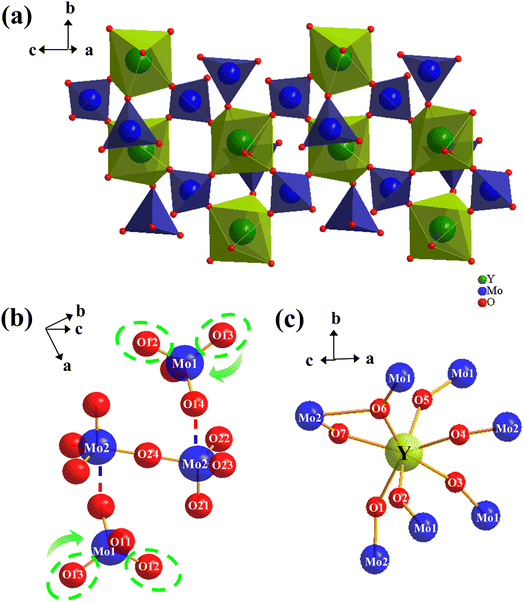
To further explore the NTE mechanism, the crystal structures of Y2Mo4O15 crystal are analyzed at 25 °C, 50 °C, 75 °C, and 100 °C. At 25 °C, the Y2Mo4O15 crystal crystallizes in a centrally symmetric space group P21/c and the refined lattice parameters are a = 6.8185 Å, b = 9.5913 Å, c = 10.5299 Å, β = 105.586°, V = 663.31 Å3 (Z = 2), which are in good agreement with reported data.25 The three-dimensional structure of the Y2Mo4O15 crystal is composed of MoO4 tetrahedron and YO7 decahedron, which are connected by O atoms like another A2M4O15 family (Fig. 8a). As shown in Fig. 8b, molybdenum atoms occupy two types of lattice position to constitute Mo(1)O4 and Mo(2)O4 tetrahedrons, respectively, while every two adjacent Mo(2)O4 tetrahedrons are connected by anti-position center O24 atom to form [Mo2O7] dimer which is similar to the [V2O7] group in ZrV2O7.The negative thermal expansion mechanism established by detailed structural studies of ZrV2O7 and ZrW2O8 shows that the NTE is mainly determined by the changes in the structure of the negative ions. Considering the topological similarity between the structure of Y2Mo4O15 and the structure of ZrV2O7 and ZrW2O8, it is reasonable to speculate that Y2Mo4O15 has a thermal expansion behavior mechanism similar to that of ZrV2O7 or ZrW2O8.22 However, according to the data in Table 1, it can be found that the bridge Mo2–O24–Mo2 bond angle always maintains 180°. In addition, with the increase in temperature, the bond angle between the metal atoms and the connected bridge oxygen atoms do not change significantly. Furthermore, it was observed that O14 in Mo(1)O4 tetrahedron is weakly connected to the Mo2 of the [Mo2O7] group like the connection of O3 of the W(2)O4 tetrahedron to W(1) of WO4 tetrahedron in the ZrW2O8 structure.4
| Bond | Bond angles | |||
|---|---|---|---|---|
| 25 °C | 50 °C | 75 °C | 100 °C | |
| Mo2–O24–Mo2 | 180.000(0) | 180.000(0) | 180.000(3) | 180.000(0) |
| Mo1–O14–Mo2 | 130.000(0) | 129.225(4) | 129.379(2) | 129.447(2) |
| Y–O1–Mo2 | 143.557(4) | 143.527(3) | 143.474(3) | 143.619(3) |
| Y–O2–Mo1 | 147.785(4) | 147.870(4) | 147.326(3) | 148.111(3) |
| Y–O3–Mo1 | 164.748(4) | 164.695(4) | 164.753(4) | 164.521(4) |
| Y–O4–Mo2 | 163.482(4) | 163.454(4) | 163.566(4) | 163.830(4) |
| Y–O5–Mo1 | 144.926(4) | 145.634(3) | 144.852(3) | 144.366(3) |
| Y–O6–Mo1 | 135.813(3) | 136.206(3) | 136.372(3) | 136.171(3) |
| Y–O7–Mo2 | 119.675(4) | 119.719(3) | 119.307(3) | 119.425(3) |
But in fact, due to the distance between Mo2⋯O14 (2.5082–2.5272 Å) in Y2Mo4O15 is much longer than that of theoretical bonding distance(1.73–2.18 Å)30 and the W(1)⋯O3 bond in ZrW2O8 (about 2.39 Å), the W(1)⋯O3 bond in ZrW2O8 is thus stronger than the Mo2⋯O14 in Y2Mo4O15. Therefore, the O14 atom cannot perform lateral thermal vibration as the bridge oxygen atom, which is different from the NTE mechanism of ZrW2O8 for the thermal vibration of bridge oxygen atoms.
The mechanism of NTE is further explored from the change of bond length.31,32 As shown in Table 2, the bond lengths of Y2Mo4O15 from 25 °C to 100 °C are presented. The bond length of the Y–O bonds increases gradually with the temperature increasing, while the bond length of Mo2–O remains almost unchanged. It is worth noting that the length of the Mo1–O12 bond and Mo1–O13 bond in the direction close to the b-axis direction shows shrinking trend, especially the length of Mo1–O13 bond shrinks from 1.750(7) Å to 1.742(7) Å. The increase of Y–O bond length with increasing temperature provides the main driving force for the positive thermal expansion behaviors, while the contraction of part of the Mo1–O bond is the main reason for the negative thermal expansion along the b-axis. The overall thermal expansion of Y2Mo4O15 is dominated by the thermal expansion of the a-axis and c-axis, showing a positive thermal expansion.
| Bond | Bond lengths | |||
|---|---|---|---|---|
| 25 °C | 50 °C | 75 °C | 100 °C | |
| Mo1–O11 | 1.763(6) | 1.752(6) | 1.756(6) | 1.753(6) |
| Mo1–O12 | 1.746(7) | 1.744(7) | 1.738(7) | 1.744(7) |
| Mo1–O13 | 1.750(7) | 1.748(7) | 1.745(7) | 1.742(7) |
| Mo1–O14 | 1.783(6) | 1.787(6) | 1.784(6) | 1.788(6) |
| Mo2–O21 | 1.737(7) | 1.732(7) | 1.739(6) | 1.743(6) |
| Mo2–O22 | 1.735(8) | 1.741(8) | 1.738(7) | 1.744(7) |
| Mo2–O23 | 1.735(7) | 1.739(6) | 1.739(6) | 1.733(6) |
| Mo2–O24 | 1.866(9) | 1.867(9) | 1.866(6) | 1.867(6) |
| Mo2–O | 1.769(5) | 1.769(5) | 1.770(4) | 1.771(6) |
| Y–O | 2.298(6) | 2.298(5) | 2.303(6) | 2.304(5) |
The crystal structures analysis shows that the contraction of Mo–O bonds along the b-axis with increasing temperature is the main origin of the NTE property of Y2Mo4O15 crystal, which is not similar to the current NTE mechanism.
Conclusion
In summary, the bulk single crystal Y2Mo4O15 with 20 × 11 × 8 mm3 was successfully grown by the TSSG method. The full-width at half-maximum (FWHM) of (100) and (010) faces is 37 and 27 arcsec, respectively. All the thermal properties including the specific heat, thermal diffusion, thermal expansion, and thermal conductivity are studied in detail. The results show that the Y2Mo4O15 crystal has significant anisotropy thermal properties with NTE property along the b-axis. The change of the crystal structure of Y2Mo4O15 with temperature indicates that the contraction of the Mo–O bonds along the b-axis as the temperature increases is the major contribution to the NTE property of Y2Mo4O15 crystal, which is not similar to the current NTE mechanism.Conflicts of interest
The authors declare no competing financial interest.Acknowledgements
This work is financially supported by the National Natural Science Foundation of China (62175129); Qilu Young Scholar of Shandong University; Program of Introducing Talents of Disciplines to Universities in China (111 program) (BP2018013).Notes and references
- T. A. Mary, J. S. O. Evans, T. Vogt and A. W. Sleight, Science, 1996, 272, 90–92 CrossRef CAS.
- C. W. Li, X. Tang, J. A. Munoz, J. B. Keith, S. J. Tracy, D. L. Abernathy and B. Fultz, Phys. Rev. Lett., 2011, 107, 195504 CrossRef PubMed.
- B. K. Greve, K. L. Martin, P. L. Lee, P. J. Chupas, K. W. Chapman and A. P. Wilkinson, J. Am. Chem. Soc., 2010, 132, 15496–15498 CrossRef CAS PubMed.
- A. K. A. Pryde, K. D. Hammonds, M. T. Dove, V. Heine, J. D. Gale and M. C. Warren, J. Phys.: Condens. Matter, 1996, 8, 10973–10982 CrossRef CAS.
- S. Sumithra, U. V. Waghmare and A. M. Umarji, Phys. Rev. B: Condens. Matter Mater. Phys., 2007, 76, 024307 CrossRef.
- L. H. N. Rimmer and M. T. Dove, J. Phys.: Condens. Matter, 2015, 27, 185401 CrossRef PubMed.
- B. A. Marinkovic, M. Ari, P. M. Jardim, R. R. de Avillez, F. Rizzo and F. F. Ferreira, Thermochim. Acta, 2010, 499, 48–53 CrossRef CAS.
- S. Sumithra, A. K. Tyagi and A. M. Umarji, Mater Sci Eng B Solid State Mater Adv Technol., 2005, 116, 14–18 CrossRef.
- T. A. Mary and A. W. Sleight, J. Mater. Res., 1999, 14, 912–915 CrossRef CAS.
- J. Chen, F. Wang, Q. Huang, L. Hu, X. Song, J. Deng, R. Yu and X. Xing, Sci. Rep., 2013, 3, 2458 CrossRef PubMed.
- J. Chen, X. Xing, C. Sun, P. Hu, R. Yu, X. Wang and L. Li, J. Am. Chem. Soc., 2008, 130, 1144–1145 CrossRef CAS PubMed.
- J. Chen, K. Nittala, J. S. Forrester, J. L. Jones, J. Deng, R. Yu and X. Xing, J. Am. Chem. Soc., 2011, 133, 11114–11117 CrossRef CAS PubMed.
- X. R. Xing, J. X. Deng, Z. Q. Zhu and G. R. Liu, J. Alloys Compd., 2003, 353, 1–4 CrossRef CAS.
- Y. Kakehashi, J. Phys. Soc. Jpn., 1980, 49, 2421–2422 CrossRef CAS.
- Y. Tino and Y. Iguchi, J. Magn. Magn. Mater., 1983, 31–4, 117–118 CrossRef.
- A. Katsuki and K. Terao, J. Phys. Soc. Jpn., 1969, 26, 1109–1114 CrossRef CAS.
- Ismail, P. Hofmann, A. P. Baddorf and E. W. Plummer, Phys. Rev. B: Condens. Matter Mater. Phys., 2002, 66, 245414 CrossRef.
- B. W. Busch and T. Gustafsson, Phys. Rev. B: Condens. Matter Mater. Phys., 2000, 61, 16097–16104 CrossRef CAS.
- J. Arvanitidis, K. Papagelis, S. Margadonna, K. Prassides and A. N. Fitch, Nature, 2003, 425, 599–602 CrossRef CAS PubMed.
- W. C. M. Mattens, H. Holscher, G. J. M. Tuin, A. C. Moleman and F. R. Deboer, J. Magn. Magn. Mater., 1980, 15–8, 982–984 CrossRef.
- Y. W. Long, N. Hayashi, T. Saito, M. Azuma, S. Muranaka and Y. Shimakawa, Nature, 2009, 458, 60–U63 CrossRef CAS PubMed.
- L. Sebastian, S. Sumithra, J. Manjanna, A. M. Umarji and J. Gopalakrishnan, Mater Sci Eng B Solid State Mater Adv Technol., 2003, 103, 289–296 CrossRef.
- H. Wang, J. Peng, X. J. Li, Y. M. Hao, D. F. Chen and Z. Hu, Phys. B, 2007, 388, 278–284 CrossRef CAS.
- Z. Yu, D. Chen, H. Wang, J. Peng, Y. Cheng, M. Wu and Z. Hu, Rare Met., 2007, 26, 426–434 CrossRef CAS.
- X. Wang, Z. Gao, C. Wang, X. Guo, Y. Sun, Y. Jia and X. Tao, RSC Adv., 2021, 11, 1164–1171 RSC.
- W. B. Hou, D. Xu, D. R. Yuan, M. G. Liu, N. Zhang, X. T. Tao, S. Y. Sun and M. H. Jiang, Cryst. Res. Technol., 1994, 29, 939–944 CrossRef CAS.
- A. Tayal, Y. Chen, C. Song, S. Hiroi, L. S. R. Kumara, N. Palina, O. Seo, M. Mukoyoshi, H. Kobayashi, H. Kitagawa and O. Sakata, Inorg. Chem., 2018, 57, 10072–10080 CrossRef CAS PubMed.
- H. Wu, H. Yu, W. Zhang, J. Cantwel, K. R. Poeppelineier, S. Pan and P. S. Halasyamani, Cryst. Growth Des., 2017, 17, 1404–1410 CrossRef CAS.
- X. J. Liu, Z. Y. Wang, X. Q. Wang, G. H. Zhang, S. X. Xu, A. D. Duan, S. J. Zhang, Z. H. Sun and D. Xu, Cryst. Growth Des., 2008, 8, 2270–2274 CrossRef CAS.
- J. S. O. Evans, T. A. Mary, T. Vogt, M. A. Subramanian and A. W. Sleight, Chem. Mater., 1996, 8, 2809–2823 CrossRef CAS.
- J. Peng, H. Wang, M. M. Wu, D. F. Chen, R. Kiyanagi, J. S. Fieramosca, S. Short, J. Jorgensen and Z. Hu, Mater. Technol., 2007, 22, 33–37 CrossRef CAS.
- J. Peng, X. L. Xiao, Z. Hu and J. Z. Tao, Solid State Sci., 2008, 10, 1543–1548 CrossRef CAS.
Footnote |
| † Electronic supplementary information (ESI) available. See DOI: https://doi.org/10.1039/d3ra01320k |
| This journal is © The Royal Society of Chemistry 2023 |

