 Open Access Article
Growth of diazonium-functionalized ZnO nanoflakes on flexible carbon cloth for electrochemical sensing of acetone in the liquid phase†
Azhar Abbasa,
Seemal Mansoorb,
Mian Hasnain Nawaz b,
Aqif Anwar Chaudhryb,
Kashif Ijazb,
Sara Riaz
 *c and
Akhtar Hayat
 *b
*b
aInstitute of Chemistry, University of Sargodha, Sargodha 40100, Pakistan
bInterdisciplinary Research Centre in Biomedical Materials (IRCBM), COMSATS University Islamabad, Lahore Campus, Lahore 54000, Pakistan. E-mail: akhtarhayat@cuilahore.edu.pk
cDepartment of Chemistry, COMSATS University Islamabad, Lahore Campus, Lahore 54000, Pakistan. E-mail: sarahasnain@cuilahore.edu.pk
First published on 13th April 2023
Abstract
Simple detection of acetone is indispensable due to its health and environmental concerns. Surface-modified electrodes are promising for the detection of acetone. In the present study, the facile fabrication of ZnO nanoflakes on carbon cloth (CC) is reported. The electrode was fabricated by decorating the CC with ZnO nanoparticles (ZnO NPs), followed by the hydrothermal treatment and modification with diazonium salt using linear sweep voltammetry (LSV) forming ZnO nanoflakes (ZnO NFs) on ZnO NPs/CC. The as-prepared ZnO/CC electrode was used for the detection of acetone at room temperature using cyclic voltammetry. Fourier transform infrared spectroscopy (FTIR), atomic force microscopy (AFM), scanning electron microscopy (SEM), X-ray diffraction (XRD), and Brunauer–Emmett–Teller (BET) analyses were used for the chemical and physical characterization of the CC before and after each modification step. The obtained data manifested that ZnO NFs functionalized with diazonium salt increased the roughness of the CC surface, which was advantageous to promote the interaction between CC and acetone target. The modified sensing platform showed excellent performance in terms of the wide working range (0.1–2000 ppm) and low detection limit (0.03 ppm), making it a promising and cost-effective sensor of acetone in the liquid phase.
1. Introduction
In recent times, the increased industrial advancements have contributed to the evolution of concentrations of hazardous and volatile gases such as ammonia, toluene, and acetone in the atmosphere. The exhaled breath contains numerous volatile organic compounds (VOCs). To access different human health conditions, the exact analysis and quantification of these VOCs are of considerable importance. These VOCs can act as markers for the diagnosis of different diseases and also provide advantages of non-invasive testing.1–3 Acetone is one such volatile reagent widely used in various industries and pharmaceutical laboratories. Exposure to the high concentration of acetone in our environment can badly affect human health, causing headache, necrosis, fatigue, and irritation to the eyes, nose, and throat.4The quantitative determination of the concentration of gaseous acetone in exhaled breath can provide a basis for the determination of blood glucose levels.5,6 Typically, a healthy human breath contains acetone in the range of 0.3–4.0 ppm, which can increase to 1250 ppm in a person suffering from diabetic ketoacidosis.7,8 If the concentration of acetone exceeds 173 ppm, it can cause damage to the eyes, nose, nervous system, and skin.9
Several techniques have been used for the detection of acetone such as gas chromatography,10 ion mobility spectrometry,11 and mass spectrometry.12 However, these techniques are usually time-consuming, require high operating temperatures, involve expensive and huge instrumentation, and require skilled operators.13 Additionally, they detect acetone in the gas phase. Therefore, it is of utmost importance to develop a cost-effective and practical device to sense acetone with high sensitivity and selectivity. On the other hand, electrochemical sensors offer an efficient, easy-to-use, sensitive, and simple approach to detecting an analyte of interest in the liquid phase.14,15
Some nanomaterial-modified electrodes have been reported for the quantification of acetone. For instance, metal oxides, such as TiO2, SnO2, Co3O4, Ag2O, W18O49, ZnO, and WO3, due to their intrinsic catalytic behavior and tunable size and shapes, have been extensively used for the development of acetone sensors.9,16–18 In two such reports, MnO2/Gd2O3/SnO2 and Ag2O nanosheet-modified glassy carbon electrode (GCE) were used as a chemical sensor to detect acetone and it exhibited a LOD 0.068 ± 0.003 nM and 0.11 μM, respectively.19,20 Sun et al. used solve-thermally synthesized W18O49/Ti3C2Tx MXene nanocomposites for the detection of acetone with LOD 2.93 μM.21 In another research, CdS nanospheres/Co3O4 nanofibers hybrid was used for the detection of acetone and it exhibited a LOD of 59.8 μM.22
Due to their unique electronic and optical properties, ZnO nanoparticles (ZnO NPs) have received more attention in gas sensing.23 ZnO NPs are promising materials for sensing acetone due to their high stability, ease of synthesis and handling, better compatibility, and reliability.24 Only a few reports have investigated acetone detection in the liquid phase.25 For example, ZnO/SnO2/Yb2O3 nanoparticle-modified GCE showed a 0.05 nM detection limit for acetone using the I–V detection method.26 In another research, a uniform two-dimensional Zn–benzene tricarboxylic acid-metal organic framework (Zn–BTC MOF) nano-sheet with a thickness of 14 ± 2 nm exhibited a detection limit for acetone at 1.7 μM.27
Despite the very low detection limit, the fabricated electrode is complex and is supported on glassy carbon bulk electrodes, making it practically difficult for wide applications. Alternatively, carbon cloth (CC) has gained extensive interest as a working electrode and support material among other electrode interfaces (glassy carbon electrode, pencil, and screen-printed carbon electrode) because it is light in weight, flexible, easy to handle, chemically stable, highly porous, electrically conductive, large surface arcea and cheap.28–30 Yet, carbon cloth, to the best of our knowledge, has not been used as a support for acetone detection. Furthermore, functionalization of the surface with diazonium salts has been reported to improve the sensing performance by promoting the bonding of acetone to the diazonium-modified surface.29 By combining synergistic properties of diazonium salt and ZnO NPs for the detection of acetone, a sensor can be fabricated for the quantification of acetone.
In this work, the growth of ZnO nanoflakes (ZnO NFs) at the surface of ZnO nanoparticles (ZnO NPs) seeded CC (ZnO NFs/ZnO NPs/CC) through hydrothermal treatment is reported. This ZnO NFs/ZnO NPs/CC was then modified with diazonium salt using LSV and explored as an electrochemical sensor for the sensitive and selective detection of acetone. Structural and chemical properties of ZnO NFs/CC were investigated by FTIR, SEM, AFM, XRD, and BET techniques. The electrochemical sensing performance of acetone was examined using cyclic voltammetry.
2. Experimental
2.1. Materials and apparatus
Analytical grade phosphate buffer saline (PBS), potassium ferrocyanide [K4Fe(CN)6], hydrochloric acid (HCl), potassium ferricyanide [K3Fe(CN)6], 4-aminobenzoic acid (99%), sodium nitrite (97.0%), acetone, toluene, ethanol, methanol, ammonia, and trimethyl ammine were purchased from Sigma-Aldrich. Zinc nitrate [Zn(NO3)2] and ammonia (NH3) were purchased from Nacalai Tesque, Inc. Deionized water (D-H2O) was available from ELGA PURELAB® ultra water deionizer. All these chemicals were used as received without further purification.Stock solutions of analyte were prepared in PBS buffer (pH = 7.4). Deionized water was used for the preparation of all solutions.
2.2. Seeding of ZnO NPs on CC (ZnO NPs/CC)
Seeding of ZnO NPs on CC to obtain ZnO NPs/CC was carried out by the following method. Firstly, a dispersion of ZnO NPs was prepared. This was achieved by sonicating 1.5 mg of ZnO NPs in 6 mL of deionized water. Secondly, the ZnO NPs were seeded on CC. Seeding of ZnO NPs was performed by soaking the piece of CC in the dispersion of ZnO NPs in a Petri dish for 30 min at 95 °C. The CC seeded with ZnO NPs was then dried in an oven for 30 min.2.3. Epitaxial growth of ZnO-NFs on ZnO NPs/CC
In order to perform the growth of ZnO NFs, Zn(NO3)2·6H2O (1.5 g) was added to D-H2O (20 mL) under continuous stirring till the clear solution was obtained. Aqueous ammonia solution was then added to this Zn(NO3)2 solution. On gradual addition of aqueous ammonia, ZnO(NO3)2 solution first became turbid and then transparent. The pH of the solution was maintained at 11 using NaOH. In order to perform the growth of ZnO-nanoflakes on seeded CC through the hydrothermal treatment, the seeded CC was dipped in a glass vial containing Zn(NO3)2 solution. The glass vial was kept in a 40 mL Teflon-lined stainless-steel autoclave and sealed tightly. The temperature of the autoclave was kept at 90 °C for 2 hours. Then, the CC was taken out from the vial and dehydrated at 50 °C for 5 hours in an oven. The successful growth of ZnO NFs on seeded CC was confirmed through SEM.2.4. Characterization of sensing materials
Surface morphology of carbon cloth (bare, seeded, and modified) was observed using scanning electron microscopy (SEM), using a VEGA-3 TESCAN variable pressure mode (LMU) version (Brno, Czech Republic) with different magnification ranges at an accelerated voltage of 20 kV. The surface functionalization of bare and modified carbon cloth was investigated using Fourier transform infrared (FTIR) using a Nicolet 6700 spectrometer (Thermo Fisher Scientific, Waltham, MA, USA). Atomic force microscopy (AFM) was performed using the park system AFM XE7. ZnO NPs samples were also characterized by X-ray diffraction (XRD) using a Philips X'Pert-Pro X-ray diffractometer. The X-ray tube was operated at a voltage of 40 kV, while the beam current was 30 mA. For recording the XRD patterns, the 2θ range was between 20° and 75° at 0.02° steps. The scan speed during the analysis was kept at 5° per min. The adsorption properties of ZnO samples such as surface area, pore volume, and average particle size were analysed using the instrument provided by Micromeritics Instrument Co. The sample was degassed at 80 °C for 2 h prior to measurement. The surface area was determined by the multipoint BET (Brunauer–Emmett–Teller) method using the adsorption data as a function of relative pressure. Before BET analysis, the samples were oven dried at 80 °C for 24 h.The electrochemical measurements were recorded using the Gamry Reference 3000 potentiostat/galvanostat (Warminster, PA, and USA). In a three-electrode system, CC was used as a working electrode, platinum wire as a counter electrode, and silver/silver chloride was used as the reference electrode.
2.5. Preparation of potassium ferro-ferricyanide and diazonium solution
The potassium ferro/ferricyanide solution (5 mM) was prepared by dissolving potassium ferrocyanide (31.7 mg) and potassium ferricyanide (24.7 mg) in PBS (15 mL, 7.4 pH). Diazonium salt was prepared by mixing 4-aminobenzoic acid (2 mM), HCl (0.5 M), D-H2O, and some drops of NaNO2 (1 M) for 5 min at room temperature.29 The ZnO NFs/ZnO NPs/CC surface was modified by diazonium salt through LSV in a potential range of 0.6 V to −0.8 V.2.6. Functional assay for acetone
For acetone detection, cyclic voltammograms (CVs) of ZnO NFs/ZnO NPs/CC modified with LSV-reduced diazonium reacted with different concentrations of acetone (0.1–2000 ppm) and unmodified ZnO NFs/ZnO NPs/CC in the same concentration of acetone and diazonium salt were recorded. To obtain the maximum response for acetone sensing, the fabricated electrode was tested in various buffer systems of pH = 5.7, 6.5, 7.0, 7.4, and 8.0. The fabricated sensor was found to be more responsive at pH 7.4. So, all the studies were carried out at pH 7.4. These CVs were recorded in the potential range −0.6 V to 0.6 V at a scan rate of 100 mV s−1.3. Results and discussion
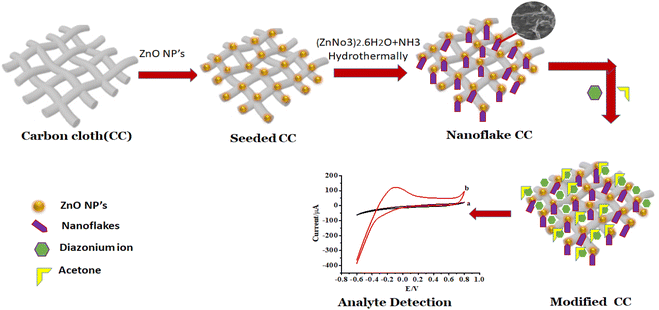
The schematic route of growth of ZnO NFs at the surface of ZnO NPs/CC is illustrated in Scheme 1. Seeding of CC with ZnO NPs was carried out by dipping a bare CC in the ZnO NPs dispersion. The growth of ZnO NFs on this seeded CC was achieved by hydrothermal treatment. The success of the seeding of CC with ZnO NPs and then the growth of ZnO NFs on this seeded CC was confirmed from SEM images (Fig. 2C). Furthermore, ZnO NFs/ZnO NPs/CC was modified by diazonium salt for the detection of acetone through electrochemical characterization.3.1. Characterization of ZnO NPs, ZnO NPs/CC, and ZnO NFs/CC by XRD
Fig. 1A shows the XRD pattern of the synthesized ZnO NPs. All the peaks of the XRD pattern of the synthesized ZnO NPs can be indexed to ZnO with a hexagonal structure. Comparison of the XRD pattern of the ZnO NPs sample with the standard card of hexagonal ZnO evidenced that the ZnO NPs sample was present as a pure single phase of ZnO because no diffraction peaks of other impurities were detected. The XRD patterns of ZnO NPs/CC and ZnO NFs/ZnO NPs/CC are presented in Fig. S3.† On comparing these XRD patterns with the XRD pattern of pure ZnO NPs, it is evident that ZnO NPs and ZnO NFs were successfully grown on CC. All the peaks of the XRD pattern of ZnO NPs are present in the XRD patterns of ZnO NPs/CC and ZnO NFs/ZnO NPs/CC but with less intensity (see Fig. S3†).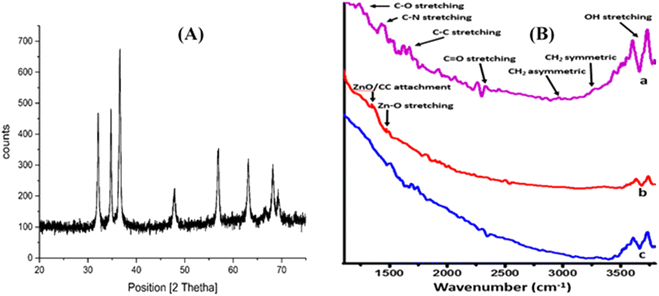 | ||
| Fig. 1 (A) XRD patterns of pure ZnO NPs sample and (B) FTIR spectra of (a) bare CC, (b) ZnO NPs/CC, (c) ZnO NFs/ZnO NPs/CC. | ||
The surface area and average particle size of ZnO NPs were calculated by the BET method and it was found to be 16.88 units and 355.4 nm.
3.2. Characterization of CC, ZnO NPs/CC, and ZnO NFs/ZnO NPs/CC by FTIR, SEM, and AFM
In order to identify the functional groups and to confirm the successful synthesis of the sensing materials FTIR spectra of CC, ZnO NPs/CC, and ZnO NFs/ZnO NPs/CC were recorded and compared. These spectra are presented in Fig. 1B. A large peak at 3645 cm−1 in the FTIR spectrum of bare CC (see Fig. 1B(a)) can be attributed to OH stretching vibration. Peaks at 2925 and 3252 cm−1 represent symmetric and asymmetric stretching vibrations of the CH2 group, respectively. Another strong peak corresponding to the C–C bond stretching appeared at 1480 cm−1. Three more peaks at 2170, 1390, and 1125 cm−1 characterized C![[double bond, length as m-dash]](https://www.rsc.org/images/entities/char_e001.gif) O, C–N, and C–O stretching vibrations, respectively. The intensity of these three peaks decreased due to the interaction between CC and ZnO-NPs in the FTIR spectrum of ZnO NPs/CC. A new smaller peak at 1164 cm−1 was due to Zn–O stretching vibration while the peak at 1341.3 cm−1 is attributable to the occurrence of interaction between CC with ZnO NPs (see Fig. 1B(b)). An increase in the intensity of the Zn–O peak was observed in the FTIR spectrum of ZnO NFs/ZnO NPs/CC (see Fig. 1B(c)). All other characteristic peaks of CC were observed in the FTIR spectra of ZnO NPs/CC and ZnO NFs/ZnO NPs/CC.
O, C–N, and C–O stretching vibrations, respectively. The intensity of these three peaks decreased due to the interaction between CC and ZnO-NPs in the FTIR spectrum of ZnO NPs/CC. A new smaller peak at 1164 cm−1 was due to Zn–O stretching vibration while the peak at 1341.3 cm−1 is attributable to the occurrence of interaction between CC with ZnO NPs (see Fig. 1B(b)). An increase in the intensity of the Zn–O peak was observed in the FTIR spectrum of ZnO NFs/ZnO NPs/CC (see Fig. 1B(c)). All other characteristic peaks of CC were observed in the FTIR spectra of ZnO NPs/CC and ZnO NFs/ZnO NPs/CC.
The surface morphology of bare CC, ZnO NPs/CC, and ZnO NFs/ZnO NPs/CC CC was examined by SEM, as shown in Fig. 2A–C. The surface of bare CC was perfectly smooth (see Fig. 2A) and uniform.30–32 A uniform attachment of ZnO NPs was clearly seen on the surface of CC after seeding CC with ZnO NPs (see Fig. 2B). Similarly, Fig. 2C shows the growth of ZnO NFs on ZnO NPs seed CC (see Fig. 2C). These SEM images result clearly indicate that ZnO NPs and ZnO NFs were successfully grown on CC.
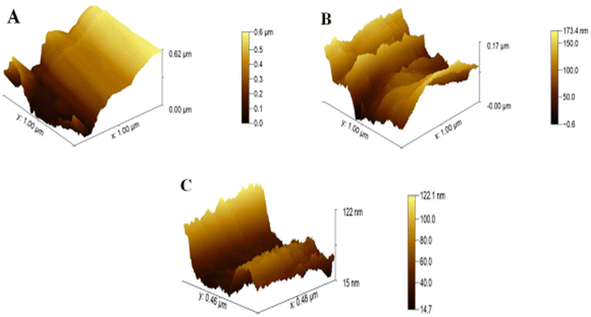
For the study of surface roughness, AFM was used. The topographical analysis exposed the roughness of bare CC, ZnO NPs/CC, and ZnO NFs/ZnO NPs/CC, as shown in Fig. 3A–C. Bare and untreated CCs have a smooth and plain surface (see Fig. 3A),33 the roughness value, revealing the efficiency of CC electrodes as 0.62 μm, 0.17 μm, and 0.12 μm, respectively, decreased through the successive steps (see Fig. 3A–C), respectively, of the proposed sensor. The lowest roughness of the ZnO NFs/CC comprehends the increased homogeneity. An increase in homogeneity increases the electron conductivity of the working electrode (CC).34
Moreover, the thickness of CC, ZnO NPs, and ZnO NFs/ZnO NPs/CC were calculated using d = V/S, and V = M/ρ where d = thickness, V = volume, M is mass in g and S is the surface area of CC in cm2. The density (ρ) of the carbon fiber was 1.8 g cm−3. Thickness for bare CC, ZnO NPs, and ZnO NFs/ZnO NPs/CC were found to be 0.05 mm, 0.051 mm, and 0.058 mm, respectively.
3.3. Electrochemical characterization
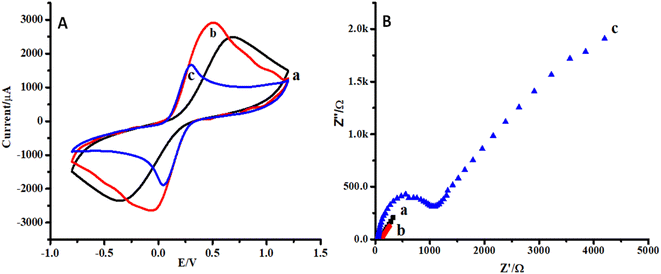
Cyclic voltammetry (CV) and electrochemical impedance spectroscopy (EIS) were selected for the characterization of the proposed sensor.35 CVs of CC, ZnO NPs/CC, and ZnO NFs/ZnO NPs/CC are presented in Fig. 4A(a–c). In the reported literature, CV and EIS in ferro/ferricyanide solution are useful and important tools to monitor the behavior of any proposed strategy because electron transfer could occur either through the barrier or through the defects in the barrier. The conductivity of the bare and modified electrode (CC) was checked by cyclic voltammetry. The electrochemical current peak increased in the case of ZnO NPs modified CC (b) compared to that of the bare carbon cloth (a) (see Fig. 4A(a and b)). However, the growth of ZnO NFs on CC seeded with ZnO NPs decreased the electron transfer or conductivity (see Fig. 4A(c)). This might be due to the aggregation of ZnO NPs on the CC surface.Similarly, the impedimetric responses of CC, ZnO NPs/CC, and ZnO NFs/ZnO NPs/CC are presented in Fig. 4B(a–c). The impedimetric response was in accordance with the CV response for bare CC, ZnO NPs/CC, and ZnO NFs/ZnO NPs/CC. The resistivity of ZnO NFs/ZnO NPs/CC (c) was higher than that of the CC seeded with ZnO NPs (b) and bare CC (a) (see Fig. 4B(a–c)). Moreover, it is also clear from the plots that the impedimetric response is supportive of the data from the cyclic voltammetry.
Before the detection of acetone, ZnO NFs/ZnO NPs/CC was modified through diazonium salt via linear sweep voltammetry (LSV) in the potential range 0.6 to −0.8 V at a scan rate of 50 mV−1.36,37 Fig. S1† A represents the electrochemical reduction peak in the acetone solution (0.5 ppm) in diazonium salt. The intensity of the electrochemical signal confirmed the strong attachment between benzoic acid and electrode surface (CC) with the removal of N2 gas. LSV was performed at various incubation times (0 min, 15 min, and 30 min) for the optimization of the best time for covalent bonding between CC and benzoic acid. These voltammograms are presented in Fig. S1B(a–c).† An incubation time of 15 min was optimized for the best covalent attachment between CC and benzoic acid for the modification of the electrode (CC) (see Fig. S1B(c)†) and this time was selected for further experimentation.
Moreover, the electro-active areas of CC, ZnO NPs, and ZnO NFs/ZnO NPs/CC were calculated using the Randles–Sevcik equation
3.4. Detection of acetone
The electrochemical response of ZnO NFs/ZnO NPs/CC with and without the modification with diazonium salt towards the detection of acetone is presented in Fig. S2(a–d).† It is clearly observed that ZnO NFs/ZnO NPs/CC modified with LSV reduced diazonium-reacting acetone (0.5 ppm) in the presence of PBS (pH-7) (c) that showed an enhanced electrochemical signal compared to that of the unmodified ZnO NFs/ZnO NPs/CC (b) in the presence of PBS (PH-7) with the same concentration of acetone (0.5 ppm). The electrochemical response of unmodified ZnO NFs/ZnO NPs/CC was evaluated with the same concentration of acetone (0.5 ppm) and diazonium salt (d) and almost the same response was noted as in the case of ZnO NFs/ZnO NPs/CC modified with LSV reduced diazonium reacted acetone (0.5 ppm). The response of bare CC (a) in the presence of the same concentration of acetone (0.5 ppm) did not show any significant peak.Acetone reduction is competitive to the hydrogen evolution reaction, which occurs in a similar potential region; hence, the current for acetone reduction to isopropanol and hydrogen evolution is convoluted in the recorded CVs. A similar voltammetric behavior has been reported at Ru NPs in 1 M acetone/1 M NaOH electrolyte.38 It is noteworthy to mention that the peak position and current as well as the reaction product are significantly dependent on the catalyst material.
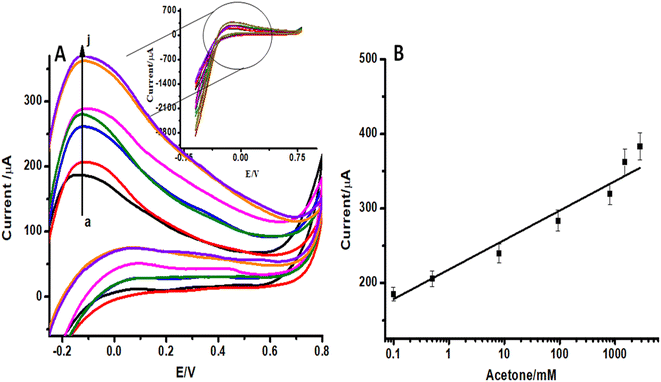
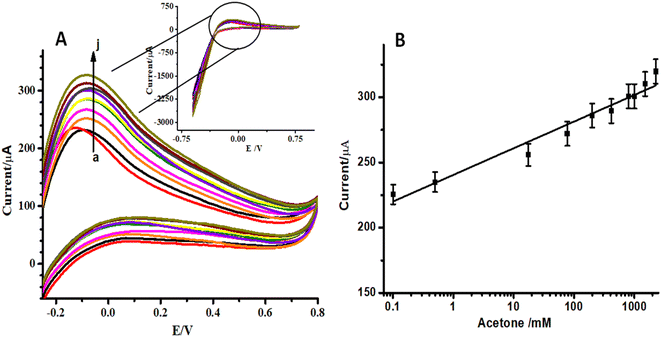
In order to evaluate the sensitivity and selectivity of the proposed sensor, it is important to study the effect of analyte concentration on the electrochemical signal. Cyclic voltammograms (CVs) of ZnO NFs/ZnO NPs/CC modified with LSV-reduced diazonium reacted with different concentrations of acetone (0.1–2000 ppm) are presented in Fig. 5A. These CVs were recorded in the potential range −0.6 V to 0.6 V at a scan rate of 100 mV s−1. The anodic peak represents the electrocatalytic oxidation of isopropanol.37 A significant increase in oxidation anodic peak at 0.1 V was observed with an increase in the analyte concentration in both cases. A proportional increase in the faradaic oxidation current was observed with an increase in acetone concentration and this made the basis for the construction of a calibration plot and detection of acetone. A calibration curve was constructed at different concentrations of acetone with the help of oxidation current obtained by recording CVs (Fig. 5B). The calibration plot showed a good linear relationship between peak current and the analyte concentration in the range of 0.1–2000 ppm with a detection limit of 0.03 ppm for acetone estimated from the signal-to-noise ratio of these data. The response of the electroactive transducer surface was increased in the presence of acetone, showing the complex formation between the transducer surface and acetone. CVs of unmodified ZnO NFs/ZnO NPs/CC in the same concentration of diazonium salt and acetone were also recorded as shown in Fig. 6A. By increasing the acetone concentration in the linear range 0.1 to 2000 ppm, a gradual increase in the peak current was observed, as shown in Fig. 6B. Comparison of Fig. 5A, B and 6A, B shows that the modified ZnO NFs/ZnO NPs/CC exhibited somewhat better and significant responses (Fig. 5A) than unmodified ZnO NFs/ZnO NPs/CC. Consequently, these results suggest that the designed acetone sensor is very much useful for electrochemical sensing.
In these experiments of electrochemical detection of acetone, the gradual increase in current is due to an increase in acetone concentration in the buffer on ZnO NFs/ZnO NPs/CC/diazonium electrode. ZnO NFs/ZnO NPs/CC provides more surface area for the adsorption of O2. While diazonium grafted on the surface of ZnO NFs/ZnO NPs/CC facilitates the adsorption of acetone.39 At the initial stages, the reduction reaction of acetone was limited due to the less adsorbed amount of acetone on the electrode surface. The surface coverage of the electrode increases with an increase in the concentration of acetone in the buffer, which then enhances the reduction reaction of acetone thereby increasing the electrochemical signal. Acetone releases electrons in the buffer during its reduction by adsorbed O2, which results in an increase in the electrochemical signal. The proposed mechanism for the reaction that occurs on the electrode surface is initiated by adsorbed O2, which becomes O− due to adsorption on n-type ZnO NPs and ZnO NFs. This O− reduces adsorbed acetone. The reaction results in the release of electrons, hydrogen, and carbon dioxide. The reactions occurring are given as:
| CH3COCH3 + 4O− → CH3COOH + CO2 + H2O + 4e− |
| CH3COOH + 7O− → 3CO2 + 3H2 + O2 + 7e− |
This release of electrons enhances the electrochemical signal and makes the basis of acetone sensing.
An estimate of total surface coverage (Γ) of acetone can be evaluated from the charge passed (Q) by integrating the area under the voltammetric peaks using the equation: Γ= Q/nFA, where n is the number of electrons transferred, F is Faraday's constant, and A is the electrode area. A surface concentration of Γ = 3.01 ± 0.75 × 10⁻⁹ mol of acetone to the electrode surface can be estimated.
The SEM images after the detection of acetone with ZnO NPs/ZnO NFs/CC are presented in Fig. S4.† Comparison of this image with that of ZnO NPs/ZnO NFs/CC before acetone detection clearly shows that there is a difference in the morphology of ZnO NPs/ZnO NFs/CC before and after the detection of acetone. This supports our proposed mechanism and indicates the reaction occurring on the surface of the designed sensor.
The acetone detection capability of the ZnO NFs/ZnO NPs/CC/diazonium salt was compared with that of the other ZnO-based sensors previously published as presented in Table 1. The comparison shows that ZnO NFs/ZnO NPs/CC/diazonium salt exhibited a limit of detection as low as 0.03 ppm.
| Sensing material | LOD (ppm) |
|---|---|
| ZnO nanoparticles40 | 0.07 |
| ZnO/CO3O4 nanorods41 | 0.85 |
| Ag2S/NiO–ZnO nanocomposites42 | 3.5 |
| ZnO/Co3O4 heterostructure43 | 1.0 |
| NiO/ZnO composites44 | 0.8 |
| NiO/ZnO micrflowers45 | 10 |
| Sn-doped ZnO46 | 5.0 |
| ZnO/ZnCo2O4 hollow spheres47 | 10 |
| Pt-doped ZnO NPs48 | 0.10 |
| ZnO NFs/ZnO NPs/CC/Diazonium salt (current work) | 0.03 |
3.5. Interference by other analytes
The response of the fabricated sensor toward 0.5 ppm of various interfering analytes such as methanol, ethanol, benzene, ammonia, and toluene was also investigated. The sensor displayed superior selectivity and response toward the same concentration of acetone (0.5 ppm), as compared with other interfering analytes.3.6. Reproducibility and stability of the fabricated sensor
The reproducibility of the fabricated sensor was investigated with inter-assay precision. The inter-assay precision was tested with the same acetone concentration with five sensors (ZnO NFs/ZnO NPs/CC modified with LSV-reduced diazonium) independently prepared under the same experimental conditions. A relative standard deviation of 4.3% was obtained. These values of relative standard deviation indicate that the designed sensor showed very good reproducibility results.Moreover, the designed sensor was stored at room temperature for an extended period of time. No difference in the performance of the fabricated sensor was found over a significant period of time.
3.7. Application of the fabricated sensor to saliva samples
It is not convenient to determine acetone in a breath because it is lost in the sample preparation step. So, an attempt was made to determine acetone in synthetic saliva, which has become the focus of a non-invasive sample because of the easy sampling and storage.49,50 So, the potential of the fabricated sensor for the detection of acetone in saliva was investigated. The precision of the designed sensor was also determined. Saliva samples were spiked with three different concentrations of acetone (0.4, 150, and 1800 ppm). The precision of the determination of acetone in the saliva was less than 2.87%. Recovery, relative error, and the relative standard deviation of samples are summarized in Table 2. The recovery percentages were found to be greater than 97%, with a relative standard deviation value of about 4.1%. Based on these results, it is evident that the proposed method is not only accurate but also precise. These results show that this sensor could be a reliable and effective method for acetone detection in saliva.| Acetone added (ppm) | Acetone found (ppm) | R.S.D (%) | R.E (%) | R (%) |
|---|---|---|---|---|
| a R.S.D (%) = relative standard deviation percentage; R.E (%) = relative error percentage; R (%) = recovery percentage. | ||||
| 0.4 | 0.38 | 4.5 | 5 | 95 |
| 150 | 144 | 3.8 | 4 | 96 |
| 1800 | 1750 | 4.1 | 2.8 | 97.2 |
4. Conclusion
In this work, an easy-to-fabricate, highly stable, flexible, and cost-effective electrochemical sensor was successfully developed for sensitive and selective detection of acetone to a concentration as low as 0.03 ppm. The growth of NFs on CC proved a good avenue to enhance the interaction between the analyte and substrate surface. The mechanism for acetone sensing using modified ZnO NFs/ZnO NPs/CC has been successfully elaborated. This investigation provides the first evidence for the sensitive and selective detection of acetone via an electrochemical-based flexible carbon transducer.Conflicts of interest
There are no conflicts of interest to declare.References
- A. W. Boots, J. J. van Berkel, J. W. Dallinga, A. Smolinska, E. F. Wouters and F. J. van Schooten, J. Breath Res., 2012, 6, 027108 CrossRef PubMed.
- H. Haick, Y. Y. Broza, P. Mochalski, V. Ruzsanyi and A. Amann, Chem. Soc. Rev., 2014, 43, 1423–1449 RSC.
- G. Konvalina and H. Haick, Acc. Chem. Res., 2014, 47, 66–76 CrossRef CAS PubMed.
- M. M. Renfrew, Indoor Air Pollution Control (Godish, Thad), ACS Publication, 1990 Search PubMed.
- C. Turner, C. Walton, S. Hoashi and M. Evans, J. Breath Res., 2009, 3, 046004 CrossRef PubMed.
- P. R. Galassetti, B. Novak, D. Nemet, C. Rose-Gottron, D. M. Cooper, S. Meinardi, R. Newcomb, F. Zaldivar and D. R. Blake, Diabetes Technol. Ther., 2005, 7, 115–123 CrossRef CAS PubMed.
- C. Deng, J. Zhang, X. Yu, W. Zhang and X. Zhang, J. Chromatogr. B: Biomed. Sci. Appl., 2004, 810, 269–275 CrossRef CAS.
- A. M. Diskin, P. Španěl and D. Smith, Physiol. Meas., 2003, 24, 107 CrossRef PubMed.
- L. Wang, A. Teleki, S. E. Pratsinis and P. Gouma, Chem. Mater., 2008, 20, 4794–4796 CrossRef CAS.
- J. M. Sanchez and R. D. Sacks, Anal. Chem., 2003, 75, 2231–2236 CrossRef CAS PubMed.
- H. Lord, Y. Yu, A. Segal and J. Pawliszyn, Anal. Chem., 2002, 74, 5650–5657 CrossRef CAS PubMed.
- M. Phillips, J. Herrera, S. Krishnan, M. Zain, J. Greenberg and R. N. Cataneo, J. Chromatogr. B: Biomed. Sci. Appl., 1999, 729, 75–88 CrossRef CAS PubMed.
- A. Alasvand and H. Kafashan, J. Alloys Compd., 2020, 817, 152711 CrossRef CAS.
- H. M. Amin, M. F. El-Kady, N. F. Atta and A. Galal, Electroanalysis, 2018, 30, 1757–1766 CrossRef.
- N. F. Atta, R. A. Ahmed, H. M. Amin and A. Galal, Electroanalysis, 2012, 24, 2135–2146 CrossRef CAS.
- S. B. Khan, M. Faisal, M. M. Rahman and A. Jamal, Talanta, 2011, 85, 943–949 CrossRef CAS PubMed.
- M. M. Rahman, S. B. Khan, A. M. Asiri, K. A. Alamry, A. A. P. Khan, A. Khan, M. A. Rub and N. Azum, Microchim. Acta, 2013, 180, 675–685 CrossRef CAS PubMed.
- D. Zhang, Z. Yang, Z. Wu and G. Dong, Sens. Actuators, B, 2019, 283, 42–51 CrossRef CAS.
- M. M. Rahman, M. M. Alam and A. M. Asiri, New J. Chem., 2017, 41, 9938–9946 RSC.
- M. M. Rahman, S. B. Khan, A. Jamal, M. Faisal and A. M. Asiri, Chem. Eng. J., 2012, 192, 122–128 CrossRef CAS.
- S. Sun, M. Wang, X. Chang, Y. Jiang, D. Zhang, D. Wang, Y. Zhang and Y. Lei, Sens. Actuators, B, 2020, 304, 127274 CrossRef CAS.
- J. Guo, D. Zhang, T. Li, J. Zhang and L. Yu, J. Colloid Interface Sci., 2022, 606, 261–271 CrossRef CAS PubMed.
- L. Schmidt-Mende and J. L. MacManus-Driscoll, Mater. Today Commun., 2007, 10, 40–48 CrossRef CAS.
- C. Ge, C. Xie, D. Zeng and S. Cai, J. Am. Ceram. Soc., 2007, 90, 3263–3267 CrossRef CAS.
- M. M. Rahman, S. B. Khan, A. M. Asiri, K. A. Alamry, A. A. P. Khan, A. Khan, M. A. Rub and N. Azum, Microchim. Acta, 2013, 180, 675–685 CrossRef CAS PubMed.
- M. M. Rahman, M. Alam, A. M. Asiri and M. Islam, Talanta, 2017, 170, 215–223 CrossRef CAS PubMed.
- B. Du, F. Yan, X. Lin, C. Liang, X. Guo, Y. Tan, H. Zhen, C. Zhao, Y. Shi, E. Kibet and Y. He, Sens. Actuators, B, 2023, 375, 132854 CrossRef CAS.
- M. Yu, T. Zhai, X. Lu, X. Chen, S. Xie, W. Li, C. Liang, W. Zhao, L. Zhang and Y. Tong, J. Power Sources, 2013, 239, 64–71 CrossRef CAS.
- A. Bensghaïer, N. Kaur, N. Fourati, C. Zerrouki, A. Lamouri, M. Beji, A. Mahajan and M. M. Chehimi, Vacuum, 2018, 155, 656–661 CrossRef.
- R. Devi, K. Tapadia and T. Maharana, Heliyon, 2020, 6, e03122 CrossRef PubMed.
- J. Fei, D. Luo, J. Huang, C. Zhang, X. Duan and L. Zhang, Surf. Coat. Technol., 2018, 344, 433–440 CrossRef CAS.
- C. Wu, X. Lou and C. Jia, J. Nanosci. Nanotechnol., 2019, 19, 272–276 CrossRef CAS PubMed.
- J. Liu, J. Liu, W. He, Y. Qu, N. Ren and Y. Feng, J. Power Sources, 2014, 265, 391–396 CrossRef CAS.
- R. Batool, M. A. Akhtar, A. Hayat, D. Han, L. Niu, M. A. Ahmad and M. H. Nawaz, Microchim. Acta, 2019, 186, 1–10 CrossRef CAS PubMed.
- C. Ocaña, A. Hayat, R. K. Mishra, A. Vasilescu, M. Del Valle and J.-L. Marty, Bioelectrochemistry, 2015, 105, 72–77 CrossRef PubMed.
- A. Sharma, G. Istamboulie, A. Hayat, G. Catanante, S. Bhand and J. L. Marty, Sens. Actuators, B, 2017, 245, 507–515 CrossRef CAS.
- K. Y. Goud, G. Catanante, A. Hayat, M. Satyanarayana, K. V. Gobi and J. L. Marty, Sens. Actuators, B, 2016, 235, 466–473 CrossRef.
- M. E. Markiewicz and S. H. Bergens, J. Power Sources, 2008, 185, 222–225 CrossRef CAS.
- A. Bensghaïer, N. Kaur, N. Fourati, C. Zerrouki, A. Lamouri, M. Beji, A. Mahajan and M. M. Chehimi, Vacuum, 2018, 155, 656–661 CrossRef.
- P. Sahay, J. Mater. Sci., 2005, 40, 4383–4385 CrossRef CAS.
- M. M. Rahman, S. B. Khan, A. M. Asiri, K. A. Alamry, A. A. P. Khan, A. Khan, M. A. Rub and N. Azum, Microchim. Acta, 2013, 180, 675–685 CrossRef CAS PubMed.
- A. Shafi, N. Ahmad, S. Sultana, S. Sabir and M. Z. Khan, ACS Omega, 2019, 4, 12905–12918 CrossRef CAS PubMed.
- D. Zhang, Z. Yang, Z. Wu and G. Dong, Sens. Actuators, B, 2019, 283, 42–51 CrossRef CAS.
- C. Liu, L. Zhao, B. Wang, P. Sun, Q. Wang, Y. Gao, X. Liang, T. Zhang and G. Lu, J. Colloid Interface Sci., 2017, 495, 207–215 CrossRef CAS PubMed.
- C. Liu, B. Wang, T. Liu, P. Sun, Y. Gao, F. Liu and G. Lu, Sens. Actuators, B, 2016, 235, 294–301 CrossRef CAS.
- S. K. Sinha, Ceram. Int., 2015, 41, 13676–13684 CrossRef CAS.
- X. Zhou, W. Feng, C. Wang, X. Hu, X. Li, P. Sun, K. Shimanoe, N. Yamazoe and G. Lu, J. Mater. Chem. A, 2014, 2, 17683–17690 RSC.
- Z. Yuan, Z. Feng, L. Kong, J. Zhan and X. J. J. o. A. Ma, J. Alloy Compd., 2021, 865, 158890 CrossRef CAS.
- T. Higashi, T. Ichikawa, S. Inagaki, J. Z. Min, T. Fukushima and T. Toyo'oka, J. Pharm. Biomed. Anal., 2010, 52, 809–818 CrossRef CAS PubMed.
- S. Chiappin, G. Antonelli, R. Gatti and E. F. De Palo, Clin. Chim. Acta, 2007, 383, 30–40 CrossRef CAS PubMed.
Footnote |
| † Electronic supplementary information (ESI) available. See DOI: https://doi.org/10.1039/d3ra01268a |
| This journal is © The Royal Society of Chemistry 2023 |

