 Open Access Article
Catalytic reactions of oxalic acid degradation with Pt/SiO2 as a catalyst in nitric acid solutions
Shuai Hao a,
Bin Li*b,
Zhanyuan Liub,
Wenlong Huanga,
Dongmei Jiangc and
Liangshu Xia*a
aSchool of Nuclear Science and Technology, University of South China, China. E-mail: 2000000476@usc.edu.cn
bChina Institute of Atomic Energy, P. O. Box 275-88, China. E-mail: lxb225@163.com
cInstitute of Innovation and Entrepreneurship, University of South China, China
First published on 26th July 2023
Abstract
Large quantities of solutions containing oxalic acid and nitric acid are produced from nuclear fuel reprocessing, but oxalic acid must be removed before nitric acid and plutonium ions can be recovered in these solutions. The degradation of oxalic acid with Pt/SiO2 as a catalyst in nitric acid solutions has the characteristics of a fast and stable reaction, recyclable catalyst, and no introduction of impurity ions into the system. This method is one of the preferred alternatives to the currently used reaction of KMnO4 with oxalic acid but lacks theoretical support. Therefore, this study attempts to clarify the reaction mechanism of the method. First, there was no induction period for this catalytic reaction, and no evidence was found that the nitrous acid produced in the solution could have an effect on oxalic acid degradation. Furthermore, oxidation intermediates (structures of Pt–O) were formed through this reaction between NO3− adsorbed on the active sites and Pt on the catalyst surface, but H+ greatly promoted the reaction. Additionally, oxalic acid degradation through the oxidative dehydrogenation reaction occurred between oxalic acid molecules (HOOC–COOH) and Pt–O, with ·OOC–COOH, which is easily self-decomposable especially in acidic solution, generated simultaneously, and finally CO2 was produced.
1 Introduction
In nuclear fuel reprocessing plants, oxalic acid is commonly used as a precipitant or complexing agent to separate actinide ions from other elements through the formation of undissolved actinide oxalic acids in aqueous solution.1–7 For example, plutonium is recycled through plutonium oxalic acid precipitation from solution during a uranium–plutonium co-decontamination separation process that dates back to the 1940s.3 However, after the precipitation step, small amounts of plutonium oxalic acid solids remain in the radioactive filtrate, and small amounts of plutonium must be extracted from the filtrate. Untreated filtrates containing an excessive addition of oxalic acid are not favorable for purification and recovery of trace amounts of plutonium. Therefore, oxalic acid must be removed from filtrates as much as possible to reach the limiting oxalic acid concentration (10−4 to 10−5 M).6,7 At present, this method for oxalic acid in filtrates oxidized by KMnO4 is normally used in nuclear fuel reprocessing plants. This method has the advantages of simple operation and short reaction time, but it results in continuous accumulation of K+ and Mn2+ compared to alternative methods,6–9 and it does not comply with the principle of nuclear waste minimization. Therefore, alternative methods to replace this method are needed.Various methods of oxalic acid destruction, such as the addition of oxidizing agents,10,11 electrolytic oxidation12,13 and using a catalyst in nitrate solution,6–8,14–20 have been developed to replace the method for oxalic acid oxidized by KMnO4. H2O2 is the most popular reagent for the addition of oxidizing agents in this approach and has the advantage of not importing additional impurity ions into the reaction system, but its drawback is that oxalic acid degradation to limiting oxalic acid concentration is excessively prolonged due to the low reaction rate. Also, in the electrolysis process, the required equipment is complex and can lead to precipitation of metal ions during lengthy operation times. Oxalic acid degradation using catalysts in nitric acid solutions is a research hotspot, and depends on catalysts being soluble in water, and these are classified into heterogeneous and homogeneous catalysts. In homogeneous catalysis, metal ions, such as vanadium ions14 and manganese ions,6–8 are used as catalysts or combined with ozone and ultraviolet irradiation, with manganese ions being the most mature and widely studied.
Oxalic acid degradation in nitric acid solution using manganese(II) as a catalyst is straightforward, but this method has an induction period and still requires the import of trace amounts of manganese salts in each treatment. In addition, oxalic acid degradation to limiting oxalic acid concentration by this method is lengthy, and the prolonged reaction process at elevated temperatures causes severe erosion damage to the alloy reactor. In heterogeneous catalysis, using supported platinum as a catalyst is common,15–20 and this method shows the characteristics of rapid and stable oxalic acid degradation without an induction period. Moreover, the catalyst is recyclable without introducing impurity ions. As a result, this method is one of the preferred alternatives to the method currently used for oxalic acid oxidation by KMnO4. Pt/SiO2 is commonly used as a catalyst for nitrate degradation in solution,15–21 and the oxalic acid degradation with Pt/SiO2 as a catalyst only is carried out by a simple exploratory process.19,20 The catalytic processes and mechanisms of oxalic acid degradation are still poorly understood. Thus, the present study focused on the effects of H+/NO3− and nitrous acid on oxalic acid degradation, in order to provide insight into the interaction of the catalyst with the reactants. The aim of this work was to provide theoretical and technical support for the design of techniques to optimize the conditions for oxalic acid degradation in the spent fuel processing process.
2 Experimental
2.1 Pretreatment of the catalyst
Pt catalyst supported on SiO2 (particle size, 16–18 mesh; 1% loaded) was obtained from the Dalian Institute of Chemical Physics.22 Pt/SiO2 was pretreated as follows before the test run. First, Pt/SiO2 was immersed in 3 M nitric acid solution for 10 min in a linear shaking bath. In addition, the Pt/SiO2 was immersed in ethanol for 2 h in a linear shaking bath. Finally, the Pt/SiO2 was washed three times with pure water before drying at 90 °C for 24 h.2.2 Experimental procedure for measuring the rate of oxalic acid degradation
A 250 ml three-neck flask equipped with a magnetic stirring rod, thermocouple, and condenser was placed in an oil bath for the experiments to measure the rate of oxalic acid degradation in nitrate solution with Pt/SiO2 as a catalyst. In order to perform the experiment under different conditions, solutions with different concentrations of nitric/sulfuric and oxalic acids were prepared. In addition, the solution was added to a three-neck flask in an oil bath to keep the temperature stable, while the rotational velocity of the stirring head was set at 250 rpm and the temperature was controlled with a thermocouple in all cases. Finally, a certain amount of Pt/SiO2 was added to the solution under agitation after the temperature was kept constant for 3 min. Next, 200 μl samples were taken from the solution at fixed time intervals, and the samples were stored at 2–8 °C before analysis. The oxalic acid concentration was determined by measuring the difference in absorbance of Mn(III) in solution before and after oxalic acid addition,23 and the Griess Reagent System was used to determine the levels of nitrous acid.2.3 Raman spectroscopy
An ATR8300 Raman spectrometer (Xiamen Optosky Photonics INC, China) was used for the Raman spectroscopy experiments, with an automated confocal microscope system, laser power of about 30 mW, laser excitation wavelength of 532 nm, and telephoto lens with a 20× objective for laser focusing on the SERS substrate surface. The spectral resolution was 1.5 cm−1 and the integration time of the spectrum was about 3 s. The peak values of the spectra were averaged over the three integrations after subtracting the dark spectra, and then a baseline calibration was performed.2.4 Electron paramagnetic resonance spectroscopy (EPR)
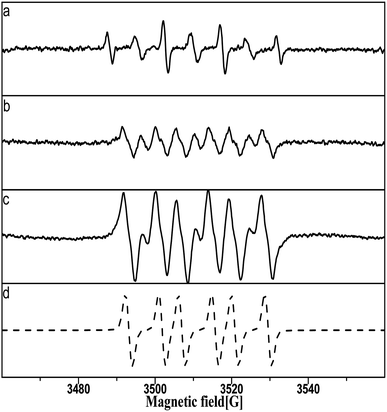
An A300 electron spin resonance spectrometer (Bruker, Germany) was used for the EPR analysis. The spin trap 5,5-dimethyl-1-pyrroline N-oxide (DMPO) is commonly used to identify free radicals and active substances through an adduction reaction to generate DMPO adducts, which are relatively stable and easily detected. In all the EPR experiments, dissolved oxygen in solution was removed after the injection of nitrogen gas (99.99%) for 10 min according to the amounts of reagents required via the preparation chamber in a nitrogen atmosphere at room temperature as follows. First, a single Pt/SiO2 was added to 50 μl of the sample solutions of a given solute concentration before stirring for 120 s. Second, 5 μl DMPO was injected in to each sample solution with stirring for about 90 s for the addition reaction of DMPO with the free radicals and active substances. Third, the sample solutions were transferred directly into a capillary tube (50 μl, Brand Co., Ltd., Germany); moreover the capillary tube was three-quarters filled, and then the top and bottom of the capillary tube was sealed with plasticine. Finally, the capillary tube was inserted into the detection chamber in the EPR spectrometer.The EPR spectrometer was set up as follows: microwave power, 4.4 mW; frequency, 9.84 GHz; central magnetic field, 3505 G; and modulation width, 0.6 G. Computer spectral simulations were performed with the software ‘Bruker WinEPR’ for DMPO–N (N![[double bond, length as m-dash]](https://www.rsc.org/images/entities/char_e001.gif) OH, OOC–COOH) and DMPOX EPR signals.
OH, OOC–COOH) and DMPOX EPR signals.
2.5 X-ray photoelectron spectroscopy (XPS)
An Escalab Xi+ X-ray photoelectron spectrometer (Thermo Fisher Scientific, USA) was used for the X-ray photoelectron spectroscopy (XPS) analysis using an Al X-ray source (hν = 1486.6 eV, total energy resolution E = 1 eV). The XPS experiments were performed in an ultrahigh vacuum (UHV) experimental chamber operating at base pressures of <8 × 10⁻¹⁰ mbar. Computer spectral simulations were performed with software ‘Advantage’ for the Pt 4f (Pt0, Pt(II), Pt(IV)) XPS spectral signals.3 Results and discussion
3.1 Is nitrous acid a primary oxidizing substance involved in the catalytic reactions?
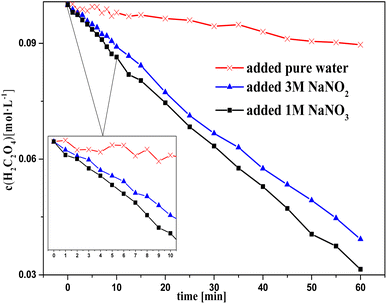
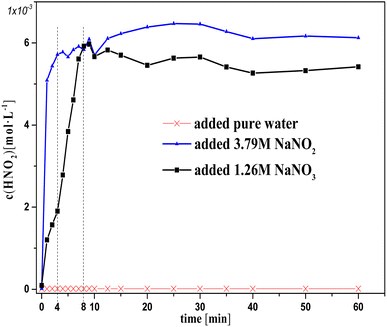
In this section, the effect of different concentrations of nitrous acid on oxalic acid degradation during the catalytic reactions is discussed and shown in Fig. 1–4.In previous studies into formic degradation using supported platinum as a catalyst in nitric acid solutions, some studies have suggested that nitrous acid is an influential reactant during catalytic reactions.15,16 However, Bernard believed that the catalytic reactions between HNO3 molecules and HCO2H prevails at the beginning of formic degradation in nitric acid solutions.17 Miyazaki reported that a large size of Pt/SiO2 (0.6 wt%, 50 nm) does not show any significant catalytic activity for the formation of nitrous acid in solution.18 These studies indicate that nitrous acid shows an unclear contribution to nitrate degradation in its catalytic process. The oxalic acid degradation proceeds in nitric acid, using supported platinum as a catalyst, similar to that of formic acid. Therefore, in order to obtain the reaction process of oxalic acid degradation with Pt/SiO2 as a catalyst in nitric acid solution, the effect of the nitrous acid concentration on oxalic acid degradation should first be clarified. A series of experiments in different acid media were thus designed.
Fig. 1 and 2 show the change in concentration of oxalic acid and nitrous acid in solution over time during oxalic acid degradation using Pt/SO2 as a catalyst with the successive addition of NaNO3/NaNO2 solution into sulfuric acid solution. A decrease in oxalic acid concentration with the addition of NaNO2/NaNO3 solution was evident compared to the control group, and the decrease in oxalic acid concentration with the addition of NaNO2 solution was consistently smaller than that of NaNO3 in Fig. 1. The nitrous acid concentration with the addition of NaNO2 solution was much greater than that of NaNO3 and approached saturation at 4 min, while the nitrous acid concentration with the addition of NaNO3 solution reached saturation at 10 min. The higher nitrous acid concentration did not accelerate oxalic acid degradation in this group with the addition of NaNO2 compared to NaNO3 during the period 4–10 min, indicating that oxalic acid degradation was barely affected by the nitrous acid concentration.
It is important to note in Fig. 1 that the decrease in oxalic acid concentration with the addition of NaNO2 solution was consistently smaller than that of NaNO3. In addition, the concentrations c(H+) and c(NO3−) with the addition of NaNO2 solution were always lower than that of NaNO3, resulting from the H+ consumed by NO2− and some NO2 gas escaping from solution at the same time, as shown in Fig. 1 (2HNO2 → NO + NO2, NO2 + HNO2 → HNO3 + NO). This result suggests NO3−/H+ has a positive contribution to oxalic acid degradation to some extent.
Fig. 3 and 4 show the change in oxalic acid concentration and nitrous acid concentration in solution over time during oxalic acid degradation with Pt/SiO2 as a catalyst in the nitrous acid range in the concentration range from 1 M to 5 M. During the first 5 min of oxalic acid degradation, the rate of oxalic acid degradation at different nitric acid concentrations was a stable based on the good fit, namely as the first-order rate constant between the oxalic acid concentration and time reached above 99%, and then increased with increasing the nitric acid concentration, as shown in Fig. 3. However, during the first t min of oxalic acid degradation in Fig. 4, the nitrous acid concentration at different nitric acid concentrations changed continuously. The saturation value of nitrous acid concentration in Fig. 4 decreased with the nitric acid concentration. These results show the low correlation between the nitrous acid concentration and oxalic acid degradation.
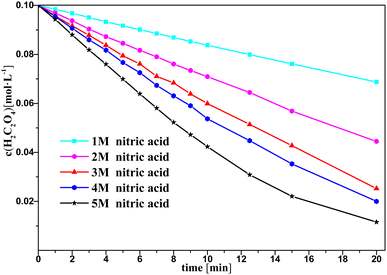 | ||
| Fig. 3 Oxalic acid concentration in solution versus time at varying nitric acid concentrations at T = 90 °C, where c0(HNO3) = 1–5 M, c0(H2C2O4) = 0.1 M, and S/L = 19.5 g L−1. | ||
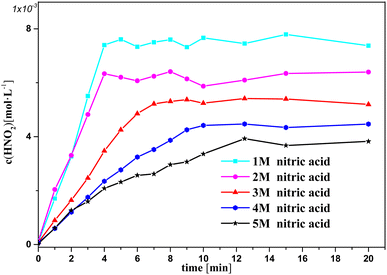 | ||
| Fig. 4 Nitrous acid concentration versus time at varying nitric acid concentrations at T = 90 °C, where c0(HNO3) = 1–5 M, c0(H2C2O4) = 0.1 M, and S/L = 19.5 g L−1. | ||
Together, strong evidence proving that nitrous acid was the primary oxidizing substance involved in oxalic acid degradation was not found from Fig. 1–4. Indeed, the results in Fig. 1–4 indicate that the nitrous acid in solution had almost no effect on oxalic acid degradation compared to NO3− and H+, which could more reasonably be explained by the fact that nitrous acid is considered to be a by-product of the catalytic reactions in this study.
3.2 Reaction kinetics
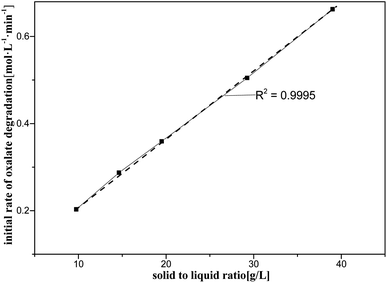
This section briefly describes the effects of varying the concentration of oxalic acid, amount of catalyst and nitric acid on oxalic acid degradation during catalytic reactions, as shown also in Fig. 5–7. The ranges and values of the kinetic parameters in terms of the concentrations of the oxalic acid, catalyst, and nitric acid were obtained. In addition, the initial rate of oxalic acid degradation (k0) was obtained from the mean oxalic acid degradation rate over a period of time when the goodness-of-fit of the mean oxalic acid degradation rate was above 99%.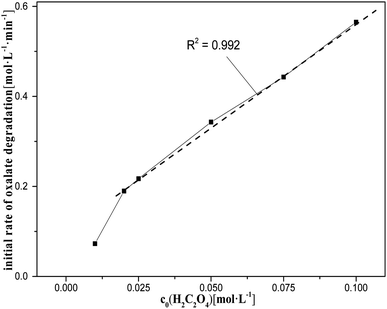 | ||
| Fig. 5 Initial rate of oxalic acid degradation in solution at varying oxalic acid concentrations at T = 90 °C, where c0(HNO3) = 5 M, c0(H2C2O4) = 0.01–0.1 M, S/L = 19.5 g L−1. | ||
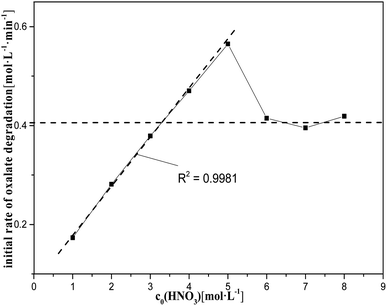 | ||
| Fig. 7 Initial rate of oxalic acid degradation in solution at varying nitric acid concentrations at T = 90 °C, where c0(HNO3) = 1–8 M, c0(H2C2O4) = 0.1 M, and S/L = 19.5 g L−1. | ||
However, the nitric acid range from 5 M to 8 M did not show a clear relationship between c0(HNO3) and k0, and the degradation rate of oxalic acid decreased rapidly with increasing the nitric acid concentration, tending to reach a steady value. This may be due, on the one hand, to the fact that the diffusion of oxalic acid to the catalysts is more and more significantly hindered by the solute as the reaction progresses, which increases with the concentration of nitric acid in the solution, leading to a decrease in the rate of catalytic reactions. On the other hand, the rate of HNO3 molecular oxidation of oxalic acid is significantly accelerated with the increase of nitric acid in the solution. This somewhat slows down the impact of the decrease in the rate of oxalic acid degradation caused by the decrease in the rate of catalytic reactions with increasing the nitric acid concentration.
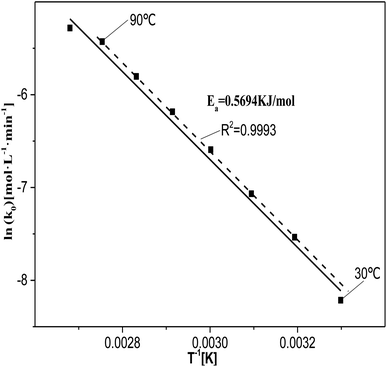 | ||
| Fig. 8 Relationship between ln(k0) and 1/T at T = 30–100 °C, where c0(HNO3) = 5 M, c0(H2C2O4) = 0.1 M, and S/L = 19.5 g L−1. | ||
The value of ln(k0) at 30 °C deviated from the fitted curve, probably due to the low temperature of the reaction system, which did not provide sufficient activation energy for the catalytic reactions. The value of ln(k0) at 100 °C also deviated from the fitting curve. This may be due to the fact at 100 °C the rate at which the reactants diffuse from the solution to the catalyst surface was lower than the rate of reaction between the reactants and active sites or active species. This indicates that the degradation of oxalic acid occurs at or near the catalyst surface.
Further, some evidence for the involvement of NO3−/H+ in the catalytic reactions could be found in Fig. 1 and 7. As a result, the effects of NO3− and H+ on oxalic acid degradation were investigated separately and are described in the next section.
3.3 Influence of NO3−/H+ on oxalic acid degradation
Based on the experimental results shown in Fig. 9, a hypothesis for the involvement of NO3− and H+ in the catalytic reactions is proposed, which is supported by the results for the H+ effect on k0 in Fig. 10 and 11. The oxalic acid degradation associated with the oxalic acid form in solution is shown in Fig. 11.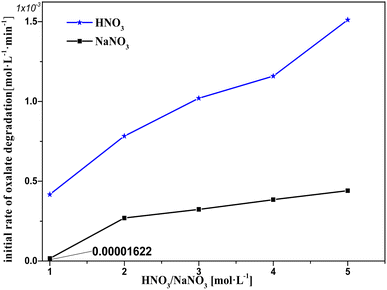 | ||
| Fig. 9 Initial rate of oxalic acid degradation in solution at varying HNO3/NaNO3 concentrations at T = 90 °C, where c0(HNO3/NaNO3) = 1–5 M, c0(H2C2O4) = 0.1 M, and S/L = 19.5 g L−1. | ||
At c(NaNO3) = 1 M, oxalic acid degradation hardly occurred. This may be because the NO3− in the solution barely diffuses on the catalyst surface, resulting from the fact that each NO3− is firmly bound by hydrogen bonding in a cage made of water molecules and that the amount of NO3− is well below the amount of water molecules.24,25 In the c(NaNO3) range 1–2 M, oxalic acid degradation increased with the increasing c(NaNO3), resulting from the fact that the amount of NO3− that can diffuse out to the catalyst surface unbound by water molecules rapidly increases with increasing c(NaNO3). In the c(NaNO3) range 2–5 M, the amount of adsorbed sites on the catalyst surface was much smaller than the nearby NO3−, resulting in a substantial buffer against oxalic acid degradation compared to the c(NaNO3) range 1–2 M. Moreover, the fact that H+ obviously promotes oxalic acid degradation could be found by comparing the k0 of each sodium nitrate solution experiment with the corresponding nitric acid solution. From the above discussion, we conclude the following hypothesis:
NO3− is readily adsorbed on the catalyst surface and the probability of direct NO3− activation by Pt is relatively low, but H+ has an effective boost effect on the NO3− activation reaction.
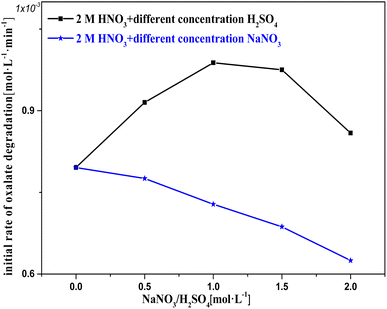
Fig. 10 shows k0 in solution with Pt/SiO2 as a catalyst based on 2 M nitric acid solution with varying concentrations of H2SO4/NaNO3 added to adjust c(H+)/c(NO3−). In the c(H2SO4) range 0–1 M, the oxalic acid degradation effectively increased with c(H+), suggesting that an appropriate amount of H+ promotes catalytic reactions to occur. This result agrees with the hypothesis. In the c(H2SO4) range 1–2 M, the oxalic acid degradation slowly decreased with c(H+), suggesting that excess H+ promotes catalytic reactions to occur. The negative effect of excess H+ may result from excess SO42−/HSO4− in the solution competing with the reactant for sites on the catalyst surface,26,27 and by increasing c(H2SO4), the promoting effect of H+ hardly increased substantially.
In the c(NaNO3) range 0–2 M, oxalic acid degradation decreased with increasing c(NO3−). This result indicates that excess NO3− makes a clearly negative contribution to the catalytic reactions, while the same result was obtained by an alternative experiment with potassium nitrate used in order to exclude Na+ interference. The effect of excess NO3− on oxalic acid degradation was similar to that of excess sulfuric acid, but the reduction in oxalic acid degradation due to excess NO3− exceeded the effect of excess sulfuric acid at the same concentration. This phenomenon may be due to the fact that HSO4− can be given H+ to activate NO3− adsorbed on the active sites during the diffusion–collision process between HSO4− and the catalytic surface, but NO3− cannot.
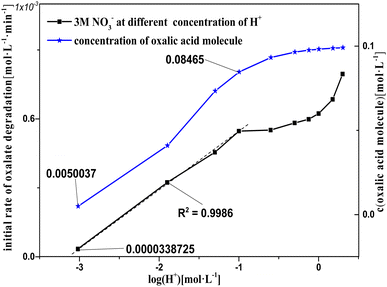
Fig. 11 shows k0 in solution with Pt/SiO2 as a catalyst based on 2 M nitric acid solution with varying concentrations of sodium hydroxide added to adjust c(H+). In the log(H+) range −7 to −3, oxalic acid was a little degraded, as observed based on the absence of gas from the reaction solution, indicating that the catalytic reactions did not occur in this log(H+) range. There was a clear linear relationship between k0 and log(H+) in the log(H+) range −3 to −1, and the pattern of k0 and log(H+) in the range from −1 to 0.3013 was similar to a partial parabola. Clearly, the patterns of k0 and log(H+) were different in the log(H+) range −3 to −1 and −1 to 0.3013, suggesting that oxalic acid degradation in these two components was affected by different factors. The pattern of k0 in the log(H+) range −3 to −1 was attributed to the promotion of H+ to the NO3− activation reaction, and that in the range −1 to 0.3013 was attributed to another reaction rather than the NO3− activation reaction. Furthermore, the patterns of k0 and log(H+) were similar with the concentration of oxalic acid molecules and log(H+) in the range from −1 to 0.3013, and the ionization degree of the oxalic acid carboxyl group (–COOH) was controlled by the c(H+) in solution. This result reveals that the –COOH of oxalic acid molecules were correlated with oxalic acid degradation, and that the ionized oxalic acid was hardly degraded in the catalytic reactions.
In general, there are two ways in which organic acids are degraded via the destruction of the –COOH in catalytic reactions. The first is that the Pt–H structure arises from the reaction between the carboxyl group and the nano-platinum, and the electron of the activated H atoms are transferred to oxidation intermediates via the potential difference at the catalyst surface, with H+ produced simultaneously.28–30 The second is that the oxidation intermediates are reduced by the H atoms of the carboxyl group via the oxidative dehydrogenation reaction.30–32 However, for both pathways, the oxidation intermediates must be present on the catalyst surface, and the nano-platinum of the active ingredient of the catalyst readily oxidizes to the Pt–O structure.33–37
3.4 Pt–O produced from the reaction between NO3− and nano-platinum
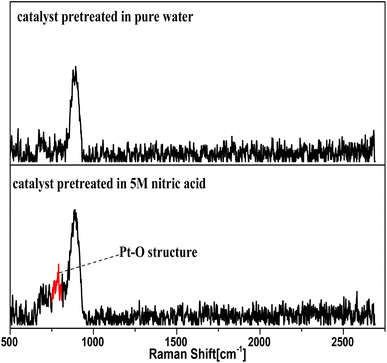
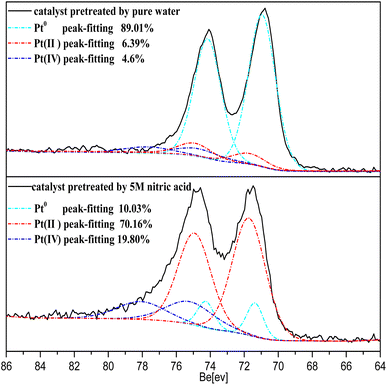
This section briefly described how the Pt–O structure was found as the oxidation intermediates from the NO3− activation reaction, which supports and enriches the hypothesis from the plots in Fig. 12–14.In the Raman and XPS experiments, the selected catalyst grains were evenly divided into two parts. One part was immersed in pure water, and the other in a solution of 5 M nitric acid for 2 h, washed three times in pure water, and finally dried in a nitrogenous atmosphere for 24 h, and separately ground to a powder for oxygen-free preservation.
The Raman spectra for the catalyst treated with 5 M nitric acid showed a different absorption peak at 805 nm compared to the control sample in Fig. 12, and the 805 nm peak was attributed to the structure of Pt–O,38,39 which revealed that the oxidation intermediates were Pt–O derived from the reaction between NO3− and the nano-platinum.
The Pt 4f XPS spectrum obtained from the catalyst treated with 5 M nitric acid is shown in Fig. 13. The spectrum exhibited a dominant doublet at the binding energy (BE) of 74.9 eV corresponding to Pt(IV), a doublet at 72.4 corresponding to Pt(II), and a doublet at 71.2 corresponding to Pt0.40 The concentration ratios of Pt0/Pt(II)/Pt(IV) were 0.89![[thin space (1/6-em)]](https://www.rsc.org/images/entities/char_2009.gif) :
:![[thin space (1/6-em)]](https://www.rsc.org/images/entities/char_2009.gif) 0.064
0.064![[thin space (1/6-em)]](https://www.rsc.org/images/entities/char_2009.gif) :
:![[thin space (1/6-em)]](https://www.rsc.org/images/entities/char_2009.gif) 0.046 for the catalyst treated with pure water, and 0.1
0.046 for the catalyst treated with pure water, and 0.1![[thin space (1/6-em)]](https://www.rsc.org/images/entities/char_2009.gif) :
:![[thin space (1/6-em)]](https://www.rsc.org/images/entities/char_2009.gif) 0.702
0.702![[thin space (1/6-em)]](https://www.rsc.org/images/entities/char_2009.gif) :
:![[thin space (1/6-em)]](https://www.rsc.org/images/entities/char_2009.gif) 0.198 for the catalyst treated with 5 M nitric acid, as determined from the region of the Pt0, Pt(II), Pt(IV) fits obtained by decomposing the Pt 4f spectrum in Fig. 13. It was found that most of the Pt0 on the surface of the catalyst was oxidized in the form of Pt(II)/Pt(IV) through treatment with 5 M nitric acid, and the Pt(II) and Pt(IV) on the catalyst surface were commonly PtO and PtO2.40,41 These results revealed the production of Pt–O from the reaction between NO3− and the nano-platinum.
0.198 for the catalyst treated with 5 M nitric acid, as determined from the region of the Pt0, Pt(II), Pt(IV) fits obtained by decomposing the Pt 4f spectrum in Fig. 13. It was found that most of the Pt0 on the surface of the catalyst was oxidized in the form of Pt(II)/Pt(IV) through treatment with 5 M nitric acid, and the Pt(II) and Pt(IV) on the catalyst surface were commonly PtO and PtO2.40,41 These results revealed the production of Pt–O from the reaction between NO3− and the nano-platinum.
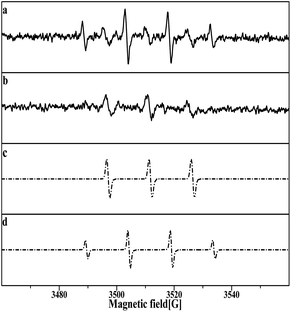
In the EPR experiments, the selected catalyst grains were immersed in a solution of 5 M nitric acid for 2 h, washed three times in pure water, and finally dried in a nitrogenous atmosphere for 24 h for oxygen-free preservation. Prior to EPR detection, two single pretreated Pt/SiO2 samples were placed in aqueous and methanol solutions, respectively, before DMPO was added to the solution for the trapping reaction.
The DMPO–OH and DMPOX signals were obtained in the aqueous solution condition in Fig. 14a. These results suggest that some oxidation intermediates were present on the surface of the catalyst pretreated with nitric acid, and that the structure of Pt–O was most plausible as the oxidation intermediates, considering that no trace of peroxide radicals or other reactive species were found at the same time. DMPOX generally is derived from the oxidation of DMPO–OH adducts in aqueous solution,42,43 but unexpectedly a DMPOX signal was evident in the presence of sufficient DMPO relative to the oxidation intermediates, and only the DMPOX signal was obtained in the methanol solution condition shown in Fig. 14b. This result suggests that the source of the DMPOX signal was not only that produced from the oxidation of DMPO–OH, but also from reactions between DMPO and the oxidation intermediates. Therefore, the formation processes of DMPOX could be determined and are shown in Fig. 15a and b, and the DMPO–OH adducts in Fig. 15c.
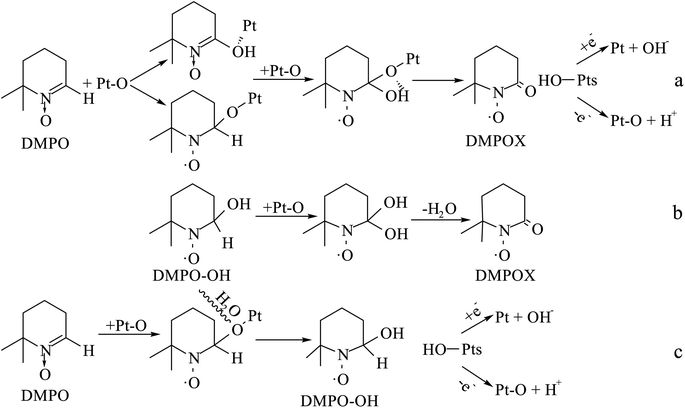 | ||
| Fig. 15 Formation processes of DMPOX and DMPO–OH adducts for reactions between DMPO and Pt–O in aqueous or methanol solution. | ||
3.5 Reaction between the structure of Pt–O and oxalic acid molecules
The bond cleavage of oxalic acid molecules by Pt–O oxidation is discussed in Fig. 16.Only the signals of DMPO–OH and DMPOX were obtained in aqueous solution with nitric acid and oxalic acid in Fig. 16a, but the signal generated by oxalic acid was not obtained. It is interesting to note the information on the bond cleavage of oxalic acid found in Fig. 16a, which shows the pretreated catalysts with 5 M nitric acid added to different solvents containing oxalic acid. In Fig. 16b and c, a clear signal can be seen related to the adduct of DMPO with the alkoxy radical, which in the experimental conditions should be ·OOC–COOH produced by the reaction of the oxalic acid molecule with Pt–O. This result indicates that the oxalic acid molecule was oxidized by Pt–O via an oxidative dehydrogenation reaction. It is worth noting that, in addition, the DMPO–OOC–COOH signal in Fig. 16c was much stronger than in Fig. 16b, and the ·OOC–COOH was not captured in Fig. 16a in the nitric acid solutions. This result reveals that ·OOC–COOH was unstable in aqueous solution and rapidly self-decomposed, particularly in the nitric acid solutions.
3.6 Catalyst durability
In the durability test, unpretreated Pt/SiO2 was subjected to 20 cycles. The Pt leaching rate (Fig. 17) and k0 (Table 1) of these 20 cycles were obtained.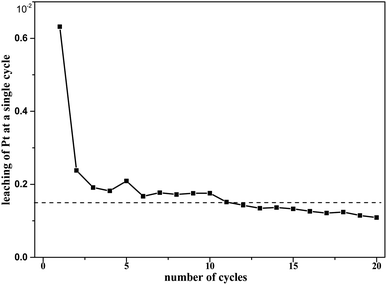 | ||
| Fig. 17 Pt leaching of 20 cycles at T = 90 °C, where c0(HNO3) = 3 M, c0(H2C2O4) = 0.1 M, and S/L = 19.5g L−1. | ||
| Number of cycles | N = 1 | N = 2 | N = 3 | N = 4 | N = 5 |
|---|---|---|---|---|---|
| k0 [mol L−1 min−1] | 0.00423 | 0.00403 | 0.00398 | 0.00390 | 0.00413 |
| Number of cycles | N = 6 | N = 7 | N = 8 | N = 9 | N = 10 |
| k0 [mol L−1 min−1] | 0.00397 | 0.00397 | 0.00406 | 0.00402 | 0.00398 |
| Number of cycles | N = 11 | N = 12 | N = 13 | N = 14 | N = 15 |
| k0 [mol L−1 min−1] | 0.00397 | 0.00400 | 0.00396 | 0.0390 | 0.00397 |
| Number of cycles | N = 16 | N = 17 | N = 18 | N = 19 | N = 20 |
| k0 [mol L−1 min−1] | 0.00395 | 0.00392 | 0.00395 | 0.00391 | 0.00388 |
A single test was conducted with 4.88 g of catalyst added to a reaction mixture for reaction for 1 h, and then after obtaining 10 ml of sample solution from the reaction mixture, a new reaction mixture was added. The concentration of Pt in the sample solution was measured by ICP-OES (Avio 220 Max system).
The Pt leaching rate during the first catalytic run was 0.632% for Pt/SiO2, and it also appeared that the Pt leaching fluctuated around 0.15% from the 2nd to 20th runs, as shown in Fig. 17. Such Pt erosion may be mainly related to a fraction of Pt particles being weakly bonded to the SiO2 surface of freshly prepared catalysts during the first run. Therefore, pretreatment of catalysts is necessary before the catalysts are formally used for the first time. From the 2nd to the 20th cycle, the cumulative Pt leaching rate was approximately 2.98%. At the same time, the catalytic efficiency of Pt/SiO2 did not decrease significantly over the total of 20 runs. This does not appear to be sufficient to justify the dramatic loss of activity of the catalyst during the runs. These results indicate the good durability of the catalyst in oxalic acid degradation with Pt/SiO2 as a catalyst in the nitric acid solutions.
4 Reaction mechanism
Based on the above experimental results, the process of oxalic acid degradation in nitric acid solutions with Pt/SiO2 as a catalyst occurred on the same catalyst surface as the following table of contents entry.5 Conclusions
The reaction process of oxalic acid degradation in nitric acid solutions with Pt/SiO2 as a catalyst was investigated and described. Strictly speaking, it is difficult to find evidence of oxalic acid degradation from catalytic reactions involving nitrous acid, given that nitrous acid concentrations in nitric acid solutions are generally 102–3 times smaller than NO3−. The oxidation intermediates that can be produced by the reaction between nitrous acid and nano-platinum are still uncertain, but nitrous acid did not affect the experimental results in this work. The specific process of Pt–O formation from the reaction between NO3− and the nano-platinum requires further investigation. No evident self-decomposition of oxalic acid adsorbed on a catalyst was found. Catalytic reactions should be considered to have no induction period, and if an induction period exists, its duration should not exceed the mixing time of the reagent. The feasibility of applying this method to industrial production needs to be investigated. In industrial production, it is necessary to take into account that certain substances poison the catalyst, and that this substance is continuously produced from the irradiated decomposition of an extractive agent containing phosphorus in solution.Conflicts of interest
There are no conflicts to declare.Acknowledgements
This work was supported by the National Natural Science Foundation of China (22176083), the Provincial Natural Science Foundation of Hunan (2021JJ30566), the Postgraduate Scientific Research Foundation of Hunan (203YXC002).References
- A. Verma, R. Kore, D. R. Corbin and M. B. Shiflett, Metal recovery using oxalic acid chemistry: a technical review, Ind. Eng. Chem. Res., 2019, 58(34), 15381–15393 CrossRef CAS.
- D. W. DePaoli, D. Benker, L. H. Delmau, S. R. Sherman, E. D. Collins and R. M. Wham, Status summary of chemical processing development in plutonium-238 supply program, Oak Ridge National Lab. (ORNL), Oak Ridge, TN (United States), 2017 Search PubMed.
- R. Orr, H. Sims and R. Taylor, A review of plutonium oxalic acid decomposition reactions and effects of decomposition temperature on the surface area of the plutonium dioxide product, J. Nucl. Mater., 2015, 465, 756–773 CrossRef CAS.
- F. Abraham, B. Arab-Chapelet, M. Rivenet, C. Tamain and S. Grandjean, Actinide oxalic acids, solid state structures and applications, Coord. Chem. Rev., 2014, 266, 28–68 CrossRef.
- P. Paviet-Hartmann, B. Benedict and M. J. Lineberry, Nuclear Fuel Reprocessing, in Nuclear Engineering Handbook, CRC Press, 2009, pp. 333–384 Search PubMed.
- C. Nash, Literature review for oxalic acid oxidation processes and plutonium oxalic acid solubility, 2012 Search PubMed.
- E. Ketusky, Remediation of spent oxalic acid nuclear decontamination solutions using ozone, PhD thesis, Lancaster University, United Kingdom, 2018.
- M. Kubota, Decomposition of oxalic acid with nitric acid, J. Radioanal. Chem., 1982, 75, 39–49 CrossRef CAS.
- C. Mason, T. Brown, D. Buchanan, C. Maher, D. Morris and R. Taylor, The decomposition of oxalic acid in nitric acid, J. Solution Chem., 2016, 45(3), 325–333 CrossRef CAS.
- E.-H. Kim, D.-Y. Chung, J.-H. Park and J.-H. Yoo, Dissolution of oxalic acid precipitate and destruction of oxalic acid ion by hydrogen peroxide in nitric acid solutions, J. Nucl. Sci. Technol., 2000, 37(7), 601–607 CrossRef CAS.
- J. Mailen, O. Tallent and P. Arwood, Destruction of oxalic acid by reaction with hydrogen peroxide, Oak Ridge National Lab, 1981 Search PubMed.
- P. Zelenin, V. Milyutin, V. Bakhir and D. Adamovich, Electrochemical Oxidation of Oxalic acid Ions in Aqueous Solution, Radiochemistry, 2021, 63, 439–445 CrossRef CAS.
- S. Ganesh, N. Desigan, A. Chinnusamy and N. Pandey, Electrolytic and ozone aided destruction of oxalic acid ions in plutonium oxalic acid supernatant of the PUREX process: a comparative study, J. Radioanal. Nucl. Chem., 2021, 328, 857–867 CrossRef CAS.
- V. I. Bruyère, L. A. G. Rodenas, P. J. Morando and M. A. Blesa, Reduction of vanadium (V) by oxalic acid in aqueous acid solutions, J. Chem. Soc., 2001, 24, 3593–3597 Search PubMed.
- A. Ananiev, J.-C. Broudic, P. Brossard and N. Krot, Heterogeneous catalytic denitration of nitric acid solutions, Radiochim. Acta, 1997, 78(s1), 145–152 CrossRef CAS.
- S. Guenais-Langlois, C. Bouyer, J.-C. Broudic, A. Ananiev and B. Coq, Catalytically-mediated generation of HNO2 in highly HNO3 concentrated media, in Stud. Surf. Sci. Catal., Elsevier, 2000, vol. 130, pp. 2231–2236 Search PubMed.
- B. Coq, S. Guenais, C. Bouyer and J.-C. Broudic, Catalytic denitration by HCOOH of HNO3 concentrated media in the presence of Pt/SiO2 catalysts: mechanism and influence of Pt particle size, Appl. Catal., B, 2003, 45(3), 205–211 CrossRef CAS.
- A. Miyazaki, K. Shibazaki, Y. Nakano, M. Ogawa and I. Balint, Efficient catalytic reduction of concentrated nitric acid on the adsorption sites of activated carbon, Chem. Lett., 2004, 33(4), 418–419 CrossRef CAS.
- N. Krot, V. Shilov, V. Dzyubenko, V. Matyukha, V. Starodumov and N. Malkova, Oxalic acid decomposition in the presence of hydrazine in nitric acid solutions in solid-phase catalysts, Radiokhimiya, 1995, 37(1), 23–27 CAS.
- M. Tyumentsev, A. Anan'ev, A. Shiryaev, T. Puryaeva, Y. V. Zubavichus and B. Ershov, Synergistic effect in heterogeneously catalyzed reduction of U (VI) and Np (V) and decomposition of hydrazine and oxalic acid with bimetallic Pt-Ru catalysts, Dokl. Phys. Chem., 2013, 142–145 CrossRef CAS.
- K. Shafqat, S. Pitkäaho, M. Tiainen, L. Matějová and R. L. Keiski, Effect of nanoparticle size in Pt/SiO2 catalyzed nitrate reduction in liquid phase, Nanomaterials, 2021, 11(1), 195 CrossRef CAS PubMed.
- B. L. Liang, X. Q. Zhao, B. Li, H. He, H. Shi, B. L. Hou, Q. Y. Zhang, X. Zhang, G. A. Ye and T. Zhang, CN Pat., CN114308021A, 2020.
- S. Hao, X. J. Li, D. M. Jiang and L. S. Xia, Rapid Determination of the Oxalic Acid Oxidized by Mn (III) through Spectrophotometry, Chin. J. Nucl. Sci. Eng., 2022, 42, 671–677 Search PubMed.
- Y. Kameda, H. Saitoh and O. Uemura, The Hydration Structure of NO3− in Concentrated Aqueous Sodium Nitrate Solutions, Bull. Chem. Soc. Jpn., 1993, 66(7), 1919–1923 CrossRef CAS.
- J. C. Fanning, The chemical reduction of nitrate in aqueous solution, Coord. Chem. Rev., 2000, 199(1), 159–179 CrossRef CAS.
- I. Sanchis, E. Díaz, A. Pizarro, J. Rodríguez and A. Mohedano, Effect of water composition on catalytic reduction of nitrate, Sep. Purif. Technol., 2021, 255, 117766 CrossRef CAS.
- C.-P. Huang, H.-W. Wang and P.-C. Chiu, Nitrate reduction by metallic iron, Water Res., 1998, 32(8), 2257–2264 CrossRef CAS.
- Y. Liu, Q. Wang, J. Zhang, J. Ding, Y. Cheng, T. Wang, J. Li, F. Hu, H. B. Yang and B. Liu, Recent Advances in Carbon-Supported Noble-Metal Electrocatalysts for Hydrogen Evolution Reaction: Syntheses, Structures, and Properties, Adv. Energy Mater., 2022, 12(28), 2200928 CrossRef CAS.
- N. Yodsin, C. Rungnim, S. Tungkamani, V. Promarak, S. Namuangruk and S. Jungsuttiwong, DFT study of catalytic CO2 hydrogenation over Pt-decorated carbon nanocones: H2 dissociation combined with the spillover mechanism, J. Phys. Chem. C, 2019, 124(3), 1941–1949 CrossRef.
- A. Wang, J. Li and T. Zhang, Heterogeneous single-atom catalysis, Nat. Rev. Chem., 2018, 2(6), 65–81 CrossRef CAS.
- Z. Fang and W. Chen, Recent advances in formic acid electro-oxidation: from the fundamental mechanism to electrocatalysts, Nanoscale Adv., 2021, 3(1), 94–105 RSC.
- T. Mallat and A. Baiker, Oxidation of alcohols with molecular oxygen on platinum metal catalysts in aqueous solution, Catal. Today, 1994, 19(2), 247–283 CrossRef CAS.
- F.-Y. Yu, Z.-L. Lang, L.-Y. Yin, K. Feng, Y.-J. Xia, H.-Q. Tan, H.-T. Zhu, J. Zhong, Z.-H. Kang and Y.-G. Li, Pt-O bond as an active site superior to Pt0 in hydrogen evolution reaction, Nat. Commun., 2020, 11(1), 490 CrossRef PubMed.
- H. Wang, J.-X. Liu, L. F. Allard, S. Lee, J. Liu, H. Li, J. Wang, J. Wang, S. H. Oh and W. Li, Surpassing the single-atom catalytic activity limit through paired Pt-O-Pt ensemble built from isolated Pt1 atoms, Nat. Commun., 2019, 10(1), 3808 CrossRef PubMed.
- S. Gatla, D. Aubert, G. Agostini, O. Mathon, S. Pascarelli, T. Lunkenbein, M. G. Willinger and H. Kaper, Room-temperature CO oxidation catalyst: low-temperature metal–support interaction between platinum nanoparticles and nanosized ceria, ACS Catal., 2016, 6(9), 6151–6155 CrossRef CAS.
- T. Wang, X. Cao and L. Jiao, PEM water electrolysis for hydrogen production: fundamentals, advances, and prospects, Carbon Neutrality, 2022, 1(1), 21 CrossRef.
- H. Yan, M. Zhao, X. Feng, S. Zhao, X. Zhou, S. Li, M. Zha, F. Meng, X. Chen and Y. Liu, PO43- Coordinated Robust Single-Atom Platinum Catalyst for Selective Polyol Oxidation, Angew. Chem., 2022, 134(21), e202116059 CrossRef.
- J.-C. Dong, M. Su, V. Briega-Martos, L. Li, J.-B. Le, P. Radjenovic, X.-S. Zhou, J. M. Feliu, Z.-Q. Tian and J.-F. Li, Direct in situ Raman spectroscopic evidence of oxygen reduction reaction intermediates at high-index Pt (hkl) surfaces, J. Am. Chem. Soc., 2019, 142(2), 715–719 CrossRef PubMed.
- O. S. N. Sum, E. Djurado, T. Pagnier, N. Rosman, C. Roux and E. Siebert, Raman investigation of the O2, Pt/YSZ electrode under polarization, Solid State Ionics, 2005, 176(35–36), 2599–2607 CAS.
- L. K. Ono, B. Yuan, H. Heinrich and B. R. Cuenya, Formation and thermal stability of platinum oxides on size-selected platinum nanoparticles: support effects, J. Phys. Chem. C, 2010, 114(50), 22119–22133 CrossRef CAS.
- S. Ding, H.-A. Chen, O. Mekasuwandumrong, M. J. Hülsey, X. Fu, Q. He, J. Panpranot, C.-M. Yang and N. Yan, High-temperature flame spray pyrolysis induced stabilization of Pt single-atom catalysts, Appl. Catal., B, 2021, 281, 119471 CrossRef CAS.
- L. Wang, X. Lan, W. Peng and Z. Wang, Uncertainty and misinterpretation over identification, quantification and transformation of reactive species generated in catalytic oxidation processes: a review, J. Hazard. Mater., 2021, 408, 124436 CrossRef CAS PubMed.
- E. Finkelstein, G. M. Rosen and E. J. Rauckman, Spin trapping of superoxide and hydroxyl radical: practical aspects, Arch. Biochem. Biophys., 1980, 200(1), 1–16 CrossRef CAS PubMed.
| This journal is © The Royal Society of Chemistry 2023 |

