 Open Access Article
A DFT study on effective detection of ClCN gas by functionalized, decorated, and doped nanocone strategies
Anjan Kumar a,
M. I. Sayyedbc,
Michael M. Sabugaad,
Mohammed Al-Bahranie,
Shilpa Sharma
 f and
Mohamed J. Saadh
 *gh
*gh
aNanotechnology Laboratory, GLA University, Mathura-281406, India
bDepartment of Physics, Faculty of Science, Isra University, Amman 11622, Jordan
cDepartment of Nuclear Medicine Research, Institute for Research and Medical Consultations (IRMC), Imam Abdulrahman bin Faisal University (IAU), PO Box 1982, Dammam, 31441, Saudi Arabia
dDepartment of Electronics Engineering, Agusan del Sur State College of Agriculture and Technology, Philippines
eChemical Engineering and Petroleum Industries Department, Al-Mustaqbal University College, Babylon, 51001, Iraq
fDepartment: Chemistry, Bhilai Institute of Technology Raipur, India
gFaculty of Pharmacy, Middle East University, Amman, Jordan. E-mail: mjsaadh@yahoo.com
hApplied Science Research Center, Applied Science Private University, Amman, Jordan
First published on 24th April 2023
Abstract
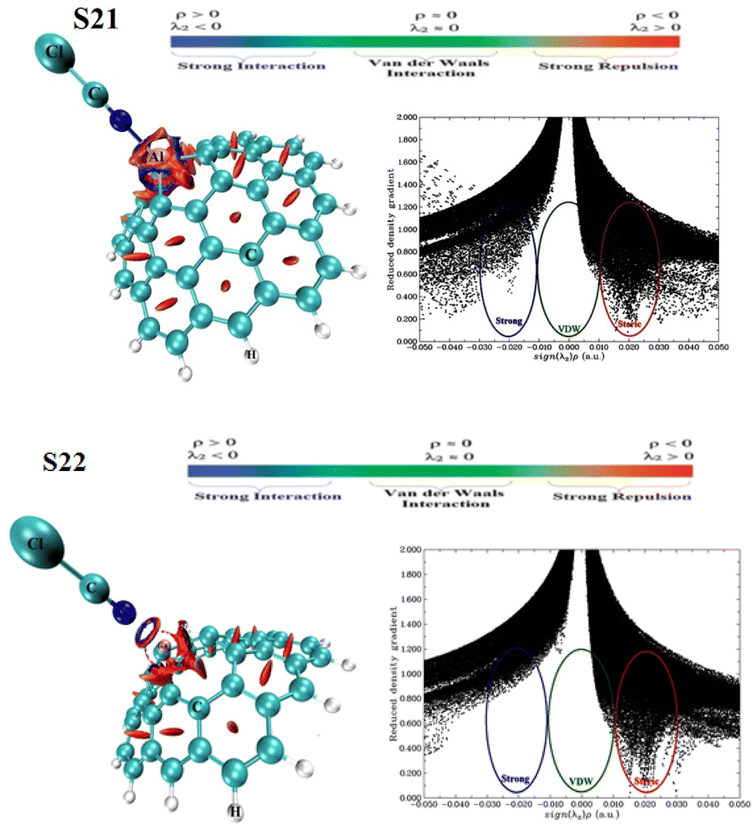
Density Functional Theory (DFT) was employed to investigate the interaction between cyanogen chloride (ClCN) and the surface of a carbon nanocone (CNC). The findings of this research revealed that pristine CNC is not an ideal material to detect ClCN gas due to its minimal alterations in electronic properties. In order to enhance the properties of carbon nanocones, multiple methods were implemented. These included functionalizing the nanocones with pyridinol (Pyr) and pyridinol oxide (PyrO) as well as decorating them with metals such as boron (B), aluminium (Al) and gallium (Ga). Additionally, the nanocones were also doped with the same third-group metal (B, Al and Ga). The simulation results indicated that doping it with aluminium and gallium atoms yielded promising results. After a comprehensive optimization process, two stable configurations were obtained between the ClCN gas and the CNC–Al, and CNC–Ga structures (configurations S21, and S22) with Eads values of −29.11, and −23.70 kcal mol−1 respectively, using M06-2X/6-311G(d) level. The adsorption of ClCN on CNC–Al and CNC–Ga surfaces leads to a marked alteration in the electrical properties of these structures. Calculations reveal that the energy gap between the Highest Occupied Molecular Orbital (HOMO) and Lowest Unoccupied Molecular Orbital (LUMO) levels (Eg) of these configurations increased in the range of 9.03% and 12.54%, respectively, thereby giving off a chemical signal. An analysis conducted by the NCI confirms that there is a strong interaction between ClCN and Al and Ga atoms in CNC–Al and CNC–Ga structures, which is represented by the red color in the RDG isosurfaces. Additionally, the NBO charge analysis reveals that significant charge transfer is present in S21 and S22 configurations (190 and 191 |me|, respectively). These findings suggest that the adsorption of ClCN on these surfaces impacts the electron–hole interaction, which subsequently alters the electrical properties of the structures. Based on the DFT results, the CNC–Al and CNC–Ga structures, which have been doped with aluminium and gallium atoms, respectively, have the potential to serve as good candidates for detecting ClCN gas. Among these two structures, the CNC–Ga structure emerged as the most desirable one for this purpose.
1. Introduction
Researchers have carried out many studies into carbon nanotubes (CNTs) since their discovery,1 owing to their unique attributes and widespread application.2,3 CNTs have been demonstrated to be a highly versatile material with a broad range of applications in fields as disparate as electronics, aerospace, transportation, fuel cells, hydrogen storage, textiles, sensors, and many more.4–7 Recently, there has been an increased focus on research surrounding carbon nanocones (CNCs) due to their unique electrical and mechanical properties, in addition to those of carbon nanotubes (CNTs).8 Carbon nanocones are hollow, cone-shaped nanostructures made of graphitic carbon. They differ from other carbon nanomaterials, such as carbon nanotubes and graphene, in that they have an open structure with a wide range of potential applications. They have a higher surface area and porosity than other carbon nanomaterials, making them useful for a variety of applications such as drug delivery, biosensing, and energy storage. They also have high mechanical strength and are highly conductive, making them suitable for use in electronic components. Different methods of constructing CNCs from graphene (Gr) networks can lead to various geometrical defects at the tips. One can cut between one to five segments of a graphene sheet and join the edges together using the cut and glue method to construct open-ended carbon nanocones, which have one to five pentagons at the apex.9,10 CNCs have various applications owing to their topology.11,12 Owing to their capability of emitting currents at low electric fields, carbon-based electron field emitters exhibit superior electron field emission attributes.13 Likewise, due to their diminutive size and high rigidity, CNCs can be regarded as promising electron field emitters and scanning probe tips.14 Carbon nanocones have numerous practical applications in a variety of fields. In electronics, they are used as a catalyst for the growth of nanowires and nanotubes, as well as to improve the performance of transistors and other components. In the medical field, they are used to deliver drugs and target specific cells and tissues. They can also be used in energy storage applications, such as batteries and fuel cells, due to their high surface area and excellent storage capacity. Additionally, carbon nanocones can be used to create supercapacitors, which are capable of storing and releasing large amounts of energy in a short period of time. They can also be used to create lightweight, strong, and durable materials, such as aerogels, which can then be used in the aerospace industry.Cyanogen chloride (ClCN) is an extremely poisonous chemical compound classified as cyanide which is used as an agent for chemical warfare. It appears as a colourless gas or liquid and has a highly pungent and acrid odour, which causes intense irritation to the eyes and respiratory tract, as well as other systemic effects. If exposed, it can occur through eye contact, skin contact, ingestion, or inhalation. Additionally, ClCN is considered a powerful lachrymator, which is a chemical that causes tearing in the eyes and has been employed as tear gas.15 Unfortunately, ClCN has the ability to pass through and penetrate filters, which can be a significant problem.16 Therefore, sensors with a high level of dependability, sensitivity, and fast, straightforward response are in high demand in order to adequately address this issue.
Due to their high surface-to-volume ratio, their superior electronic sensitiveness, and other advantageous properties, the use of gas sensors based on nanostructures has been increasing in popularity.17–23 There has been numerous studies conducted utilizing density functional theory to explore the potential of ClCN nanosensors. Unfortunately, in some of these studies, it was found that the pristine nanostructures were not sensitive to a variety of chemicals, so it is of utmost importance to research ways to modify the structures of the nanosensors in order to enhance their sensitivity to various substances.24–27 They have demonstrated that the electronic characteristics of nanostructures can be altered when exposed to ClCN, which has the potential to greatly improve the sensitivity of the sensor when the doping method strategy is employed. In this research, a theoretical analysis was conducted to investigate the bonding properties and the detection of CICN gas using carbon nanocones (CNCs). In order to enhance the performance of our proposed sensor, several techniques were employed, such as functionalizing it with pyridinol (Pyr) and pyridinol oxide (PyrO), decorating it with the metals boron (B), aluminum (Al), and gallium (Ga), and doping it with the same metals (B, Al, and Ga). The primary purpose of this work was to examine the sensitivity of the electronic attributes of CNCs to ClCN. The adhesion of gasses on the surface of CNCs can result in changes in their electrical conductivity and generate an electronic signal, which is the basis of their detection method.
2. Computational methods
Geometry optimizations of a CNC molecule were performed using the GAMESS software and the B3LYP functional with the 6-31G(d) basis set in the gas phase. The CNC molecule was functionalized with pyridinol (CNC/Pyr) and pyridinol oxide (CNC/PyrO), decorated with metals (M = B, Al, and Ga) (CNC/M), and doped with the same metals (M = B, Al, and Ga) (CNC–M) with and without the ClCN molecule.28 The B3LYP functional has been used for theoretical studies in previous letters,29–31 and also 6-31G(d) basis set has been used in a similar work.32 After the optimization and obtained all considered configurations, full optimization using M06-2X/6-311G(d) are performed for favorable configurations (CNC–Al, CNC–Ga, S21 and S22 configurations) to obtain more accurate results. The M06-2X functional could be a high non-locality functional with double the amount of non-local exchange (2X) to ponder dispersion forces.33 The hybrid M06-2X functional has been applied as an acceptable method in many nanoscale molecular systems due to the higher percentage of Hartree–Fock exchange (54%).34,35 The adsorption energy (Eads) of ClCN gas on the surface of pristine, functionalized, decorated, and doped Carbon Nano-Cones (CNC) has been quantified. This energy is an indication of the degree of attraction between the gas molecules and the surface of the CNCs. It is calculated by measuring the energy required for the gas molecules to bind to the CNCs. Eads can be used to compare the adsorption capacity of different CNCs, giving insight into their reactivity. Mathematically it is calculated by eqn (1).| Eads = E(complex) − E(gas) − E(adsorbent) + EBSSE | (1) |
| Eg = ELUMO − EHOMO | (2) |
The global interaction between the adsorbent and ClCN gas have been determined using the electron transfer number (ΔN), which represents the fractional number of electrons, transferred from the complex between ClCN gas and adsorbent to ClCN molecule, and is represented by:37
 | (3) |
The accurate calculation of energy dissipation is the main problem of the density functional theory which is the main composition of the van der Waals (vdW) forces. So, reduced density gradient is used to calculate the non-covalent interactions:38
 | (4) |
3. Results and discussion
3.1. Geometry optimization of pristine carbon nanocone (CNC) and ClCN gas
A nanocone with an apex in the shape of a pentagon and a cone angle of 108° (illustrated in Fig. 1a) was studied, which is the largest angle to be observed both theoretically and experimentally, as reported in the literature.8,10 The pristine CNC was observed to consist of 80 carbon atoms with their dangling bonds saturated using hydrogen atoms. Additionally, different types of C–C bonds with varied lengths associated with the carbon atoms of the pentagonal and hexagonal rings were also identified (see Fig. 1a). The electronic properties of CNC were also studied. Table 1 lists the HOMO energy, LUMO energy and the energy gap (Eg) of CNC. The total density of states (TDOS) of CNC with Eg of 2.43 eV is depicted in Fig. 1c. The results of this study are in agreement with those of the previous work.41 Fig. 1c displays the graphical representation of the distribution of HOMO and LUMO for pure CNC, while Fig. 1b shows the optimized ClCN structure.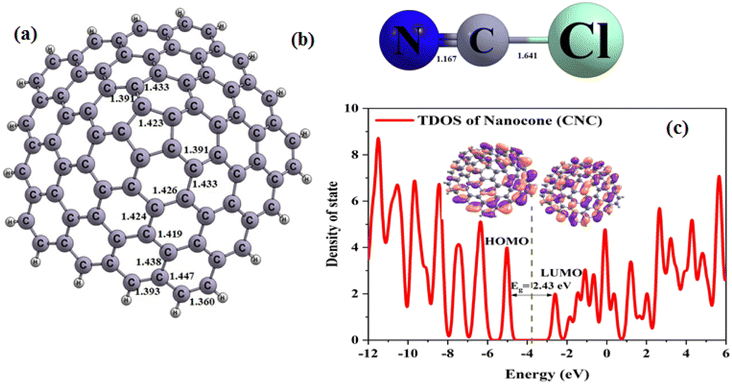 | ||
| Fig. 1 Optimized structure of (a) CNC, (b) ClCN gas, and (c) total density of states (TDOS) of CNC (distances are reported in Å. Fermi energy is shown by dashed line). | ||
| Systems | Eads (kcal mol−1) | EHOMO (eV) | EFL (eV) | ELUMO (eV) | Eg (eV) | % ΔEg | Φ (eV) | ΔΦ (eV) | QT (me) | ΔN |
|---|---|---|---|---|---|---|---|---|---|---|
| ClCN | — | −9.12 | −4.74 | −0.35 | 8.77 | — | 4.74 | — | — | — |
| CNC | — | −5.01 | −3.80 | −2.59 | 2.43 | — | 3.80 | — | — | — |
| S1 | −0.22 | −5.11 | −3.90 | −2.69 | 2.42 | −0.41 | 3.90 | 0.10 | −8 | −0.075 |
3.2. Adsorption of ClCN on the pristine CNC
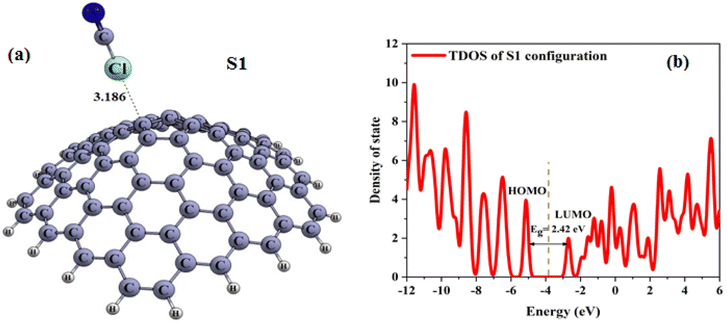
Several initial structures, such as the chlorine and nitrogen heads of ClCN located either on top of the ring center or close to a carbon atom, were considered in order to determine the minimum adsorption energy on both the interior and exterior surfaces of ClCN. During the complete optimization process, the orientation of ClCN was changed such that its chlorine atom was brought close to one of the carbon atoms present in the pentagonal ring of the CNC. Upon geometry optimization, it was ascertained that only a single configuration (S1) was stable (as shown in Fig. 2a). The values for the energy gap, adsorption energy and charges, as obtained through analysis, are presented in Table 1.The calculated Eads value for the S1 configuration using eqn (1) is listed in Table 1. As given in Table 1, the calculated Eads value for the S1 configuration using eqn (1) is −0.22 kcal mol−1, which implies very weak physical adsorption and is thus energetically unfavorable. The C–Cl distance in the S1 configuration is 3.19 Å, as illustrated in Fig. 2. According to the information contained in Table 1, the adsorption of ClCN gas on the CNC (S1 configuration) surface occurs in conjunction with a partial charge transfer process (about −8 |me| transferred from nanocone to the gas). The results acquired demonstrated that the weak electrostatic interaction between CICN and CNC happened, and the unaltered cyanogen chloride is not a suitable sensor for sensing and identifying CICN gas.
The electronic properties of the S1 configuration were calculated in order to explore the impact of adsorbing ClCN on the electronic properties of pristine CNC. As can be concluded from Table 1, the Eg and EFL appear to have a subtle shift after the adsorption process. The results indicated that the energy gap (Eg) in the S1 configuration was 2.42 eV. The slight variation of Eg (% ΔEg) was dependent on the feeble adsorption on the outer surface of pristine CNC. The Total Density of States (TDOS) was analysed and illustrated in Fig. 2b. As per the data presented in the figure, there is no considerable variation between the S1 configuration and the original CNC, thereby affirming the weak interaction between the ClCN gas and CNC.
The electron transfer number (ΔN) was computed. It is worth mentioning that the tendency of electrons for deflection can be determined by measuring the electrical, chemical potential measures. This deflection is related to the ease of deflection of the electron density as well as the size of ions and atoms. The ΔN of adhesion sites was found to be negative, which indicated electron transfer from the CNC to ClCN. This data was confirmed the results of NBO analysis that showed the −8 |me| transferred from CNC to the ClCN (see Table 1). The manipulation of the work function of materials is an effective way of enhancing the performance of electronic devices. Additionally, the work function of nano-materials is a pivotal element in regulating their surface characteristics. The changes in the work function of charge transfer between the pure CNC and ClCN were investigated. The minimum energy required to extract electrons from the Fermi level to a point beyond the surface of solid materials is known as the work function. Furthermore, the current density of an electron emitted into the vacuum can be determined using the following formula:
 | (5) |
The Φ value was computed as follows:
| Φ = Einf − EFL | (6) |
The interaction between the ClCN and CNC can change the electronic structure of the CNC, which can be demonstrated by the variation in the electrical conductivity of CNC. The conduction electron population of semiconductors responsible for electrical conductance was computed as follows34
σ = AT3/2![[thin space (1/6-em)]](https://www.rsc.org/images/entities/char_2009.gif) exp(−Eg/2kT) exp(−Eg/2kT)
| (7) |
3.3. Structural manipulation to enhance sensitiveness and reactivity
In order to achieve our goal, the tip of the CNC was functionalized (see Fig. 3a and 4a). As shown in Table 2, after functionalization of the CNC with Pyr and PyrO groups, the HOMO shifted partially to higher energies, and the LUMO moved slightly higher as well, resulting in a shorter gap energy than that of pristine CNC (Eg = 2.026 and 2.021 eV for CNC/Pyr and CNC/PyrO, respectively). Once we had secured the stable structures of CNC/Pyr and CNC/PyrO, the positioning of ClCN gas on the functional groups was examined, as demonstrated in Fig. 3(b–g) and 4(b–g).
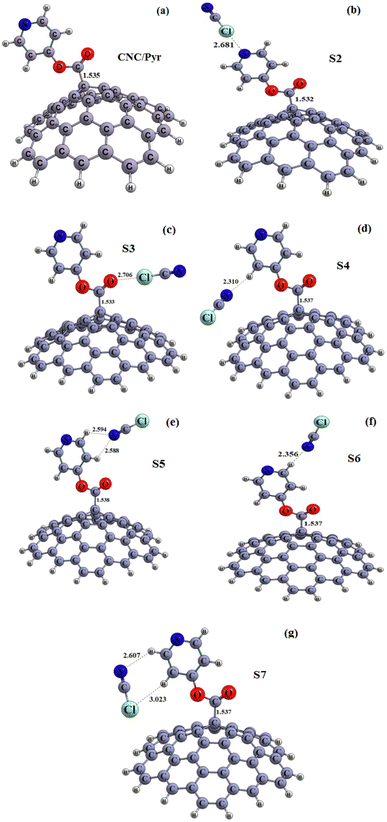 | ||
| Fig. 3 Optimized structures of the carbon nanocone functionalized with (a) pyridinol group (CNC/Pyr), (b–g) S2– S7 configurations (distances are reported in Å). | ||
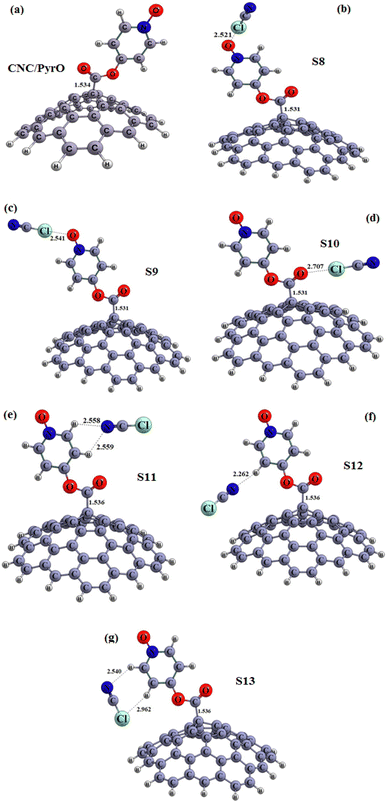 | ||
| Fig. 4 Optimized structures of the carbon nanocone functionalized with (a) pyridinol oxide group (CNC/PyrO), (b–g) S8–S13 configurations (distances are reported in Å). | ||
| Systems | Eads (kcal mol−1) | EHOMO (eV) | EFL (eV) | ELUMO (eV) | Eg (eV) | % ΔEg | Φ (eV) | ΔΦ (eV) | QT (me) | ΔN |
|---|---|---|---|---|---|---|---|---|---|---|
| CNC/Pyr | — | −4.77 | −3.76 | −2.75 | 2.026 | — | 3.76 | — | — | — |
| S2 | −3.11 | −4.88 | −3.87 | −2.86 | 2.02 | −0.29 | 3.87 | 0.11 | −35 | −0.044 |
| S3 | −2.31 | −4.88 | −3.88 | −2.87 | 2.01 | −0.79 | 3.88 | 0.12 | −12 | −0.044 |
| S4 | −0.25 | −4.75 | −3.74 | −2.72 | 2.03 | 0.20 | 3.74 | −0.02 | 8 | −0.056 |
| S5 | 0.52 | −4.70 | −3.69 | −2.67 | 2.03 | 0.20 | 3.69 | −0.07 | 5 | −0.061 |
| S6 | 0.96 | −4.70 | −3.69 | −2.67 | 2.03 | 0.20 | 3.69 | −0.07 | 8 | −0.061 |
| S7 | 0.91 | −4.91 | −3.90 | −2.88 | 2.03 | 0.20 | 3.90 | 0.13 | −6 | −0.043 |
| CNC/PyrO | — | −4.84 | −3.83 | −2.82 | 2.021 | — | 3.83 | — | — | — |
| S8 | −2.20 | −4.95 | −3.94 | −2.93 | 2.02 | −0.05 | 3.94 | 0.11 | −42 | −0.039 |
| S9 | −2.10 | −4.94 | −3.93 | −2.93 | 2.01 | −0.54 | 3.93 | 0.10 | −39 | −0.039 |
| S10 | −1.34 | −4.94 | −3.93 | −2.93 | 2.01 | −0.54 | 3.93 | 0.10 | −12 | −0.039 |
| S11 | −0.76 | −4.79 | −3.77 | −2.76 | 2.03 | 0.44 | 3.77 | −0.06 | 6 | −0.053 |
| S12 | −0.03 | −4.81 | −3.80 | −2.78 | 2.03 | 0.44 | 3.80 | −0.03 | 10 | −0.051 |
| S13 | 1.01 | −4.94 | −3.93 | −2.92 | 2.02 | −0.05 | 3.93 | 0.10 | −6 | −0.040 |
After optimization of the structures under consideration, six configurations of interaction between CNC/Pyr and ClCN gas (S2–S7) and six configurations of interaction between CNC/PyrO and ClCN gas (S8–S13) were obtained. The energy bandgap (Eg) of the obtained configurations was found to be in the range of 2.01 to 2.03 eV, indicating only a slight change in Eg due to the weak adsorption of the molecules on the CNC/Pyr and CNC/PyrO structures. The values of adsorption energy in Table 2 reveal that the S2–S4 and S8–S12 configurations are stable, as the adsorption energies are negative. These results revealed that the interaction between ClCN gas and the adsorbent is very weak. This is further emphasized by the interaction distances in each of these configurations, which are all in the range of 2.26–3.02 Å. Table 2 shows that the adsorption of ClCN gas on the CNC/Pyr and CNC/PyrO is accompanied by a partial charge transfer process. The adsorbent structure transfers −6 to −42 |me| to the ClCN gas for S2, S3, S8–S10, and S13 configurations, and the ClCN gas transfers 5–10 |me| to the adsorbent for S4–S7 and S11–S12, respectively. The values of ΔN for all absorption sites were found to be negative, indicating that the electron transfer occurred from the CNC/Pyr and CNC/Pyro structures to the ClCN gas. These results confirmed with NBO results (especially in the case of S2, S3, S8–S10, and S13). The values of ΔΦ of these structures are presented in Table 2. These results show that CNC functionalized with Pyr and Pyro cannot act as an φ-type sensor due to the low absorption energy. In conclusion, two important parameters – Eads and energy gap (Eg) – play a key role in the gas sensing potential of nanoparticles. In this case, Eads and Eg for the adsorption of ClCN gas onto CNC/Pyr and CNC/PyrO structures are extremely low, making them unsuitable as sensitive sensors for detecting ClCN gas.
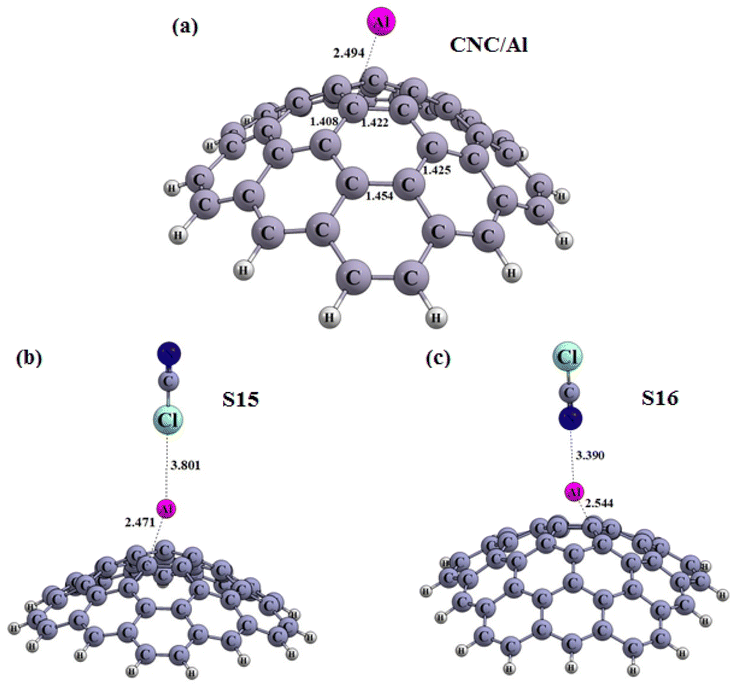 | ||
| Fig. 6 Optimized structures of the carbon nanocone (a) decorated with Al atom (CNC/Al), (b) S15, and (c) S16 configuration (distances are reported in Å). | ||
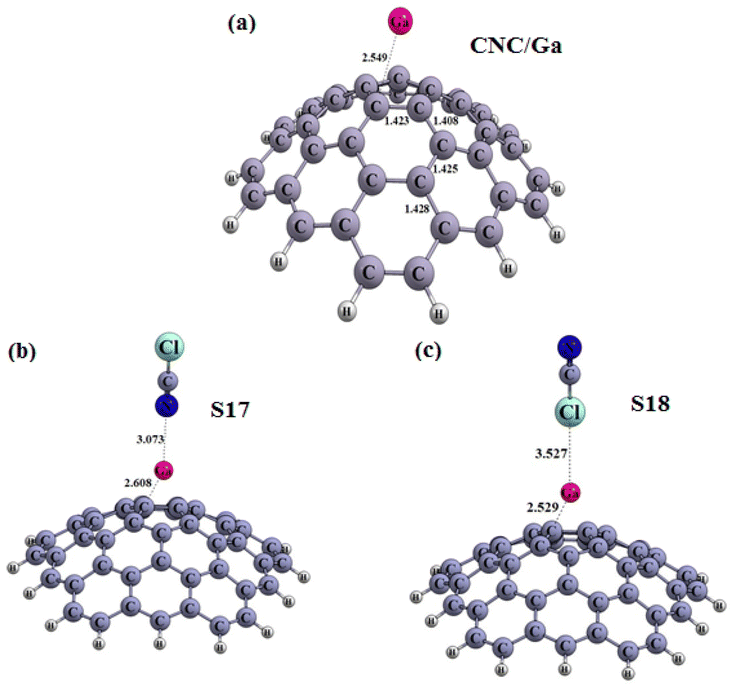 | ||
| Fig. 7 Optimized structures of the carbon nanocone (a) decorated with Ga atom (CNC/Ga) (b) S17, and (c) S18 configuration (distances are reported in Å). | ||
The electronic properties of CNC/M (CNC decorated with metals) structures were examined, and the values of EHOMO, ELUMO, EFL and Eg were tabulated in Table 3. The results revealed that compared to the pristine CNC, the Eg of the CNC/M structures had changed. Specifically, the HOMO and LUMO levels had shifted to higher energy levels, resulting in an increase in Eg for CNC/B, CNC/Al and CNC/Ga. It can thus be concluded that decorating the CNC with metals can significantly affect the electronic properties of the pristine CNC. The inspection of the adsorption of ClCN on CNC/M structures in the decorated region was conducted.
| Systems | Eads (kcal mol−1) | EHOMO (eV) | EFL (eV) | ELUMO (eV) | Eg (eV) | % ΔEg | Φ (eV) | ΔΦ (eV) | QT (me) | ΔN |
|---|---|---|---|---|---|---|---|---|---|---|
| CNC/B | — | −4.92 | −3.40 | −1.88 | 3.03 | — | 3.40 | — | — | — |
| S14 | −8.84 | −4.94 | −3.83 | −2.71 | 2.23 | −26.41 | 3.83 | 0.43 | −44 | −0.047 |
| CNC/Al | — | −4.78 | −3.24 | −1.70 | 3.082 | — | 3.24 | — | — | — |
| S15 | 0.04 | −4.91 | −3.37 | −1.83 | 3.08 | −0.06 | 3.37 | 0.13 | −6 | −0.081 |
| S16 | 1.01 | −4.59 | −3.06 | −1.53 | 3.06 | −0.71 | 3.06 | −0.18 | 17 | −0.106 |
| CNC/Ga | — | −4.72 | −3.22 | −1.72 | 3.00 | — | 3.22 | — | — | — |
| S17 | 0.74 | −4.50 | −3.02 | −1.54 | 2.96 | −1.33 | 3.02 | −0.20 | 27 | −0.110 |
| S18 | 0.88 | −4.84 | −3.34 | −1.85 | 2.99 | −0.33 | 3.34 | 0.12 | −3 | −0.083 |
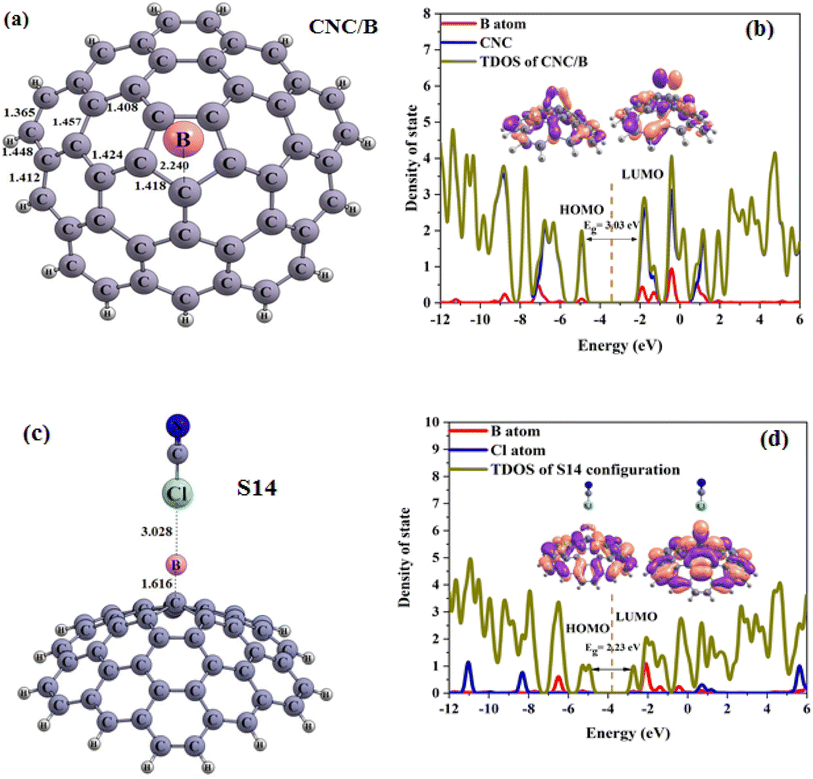
The obtained results are showcased in Fig. 5(a–d), 6(a–c) and 7(a–c), where the Cl and N of the ClCN gas are seen to interact with the M atom of the CNC/M structures. To evaluate the adsorption energy, the Eads values of the obtained configurations was computed using eqn (1), the results of which are presented in Table 3. From Table 3, the obtained configurations can be seen to be divided into two groups. The first group includes S14 (Fig. 5c) (configuration from an interaction between CNC/B with ClCN gas), which is found to be stable (Fig. 5c). The energy of adsorption (Eads) for this configuration was calculated to be −8.84 kcal mol−1, confirming the physical adsorption of ClCN gas on the exterior surface of CNC/B. This indicates that the ClCN gas molecules are able to form a strong bond with the CNC/B molecules, thus making the configuration stable. The interaction distance between chlorine (Cl) from CICN gas and boron (B) from CNC/B is approximately 3.03 Å, which suggests physical adsorption between them. The Natural Bond Orbital (NBO) analysis revealed that there was a charge transfer that occurred after the adsorption process as well. According to the results tabulated in Table 3, −44 |me| was transferred from CNC/B to ClCN gas. This charge transfer is indicative of a strong bond formed between the two substances, as the exchange of electrons results in a higher energy state for the combined molecules. The second group of S15–S18 configurations have very weak adsorption energy (Fig. 6b, c and 7b, c). As shown in Table 3, the Eads for these configurations range from 0.04 to 1.01 kcal mol−1. This confirms the fact that ClCN gas has very weak physical adsorption and unstable configuration on the exterior surface of CNC/M (M = Al and Ga) due to positive adsorption energy. The interaction distance between Cl from the ClCN gas and the M from CNC/M is approximately 3.80 Å and 3.53 Å in the S15 and S18 configurations, respectively. Similarly, for the interaction distance between N from the ClCN gas and the M from CNC/M, it is 3.39 Å and 3.07 Å in S16 and S17 configurations, respectively. This suggests that there is a very weak interaction between them. Furthermore, the results of the Natural Bond Orbital (NBO) analysis showed that the charge transfer between CNC/Al and CNC/Ga and ClCN gas is −6 |me|, 17 |me|, 27 |me| and −3 |me| respectively, during the adsorption process. This fact confirmed the very weak physisorption interaction for the ClCN adsorption on the exterior surface CNC/M (M = Al, and Ga). It was further revealed that the physisorption interaction between ClCN and CNC/M was not sufficient enough to form a stable bond between the two materials. This makes it clear that the physisorption interaction between ClCN and CNC/M is very weak and unlikely to lead to a stronger and more permanent bond.
To properly complete our studies, the electronic properties such as the EHOMO energy, the ELUMO energy, and the energy gap (Eg) of various molecules was investigated. Upon analyzing Table 3, it can be seen a remarkable change in the Eg of S14 when compared to CNC/B (Fig. 5a), with a difference of 26.41%. This is indicative of a strong adsorptive response to ClCN and an electric response, while the Eg of S15–S18 compared to CNC/M (M = Al and Ga) (Fig. 6a and 7a) is negligible, verifying a very weak physisorption interaction. The new HOMO and LUMO levels of S14 are lower compared to the CNC/B (Fig. 5b and d). This is responsible for a substantial change in the Eg (energy gap between the HOMO and LUMO levels). Thus, it can be inferred that the CNC/B is sensitive enough to detect the presence of ClCN gas.
Our analysis of the ΔN values of our five configurations – S14–S18 – reveal that they are all negative, with values of −0.047, −0.081, −0.106, −0.110 and −0.083, respectively. This suggests that the electron transfer occurred from CNC/B, CNC/Al and CNC/Ga to ClCN gas. Examining Table 3, the ΔΦ values of S14, S15, and S18 are positive and Φ values of them are increased compared to that of CNC/B, CNC/Al, and CNC/Ga, respectively. Meanwhile, the ΔΦ values of S16 and S17 are negative.
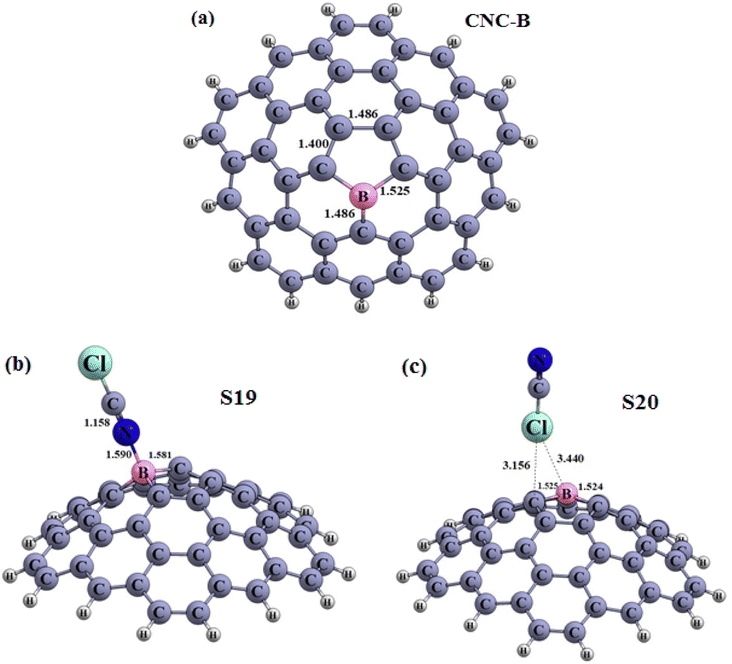 | ||
| Fig. 8 Optimized structures of the carbon nanocone doped with some metals (a) CNC–B (b) S19 and (c) S20 configuration (distances are reported in Å). | ||
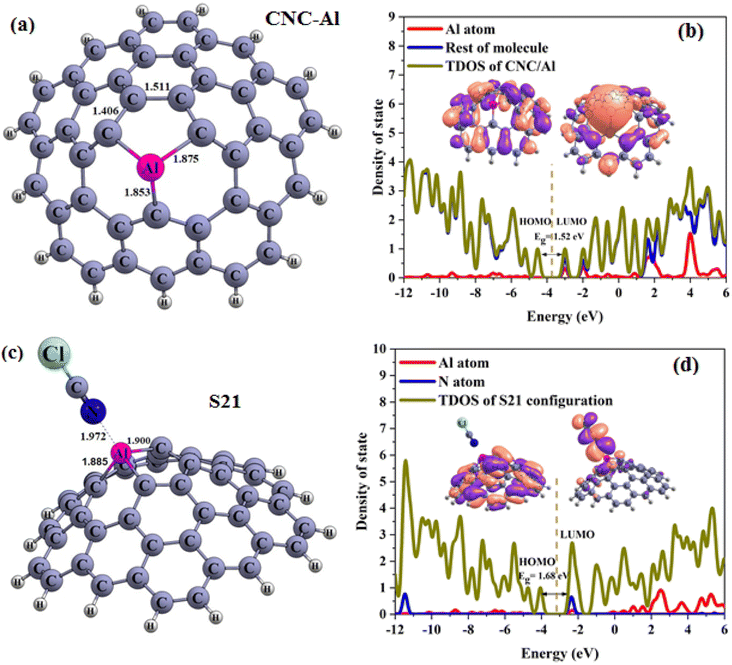 | ||
| Fig. 9 Optimized structures of the carbon nanocone (a) doped with metal CNC–Al, (b) TDOS (c) S21, (d) PDOS plots (distances are reported in Å. Fermi energy is shown by dashed line). | ||
| Systems | Eads (kcal mol−1) | EHOMO (eV) | EFL (eV) | ELUMO (eV) | Eg (eV) | % ΔEg | Φ (eV) | ΔΦ (eV) | QT (me) | ΔN |
|---|---|---|---|---|---|---|---|---|---|---|
| CNC–B | — | −4.62 | −3.90 | −3.18 | 1.44 | — | 3.90 | — | — | — |
| S19 | −3.95 | −4.21 | −3.27 | −2.33 | 1.88 | 30.56 | 3.27 | −0.63 | 317 | −0.098 |
| S20 | −0.64 | −4.78 | −4.07 | −3.35 | 1.43 | −0.70 | 4.07 | 0.17 | −5 | −0.029 |
| CNC–Al | — | −4.52 | −3.76 | −3.00 | 1.52 | — | 3.76 | — | — | — |
| S21 | −22.90 | −4.05 | −3.21 | −2.37 | 1.68 | 10.53 | 3.21 | −0.55 | 149 | −0.105 |
| CNC–Ga | — | −4.55 | −3.82 | −3.10 | 1.45 | — | 3.82 | — | — | — |
| S22 | −15.59 | −4.12 | −3.21 | −2.29 | 1.83 | 26.21 | 3.21 | −0.601 | 159 | −0.104 |
| S23 | 1.90 | −4.52 | −3.70 | −2.87 | 1.65 | 13.79 | 3.70 | −0.12 | 112 | −0.062 |
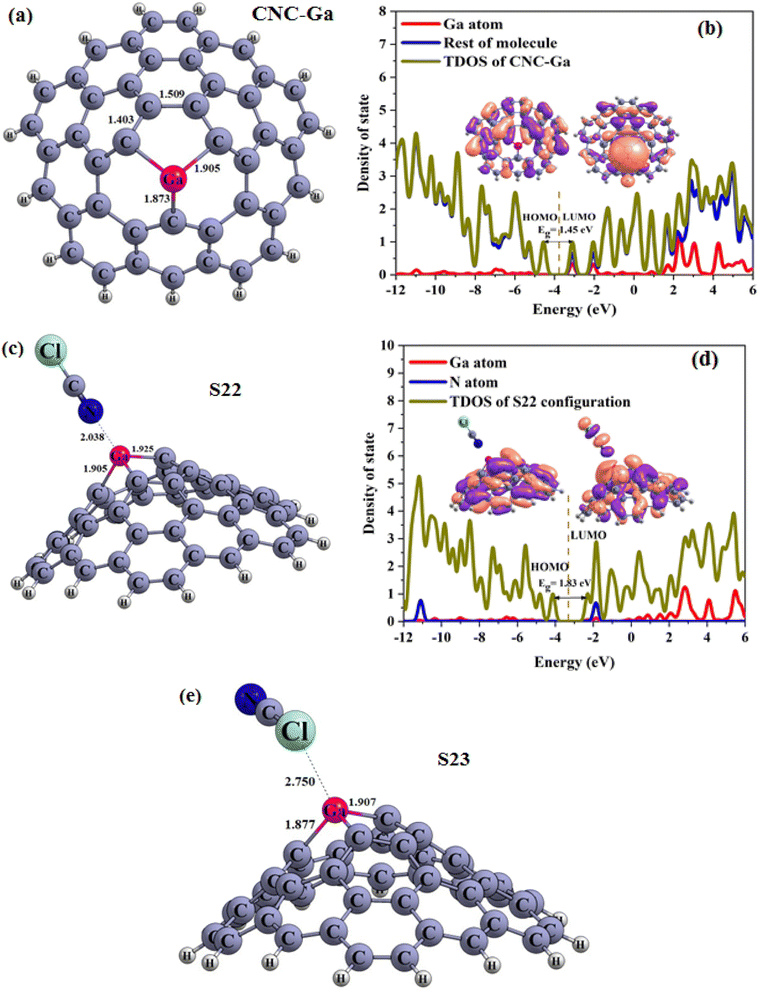
Continuing our research, the adsorption of the ClCN gas on the CNC–M structures was investigated at the top of the M atoms. Fig. 8(a–c), 9(a–d), and 10(a–e) illustrate the achieved configurations in which the N or Cl component of the ClCN gas interacts with the M or C atom of the CNC–M structures. Table 4 lists the values of the adsorption energy (Eads) for all the considered configurations. The data obtained from the study showed that there were two types of configurations; S19, S20 and S23. These configurations were a result of the interaction between CNC–B, CNC–Ga and ClCN gas, respectively. The N⋯B and Cl⋯C distances in S19 and S20 configurations were 1.59 and 3.15 Angstroms, respectively, while the Cl⋯Ga distance in the S23 configuration was 2.75 Angstroms. Additionally, the adsorption energy of S19, S20, and S23 was found to be −3.95, −0.64, and 1.90 kcal mol−1, respectively, which indicated a weak physisorption between ClCN gas and CNC–M (M = B and Ga) structure. The results of the NBO analysis revealed that 317, −5, and 112 |me| were transferred between ClCN gas and the CNC–M (M = B and Ga) structure. As further evidence of the stability of this interaction, two configurations, S21 and S22 (which originated from the interaction between CNC–Al, CNC–Ga and ClCN gas), were identified. The energy of adsorption (Eads) for these two configurations was found to be −22.90 and −15.59 kcal mol−1, respectively, indicating that they are both very stable. Such negative values of Eads are indicative of a chemisorption process, wherein the N atom of ClCN gas interacts with the M atom of CNC–M (M = Al and Ga). The NBO analysis thus revealed that the interactions between ClCN gas and CNC–M are stable and are the result of a chemisorption process. The N–M distance measurements between the N–M atoms in the S21 and S22 configurations are 1.97 and 2.04 Angstroms, respectively. A Natural Bond Orbital (NBO) analysis showed that there was a charge transfer of 149 and 159 milli-electronvolts (meV) from the chlorine cyanide (ClCN) to the CNC–Al and CNC–Ga atoms, respectively, during the adsorption process. This indicated that the chemisorption interaction between the ClCN molecules and the CNC–Al and CNC–Ga atoms was strong and confirmed the charge transfer.
In order to finalize our research, the various electronic properties such as the HOMO, LUMO and the band gap (Eg) of the molecules was considered in order to gain a better understanding of their important parameters. As observed in Table 4, there was a significant change in the Eg values of S19 and S23 when compared to CNC–B and CNC–Ga, respectively (% ΔE = 30.56, 13.79, respectively). This could be used as a potential indicator to detect ClCN gas. The new HOMO and LUMO levels of the S19 and S23 configurations, which were upward compared to the CNC–B and CNC–Ga, respectively, were responsible for the change in the Eg. However, since both the Eads and Eg are important factors in the gas sensing potential of nanostructures, these two configurations could not be used as good ClCN sensors. The S20 configuration, which was presented in Table 4, did not show any significant change in the Eg when compared to the CNC–B. The only slight change in Eg (% ΔE) was due to the weak physisorption on the external surface of the CNC–B (% ΔE = −0.70%). Finally, the electronic properties of the S21 and S22 configurations were inspected (as demonstrated in Table 4). To gain a better understanding, the Total Density of States (TDOS), and the Partial Density of States (PDOS) and visualized the HOMO and LUMO of these configurations were generated, as illustrated in Fig. 9 and 10, respectively.
It is evident that there are obvious differences between the S21 and CNC–Al, as well as between the S22 and CNC–Ga, which are linked to the chemisorption process. As observed from the PDOS spectra, there are new LUMO, and HOMO levels present due to the interaction between the ClCN gas and the CNC–Al and CNC–Ga. This is indicative of the Al and Ga atoms being more actively involved in the process. The TDOS plots showed that the valence and conduction levels in the S21 and S22 configurations had a notable upward shift. This resulted in an enhanced Eg value of the S21 and S22 compared to the CNC–Al and the CNC–Ga, with an increase of 10.53% and 26.21%, respectively. Furthermore, the graphical presentation of the HOMO and LUMO of the S21 and S22 illustrated that the HOMO was concentrated on the CNC–Al and CNC–Ga while the LUMO was spread over the ClCN gas molecule. The observed phenomenon is in accordance with the charge transfer from ClCN gas to the CNC–Al and the CNC–Ga structures. This indicates that these two structures can be viable options to be used for the chemisorption sensing of ClCN gas. Chemisorption sensing is an effective technique for the detection of gas molecules through the observation of changes in the electrical properties of the sensing material. The CNC–Al and the CNC–Ga structures have the potential to act as efficient chemisorption sensors for ClCN gas, as they can effectively detect changes in the charge transfer due to the presence of the gas in their vicinity.
Our configurations have negative ΔN values (−0.098, −0.029, −0.105, 0.104, and −0.062 for S19, S20, S21, S22, and S23 respectively), which suggests that electron transfer is taking place from the CNC–M to the ClCN gas. Table 4 also shows us that the ΔΦ of these configurations is −0.63, 0.17, −0.55, −0.62 and −0.12, which implies that the CNC–Al and the CNC–Ga have the ability to act as φ-type sensors due to their chemical adsorption energy and their low recovery time.
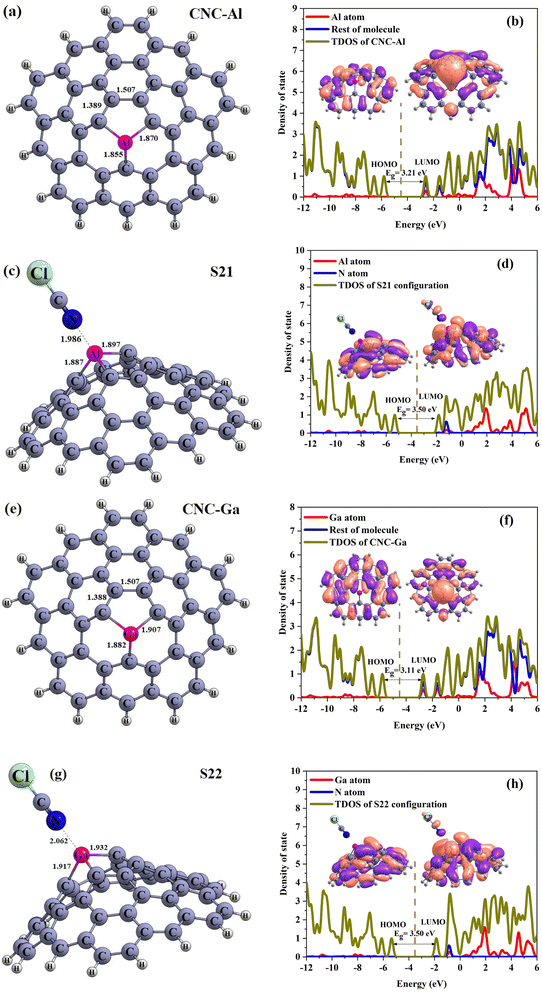
To obtain the accurate data, the new calculations on the CNC–Al, CNC–Ga structure and S21 and S22 configurations were performed via M06-2X/6-311G(d) level. Our results reported in Table 5 and Fig. 11. From this table, it is clear that the Eads and Eg are increased and decreased, respectively. After full optimization in this level, Eads of C and D configurations changed to the −29.11 and −23.70 kcal mol−1 that is higher than B3LYP/6-31G(d) level. On the other hand, M⋯N distance in these configuration (M = Al and Ga) increased to 1.982 Å and 2.062 Å, respectively. The Eg of CNC–Al and CNC–Ga aren't significant difference between the two methods and their values are close. Based on Table 5, Eg of S21 configurations in the new method is very close to the previous data but about S22, it is clear that Eg is broader than and the % ΔEg are smaller than the B3LYP/6-31G(d) level. The TDOS and PDOS of considered structures are confirmed the obtained data. Although, the results of the two methods are slightly different. Nevertheless the results of both of them confirm each other.
| Systems | Eads (kcal mol−1) | EHOMO (eV) | EFL (eV) | ELUMO (eV) | Eg (eV) | % ΔEg | DM (Debye) | Φ (eV) | ΔΦ (eV) | QT (me) | ΔN |
|---|---|---|---|---|---|---|---|---|---|---|---|
| CNC–Al | — | −5.80 | −4.19 | −2.59 | 3.21 | — | 2.10 | 4.19 | — | — | — |
| S21 | −29.11 | −5.31 | −3.56 | −1.81 | 3.50 | 9.03 | 8.87 | 3.56 | −0.63 | 190 | −0.10 |
| CNC–Ga | — | −5.80 | −4.25 | −2.69 | 3.11 | — | 2.52 | 4.25 | — | — | — |
| S22 | −23.70 | −5.34 | −3.59 | −1.84 | 3.50 | 12.54 | 8.10 | 3.59 | −0.66 | 191 | −0.10 |
It is noteworthy that an important characteristic of the gas sensor is its recovery time. Such a strong interaction might be due to the difficulty and prolonged recovery time sensor for desorption of the adsorbate. With a significant increase in absorption energy, it is expected that the recovery time of sensor is prolonged. According to the conventional transition state theory, the recovery time can expressed by the following equation:52
τ = ν0−1![[thin space (1/6-em)]](https://www.rsc.org/images/entities/char_2009.gif) exp(−Eads/kT) exp(−Eads/kT)
| (8) |
4. Conclusion
The DFT method was employed in this study to evaluate the sensitivity potential of carbon nanocones (CNCs) as sensors for the detection of ClCN gas. The optimized geometrical and electronic properties of the CNCs were determined in order to assess their sensitivity to ClCN gas. The results of the study showed that ClCN was weakly adsorbed on the pristine CNCs, suggesting that CNCs are not suitable for use as a sensor for ClCN gas. Number of strategies were implemented to increase the adsorption capacity of the CNC surface. These strategies included functionalizing the CNC with pyridinol and pyridinol oxide groups, decorating it with metals such as boron, aluminium, and gallium, and doping it with the same metals. After evaluating the results, it should be noted that the CNC–Al and CNC–Ga structures were more reactive to ClCN gas compared to other structures. The electronic properties of the structures discussed have been found to be exceptionally sensitive to the presence of ClCN. This provides the potential for their application in ClCN chemical sensors. It should be noted that, of the various structures discussed, the CNC–Ga structure appears to be the most favorable when it comes to sensing ClCN gas. Additionally, it has been suggested that doping gallium is a particularly successful strategy for such applications.Conflicts of interest
The authors declare that we have no competing financial interests or personal relationships that could have appeared to influence the work reported in this paper.References
- S. Iijima, Nature, 1991, 354, 56–58 CrossRef CAS.
- P. Lai, S. Chen and M.-F. Lin, Phys. E, 2008, 40, 2056–2058 CrossRef CAS.
- H.-Y. Song and X.-W. Zha, Phys. Lett. A, 2010, 374, 1068–1072 CrossRef CAS.
- M. Khalif, S. Daneshmehr, S. Arshadi, İ. Söğütlü, E. A. Mahmood, V. Abbasi and E. Vessally, J. Mol. Graphics Modell., 2023, 119, 108362 CrossRef CAS PubMed.
- Y. Duan, L. Pirolli and A. V. Teplyakov, Sens. Actuators, B, 2016, 235, 213–221 CrossRef CAS PubMed.
- S. Arshadi, F. Abdolahzadeh and E. Vessally, J. Mol. Graphics Modell., 2023, 119, 108371 CrossRef CAS PubMed.
- X. Li, H. Zhou, C. Fu, F. Wang, Y. Ding and Y. Kuang, Sens. Actuators, B, 2016, 236, 144–152 CrossRef CAS.
- T. Ichihashi and Y. Ando, Nature, 1992, 356, 776–778 CrossRef.
- A. Krishnan, E. Dujardin, M. Treacy, J. Hugdahl, S. Lynum and T. Ebbesen, Nature, 1997, 388, 451–454 CrossRef CAS.
- M. Ge and K. Sattler, Chem. Phys. Lett., 1994, 220, 192–196 CrossRef CAS.
- E. Vessally, P. Farajzadeh and E. Najafi, Iran. J. Chem. Chem. Eng., 2021, 40, 1001–1011 CAS.
- S. P. Jordan and V. H. Crespi, Phys. Rev. Lett., 2004, 93, 255504 CrossRef PubMed.
- M. Grujicic, G. Cao and B. Gersten, Appl. Surf. Sci., 2003, 206, 167–177 CrossRef CAS.
- Y. Saito, Y. Tsujimoto, A. Koshio and F. Kokai, Appl. Phys. Lett., 2007, 90, 213108 CrossRef.
- M. Abdollahi and A. Hosseini, Cyanogen Chloride, Encyclopedia of Toxicology, 2014, pp. 1096–1099, DOI:10.1016/B978-0-12-386454-3.00484-X.
- B. J. Lukey, J. A. Romano Jr, J. A. Romano, H. Salem and B. J. Lukey, Chemical Warfare Agents: Chemistry, Pharmacology, Toxicology, and Therapeutics, CRC Press, 2007 Search PubMed.
- A. A. Peyghan, A. Omidvar, N. L. Hadipour, Z. Bagheri and M. Kamfiroozi, Phys. E, 2012, 44, 1357–1360 CrossRef CAS.
- M. Trawka, J. Smulko, L. Hasse, C.-G. Granqvist, F. E. Annanouch and R. Ionescu, Sens. Actuators, B, 2016, 234, 453–461 CrossRef CAS.
- M. Eslami, V. Vahabi and A. A. Peyghan, Phys. E, 2016, 76, 6–11 CrossRef CAS.
- J. Beheshtian, M. Noei, H. Soleymanabadi and A. A. Peyghan, Thin Solid Films, 2013, 534, 650–654 CrossRef CAS.
- A. Ahmadi Peyghan, N. L. Hadipour and Z. Bagheri, J. Phys. Chem. C, 2013, 117, 2427–2432 CrossRef CAS.
- Y. Hong, C.-H. Kim, J. Shin, K. Y. Kim, J. S. Kim, C. S. Hwang and J.-H. Lee, Sens. Actuators, B, 2016, 232, 653–659 CrossRef CAS.
- M. Solimannejad, S. Kamalinahad and E. Shakerzadeh, Phys. Chem. Res., 2016, 4, 315–332 Search PubMed.
- H. Farrokhpour, H. Jouypazadeh and S. Vakili Sohroforouzani, Mol. Phys., 2020, 118, 1626506 CrossRef.
- M. Jyothi, V. Nagarajan and R. Chandiramouli, Chem. Phys., 2020, 538, 110896 CrossRef CAS.
- M. Rouhani, J. Mol. Struct., 2019, 1181, 518–535 CrossRef CAS.
- E. Vessally, R. Moladoust, S. Mousavi-Khoshdel, M. Esrafili, A. Hosseinian and L. Edjlali, Thin Solid Films, 2018, 645, 363–369 CrossRef CAS.
- M. W. Schmidt, K. K. Baldridge, J. A. Boatz, S. T. Elbert, M. S. Gordon, J. H. Jensen, S. Koseki, N. Matsunaga, K. A. Nguyen and S. Su, J. Comput. Chem., 1993, 14, 1347–1363 CrossRef CAS.
- M. T. Baei, Monatsh. Chem., 2012, 143, 989–995 CrossRef CAS.
- Y. Hizhnyi, S. Nedilko, V. Borysiuk and A. Shyichuk, Nanoscale Res. Lett., 2017, 12, 1–9 CrossRef CAS PubMed.
- S. Soleimani-Amiri, Heteroat. Chem., 2017, 28, e21380 CrossRef.
- M. T. Baei, A. A. Peyghan, Z. Bagheri and M. B. Tabar, Phys. Lett. A, 2012, 377, 107–111 CrossRef CAS.
- Y. Zhao and D. G. Truhlar, Acc. Chem. Res., 2008, 41, 157–167 CrossRef CAS.
- Y. Zhao and D. G. Truhlar, J. Am. Chem. Soc., 2007, 129, 8440–8442 CrossRef CAS.
- K. Yang, R. Peverati, D. G. Truhlar and R. Valero, J. Chem. Phys., 2011, 135, 044118 CrossRef.
- L. Turi and J. Dannenberg, J. Phys. Chem., 1993, 97, 2488–2490 CrossRef CAS.
- R. G. Parr and R. G. Pearson, J. Am. Chem. Soc., 1983, 105, 7512–7516 CrossRef CAS.
- E. R. Johnson, S. Keinan, P. Mori-Sanchez, J. Contreras-Garcia, A. J. Cohen and W. Yang, J. Am. Chem. Soc., 2010, 132, 6498–6506 CrossRef CAS PubMed.
- T. Lu and F. Chen, J. Comput. Chem., 2012, 33, 580–592 CrossRef CAS PubMed.
- W. Humphrey, A. Dalke and K. Schulten, J. Mol. Graphics, 1996, 14, 33–38 CrossRef CAS PubMed.
- E. Vessally, F. Behmagham, B. Massoumi, A. Hosseinian and L. Edjlali, Vacuum, 2016, 134, 40–47 CrossRef CAS.
- N. L. Hadipour, A. Ahmadi Peyghan and H. Soleymanabadi, J. Phys. Chem. C, 2015, 119, 6398–6404 CrossRef CAS.
- M. Craciun, I. Khrapach, M. Barnes and S. Russo, J. Phys.: Condens. Matter, 2013, 25, 423201 CrossRef CAS PubMed.
- E. Bekyarova, I. Kalinina, X. Sun, T. Shastry, K. Worsley, X. Chi, M. E. Itkis and R. C. Haddon, Adv. Mater., 2010, 22, 848–852 CrossRef CAS PubMed.
- S. Seenithurai, R. K. Pandyan, S. V. Kumar, C. Saranya and M. Mahendran, Int. J. Hydrogen Energy, 2014, 39, 11990–11998 CrossRef CAS.
- Z. Amaniseyed and Z. Tavangar, Int. J. Hydrogen Energy, 2019, 44, 3803–3811 CrossRef CAS.
- S. Cui, N. Zhao, C. Shi, C. Feng, C. He, J. Li and E. Liu, J. Phys. Chem. C, 2014, 118, 839–844 CrossRef CAS.
- X. Chen, P. Gao, L. Guo, Y. Wen, D. Fang, B. Gong, Y. Zhang and S. Zhang, Phys. Lett. A, 2017, 381, 879–885 CrossRef CAS.
- K. McGuire, N. Gothard, P. Gai, M. Dresselhaus, G. Sumanasekera and A. Rao, Carbon, 2005, 43, 219–227 CrossRef CAS.
- S. Sharma and A. Verma, Phys. Rev. B: Condens. Matter Mater. Phys., 2013, 427, 12–16 CrossRef CAS.
- V. de Paul Zoua, A. D. T. Fouegue, M. O. Bouba, R. A. Ntieche and W. Abdoul, Comput. Theor. Chem., 2023, 1222, 114077 CrossRef.
- S. Alwarappan and A. Kumar, Graphene-based Materials: Science and Technology, CRC Press, 2013 Search PubMed.
| This journal is © The Royal Society of Chemistry 2023 |

