 Open Access Article
Deoxyglucose-conjugated persistent luminescent nanoparticles for theragnostic application in fibrosarcoma tumor model†
K. S. Sharma‡
a,
Pooja K. Melwani‡bd,
Hansa D. Yadavb,
Rashmi Joshiad,
Neena G. Shetakebd,
Akhil K. Dubeyc,
Bheeshma Pratap Singha,
Suhas Phapalea,
Prasad P. Phadnis ad,
Rajesh K. Vatsaad,
Raghumani Singh Ningthoujam
 *ad and
Badri N. Pandey*bd
aChemistry Division, Bhabha Atomic Research Centre, Mumbai 400085, India. E-mail: rsn@barc.gov.in
bRadiation Biology & Health Sciences Division, Bhabha Atomic Research Centre, Mumbai 400085, India. E-mail: bnp@barc.gov.in
cBio-organic Division, Bhabha Atomic Research Centre, Mumbai 400085, India
dHomi Bhabha National Institute, Anushakti Nagar, Mumbai 400094, India
First published on 28th April 2023
Abstract
Deoxyglucose conjugated nanoparticles with persistent luminescence have shown theragnostic potential. In this study, deoxyglucose-conjugated nano-particles with persistent luminescence properties were synthesized, and their theragnostic potential was evaluated in fibrosarcoma cancer cells and a tumor model. The uptake of nano-formulation was found to be higher in mouse fibrosarcoma (WEHI-164) cells cultured in a medium without glucose. Nanoparticles showed a higher killing ability for cancer cells compared to normal cells. A significant accumulation of nanoparticles to the tumor site in mice was evident by the increased tumor/normal leg ratio, resulting in a significant decrease in tumor volume and weight. Histopathological studies showed a significant decrease in the number of dividing mitotic cells but a greater number of apoptotic/necrotic cells in nanoparticle-treated tumor tissues, which was correlated with a lower magnitude of Ki-67 expression (a proliferation marker). Consequently, our results showed the potential of our nano-formulation for cancer theragnosis.
1. Introduction
Nanoparticles have demonstrated various bio-medical applications, including diagnosis and therapy of cancer.1,2 Techniques (such as CT, MRI, PET, and SPECT) available for the diagnosis of cancer have limitations and should be employed generally in combination.3 Owing to high costs and radiation/other safety issues of conventional imaging techniques (such as CT, MRI, PET and SPECT), optical imaging could provide an alternative for the diagnosis of cancer in pre-clinical/clinical scenarios.4,5 However, a few limitations of optical imaging (including auto-fluorescence of skin/bio-molecules in green wavelengths and poor penetration of excitation/emission lights to/from the deeper tissues) pose challenges in bioimaging applications. These challenges make dyes emitting in green wavelengths unsuitable for in vivo/clinical applications. In addition, some of the organic dyes are prone to photo-bleaching (e.g. fluorescein), and thus they are unstable.6 Luminescent materials, emitting in near infra-red (NIR 700–900 nm) regions, provide better choices because they overcome these limitations.7 In this direction, persistent luminescence nanomaterials (PLN) gained the attention of researchers as they can be excited outside the body, and after in vivo administration, it provides the flexibility to be imaged at longer durations while being localized to the target organs/tumor tissue.8 This makes the material not required to be excited in tissue and hence overcomes one of the critical limitations of optical imaging. Persistent luminescence is a process in which luminescence continues for few seconds to days even after cessation of the excited light. Scherman et al. pioneered to synthesize PLN with emission in the near infra region and evaluated its localization in 3LL tumor in C57BL/6 mouse.9 Subsequently, several studies reported a development in PLN for biosensing and in vivo imaging.10,11 However, the theragnostic ability of PLN has not been well explored. In one such study, nanoparticles were synthesized with NIR persistent luminescence for imaging and were co-encapsulated with doxorubicin and a photosensitizer (Si-Pc) for chemo-/photodynamic therapy.12 In some more recent studies, PLNs were developed for imaging of glioma13 and mammary14 cancers.Several approaches have been employed for the synthesis of persistent luminescent materials. Luminescent probes, such as semiconductor quantum dots (QDs, e.g. PbSe, PbSe, and PbS), are effective materials but are generally very toxic and unstable.15,16 Optical nanomaterials doped with Lnn+ or dn+ ions provide better chemical/thermal stability and biocompatibility owing to their use in bio-medical applications.17 Generally, Ln3+ ions (e.g. Eu3+, Dy3+, and Tb3+) show very sharp emission because of f–f transitions (forbidden), and transition remains unchanged in various crystallographic environments. In contrast, Ln2+ ions (e.g. Eu2+) show broad emission due to f–d transition but changes in wavelength transition in different crystallographic environments.18 The d2+/d3+ ions, such as Mn2+/Cr3+, have transitions in visible regions, but transitions are broad owing to the effect of surrounding ligands.19 Nanoparticles doped with Lnn+ or dn+ ions having down-conversion (emitted at lower energy or longer wavelength) properties have been used in imaging but pose limitations.17,18 However, Ln3+-doped up-conversion (emitted at higher energy or lower wavelength) nanoparticles have been used for bio-imaging and therapy.20–22 Recently, some nanoparticles have been used in imaging and therapy.23–26 However, these have limitations of weak emission and requirement of diverging lens/proper collimator to excite the required area. Considering the above facts, persistent luminescent nanoparticles are suitable candidates for bio-imaging applications.
In this study, we synthesized nanoparticles doped with trace elements and lanthanides for longer/stronger persistent luminescence. Because trace elements are required in the body and are used as food/food supplements, and lanthanides are commonly used in several biomedical applications, our nano-formulation provides a better bio-compatible material. These nanoparticles were further coated with polyamidoamine (PAMAM) dendrimers owing to their ease of preparation and colloidal stability.27 Compared to normal cells, the malignant cells, for their higher proliferation, in a tumor mass require higher glucose uptake and metabolism. Thus, drugs targeting glucose metabolism have proven efficient in cancer treatment. 2-Deoxyglucose (2-DG) is a synthetic glucose analogue that can be imported into cells but is not metabolized. Even though its uptake is greater in cancer cells, 2-DG impairs the glycolytic pathway and ATP generation, which results in 2-DG being selectively and more cyto-toxic to the cancer cells.28 Based on this principle, 2-fluoro-2-deoxyglucose is used for cancer imaging (PET imaging). There are a few reports in which 2-DG was conjugated with nanoparticles as an anti-cancer strategy.29,30 Hence, in this study, PLN was further conjugated with 2-DG to make the nano-formulation suitable for theragnostic applications (luminescence for cancer diagnosis and 2-DG as an anti-cancer agent).
In this study, we prepared PLNs with the composition of CaMgSiO3: 5% Mn, 5% Eu, and 10% Pr, which were further coated with PAMAM dendrimers. The outer surface of nanoparticles was further functionalized with 2-DG, which not only enhances the accumulation of nanoparticles in cancer cells but also kills them. To obtain persistent luminescence, these nanoparticles were exposed to UV light followed by their administration to mice for bio-distribution and efficacy studies.
2. Experimental methods
Unless mentioned, all chemicals were purchased from Sigma Aldrich (Merck) and used without further purification. Wherever required, the solvents were dried following general procedures. The FT-IR spectra of the samples were obtained using a Bruker Tensor II spectrometer by pasting the sample in a NaCl window. The identification of phase and crystal structures was performed using an analytical powder X-ray diffractometer (XRD) in the range of 20–70° (2θ) with Ni-filtered Cu Kα (1.5405 Å) radiation at 40 kV and 30 mA. The sampling was done by pasting the sample in a glass slide using methanol as a diluter and drying. The luminescence spectrum studies for nanoparticle samples were carried out using the Edinburgh instrument FLS920 attached to a Hamamatsu R955 photomultiplier tube. Other luminescence measurements (in tubes, cells and animals) were carried out using the Live Animal Imaging System (Photon Imager, Biospace, France).2.1. Synthesis of PLNs and functionalization with 2-deoxyribose
Calcium carbonate (99%, Sigma Aldrich), magnesium nitrate hexahydrate (99%, Sigma Aldrich), manganese acetate tetrahydrate (99%, Sigma Aldrich), fumed silicon dioxide (Sigma Aldrich), europium acetate hydrate (99.9%, Sigma Aldrich), and praseodymium nitrate hexahydrate (99.9%, Sigma Aldrich) were mixed according to stoichiometry Ca1−x−y−zMgSi2O6: 0.05 Mn(x), 0.05 Eu(y), 0.10 Pr(z)9,31 using a mortar pestle. After mixing, the pellets of the mixture were prepared, placed in a furnace, and heated at 1300 °C for 5 h under a reducing atmosphere (10% H2, 90% Ar). After cooling to room temperature, the sample was ground using a mortar pestle. The pellets were again heated to 1300 °C for 4 days in a reducing atmosphere (10% H2 and 90% Ar). This synthesized material was taken as PL (persistent luminescent) powder particles. In pellet form, diffusion among ions is high so that a proper stoichiometric compound is formed. We heated samples at 1300 °C in a reducing atmosphere to convert Eu3+ ions to Eu2+ ions, which can give delayed luminescence. PL particles were ground using a mortar pestle for about 1 h to obtain smaller particles. To further reduce the size of the particles, about 50 ml of 5 mM NaOH solution was added to 100 mg of these PL samples, which were kept for 30 minutes under ultrasonication. After 12 h, about 50 ml of the 5 mM HCl was added, and the ultrasonication process was performed for 30 minutes, leading to properly dispersed particles. It was kept for 24 h to obtain proper neutralization. The whole sample was transferred to a centrifuge tube; then, centrifugation was performed at 3000 rpm for 5 minutes. The supernatant was transferred to another tube and then centrifuged at 8000 rpm for 8 min, and the residue was dried using acetone. These nanoparticles (supernatant) were coated with PAMAM dendrimer and further conjugated with 2-DG following the literature.32,33 The nanoparticles coated with 2-DG (10 mg) were suspended in 1 ml of 10% PEG prepared in sterile PBS. The solution was kept overnight on a shaker in the dark for PEG coating of the nanoparticles. The solution was briefly centrifuged for 30 seconds at 500 rpm at room temperature, and clear supernatant containing PEG-coated nanoparticles was collected in a fresh sterile tube and used for further in vitro and in vivo experiments.2.2. Cell culture, viability assay and uptake studies
Mouse fibrosarcoma (WEHI-164) and mouse normal fibroblast (NIH3T3) cell lines were obtained from the National Centre for Cell Sciences, Pune, India. Cells were cultured in DMEM (Himedia, Mumbai) containing 1% antibiotics (Himedia, Mumbai) and 10% foetal bovine serum (Himedia, Mumbai) using routine culture practices.34 Wherever required, either normal level glucose (4.5 g glucose per litre, Himedia, Mumbai) or no glucose (Gibco, USA) DMEM was used.To evaluate the differential uptake of these nanoparticles with or without glucose, 0.25 × 10⁶ WEHI-164 cells were seeded and incubated overnight. The following day, culture media were replaced either with or without glucose media and cells were incubated further for 2 h. After incubation, the cells were treated with nanoparticles (1 mg ml−1) for 3 h. After treatment, the cultures were washed with PBS and harvested by trypsinization. An equal number of cells with or without glucose groups were UV exposed (254 nm; 10 min.) to excite the cellular nanoparticles, and fluorescence was measured using Live Animal Imaging System (Photon Imager, Biospace Lab, France). Alternatively, to confirm this differential uptake, an equal number (0.05 × 10⁶) of WEHI-164 cells were seeded in 24-well plates and cultured without or with glucose medium as described earlier. After that, the cells were treated with nanoparticles for 3 h. After the treatment, the cells were washed with pre-warmed PBS and exposed to UV in a 24-well plate, and fluorescence intensity was measured directly in the wells.
To study the effect of various concentrations of nanoparticles on the viability of tumor and normal cells, an MTT assay was performed. Briefly, 2 × 10³ WEHI-164 or NIH3T3 cells were seeded per well in a 96-well plate and incubated overnight. The following day, the culture media were replaced either with or without glucose media, and the cells were incubated further for 2 h. This was followed by treatment with nanoparticles (1 and 2 mg ml−1) for 3 h. PEG solution (10%) prepared in PBS and without nanoparticles was used as vehicle control. After treatment, cells were washed two times with PBS, added to a fresh medium with glucose and incubated for 48 h. After incubation, the medium was removed and replaced with media containing 0.5 mg ml−1 MTT solution and incubated for 2 h. This was followed by removing MTT-containing media and dissolving the formazan crystals in DMSO. Absorbance was measured at 544 nm using a plate reader (Tecan Infinite 200Pro, Germany).35
2.3. Animal studies
For animal experiments, female BALB/c mice (6–8 weeks old) weighing ∼25 g were obtained from the animal house facility of Bhabha Atomic Research Centre, Mumbai. The animals were housed in a poly propylene standard cage with adequate bedding materials, a commercially available pellet diet and water ad libitum. The room temperature for animal housing was maintained at 20–24 °C with 14 h of light per 10 h of dark cycles. Animal experiments were conducted after the approval of the Institutional Animal Ethical Committee and following its guidelines.To study the localization of nanoparticles in fibrosarcoma tumors, palpable tumors were obtained (after 8 days of intramuscular implantation of 1.5 × 10⁶ cells in the hind leg). After that, nanoparticles prepared in sterile PBS (0.44 mg per 100 μl) were injected i.v. either in a single injection (200 μl-pre-excited with UV) or two injections (100 μl without UV exposure + 200 μl pre-excited with UV having a gap of 30 min). Here, pre-excitement means UV exposure to nanoparticles in tubes and then its administration in the animals. The two injections were made with an interval to minimize the entrapment of nanoparticles using a reticulo-endothelial system, especially the second dose of nanoparticles. Notably, the administration of nanoparticles without UV exposure did not contribute to luminescence. Animals were imaged in an animal imaging system immediately or after different time intervals (10–30 min) to evaluate the fluorescence emission from tumor bearing/normal legs and to calculate the tumor to normal (T/N) fluorescence intensity ratio.
For bio-distribution studies of nanoparticles in tumor bearing mice, animals were sacrificed and organs (such as lungs, liver, spleen, kidney, tumor and normal leg) were harvested after i.v. double dose injection. Because there would not be any fluorescence to obtain fluorescence signals from residual nanoparticles, organs obtained after dissection were exposed to UV light. Then, fluorescence from these organs was measured using the Live Animal Imaging System.36 Results were measured as fluorescent counts and % accumulation. To study the efficacy of nanoparticles in the control of tumor growth, tumor size in control and nanoparticle-treated animals (n = 6) was determined by measuring the volume of normal/tumor bearing legs using a digital Vernier calliper. The volume of the normal leg (at the same position, where tumor volume was measured) in the same mice was subtracted from the tumor volume to obtain the final tumor diameter. The tumor volume was calculated using the following formula: tumor volume = 0.523A2C, where, A: larger diameter and C: smaller diameter.37 Tumor growth delay was calculated as the ratio of the number of days required to reach 400 mm3 tumor volumes for nanoparticles treated and control animals.
2.4. UV exposure, persistent luminescence measurement/imaging
The Live Animal Imaging System (Photon Imager, Biospace Lab, France) with provision for fluorescence and bioluminescence measurement was used for imaging of centrifuge tubes containing nanoparticle samples. The same system was also used for imaging of normal/cancer cells in a 6-well plate, tumor bearing animals and their dissected organs. The acquired images were further used for the determination of fluorescence intensity (in counts or photons/sec/cm2/Sr as units) using the data analysis software (M3 vision) of the imaging system. The intensity scale of the fluorescence signal was represented as a pseudo-colour image, where blue represents the least intense and red represents the highest intensity. Bright field reference images of the samples/animals/organs were automatically obtained using the instrument under low light illumination from light emitting diodes built into the imaging dark box. The two images (fluorescence and bright field) were superimposed using the in-built software of the instrument.For nanoparticles imaging/fluorescence measurement, samples prepared in 10% PEG in PBS (in 1.5 ml polypropylene centrifuge tubes with a wall thickness of about ∼0.8 mm) were exposed to light sources, including UV lights, followed by the transfer of tubes at the imaging stage (maintained at 37 °C) of the Live Animal Imaging System. For whole body imaging, mice were anesthetized (isofurane 5% and carbogen 1 liter per min) for 3 min and placed under online anaesthesia conditions (2% isofurane and carbogen 0.5 liter per min) in the imaging chamber of the in vivo imaging system. Similarly, dissected organs were rinsed with PBS and placed in a 60 mm plastic culture dish in a moist atmosphere to avoid the shrinkage of organs during UV irradiation and subsequent imaging of these organs. The image acquisition of all the samples was performed for 8 min. For UV exposure, an indigenous set up was custom fabricated with UV light sources (254 nm and 355 nm; 8 watts, length: 28.5 cm, and make: Philips) while keeping source to sample distance fixed (11 cm; ESI Fig. S1†).
2.5. Histopathology and immuno-histochemistry
For histopathological examination, formalin-fixed tumor tissue sections (3–5 μm) were processed for paraffin wax embedding, followed by haematoxylin and eosin (H&E) staining to observe histopathological lesions. Two sections after H&E staining from the same tissue were examined by a veterinary pathologist following the standard scoring system and guidelines.38 The scoring is as follows: no abnormality was detected (score: 0) with abnormality in % of cells [<1 (score: 1; minimal), 1–25 (score: 2; mild), 26–50 (score: 3; moderate), 51–75 (score: 4; moderately severe) and 76–100 (score: 5; severe)]. For immuno-histochemistry studies for Ki-67, unstained slides were prepared from the same tissues following the protocols mentioned earlier.36 The slides were observed using a fluorescence microscope attached to a digital camera (Nikon, Japan).2.6. Statistical analysis
Unless specified, all experiments were conducted at least thrice in triplicates. All values are presented as mean ± SEM, and wherever required, data were analysed using Student's t-test. Statistical significance was determined at p < 0.05.3. Results and discussion
3.1. Structural characterization of particles
The XRD pattern of the synthesized phosphor powder is shown in Fig. 1A, and the peaks are consistent with the reported patterns of parent MgSiO3.39 The peaks are highly crystalline. However, after the process of grinding, alkaline and acid digestion, the supernatant contains nanoparticles, which is confirmed by the TEM image of final nanoparticles (deoxyglucose coated), and its SAED pattern shown in Fig. 1B and C. The particle sizes in the range of 20–30 nm are observed. Fig. 1D shows the luminescence spectrum of the nanoparticles after excitation at 413 nm and emission peaks at 575 and 675 nm. Fig. 2 shows the DLS and Zeta potential of 2-DG-coated nanoparticles in a PBS medium. The hydrodynamic diameter of these nanoparticles was found to be 500 nm, and the Zeta potential was about +1 mV.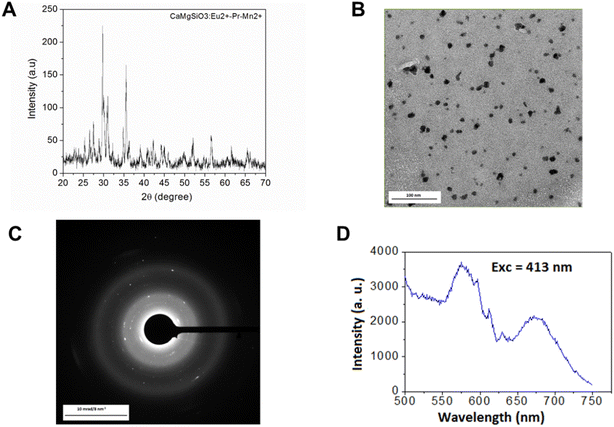 | ||
| Fig. 1 (A) XRD pattern of phosphor sample. (B) TEM image of surface-functionalized nanoparticles, (C) its SAED pattern, (D) emission spectrum of the sample after excitation at 413 nm. | ||
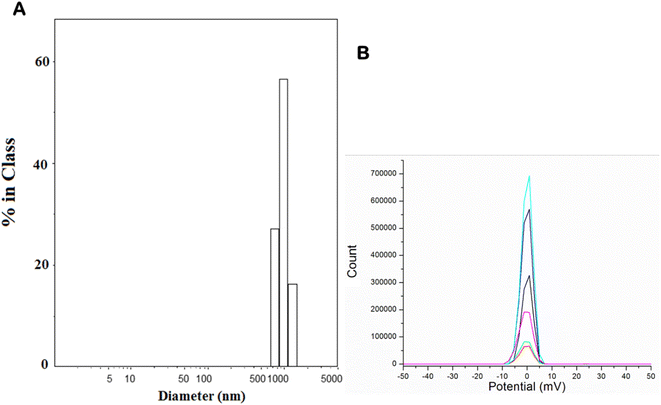 | ||
| Fig. 2 (A) DLS particle size distribution and (B) zeta potential data of surface-functionalized nanoparticles performed at different time scans (shown in different colors). | ||
3.2. Mechanism for persistent luminescence
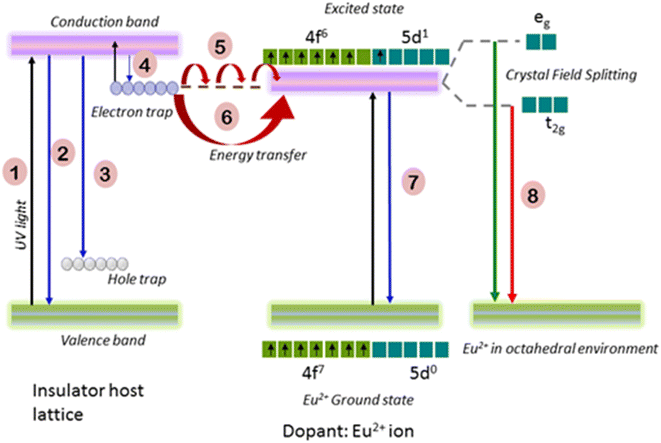
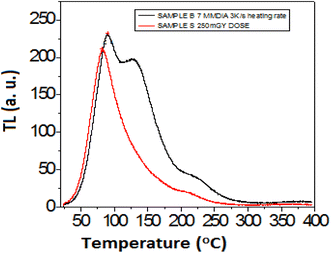
The host lattice has the chemical formula MgSiO3 with a band gap of 5–7 eV. Notably, a polycrystalline host is associated with defects as a source of electrons and hole traps in the conduction and valence bands, respectively. After doping with many metal ions of different ionic sizes and oxidation states with respect to the parent host lattice, many depth traps can be generated. Fig. 3 shows the possible persistence luminescence mechanism from Eu2+-doped M1−xMgSi2O6 (M = Ca, Sr). Upon doping of Eu2+, it can change the number of electrons and holes present in the lattice. Persistent luminescence is explained by the different depths of traps present in the conduction band. After sufficient energy is provided, the trap electrons can recombine with the holes to produce light. Nearby Eu2+ ions can absorb the energy (hν) from excited electrons in the trap level of the host, and thus it induces the slow process of recombination of e-h. Thus, emission from the excited level of Eu2+ occurs.15,40 In the ground, the Eu2+ ion has the outermost electronic configuration 4f7, which is unaffected by surrounding ligands because these 4f electrons are shielded by outermost shells (5s, 5p). Upon excitation at an appropriate wavelength, the electrons can reach the excited electronic level of 4f65d1. The excited electronic configuration (5d1) is perturbed by the surrounding ligand (oxygen) and crystal symmetry to generate splitting (t2g and eg in the case of octahedral coordination EuO6; e and t2 in the case of tetrahedral coordination EuO4). This is referred to as the crystal field effect. This can produce a broad peak from a possible two emission peaks from t2g and eg (overlapping of two peaks). The peak can shift from the blue, green, and yellow regions to the red region depending on the depth of the trap and crystal field stabilization energy. With further co-doping with other rare-earth ions (f block elements) or Mn+ ions (d, p and s block elements), the trap levels can be modified, and dipole–dipole interaction among Eu2−Mnn+ increases.41 In persistent luminescence, the following processes can be possible: migrations of trap electrons through diffusion17 and energy transfer from the excited trap level to the excited state of Eu2+ through a non-radiative process,16 which depends on the frequency factor of surrounding phonons. Emission from Eu2+ could be observed provided there is a sufficient energy transfer from the excited trap level to Eu2+ at the conduction band of the semiconductor. There are simultaneous transitions (up and down) within trap and conduction levels18 when sufficient thermal energy is provided; thus, thermoluminescence may arise. In our samples, after exposure to UV light, charging occurs at the electron trap level of the semiconductor (conduction band). Part of the trapped energy is released, and this is transferred to the nearby excited level of Eu2+. The charging of the trap level of PLN was supported by the thermo-luminescence property (emission peak at 82 °C) of the material (Fig. 4) obtained after 0.25 Gy gamma irradiation, which would act as an alternate energy source, resulting in thermoluminescence.3.3. Optimization of parameters for the persistent luminescence of nanoparticles
Initial experiments were performed to optimize the parameters required for the in vitro and in vivo experiments. Because the nanoparticles are of persistent luminescence in nature, the wavelength of light required for optimal fluorescence was determined. The nanoparticle supernatant obtained (as mentioned in materials and methods; in 200 μl) after PEG coating was transferred to 0.5 ml centrifuge tubes, which were excited with 254/355 nm UV light sources for 10 min, followed by the measurement of fluorescence immediately after light exposure. Compared to the 355 nm light source, when nanoparticles were exposed to 254 nm light, they showed ∼100 fold higher fluorescence, indicating that 254 nm is the optimum light source for exciting these nanoparticles (ESI Table 1†). A strong fluorescence light observed from these nanoparticles is shown in the centrifuge tubes (ESI Fig. S2†). To optimize the exposure time, nanoparticles were exposed to 254 nm UV light for increasing exposure periods (2–15 min), followed by the measurement of fluorescence immediately after exposure (ESI Fig. S3†). Our results showed the saturation of fluorescence intensity for an exposure period of 10 min and beyond. Based on these optimization experiments, further experiments were performed by exposing nanoparticles using a 254 nm UV light source for 10 min. To evaluate the decay kinetics for persistent luminescence, the nanoparticles were exposed to 254 nm UV light for 10 min, followed by the measurement of fluorescence for up to 120 min. The results were expressed in terms of fluorescence and relative intensities. Our results showed fluorescence decay in UV-exposed nanoparticles with ∼90% decay in fluorescence within 20 min of exposure (ESI Fig. S4†). During longer periods, an insignificant change in fluorescence was observed. These results suggest the suitability of these nanoparticles for imaging at shorter periods (∼20 min) after exposure.3.4. Uptake of nanoparticles in cancer cells and viability in normal and cancer cells
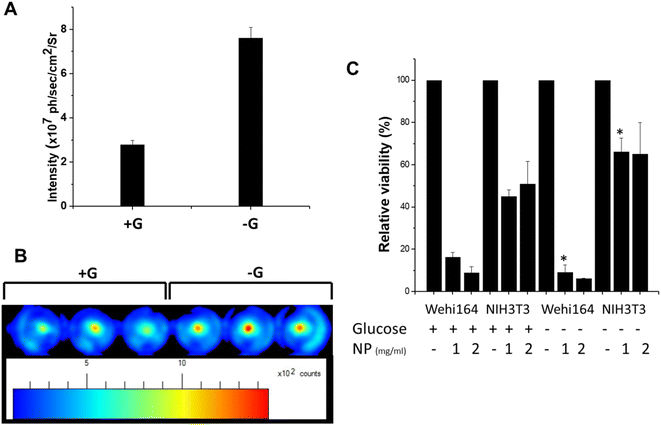
These nanoparticles are conjugated with deoxyglucose for better selectivity to tumor cells with the expected higher uptake when cells are starved with glucose. Hence, to evaluate the uptake of these nanoparticles, mouse fibrosarcoma cells (WEHI-164) were cultured in a medium either with normal glucose (+G) or without glucose (−G). The cultures after nanoparticle treatment were washed with PBS and harvested by trypsinization. An equal number of cells from the +G and −G groups were UV exposed to excite the internalized nanoparticles, followed by the measurement of fluorescence. Our results showed a significant increase in fluorescence when cells were treated with nanoparticles in a medium without glucose (Fig. 5A), suggesting higher uptake of nanoparticles in cancer cells under glucose starvation conditions. These results were further correlated with fluorescence images, which also showed stronger fluorescent wells containing nanoparticle-treated cells in the medium without glucose (Fig. 5B). Further experiments were conducted to study the effect of these nanoparticles on the viability of normal and cancer cells. For this, mouse fibrosarcoma (WEHI-164) and its counterpart normal mouse fibroblasts (NIH3T3) were treated with two concentrations (1 and 2 mg ml−1) of nanoparticles for 3 h with/without glucose containing media. Treated cells were washed and further cultured in glucose containing medium for 48 h for MTT assay. MTT assay showed higher efficacy of nanoparticles to kill WEHI-164 cells compared to NIH3T3 cells in both with and without glucose (Fig. 5C). A lower (1 mg) concentration of nanoparticles led to a significant killing of WEHI-164 cells in the absence of glucose (−G) compared to the presence of glucose (+G). However, this difference was insignificantly different at higher (2 mg) concentrations. The cell viability of WEHI164 cells was relatively lower when cells were treated with nanoparticles without glucose media, corroborating with higher uptake of nanoparticles. Authors may also hypothesize that the increase in viability in the absence of glucose in NIH3T3 cells could be due to the increased induction of survival mechanisms and extended life span caused by glucose restriction as reported previously in normal lung fibroblasts, which needs further investigation.423.5. Localization of nanoparticles in fibrosarcoma tumors
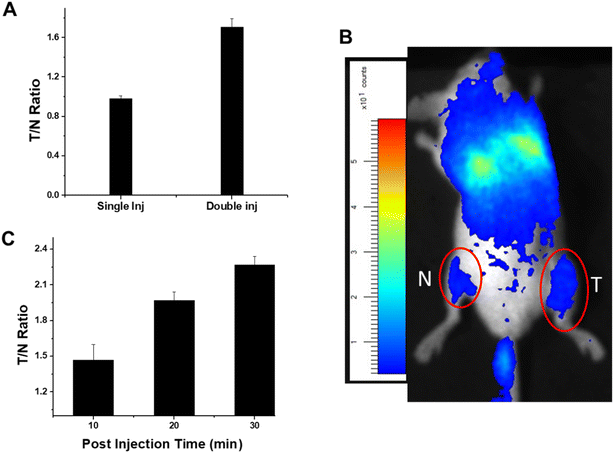
After in vitro evaluation of nano-formulation, its tumor targeting and growth inhibitory effects were studied in fibrosarcoma tumor bearing mice. For this, the animals were injected intravenously (i.v.) either with a single injection (200 μl-pre-excited with UV) or two injections (100 μl without UV exposure + 200 μl pre-excited with UV with a gap of 30 min) of nanoparticles. The purpose of the double injection was to engage the reticulo-endothelial system after the first dose of nanoparticles, which facilitated better tumor targeting at the second dose. Animals were imaged for tumor and normal legs for the calculation of the tumor to normal (T/N) ratio. It was interesting to observe that compared to a single injection, the T/N ratio was almost double when nanoparticles were injected in two doses (Fig. 6A), suggesting better tumor targeting during double injections. The typical localization of nanoparticles to the tumor site after double injection is shown in Fig. 6B. These results showed that the thoracic (both lungs) and abdominal (liver) regions were the major areas of nanoparticle accumulation after the i.v. injection. Moreover, compared to the normal leg, the tumor leg showed a higher accumulation of nanoparticles. To understand the kinetics of nanoparticle accumulation at the tumor site, the T/N ratio was calculated at different post-injection periods (10–30 min). Our results showed a significant accumulation of nanoparticles at the tumor site, as evident by an increased T/N ratio with an increase in time (Fig. 6C).3.6. Organ bio-distribution of nanoparticles in tumor bearing animals
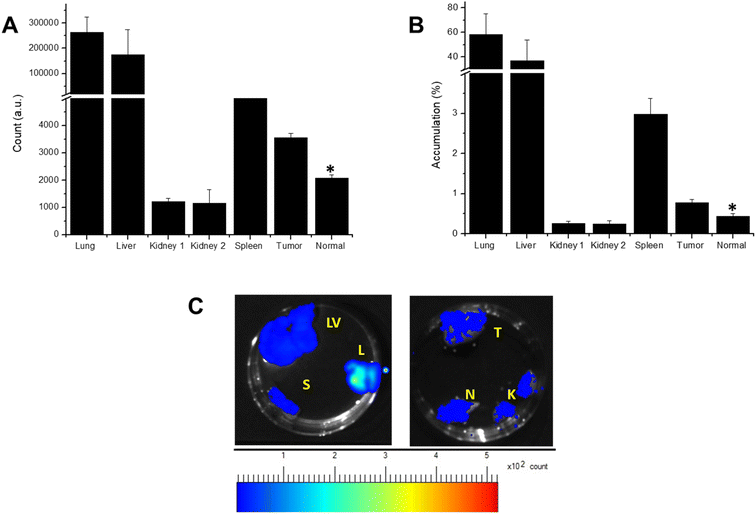
To study the bio-distribution of nanoparticles after i.v. injection, the organs were collected 18 days post-treatment after sacrificing the animals. At this time point, nanoparticles localized to organs did not give fluorescence by themselves. After dissection, these organs were UV exposed to quantify the localization of nanoparticles in these organs. Fluorescence of these organs was measured using the Live Animal Imaging System, and the results were shown as fluorescent counts (Fig. 7A) and % accumulation (Fig. 7B). A significant accumulation of nanoparticles was observed in the lungs, liver and spleen, the major reticulo-endothelial system, suggesting the limitation of our nano-formulation and the need for better tumor targeting in the future. Our results also showed significant localisation of nanoparticles to the tumor site than the normal leg, which agrees with typical images shown in Fig. 7C. In addition, a careful evaluation of the tumor images showed a uniform distribution of fluorescence signals, suggesting the homogenous distribution of nanoparticles within the tumor mass. Fluorescent signals observed in the kidneys suggest urinary clearance of nanoparticles.3.7. Effect of nanoparticles on tumor growth
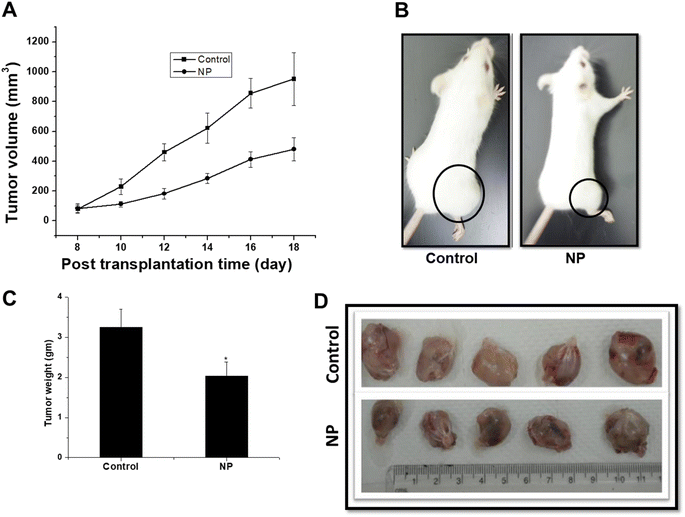
To evaluate the efficacy of these nanoparticles in tumor growth inhibition, nanoparticles were administered intravenously in the tumor bearing animals, followed by tumor growth measurement. Compared to the control, a significant decrease in tumor volume was observed when the animals were treated with nanoparticles (Fig. 8A and B). Tumor growth delay in nanoparticle-treated animals was found to be delayed by 6 days with tumor growth delay ∼1.5. These results were also evident in the decrease in tumor weight in nanoparticle-treated animals (Fig. 8C), which is reflected by decrease in the size of the dissected tumors (Fig. 8D). Since, our experiments showed localization of nanoparticles to reticulo-endothelial system, a set of experiments were also performed to evaluate the efficacy of nanoparticles when administered intra-tumorally (as an alternate route of administration). It may be pertinent to mention here that even though intra-tumoral is not preferred clinical route of drug administration but through this route nanoparticles are not needed to pass through the reticulo-the endothelial system while reaching a tumor site. Similar to i.v. injection, a significant decrease in tumor volume was observed after the intra-tumoral injection of nanoparticles, which was correlated with a decrease in weight in dissected tumors (ESI Fig. S5 A–D†). However, in the case of the intra-tumor injection of nanoparticles, a lower magnitude of tumor control was found than i.v. injection. Such a difference may be associated with a more uniform distribution of nanoparticles in tumors in the case of i.v. because they are delivered through the blood supply, thus resulting in the accessibility of the nanoparticles to a higher number of cancer cells for their killing.3.8. Histopathological changes in tumors after the treatment of nanoparticles
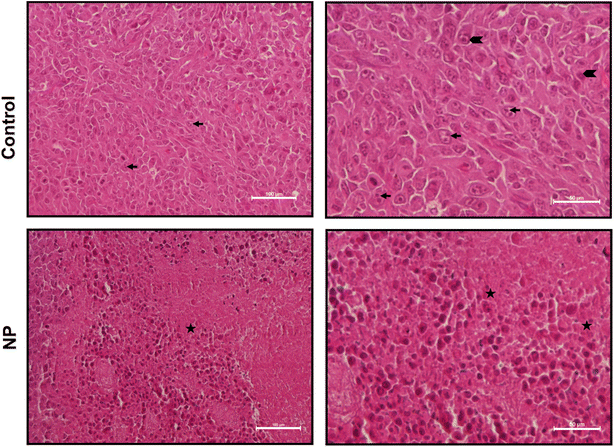
Histopathological examination was performed on tumors obtained from nanoparticle-treated animals (Fig. 9). In control tumor samples, severe to moderate anaplasia was observed with 3–5 mitotic cells/high power fields (hpf; 40× objective). Compared to control tumor samples, a significant decrease in the number of mitotic cells (1–3 mitotic cells/hpf), a greater number of apoptotic/necrotic cells and disorganised tissue organisation was observed in nanoparticle-treated tumor samples.3.9. Treatment with NP decreased proliferation in tumor cells
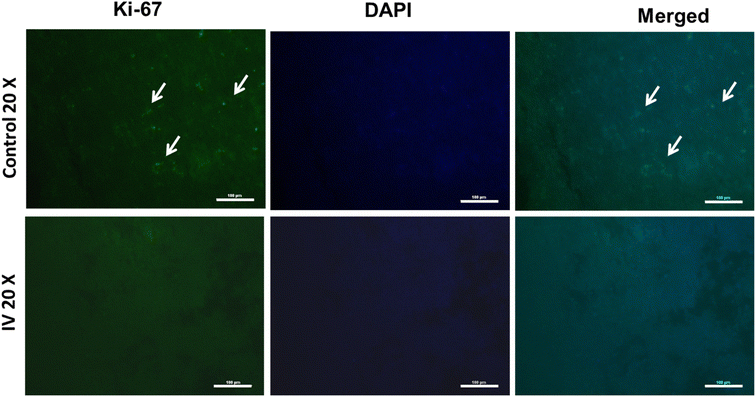
To further understand the mechanism of tumor regression after the treatment of nanoparticles, the magnitude of Ki-67 (a marker of proliferation) was investigated in control and treated tumor tissues by immune-histochemistry (Fig. 10). Tumor tissue obtained from animals treated with nanoparticles showed lower Ki-67 expression than the control, suggesting lower proliferation of tumor cells in nanoparticle-treated animals than the control. These results agree with tumor growth measurement (Fig. 8) and histopathological analysis (Fig. 9).4. Conclusions
This study showed the synthesis and characterization of nanoparticles with persistent luminescence. Moreover, our results showed higher killing of tumors than normal cells after the treatment of these nanoparticles. Tumor targeting and its efficacy in inhibiting tumor growth were further shown in mouse fibrosarcoma tumor models using animal imaging and tumor growth measurements, respectively. The mode and mechanism of tumor growth inhibition were found to be apoptotic cell death and a decrease in tumor cell proliferation after the treatment of nanoparticles. Thus, our results showed the development of nano-formulation with the potential for theragnostic applications of cancer.Ethical statement
Animals were obtained from animal house facility of Bhabha Atomic Research Centre (BARC). All animal experiments were conducted adhering to the Institutional Animal Ethical Committee guidelines.Author contributions
Shitaljit Sharma: synthesis and initial characterization of nanoparticles; Pooja Melwani: cell culture, animal experiments, data analysis and manuscript writing; Hansa D. Yadav: luminescence experiments using Live Animal Imaging System for decay kinetics and optimum luminescence; Rashmi Joshi: nanoparticles characterization using DLS, zeta potential; Neena Shetake: conceptualization and design of experiments; initial in vitro cell culture experiments; manuscript writing; Akhil K. Dubey: surface functionalization experiments; Bheeshma Pratap Singh: nanoparticles characterization using TEM and XRD; Suhas Phapale: synthesis of persistent luminescent materials in H2/Ar atmosphere; Prasad P. Phadnis: surface functionalization experiments; R. K. Vatsa: scientific discussion; Raghumani Singh Ningthoujam: conceptualization and design of experiments; data analysis and manuscript writing; Badri N. Pandey: conceptualization and design of experiments; data analysis and manuscript writing.Conflicts of interest
There are no conflicts to declare.Acknowledgements
Authors would like thank Dr A. K. Tyagi, Director, Chemistry Group for his support during this work. Authors thank Dr Mishra for thermo luminescence studies.References
- M. S. Al-Zoubi and R. M. Al-Zoubi, Crit. Rev. Oncol./Hematol., 2022, 174, 103677 CrossRef PubMed.
- R. Taléns-Visconti, O. Díez-Sales, J. V. de Julián-Ortiz and A. Nácher, Int. J. Mol. Sci., 2022, 23, 4249 CrossRef PubMed.
- CT and MRI in Oncology, ed. D. Buthiau and D. Khayat, Springer Berlin, Heidelberg, 1998 Search PubMed.
- D. L. Farkas, Molecules, 2021, 26, 6651 CrossRef CAS PubMed.
- H. M. Schouw, L. A. Huisman, Y. F. Janssen, R. H. J. A. Slart, R. J. H. Borra, A. T. M. Willemsen, A. H. Brouwers, J. M. van Dijl, R. A. Dierckx, G. M. van Dam, W. Szymanski, H. H. Boersma and S. Kruijff, Eur. J. Nucl. Med. Mol. Imaging, 2021, 48, 4272–4292 CrossRef CAS PubMed.
- M. J. Schnermann, Nature, 2017, 551, 176–177 CrossRef CAS PubMed.
- N. nan Zhang, C. ying Lu, M. jiang Chen, X. ling Xu, G. feng Shu, Y. zhong Du and J. song Ji, J. Nanobiotechnol., 2021, 19, 132 CrossRef PubMed.
- N. Liu, X. Chen, X. Sun, X. Sun and J. Shi, J. Nanobiotechnol., 2021, 19, 113 CrossRef CAS PubMed.
- Q. le Masne de Chermont, C. Chanéac, J. Seguin, F. Pellé, S. Maîtrejean, J.-P. Jolivet, D. Gourier, M. Bessodes and D. Scherman, Proc. Natl. Acad. Sci. U. S. A., 2007, 104, 9266–9271 CrossRef CAS PubMed.
- H. Zheng, C. Yuan, J. Cai, W. Pu, P. Wu, C. Li, G. Li, Y. Zhang, J. Zhang, J. Guo and D. Huang, J. Nanobiotechnol., 2022, 20, 134 CrossRef CAS PubMed.
- D. G. Calatayud, T. Jardiel, E. Cordero-Oyonarte, A. C. Caballero, M. Villegas, A. Valle-Noguera, A. Cruz-Adalia and M. Peiteado, Int. J. Mol. Sci., 2022, 23, 3410 CrossRef CAS PubMed.
- J. Wang, J. Li, J. Yu, H. Zhang and B. Zhang, ACS Nano, 2018, 12, 4246–4258 CrossRef CAS PubMed.
- J. Kong, R. Zou, G. L. Law and Y. Wang, Sci. Adv., 2022, 8, 7077 CrossRef PubMed.
- S. Wu, Y. Li, R. Zhang, K. Fan, W. Ding, L. Xu and L. Zhang, Talanta, 2021, 221, 121435 CrossRef CAS PubMed.
- R. S. Ningthoujam, A. Gautam and N. Padma, Phys. Chem. Chem. Phys., 2017, 19, 2294–2303 RSC.
- T. Jamieson, R. Bakhshi, D. Petrova, R. Pocock, M. Imani and A. M. Seifalian, Biomaterials, 2007, 28, 4717–4732 CrossRef CAS PubMed.
- C. Bouzigues, T. Gacoin and A. Alexandrou, ACS Nano, 2011, 5, 8488–8505 CrossRef CAS PubMed.
- R. S. Ningthoujam, in Synthesis, Characterization and Applications of Multifunctional Materials Material Science and Technologies, ed. S. B. Rai and Y. Dwivedi, Nova Science Publishers Inc, USA, 2012, pp. 145–182 Search PubMed.
- S. Ye, E.-H. Song, Q.-Y. Zhang, S. Ye, E. H. Song and Q. Y. Zhang, Adv. Sci., 2016, 3, 1600302 CrossRef PubMed.
- A. K. Soni, R. Joshi, B. P. Singh, N. N. Kumar and R. S. Ningthoujam, ACS Appl. Nano Mater., 2019, 2, 7350–7361 CrossRef CAS.
- D. J. Gargas, E. M. Chan, A. D. Ostrowski, S. Aloni, M. V. P. Altoe, E. S. Barnard, B. Sanii, J. J. Urban, D. J. Milliron, B. E. Cohen and P. J. Schuck, Nat. Nanotechnol., 2014, 9, 300–305 CrossRef CAS PubMed.
- W. Shao, G. Chen, A. Kuzmin, H. L. Kutscher, A. Pliss, T. Y. Ohulchanskyy and P. N. Prasad, J. Am. Chem. Soc., 2016, 138, 16192–16195 CrossRef CAS PubMed.
- S. Zhou, Q. Shang, N. Wang, Q. Li, A. Song and Y. Luan, J. Controlled Release, 2020, 328, 617 CrossRef CAS PubMed.
- M. Zhang, X. Qin, Z. Zhao, Q. Du, Q. Li, Y. Jianga and Y. Luan, Nanoscale Horiz., 2022, 7, 198 RSC.
- M. Zhang, X. Qin, W. Xu, Y. Wang, Y. Song, S. Garg and Y. Luan, J. Colloid Interface Sci., 2021, 594, 493 CrossRef CAS PubMed.
- Y. Zhou, X. Ren, Z. Hou, N. Wang, Y. Jiang and Y. Luan, Nanoscale Horiz., 2021, 6, 120 RSC.
- D. Guo, X. Zhou, N. Muhammad, S. Huang and Y. Zhu, J. Chromatogr. A, 2022, 1669, 462960 CrossRef CAS PubMed.
- B. Pajak, E. Siwiak, M. Sołtyka, A. Priebe, R. Zieliński, I. Fokt, M. Ziemniak, A. Jaśkiewicz, R. Borowski, T. Domoradzki and W. Priebe, Int. J. Mol. Sci., 2019, 21, 234 CrossRef PubMed.
- K. Sasaki, S. Nishina, A. Yamauchi, K. Fukuda, Y. Hara, M. Yamamura, K. Egashira and K. Hino, Cell. Mol. Gastroenterol. Hepatol., 2021, 11, 739–762 CrossRef CAS PubMed.
- S. Jin, Z. Du, H. Guo, H. Zhang, F. Ren and P. Wang, Int. J. Mol. Sci., 2019, 20, 697 CrossRef CAS PubMed.
- X. J. Wang, D. Jia and W. M. Yen, J. Lumin., 2003, 102–103, 34–37 CrossRef CAS.
- J. Zhang, D. Liu, M. Zhang, Y. Sun, X. Zhang, G. Guan, X. Zhao, M. Qiao, D. Chen and H. Hu, Int. J. Nanomed., 2016, 11, 3677–3690 CrossRef CAS PubMed.
- Y. Wang, P. Su, S. Wang, J. Wu, J. Huang and Y. Yang, J. Mater. Chem. B, 2013, 1, 5028–5035 RSC.
- S. L. Gawali, K. C. Barick, N. G. Shetake, V. Rajan, B. N. Pandey, N. N. Kumar, K. I. Priyadarsini and P. A. Hassan, ACS Omega, 2019, 4, 11728–11736 CrossRef CAS PubMed.
- N. G. Shetake, A. Kumar and B. N. Pandey, Biochim. Biophys. Acta, Gen. Subj., 2019, 1863, 857–869 CrossRef CAS PubMed.
- S. Desai, N. Srambikkal, H. D. Yadav, N. Shetake, M. M. S. S. Balla, A. Kumar, P. Ray, A. Ghosh and B. N. Pandey, PLoS One, 2016, 11, e0161662 CrossRef PubMed.
- N. G. Shetake, A. Kumar, S. Gaikwad, P. Ray, S. Desai, R. S. Ningthoujam, R. K. Vatsa and B. N. Pandey, Int. J. Hyperthermia, 2015, 31, 909–919 CrossRef CAS PubMed.
- C. M. Peter, V. John, M. K. Charlotte, F. B. Julia, A. E. Bradley, G. G. Dawn, H. Takanori, H. Ronald, K. Wolfgang, K. Rupert, N. Thomas, R. Susanne and T. Takuji, Toxicol. Pathol., 2012, 40, 7S–13S Search PubMed.
- M. E. Song, J. S. Kim, M. R. Joung, S. Nahm, Y. S. Kim, J. H. Paik and B. H. Choi, J. Am. Ceram. Soc., 2008, 91, 2747–2750 CrossRef CAS.
- K. van den Eeckhout, P. F. Smet and D. Poelman, Materials, 2010, 3, 2536–2566 CrossRef CAS.
- A. D. Sontakke, A. J. van Bunningen, F. T. Rabouw, S. Meijers and A. Meijerink, J. Phys. Chem. C, 2020, 124, 43 CrossRef.
- Y. Li, L. Liu and T. O. Tollefsbol, FASEB J., 2010, 24, 1442 CrossRef CAS PubMed.
Footnotes |
| † Electronic supplementary information (ESI) available. See DOI: https://doi.org/10.1039/d3ra01169k |
| ‡ Equal contributors. |
| This journal is © The Royal Society of Chemistry 2023 |

