 Open Access Article
Structures and electric properties of PANI/polymorphic-ZrO2 composites
Munaji*ab,
Mochamad Zainuria and
Triwikantoro *a
*a
aDepartment of Physics, Faculty of Science and Data Analytics, Institut Teknologi Sepuluh Nopermber, Kampus ITS Sukolilo, Surabaya, 60111, Indonesia. E-mail: triwi@physics.its.ac.id
bDepartment of Mechanical Engineering, Faculty of Engineering, Universitas Muhammadiyah Ponorogo, Jl. Budi Utomo 10, Ponorogo, 63471, Indonesia
First published on 3rd April 2023
Abstract
A polyaniline/zirconia (PANI/ZrO2) composite has been successfully synthesized using an in situ method with HCl used as a doping agent, SDBS as a surfactant and APS as an oxidant. The filler variations were comprised of various phases, which are amorphous, tetragonal, monoclinic and a mixture of tetragonal–monoclinic and varied volumes of 0, 2.5, 5.0, 7.5 and 10%. Amorphous, tetragonal and a mixture of tetragonal–monoclinic ZrO2 were obtained from purifying natural zircon sand (ZrSiO4), while monoclinic ZrO2 was obtained from commercial materials. The structure characterisation was performed using X-ray diffraction and Fourier Transform Infrared (FTIR). The morphology was observed using a Scanning Electron Microscope (SEM). The electrical properties of impedance, dielectric constant and dielectric losses, and electrical conductivity were characterised using Electrochemical Impedance Spectroscopy (EIS). The research results showed that the filler phase had an effect towards the electrical properties of PANI/ZrO2. The impedance of PANI as well as PANI/ZrO2 showed a constant phase element (CPE) behaviour with impedance values of 9.87, 9.16, 13.31, and 79.59 kΩ for the composites with amorphous filler, monoclinic filler, tetragonal filler, and tetragonal–monoclinic filler, respectively. The dielectric constant and dielectric losses decreased with the increasing amount of ZrO2 filler. The AC conductivity of PANI/ZrO2 was found to be lower when compared to PANI for all of the filler phases and volume fractions.
1. Introduction
Zirconium oxide (ZrO2), or more widely known as zirconia, is a ceramic material with excellent heat resistance due to its high melting point. This material has three polymorphism phase possibilities, which are tetragonal, monoclinic, and cubic.1 ZrO2 can be synthesized from zircon (ZrSiO4) using the alkali fusion method. Zircon is obtained from purifying zircon sand and extracted into ZrO2 (amorphous, tetragonal, monoclinic) and other products such as SiO2.2 The extracted ZrO2 has been further researched by combining it with Al2O3 to produce fake teeth.3 Other research studies have reported the use of zirconia as an anti-corrosion coating material.4,5 Besides being combined with another ceramic material, ZrO2 has also been extensively studied as a filler for polymer matrix composites, such as PPy/ZrO2,6 PMMA/ZrO2,7,8 PVDF/ZrO2,9 and PANI/ZrO2.10–12Polyaniline (PANI) is a conductive polymer that has been widely researched as an individual or being combined with other materials. Polyaniline is relatively easy to fabricate, one of which is by using the in situ polymerisation.13,14 The ease in fabricating polyaniline allows it to be combined with other materials, such as metal oxide, commonly referred to as a PANI/metal oxide composite. PANI/metal oxide composites provide a combination of various material properties. Some PANI/metal oxide composites, for example, PANI/V2O5, are used for energy storage15 and high energy density supercapacitors.16 The combination of PANI and WO3 to form a PANI-WO3 composite can be used for gas sensors.17 In addition, the PANI/TiO2 composite has a photocatalytic activity that can be used as a water-splitting photoanode.18 PANI-Co3O4 composites are reported to have potential applications as LPG gas sensors at room temperature.19 Concerning electrical conductivity, the presence of Mn3O4 as a filler in the PANI-Mn3O4 composite gives an increase of up to 1000 times greater than PANI.20
In addition to the several benefits of using PANI composites described above, polyaniline has been further studied as an anticorrosive coating material, where the anticorrosive properties are affected by the preparation method.21 In several explorations of anticorrosive properties, a combination of polyaniline with metal oxides such as PANI/SiO2,22 PANI/TiO2,23 and PANI/ZrO2 (ref. 24) have been studied. The anticorrosive behavior of PANI/ZrO2 is related to the electrical properties. Thus, a comprehensive initial study is needed regarding the electrical properties of PANI/ZrO2. Researches on PANI/ZrO2 could be reviewed from different standpoints in terms of the filling materials used for ZrO2, whereby among them are the material source, synthesis methods, particle sizes, and structures/phases. A study on the synthesis and characterisation of PANI/ZrO2 composite generally use commercial ZrO2 as a filler.10,24–26 Other researches have specifically reported on ZrO2 phase being used as filler of PANI/ZrO2 composite, which are monoclinic25,27 and tetragonal.10 Some literature specifically reported on the types of phases being used. In this paper, the synthesis and characterisation of PANI/ZrO2 composite with ZrO2 being synthesized from natural zircon sand is reported,2,3 whereby the zircon sand takes the form of four phase polymorphism, which are amorphous, tetragonal, monoclinic, and a mixture of tetragonal–monoclinic. This becomes an interesting topic to be discussed in order to find out whether there is a characteristic difference of PANI/ZrO2 composite with ZrO2 synthesized from natural zircon sand if the filler phases are different. This paper explores the relations between the filler phases with the electrical properties of the composite, which includes impedance, dielectric permittivity and AC conductivity.
2. Experimental
2.1 Materials
Aniline and ammonium peroxodisulfate (APS) were both obtained from Merck, Germany. HCl, NH4OH, and NaOH were purchased from SAP Chemical, Indonesia. While Sodium dodecylbenbenzene sulphonate (SDBS) was acquired from HiMedia Laboratories, India. Amorphous, tetragonal, and tetragonal–monoclinic phases ZrO2 amorphous powder were acquired from zircon sand extraction using the alkali fusion method as outlined in the previous research,2 while monoclinic ZrO2 was gained from commercial materials.2.2 Synthesis of PANI/ZrO2 composite
PANI/ZrO2 composite was synthesized using the in situ polymerisation method. The first step was making a solution A with the following procedure: 4 ml of aniline was added into 100 ml of HCl 0.9 M before going through a procedure of ultrasonication for 1 hour. Next, zirconia powder was added and ultrasonicated again for 1 hour. On the other hand, 3.05 grams of SDBS was dissolved into 50 ml of water distillation and dripped bit by bit into aniline/HCl/ZrO2 while being stirred at 500 rpm. Solution B was made by adding 8 grams of APS into 5 ml of distilled water and stirred until a clear colour was obtained.Next, solution A was placed in an ice pool at 0–6 °C and titrated with solution B while being stirred at 500 rpm. The process of titration was carried out until there was no more solution B left and solution A changed colour to blue. After carrying out the process of titration, the solution was kept being stirred for 3 hours. Subsequently, an adequate amount of methanol was added to emulsify the solution before being washed three times with distilled water and then filtered. The results were dried at 60 °C until a green colour was obtained. As a comparison, PANI was also synthesized with the same procedure, with the only difference being ZrO2 was used to produce solution A.
2.3 Characterisation
X-Ray diffraction (Philips X’PERT MPD) was used to identify the phases in ZrO2, PANI, and PANI/ZrO2. SEM-EDX (Hitachi Flexsem 1000) was used to observe the microstructures. The electrical properties were studied using Electrochemical Impedance Spectroscopy (EIS) Gamry Reference 600. To measure the impedance, the PANI and PANI/ZrO2 powders were turned into pellets with a diameter of 13 mm and a thickness of 4 mm.3. Results and discussion
3.1 XRD studies
The X-ray diffraction patterns of ZrO2, PANI, and PANI/ZrO2 are shown in Fig. 1(a)–(d). The prefixes a-, t-, and m-in front of the chemical formula ZrO2 indicate amorphous, tetragonal and monoclinic phases, respectively. Meanwhile, the tm-prefix indicates that the sample contains two phases, tetragonal and monoclinic. The elements within amorphous zirconia are listed in Table 1. Amorphous ZrO2 was obtained by extracting ZrSiO4 using the alkali fusion method. From Table 1, it is seen that Zr comprises of the majority of elements. Other elements that were also detected include Hf, Si and Ti, however these elements were found at rather low percentages (approximately only at 2%). The Zr percentage obtained was higher compared to the other researches.2,3 The analysis results using Rietica for ZrO2 are displayed in Table 2. Three phases were found within the tm-ZrO2 sample, which are monoclinic (PDF No. 00-083-0940), tetragonal (PDF No. 00-079-1764) and tetragonal ZrSiO4 (PDF No. 00-083-1375).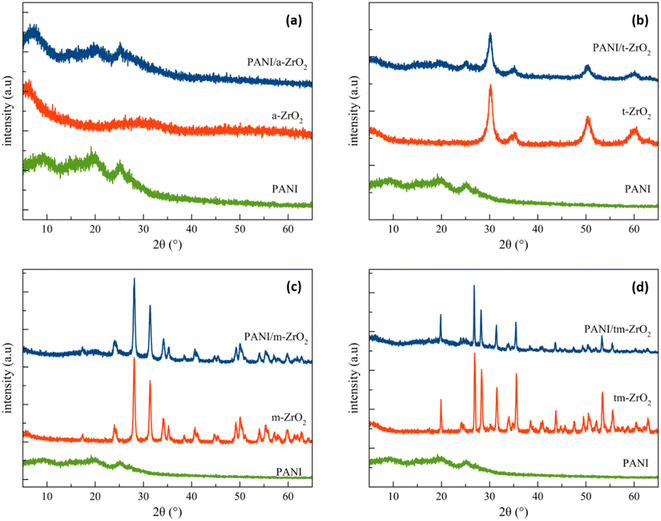 | ||
| Fig. 1 X-ray diffraction pattern of PANI, ZrO2 and PANI/ZrO2. Prefixs a, t, m and tm refers to amorphous, tetragonal, monoclinic and tetragonal–monoclinic, respectively. | ||
| Elements | wt% | Elements | wt% |
|---|---|---|---|
| Zr | 93.18 | Y | 0.21 |
| Hf | 2.57 | Fe | 0.15 |
| Si | 2.20 | Al | 0.09 |
| Ti | 1.23 | Bi | 0.05 |
| Ca | 0.26 | V | 0.04 |
| Sample | Phases | wt% | Cell parameter (Å) | Refinement parameter | |||
|---|---|---|---|---|---|---|---|
| a | b | c | R-Bragg | GoF | |||
| t-ZrO2 | Tetragonal | 100 | 3.61 | 3.61 | 5.22 | 0.92 | 2.07 |
| m-ZrO2 | Monoclinic | 100 | 5.14 | 5.21 | 5.31 | 4.20 | 1.62 |
| Tetragonal-ZrO2 | 9.67 | 3.59 | 3.59 | 5.14 | 1.19 | 1.53 | |
| tm-ZrO2-ZrSiO4 | Monoclinic-ZrO2 | 45.52 | 5.13 | 5.14 | 5.33 | 1.43 | 1.53 |
| Tetragonal-ZrSiO4 | 44.81 | 6.61 | 6.61 | 5.99 | 5.01 | 1.53 | |
3.2 FTIR analysis
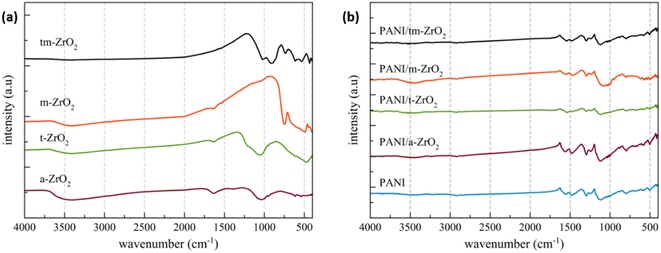
The FTIR spectrum of ZrO2, PANI and PANI/ZrO2 are all shown in Fig. 2. The functional group analysis that matches with the spectrum peaks are listed in Tables 3 and 4. From both of these tables, the peaks of ZrO2, PANI, and PANI/ZrO2 all can be obtained. Some of the peaks experienced a shift. These occurred to the peak at 665.46 cm−1 for PANI which shifted to 663.53 cm−1 for PANI/a-ZrO2, and likewise the peak for PANI/t-ZrO2 shifted to 667.39 cm−1 for PANI/tm-ZrO2. Both of these indicate that there were interactions between PANI with ZrO2.| Functionality [Reference] | a-ZrO2 | Wavenumber (cm−1) | ||
|---|---|---|---|---|
| t-ZrO2 | m-ZrO2 | tm-ZrO2 | ||
| Zr–O bending vibration33 | 426.28; 484.15 | 472.58 | 443.64; 491.86 | 434.00 |
| Zr–O–Zr bond34 | 952.87; 1041.60 | 954.80; 1051.24 | — | 910.43; 1022.31 |
| –(OHO)– and –(HOH)–6 | 1386.86; 1629.90 | 1635.69 | 1637.62 | — |
| OH stretching6 | 3408.33 | 3392.90 | 3456.55 | 3421.83 |
| Functionality [Reference] | Wavenumber (cm−1) | ||||
|---|---|---|---|---|---|
| PANI | PANI/a-ZrO2 | PANI/t-ZrO2 | PANI/m-ZrO2 | PANI/tm-ZrO2 | |
| Zr–O bending vibration33 | — | 418.57; 457.14 | 420.50; 459.07; 472.58 | 422.42; 445.57; 468.72 | 418.57; 445.57; 457.14; 472.58 |
| Zr–O–Zr bond34 | — | 1031.95 | 1030.02 | 1031.95 | 1030.02 |
| C–S stretching of benzenoid ring11 | 665.46 | 663.53 | 682.82 | 667.39 | |
| Plane bending vibration of C–H11 | 798.56 | 798.56 | 796.63 | 798.56 | 798.56 |
| Absorption peak of N = Q = N13 | 1120.68 | 1120.68 | 1120.68 | — | 1120.68 |
| Stretching of C–N11,12 | 1244.13; 1298.14 | 1242.20; 1296.21 | 1240.27; 1294.28 | 1240.27; 1298.14 | 1242.20; 1298.14 |
| Stretching of quinoid ring11–13 | 1477.52 | 1479.45 | 1483.31 | 1469.81 | 1481.38 |
C![[double bond, length as m-dash]](https://www.rsc.org/images/entities/char_e001.gif) C ring-stretching vibration of benzenoid form11–13 C ring-stretching vibration of benzenoid form11–13 |
1523.82; 1550.82 | 1554.68 | 1539.25 | 1554.68 | 1545.03 |
| Plan deformation of –CH methylene group11 | 2922.25 | 2920.32 | 2924.18 | 2926.11 | 2922.25 |
| OH stretching6,35 | 3408.83 | 3448.84 | — | 3446.91 | 3506.70 |
3.3 Morphology
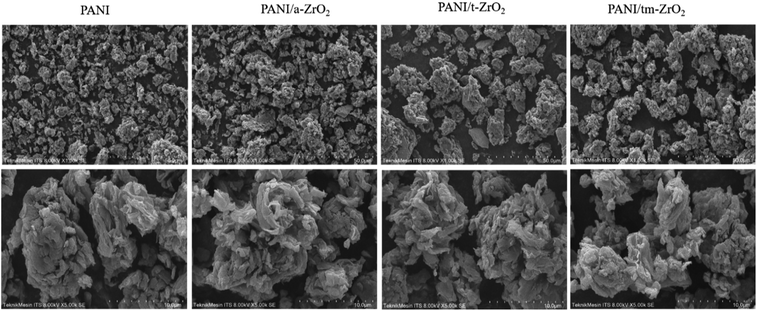
The morphology of PANI and PANI/ZrO2 were observed using SEM. Fig. 3 displays the SEM images of PANI and PANI/ZrO2 being magnified at 1000 times at the top and 5000 times at the bottom. Based on the SEM images, it is seen that PANI morphology forms an irregular shape. The establishment of PANI morphology depends on the synthesis method and the properties of the oxidant used.13 PANI in this research was synthesized using the in situ polymerisation method by using SDBS as a surfactant and HCl as oxidant. The morphology was in the shape of irregular structure, which was dissimilar to the results obtained by Anwer et al.26 where they also synthesized PANI by using in situ method with SSA surfactant.The morphology of the PANI/ZrO2 did not differ significantly with PANI, where the only difference being the semi-tubular structure formed was bigger. This indicates that PANI has covered the ZrO2 particles.
3.4 Impedance analysis
The bulk sample impedances were obtained from Electrochemical Impedance Spectroscopy (EIS) measurements. The impedance graphs of the complexes (real vs. imaginary impedance) or the Nyquist plots are displayed in Fig. 4. Fig. 4 exhibits that the composite with amorphous, tetragonal, and monoclinic ZrO2 filler have higher impedance compared to PANI. While the composite with multiphase filler (ZrO2, tetragonal, monoclinic, zircon) has much higher impedance compared to the other four samples.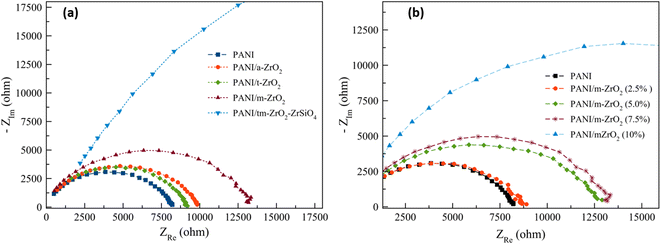 | ||
| Fig. 4 Impedance of PANI and PANI/ZrO2 complexes: (a) varied filler phase and (b) varied filler volume fractions. | ||
The effects of filler volume fractions towards the impedance are clearly noticed in Fig. 4b. The impedance value of the composite with 2.5% volume of ZrO2 is similar to that of PANI. There are also composites with 5.0% and 7.5% filler whose impedance values are similar to each other, although these values are larger compared to PANI and PANI/ZrO2 with 2.5% volume. The addition of filler volume fractions up to 10% shows a much increase in impedance compared to the other samples.
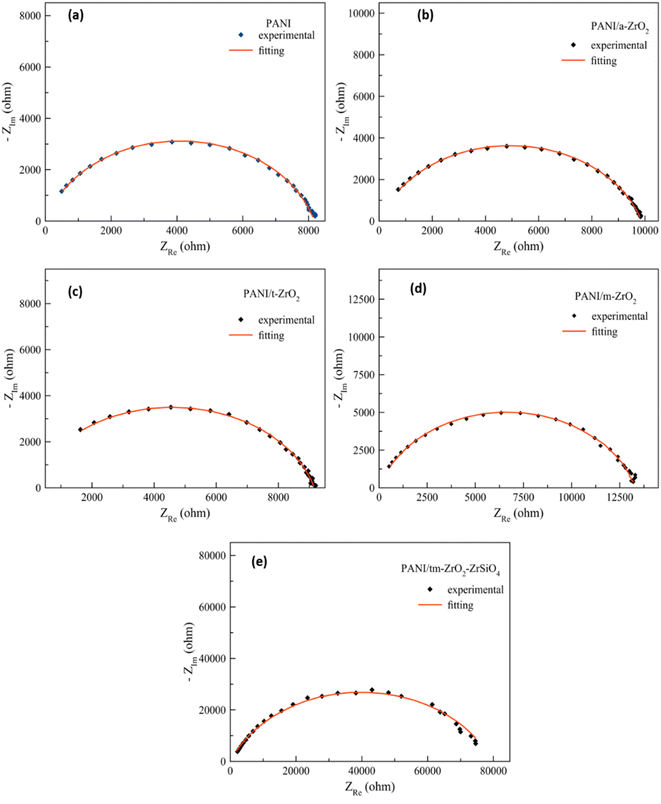 | ||
| Fig. 5 The results of fitting towards the impedance curve of the complexes: (a) PANI, (b) PANI/a-ZrO2, (c) PANI/t-ZrO2, (d) PANI/m-ZrO2, and (e) PANI/ZrO2–ZrSiO4. | ||
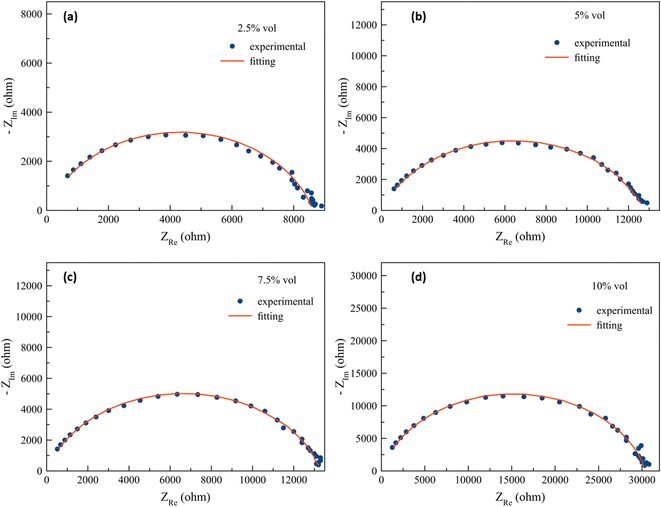 | ||
| Fig. 6 The fitting results of the impedance curves of the PANI/m-ZrO2 complex with: (a) 2.5% vol, (b) 5.0% vol, (c) 7.5% vol, and (d) 10% vol. | ||
| Sample | R (kΩ) | Q (Fsα−1) | α | GoF |
|---|---|---|---|---|
| PANI | 8.17 | 1.14 × 10⁻⁸ | 0.83 | 7.11 × 10⁻⁵ |
| PANI/a-ZrO2 | 9.87 | 1.15 × 10⁻⁸ | 0.81 | 5.50 × 10⁻⁵ |
| PANI/t-ZrO2 | 9.16 | 4.42 × 10⁻⁹ | 0.83 | 5.29 × 10⁻⁵ |
| PANI/m-ZrO2 (2.5%) | 8.63 | 1.19 × 10⁻⁸ | 0.81 | 2.75 × 10⁻⁴ |
| PANI/m-ZrO2 (5.0%) | 12.76 | 1.81 × 10⁻⁸ | 0.78 | 3.66 × 10⁻⁴ |
| PANI/m-ZrO2 (7.5%) | 13.31 | 1.07 × 10⁻⁸ | 0.82 | 2.05 × 10⁻⁴ |
| PANI/m-ZrO2 (10%) | 30.41 | 3.24 × 10⁻⁹ | 0.84 | 2.92 × 10⁻⁴ |
| PANI/tm-ZrO2 | 79.59 | 9.34 × 10⁻⁹ | 0.76 | 1.13 × 10⁻³ |
The CPE impedance can be calculated from eqn (1) as follows.
 | (1) |
 . Whereas α denotes a dimensionless number which is also known as a power number of CPE whose value is between 0 and 1 (0 < α < 1). The Q parameter refers to the magnitude of CPE and has a unit of (Fsα−1).29 The value of α in PANI, PANI/a-ZrO2, PANI/t-ZrO2 and PANI/m-ZrO2 are approximately 0.80, whereas in PANI/tm-ZrO2, it is 0.77. The CPE characteristic points out the unideal behaviour of the parallel plates capacitor or more widely known as capacitance frequency dispersion due to its dependency towards frequency. This behaviour appears as an effect of the varied current density and potential that passes through the electrode surface. The varied current density can be associated with the inhomogeneity of the electrode surface although not on the macroscopic level, for example, when being related to the surface roughness.30 The inhomogeneity is more related at the microscopic level, for example, being related to the crystal surface orientation on the surface of the electrodes and the inhomogeneity on the overall surface and the normal direction surface.31 The phenomenon of CPE on PANI dan PANI/ZrO2 can be related to the SEM data shown in Fig. 3 which shows the morphology in the irregular shapes.
 | (2) |
 | (3) |
Zr and Zi denotes the real and imaginary numbers, respectively, from the impedance complex, whereas ω is the angular frequency.
There is also C0 which denotes vacuum, which is obtained from eqn (4) as shown.
 | (4) |
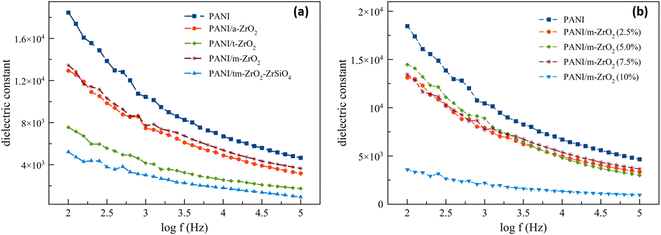
The dielectric constant curve depends on the frequency exhibited in Fig. 7. The dielectric constant values, both for PANI and its composites, lie in the range of >1000, and thus making it able to be categorised as a material with a high permittivity (high-k).36,37 The dielectric constants decrease with the increase of frequency for all the samples, including PANI and PANI/ZrO2. The effects of filler phase type towards the composite dielectric constant can be observed from Fig. 7a. All of the PANI/ZrO2 composites have dielectric constants of less than PANI. Out of all the PANI/ZrO2 composites, the material with monoclinic ZrO2 filler has the highest dielectric constant, whereas the material with a mixed filler of ZrO2–ZrSiO4 has the lowest dielectric constant. The effects of ZrO2 towards the dielectric constants of the composite materials can be viewed in Fig. 7b. The presence of ZrO2 decreases the dielectric constant of PANI. The composite with the filler of 2.5% up to 7.5% vol has similar dielectric constants, whereas at 10% vol has the lowest dielectric constants. The decrease in dielectric constants can be related to the relatively slow relaxation mechanism when compared to the resonant electronic transition or molecular vibrations. On this account, the polaron pinning at small distances through polymer chains would be very easy to carry out and would result in an increase in conductivity by increasing the frequency.38
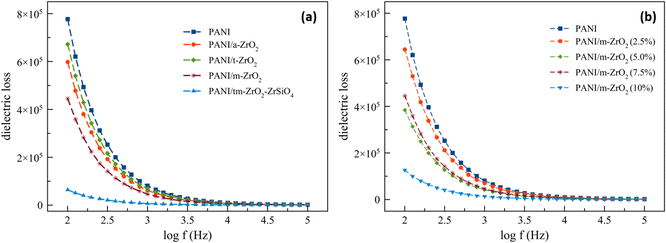
The dielectric losses depending on the frequency are all exhibited in Fig. 8. The dielectric losses also decreased with the increase in frequency. As with the dielectric constants, the presence of ZrO2 filler decreased the dielectric losses. On the contrary, the higher the ZrO2 filler contents in a material, the lower the dielectric losses. This phenomenon occurs because the dielectric constant and dielectric loss are more affected by the amorphous phase in the system.32 From Fig. 8, the composite with amorphous ZrO2 filler has lower dielectric loss than the composite with tetragonal zirconia filler. Fig. 7 and 8 show that the dielectric loss is more significant than the dielectric constant. Dielectric loss is affected by two things, namely, DC conductivity and dielectric polarization.32 It can be seen in Table 5 that the DC conductivity of PANI/tm-ZrO2 is the lowest, corresponding to the dielectric loss, which is also the lowest compared to the other samples.
 | (5) |
The AC conductivity however, is calculated from eqn (6) as follows.
| σac = ωε0ε′′ | (6) |
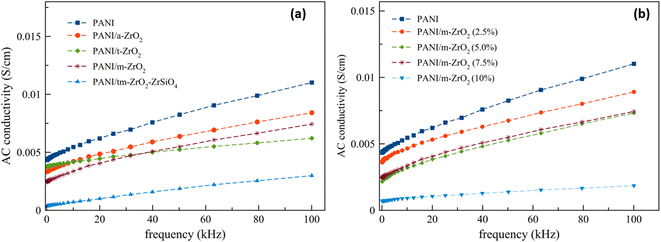
The AC conductivity as a function of frequency is presented in Fig. 9. From Fig. 9, it is seen that the presence of ZrO2 decreased the PANI conductivity. The comparison between the DC conductivity and AC conductivity at low frequencies are listed in Table 6.
| Sample | σdc (S m−1) | σac in low f (S m−1) |
|---|---|---|
| PANI | 4.35 × 10⁻³ | 4.34 × 10⁻³ |
| PANI/a-ZrO2 | 3.33 × 10⁻³ | 3.34 × 10⁻³ |
| PANI/t-ZrO2 | 3.77 × 10⁻³ | 3.75 × 10⁻³ |
| PANI/m-ZrO2 (2.5%) | 3.71 × 10⁻³ | 3.60 × 10⁻³ |
| PANI/m-ZrO2 (5.0%) | 2.17 × 10⁻³ | 2.14 × 10⁻³ |
| PANI/m-ZrO2 (7.5%) | 2.46 × 10⁻³ | 2.48 × 10⁻³ |
| PANI/m-ZrO2 (10%) | 7.05 × 10⁻⁴ | 7.06 × 10⁻⁴ |
| PANI/tm-ZrO2 | 3.35 × 10⁻⁴ | 3.58 × 10⁻⁴ |
The decrease in conductivity was possibly due to the presence of ZrO2 particles considering that ZrO2 is a ceramic material with insulator being one of their properties. At low frequencies, the conductivities decreased sequentially, starting from amorphous zirconia filler to tetragonal zirconia, monoclinic and zirconia fillers. There are materials with frequencies obtained at above 40 kHz, which are the tetragonal zirconia filler that has a conductivity below the composite with amorphous zirconia and monoclinic fillers. However, materials with tetragonal zirconia filler still have a higher conductivity when compared to composites with zirconia/zircon filler. The decrease in conductivity is due to the ceramic filler particles entering into the polymers, which is possibly caused by the presence of metal oxide particles that reduced the interconnections between the polymer chains, which in turned reduced the electrical transports.39
The results above show that the PANI/ZrO2 composite has electrical conductivity in the semiconductor range, a high dielectric constant, and the potential for application as an anticorrosive material. It is generally believed that conductive polymer coatings can protect metals by forming a physical barrier, inhibition and passive oxide layer.40 In addition, the PANI/ZrO2 composite has been known to have good thermal stability.41 Combining these two properties allows for applications such as corrosion protection at high temperatures.
4. Conclusions
PANI and PANI/ZrO2 composite polymorphisms have been successfully synthesized using the in situ polymerization method. The composite structures have been confirmed via the data obtained from XRD and FTIR. The morphology of PANI and PANI/ZrO2 polymorphisms were verified to be in the shape of semi-tubular. ZrO2 polymorphism as a filler affected the electrical properties of PANI/ZrO2 composite. The impedance of PANI/ZrO2 was found to be larger than PANI, where the largest impendance was produced by the multiphase filler (ZrO2–ZrSiO4). PANI and PANI/ZrO2 both have a high dielectric constants, thus both can be categorised as a material with a high permittivity (high-k). Despite being so, their dielectric constants and dielectric losses of PANI/ZrO2 were also found to be lower than PANI. The AC electricity conductivity of PANI/ZrO2 was also found lower compared to PANI.Besides from the phase, the filler composition also affected the electrical properties of PANI/ZrO2. The higher the filler percentage resulted in an increase in the impedance. The highest impedance obtained was at 10% volume of ZrO2. The increase in filler composition contributed to the decrease in dielectric constant and dielectric losses as well as the electrical conductivity when compared to PANI. PANI/ZrO2 composites have potential applications for corrosion protection at high temperatures.
Author contributions
Munaji: investigation, data curation, formal analysis, methodology, visualization, original writing draft. Mochamad Zainuri: conceptualization, supervision, methodology. Triwikantoro: conceptualization, supervision, writing – review & editing.Conflicts of interest
There are no conflicts to declare.Acknowledgements
This research has been funded by Doctoral Dissertation Reserarch funds (PDD), under the Ministry of Education, Culture, Research and Technology of Republic Indonesia of Government Decree No. 0267/E5/AK.04/2022 and Contract No. 1426/PKS/ITS/2022.References
- P. Sengupta, A. Bhattacharjee and H. S. Maiti, Zirconia: A Unique Multifunctional Ceramic Material, Trans. Indian Inst. Met., 2019, 72, 1981–1998 CrossRef CAS.
- M. Musyarofah, et al., Synthesis of high-purity zircon, zirconia, and silica nanopowders from local zircon sand, Ceram. Int., 2019, 45, 6639–6647 CrossRef.
- C. F. K. Murti, U. Maslakah, E. Endarko and T. Triwikantoro, Structural, physical and mechanical properties of zirconia-polymorph/alumina composites, Mater. Chem. Phys., 2022, 285, 126102 CrossRef CAS.
- R. Romero Pareja, R. López Ibáñez, F. Martín, J. R. Ramos-Barrado and D. Leinen, Corrosion behaviour of zirconia barrier coatings on galvanized steel, Surf. Coat. Technol., 2006, 200, 6606–6610 CrossRef CAS.
- J. H. Sui and W. Cai, Formation of ZrO2 coating on the NiTi alloys for improving their surface properties, Nucl. Instrum. Methods Phys. Res., Sect. B, 2006, 251, 402–406 CrossRef CAS.
- M. Menkuer and H. Ozkazanc, Anticorrosive polypyrrole/zirconium-oxide composite film prepared in oxalic acid and dodecylbenzene sulfonic acid mix electrolyte, Prog. Org. Coat., 2020, 147, 105815 CrossRef CAS.
- S. V. Harb, et al., A comparative study on PMMA-TiO2 and PMMA-ZrO2 protective coatings, Prog. Org. Coat., 2020, 140, 105477 CrossRef CAS.
- M. A. Reyes-Acosta, et al., Influence of ZrO2 nanoparticles and thermal treatment on the properties of PMMA/ZrO2 hybrid coatings, J. Alloys Compd., 2015, 643, S150–S158 CrossRef CAS.
- S. Devikala, P. Kamaraj and M. Arthanareeswari, Corrosion resistance behavior of PVDF/ZrO2 composite in 3.5% NaCl, Mater. Today: Proc., 2019, 14, 279–287 CAS.
- G. K. Sidhu, N. Kumar & R. Kumar Study the structural and optical behaviour of polyaniline/ZrO2 nanocomposites, in AIP Conference Proceedings, American Institute of Physics Inc., 2018, vol. 1953 Search PubMed.
- T. Anwer, M. O. Ansari and F. Mohammad, Dodecylbenzenesulfonic acid micelles assisted in situ preparation and enhanced thermoelectric performance of semiconducting polyaniline-zirconium oxide nanocomposites, J. Ind. Eng. Chem., 2013, 19, 1653–1658 CrossRef CAS.
- B. P. Prasanna, et al., Synthesis of polyaniline/ZrO2 nanocomposites and their performance in AC conductivity and electrochemical supercapacitance, Bull. Mater. Sci., 2016, 39, 667–675 CrossRef CAS.
- D. Zhao, X. Liu, Z. Li and X. Bai, Effect of emulsion polymerisation conditions on electrical performance of polyaniline, Pigm. Resin Technol., 2011, 40, 84–90 CrossRef CAS.
- Y. Kriswandono, M. Munaji and T. Triwikantoro, Electrical Conductivity of SDBS-Assisted Polyaniline Doped with HCl, Mater. Sci. Forum, 2022, 1057, 26–31 Search PubMed.
- L. Shao, J. W. Jeon and J. L. Lutkenhaus, Polyaniline nanofiber/vanadium pentoxide sprayed layer-by-layer electrodes for energy storage, J. Mater. Chem. A, 2014, 2, 14421–14428 RSC.
- M. H. Bai, T. Y. Liu, F. Luan, Y. Li and X. X. Liu, Electrodeposition of vanadium oxide-polyaniline composite nanowire electrodes for high energy density supercapacitors, J. Mater. Chem. A, 2014, 2, 10882–10888 RSC.
- S. Bai, Y. Ma, R. Luo, A. Chen and D. Li, Room temperature triethylamine sensing properties of polyaniline-WO3 nanocomposites with p–n heterojunctions, RSC Adv., 2016, 6, 2687–2694 RSC.
- D. Hidalgo, S. Bocchini, M. Fontana, G. Saracco and S. Hernández, Green and low-cost synthesis of PANI-TiO2 nanocomposite mesoporous films for photoelectrochemical water splitting, RSC Adv., 2015, 5, 49429–49438 RSC.
- N. Singh, et al., Development of a potential LPG sensor based on a PANI-Co3O4 nanocomposite that functions at room temperature, New J. Chem., 2019, 43, 17340–17350 RSC.
- Z. Durmus, A. Baykal, H. Kavas and H. Szeri, Preparation and characterization of polyaniline (PANI)Mn3O4 nanocomposite, Phys. B, 2011, 406, 1114–1120 CrossRef CAS.
- B. N. Grgur, et al., Corrosion of mild steel with composite polyaniline coatings using different formulations, Prog. Org. Coat., 2015, 79, 17–24 CrossRef CAS.
- S. Shi, Z. Zhang and L. Yu, Hydrophobic polyaniline/modified SiO2 coatings for anticorrosion protection, Synth. Met., 2017, 233, 94–100 CrossRef CAS.
- W. F. Huang, et al., Super-hydrophobic polyaniline-TiO2 hierarchical nanocomposite as anticorrosion coating, Mater. Lett., 2020, 258, 126822 CrossRef.
- F. C. P. Masim, et al., Synergistic effect of PANI–ZrO2 composite as antibacterial, anti-corrosion, and phosphate adsorbent material: synthesis, characterization and applications, Environ. Technol., 2019, 40, 226–238 CrossRef CAS PubMed.
- M. V. Carević, et al., Properties of Zirconia/Polyaniline hybrid nanocomposites and their application as photocatalysts for degradation of model pollutants, Mater. Chem. Phys., 2018, 205, 130–137 CrossRef.
- T. Anwer, M. O. Ansari and F. Mohammad, Morphology and Thermal Stability of Electrically Conducting Nanocomposites Prepared by Sulfosalicylic Acid Micelles Assisted Polymerization of Aniline in Presence of ZrO2 Nanoparticles, Polym.-Plast. Technol. Eng., 2013, 52, 472–477 CrossRef CAS.
- H. Huang, Z. C. Guo, W. Zhu and F. C. Li, Preparation and characterization of conductive polyaniline/zirconia nanoparticles composites, Adv. Mater. Res., 2011, 221, 302–307 CAS.
- S. M. Rezaei Niya and M. Hoorfar, On a possible physical origin of the constant phase element, Electrochim. Acta, 2016, 188, 98–102 CrossRef CAS.
- R. Srinivasan & F. Fasmin, An Introduction to Electrochemical Impedance Spectroscopy, CRC Press, 2021 Search PubMed.
- Z. Kerner and T. Pajkossy, On the origin of capacitance dispersion of rough electrodes, Electrochim. Acta, 2000, 46, 207–211 CrossRef CAS.
- B. Hirschorn, et al., Determination of effective capacitance and film thickness from constant-phase-element parameters, Electrochim. Acta, 2010, 55, 6218–6227 CrossRef CAS.
- M. B. Ahmed, et al., The study of ion transport parameters associated with dissociated cation using EIS model in solid polymer electrolytes (SPEs) based on PVA host polymer: XRD, FTIR, and dielectric properties, Arabian J. Chem., 2022, 15, 104196 CrossRef CAS.
- N. Nadliriyah, A. L. Putri & T. Triwikantoro PANi/ZrO2-composite coating for corrosion protection in 3.5 M NaCl solution. in IOP Conference Series: Materials Science and Engineering, Institute of Physics Publishing, 2019, vol. 496 Search PubMed.
- M. Guo, et al., Preparation of Nano-ZrO2 powder via a microwave-assisted hydrothermal method, Ceram. Int., 2021, 47, 12425–12432 CrossRef CAS.
- T. Velempini, E. Prabakaran and K. Pillay, Photocatalytic reductive applications of C-doped ZrO2/PANI composite towards Cr(VI), J. Photochem. Photobiol., A, 2022, 426, 113737 CrossRef CAS.
- Z. M. Dang, et al., Fundamentals, processes and applications of high-permittivity polymer-matrix composites, Prog. Mater. Sci., 2012, 57, 660–723 CrossRef CAS.
- S. Jiang, L. Jin, H. Hou & L. Zhang Polymer-based nanocomposites with high dielectric permittivity, Polymer-Based Multifunctional Nanocomposites and Their Applications, Elsevier Inc., 2018, DOI:10.1016/B978-0-12-815067-2.00008-1.
- R. Patil, A. S. Roy, K. R. Anilkumar, K. M. Jadhav and S. Ekhelikar, Dielectric relaxation and ac conductivity of polyaniline-zinc ferrite composite, Composites, Part B, 2012, 43, 3406–3411 CrossRef CAS.
- I. Bekri-Abbes and E. Srasra, Characterization and AC conductivity of polyaniline-montmorillonite nanocomposites synthesized by mechanical/chemical reaction, React. Funct. Polym., 2010, 70, 11–18 CrossRef CAS.
- H. Xu and Y. Zhang, A review on conducting polymers and nanopolymer composite coatings for steel corrosion protection, Coatings, 2019, 9, 1–22 Search PubMed.
- S. Wang, Z. Tan, Y. Li, L. Sun and T. Zhang, Synthesis, characterization and thermal analysis of polyaniline/ZrO 2 composites, Thermochim. Acta, 2006, 441, 191–194 CrossRef CAS.
| This journal is © The Royal Society of Chemistry 2023 |

